
 Submit a Paper
 Propose a Special lssue
 Open Access
ARTICLE

Does the Depression, Anxiety, and Stress Scales–Youth Version (DASS-Y) Remain Consistent Across Time and Diverse School-Aged Youth?
1 School of Economics, Management, Humanities and Law, Shandong Institute of Petroleum and Chemical Technology, Dongying, China
2 Faculty of Education, Qufu Normal University, Qufu, China
3 School of Foreign Languages, Shandong Women’s University, Jinan, China
4 Faculty of Education, Jiangxi Science and Technology Normal University, Nanchang, China
5 Yangan Primary School of Qionglai City, Qionglai, China
6 Psychology Department, Nottingham Trent University, Nottingham, UK
7 Chinese Academy of Education Big Data, Qufu Normal University, Qufu, China
8 Institute of Allied Health Sciences, College of Medicine, National Cheng Kung University, Tainan, Taiwan
9 Biostatistics Consulting Center, National Cheng Kung University Hospital, College of Medicine, National Cheng Kung University, Tainan, Taiwan
* Corresponding Authors: I-Hua Chen. Email: ; Chung-Ying Lin. Email:
(This article belongs to the Special Issue: Research on the Role of Schools in Promoting Adolescent Mental Heatlh: Prevention, Assessment and Interventions)
International Journal of Mental Health Promotion 2026, 28(3), 7 https://doi.org/10.32604/ijmhp.2026.075149
Received 26 October 2025; Accepted 12 February 2026; Issue published 31 March 2026
 View Full Text
 Download PDF
Abstract
Background: The recently developed Depression, Anxiety, and Stress Scales–Youth Version (DASS-Y) shows promise as a tool for assessing youth mental health, but its consistency across timepoints and diverse ages remains underexplored. The present study evaluated whether the DASS-Y reliably measured depression, anxiety, and stress among school-aged youth (aged 9–18 years) across distinct time periods and educational stages. Methods: Two studies were conducted. Study 1 examined consistency over three months using data from 736 Central Chinese high school students who completed surveys at both timepoints. Study 2 tested consistency across educational levels among 2321 primary and 1676 middle school students. Traditional confirmatory factor analysis (CFA), exploratory structural equation modeling (ESEM), and Rasch analysis were employed to assess the scale’s construct validity and measurement invariance. Results: Rasch analysis indicated acceptable DASS-Y item fit (infit/outfit statistics = 0.50–1.50) and moderate test-retest reliability (ICCs = 0.64–0.69). The ESEM approach demonstrated superior model fit compared to CFA, achieving a good RMSEA (0.056–0.062) and lower latent factor correlations (r = 0.40–0.60), supporting longitudinal scalar invariance. Across educational levels, measurement invariance was supported, with only a small number of items exhibiting differential item functioning (DIF). Conclusion: The present study demonstrates that the DASS-Y is a reliable tool for assessing emotional health among non-clinical school-aged youth, offering educators a validated measure to monitor psychological well-being across developmental stages and time, thereby informing strategies to support youth mental health in community and educational settings. Future research among clinical populations is needed to extend its utility for diagnostic purposes.Keywords
Supplementary Material
Supplementary Material FileChildren and adolescents face numerous mental health challenges stemming from factors such as academic pressure, peer relationships, and family dynamics [1]. Many contemporary studies of mental health issues among minors rely on scales developed for adult populations, which may not be suitable for younger individuals due to differences in cognitive development and emotional expression [2]. Consequently, there is a pressing need to develop and validate assessment tools tailored to the unique characteristics of children and adolescents [3]. In response to this need, Szabo and Lovibond recently developed the Depression Anxiety Stress Scale for Youth (DASS-Y) [4]. The DASS-Y offers several unique advantages over other adolescent-specific measures. It provides comprehensive assessment of three distinct constructs (depression, anxiety, and stress) using relatively few items (n = 21) compared to the 47-item Revised Child Anxiety and Depression Scale (RCADS) [5], and unlike clinically-oriented screening tools such as the Patient Health Questionnaire for Adolescents (PHQ-A) [6], it is particularly suitable for assessing emotional distress in general adolescent populations through its dimensional approach to symptom measurement.
Despite these advantages, and although validation studies for the DASS-Y have been conducted across different cultural contexts (e.g., Chinese [7,8], Indonesian [9], and Iranian [10]), important psychometric questions remain unaddressed. More specifically, the factor structure of the scale warrants further investigation to determine whether alternative models might provide a better fit than the conventional oblique three-factor structure demonstrated in the adult DASS version [11]. Additionally, the measurement invariance of the DASS-Y has not been adequately examined across time (longitudinal invariance) or across different developmental stages within youth populations (e.g., between primary and middle school students).
To address these gaps, the present study examined competing factor structures of the DASS-Y to identify the most representative model, test measurement invariance across time to establish the scale’s temporal stability, and investigate measurement invariance across different age groups to ensure valid comparisons between developmental stages. The present study sought to provide preliminary evidence of temporal stability and developmental equivalence, thereby establishing a foundation for using the DASS-Y in longitudinal research and cross-developmental comparisons.
1.1 DASS-Y Development and Validation among Adolescent Populations
The DASS-Y is explicitly designed for children and adolescents, maintaining the same structure as the original DASS [12] but incorporating developmentally appropriate items that are more comprehensible to younger individuals [7]. Validating the DASS-Y in general school-based populations is methodologically essential because the majority of adolescents experiencing psychological distress are found in community settings rather than clinical services, with 54% of those needing mental health support never receiving treatment [13]. Such normative samples capture a more representative spectrum of adolescent distress, including subclinical symptoms that are nonetheless associated with functional impairment and increased risk for later psychiatric disorders [14], while providing the essential baseline against which clinical elevations can be meaningfully interpreted [15].
The DASS-Y assesses symptom severity on continuous scales, providing both dimensional scores and severity categories (normal, mild, moderate, severe, extremely severe) based on established cut-offs [4]. Unlike diagnostic instruments that determine the presence or absence of specific disorders, the DASS-Y quantifies the degree of symptoms along continua, making it particularly suitable for detecting varying levels of distress, from subclinical manifestations to severe symptomatology, among general adolescent populations. [4]. This aligns with contemporary prevention and early intervention frameworks that prioritize identifying at-risk youth in accessible community settings before clinical presentation [16]. Therefore, validating the DASS-Y among normative samples not only supports the scale’s use in broad-based research and early identification efforts but also establishes the necessary psychometric groundwork for future clinical validation studies [7].
Consistent with this rationale, recent validation studies of the DASS-Y across diverse cultural contexts (including Chinese [7,8], Indonesian [9], Iranian [10], Arabic [17], Polish [18], Serbian [19], and Turkish [20] populations) have all employed school-based, non-clinical samples. These studies have consistently confirmed the oblique three-factor structure using confirmatory factor analysis (CFA), reinforcing that establishing psychometric properties among general adolescent populations is the appropriate first step in scale validation. However, these studies have predominantly relied on classical CFA approaches, which impose strict zero cross-loadings between factors, potentially overlooking the nuanced relationships among depression, anxiety, and stress symptoms that are known to overlap among adolescent populations [7]. Notably, the Arabic version of the DASS-Y demonstrated inter-factor correlations exceeding 0.90 among depression, anxiety, and stress dimensions when using oblique CFA among Lebanese adolescents [17], raising concerns about the discriminant validity of the scale. This finding highlights a broader methodological concern: while CFA models across these validation studies have yielded acceptable fit indices, the rigid requirement of zero cross-loadings in traditional CFA may be inappropriate for capturing the inherently overlapping nature of depression, anxiety, and stress symptoms among adolescents. Alternative analytical approaches that allow for cross-loadings between factors may better represent the complex and overlapping symptom presentations characteristic of adolescent populations. Such approaches could potentially provide more accurate psychometric foundations for the scale.
1.2 The Case for Exploratory Structural Equation Modeling in DASS Research
Building on the methodological concerns about traditional CFA’s rigid zero cross-loadings when capturing symptom overlap among depression, anxiety, and stress (as highlighted in recent DASS-Y validations), Exploratory Structural Equation Modeling (ESEM) offers a more flexible alternative. By permitting items to load on multiple factors, ESEM directly models this theoretical overlap, providing a realistic framework for elucidating the internal structure of the DASS [11,21,22,23].
Recent studies comparing CFA and ESEM approaches for the DASS-21 have demonstrated that ESEM models yield superior fit indices and more accurately represent the scale’s factor structure [11]. More specifically, ESEM permits significant cross-loadings that reflect real-world symptom overlap, particularly between anxiety and stress factors [21]. Extensive research on the adult DASS-21 has further confirmed that ESEM provides better model fit compared to traditional CFA, particularly in addressing high inter-factor correlations and cross-loadings [21,24]. However, despite this robust evidence base among adult populations, the application of ESEM to the youth version remains surprisingly scarce. This methodological gap is particularly concerning given that symptom overlap may be even more pronounced among adolescents than in adults. Therefore, applying ESEM in the present study addresses a critical need in DASS-Y validation, ensuring a robust foundation for all subsequent invariance tests.
1.3 Measurement Invariance across Time and Different Age Groups
Beyond identifying a robust factor structure (whether through traditional CFA or more flexible approaches like ESEM), ensuring the DASS-Y’s measurement properties remain stable across repeated assessments and developmental subgroups is crucial for its reliable application in youth mental health research. However, critical gaps persist in the DASS-Y literature regarding invariance across time and different youth populations. These gaps are particularly pronounced given the scale’s formal development and validation in 2022 and its still-emerging psychometric evidence base. Two primary invariance issues require urgent attention.
The first pertains to longitudinal invariance: the stability of measurement properties over time. Establishing temporal stability is essential for longitudinal studies and intervention programs because it ensures that observed changes reflect genuine variations in constructs rather than measurement artifacts [25]. While limited research has examined longitudinal invariance in the adult DASS-21 [26,27], no studies have investigated this property in the youth version. This gap directly impacts the scale’s utility for tracking developmental trajectories and evaluating intervention effectiveness. Without established longitudinal invariance, researchers cannot confidently interpret changes in depression, anxiety, and stress scores over time, undermining the DASS-Y’s potential for monitoring youth mental health.
The second gap involves measurement equivalence across different developmental stages within youth populations. Although Cao et al. [7] used Rasch analysis to identify differential item functioning in specific DASS-Y items, comprehensive testing of measurement invariance at the model level remains absent from the literature. This limitation is particularly problematic given the substantial cognitive and emotional differences between primary and middle school students. Establishing measurement invariance across these groups is essential for valid between-group comparisons and for understanding how depression, anxiety, and stress manifest differently across developmental stages. Without this evidence, researchers risk making biased comparisons or misinterpreting developmental differences as substantive when they may actually reflect measurement artifacts.
Despite its advantages, the DASS-Y, as a relatively new scale, still warrants thorough examination of its factor structure and invariance properties. To address the critical gaps identified in DASS-Y validation, two complementary studies were conducted examining both invariance properties and construct validity. Study 1 assessed longitudinal invariance among senior high school students over a three-month period, providing essential evidence of temporal stability for confident interpretation of change scores in longitudinal research and intervention evaluations. Study 2 investigated measurement invariance across different educational levels by comparing primary and middle school students, to ensure valid cross-group comparisons and to establish the scale’s applicability across developmental stages. Beyond testing invariance properties, both studies evaluated the DASS-Y’s construct validity through Rasch analysis for item-level validity and compared competing factor structures using both traditional CFA and ESEM approaches. Particular focus was placed on whether ESEM would better represent the factor structure, given its documented superiority in capturing symptom overlap in adult DASS research. The findings from these investigations will provide crucial evidence regarding the DASS-Y’s psychometric robustness, temporal stability, and developmental appropriateness. Ultimately, the study aims to strengthen the empirical foundation for using the DASS-Y in early detection, prevention, and intervention initiatives targeting youth mental health across diverse educational settings.
2.1.1 Participants and Procedure
Study 1 investigated the longitudinal invariance of the DASS-Y through a two-phase online survey. Participants were senior high school students recruited from two public schools (approximately 5000 students in total) located in the capital city of a province in Central China. As a typical inland provincial capital, the city’s level of economic development falls within the middle to slightly below-middle range among major Chinese cities (generally referring to provincial capitals and municipalities directly under the central government) [28]. The student population primarily comes from urban and suburban households in the local area, representing the common composition of public schools in similar regional central cities across China. Following approval from school principals, teachers assisted with participant recruitment and informed parents about the study’s purpose, data confidentiality measures, and students’ right to withdraw. Students whose parents provided consent then completed the online survey in school computer labs during lunch breaks. The first phase (Time 1) was conducted from September 8–17, 2023, with 1031 Grade 11 students participating. The follow-up survey (Time 2) was conducted three months later (November 10–14, 2023), with 736 students completing both waves, yielding a retention rate of 71.39% (attrition rate: 28.61%).
The final sample of 736 students demonstrated an equal gender distribution (50% male, 50% female), closely matching official statistics for Grade 11 students in mainland China (50.90% male, 49.10% female) [29], supporting the representativeness of the sample. To assess potential attrition bias, demographic characteristics were compared across both timepoints. At Time 1, the sample comprised 50.0% females and 94.1% had siblings; at Time 2, the retained sample was 50.3% female and 95.1% had siblings. Similar demographic distributions between waves, combined with Little’s Missing Completely at Random (MCAR) test on the DASS-Y items (χ2 = 27.49, df = 21, p = 0.155), indicated that participant attrition was random rather than systematic. The online survey platform ensured data completeness by requiring all items to be answered before submission. Ethical approval was obtained from the Institutional Review Board (IRB) of the Jiangxi Psychological Consultant Association (IRB reference: JXSXL-2022-CL15).
The DASS-Y [4] (the simplified Chinese version, which was previously published [7]) consists of three subscales (depression, anxiety, and stress), each comprising seven items. All items in the DASS-Y are scored using a four-point Likert scale, ranging from 0 (not true of you) to 3 (very true of you), with higher scores indicating more severe psychological distress. The DASS-Y’s validity has been confirmed among samples of children and adolescents in Australia and China [4,7,30].
In Study 1, the simplified Chinese adaptation of the DASS-Y was administered. The instrument showed excellent internal reliability, indicated by high McDonald’s ω values. More specifically, at Time 1, the ω values were 0.94, 0.93, and 0.89 for depression, anxiety, and stress scales, respectively. At Time 2, the ω values increased slightly to 0.96 for depression, 0.95 for anxiety, and 0.92 for stress, demonstrating consistent and robust internal reliability of the DASS-Y across both assessment points.
The data were analyzed using Jamovi (version 2.6.44). Analysis in Study 1 began with descriptive statistics and inter-item Pearson correlations, followed by an assessment of test-retest reliability using Intraclass Correlation Coefficients [ICCs; specifically, ICC (3, k)] and Bland-Altman plots to evaluate absolute agreement, with systematic bias (mean difference ± 1.96 SD) tested for statistical significance. Following multiple established guidelines, ICC values were interpreted as follows: values below 0.50 indicate poor reliability; 0.50 to 0.75 indicate moderate reliability; 0.75 to 0.90 indicate good reliability; and above 0.90 indicate excellent reliability [31]. Alternatively, values below 0.40 indicate poor reliability; 0.40 to 0.59 indicate fair reliability; 0.60 to 0.74 indicate good reliability; and above 0.75 indicate excellent reliability [32]. In the present study, ICC values above 0.60 were considered acceptable for test-retest reliability.
Rasch analysis was subsequently conducted to assess item validity. The unidimensionality assumption, a prerequisite for Rasch analysis, was examined using eigenvalue ratios. According to Slocum-Gori et al. [33], a first-to-second eigenvalue ratio exceeding 4 indicates unidimensionality. Results confirmed ratios surpassing this threshold for all three subscales at both timepoints, supporting the unidimensionality assumption. Item fit was evaluated by examining infit and outfit mean square (MnSq) statistics, with values between 0.5 and 1.5 deemed acceptable [34].
Subsequent to the Rasch analysis, traditional CFA and ESEM were applied to evaluate the model fit of the DASS-Y at each timepoint, followed by longitudinal measurement invariance testing. Multiple factor structures were examined to determine the best-fitting model, including a unidimensional (one-factor) model, an oblique three-factor model, and an ESEM approach. Model fit was assessed using a comprehensive set of indices, specifically the Comparative Fit Index (CFI), Non-Normed Fit Index (NNFI), Root Mean Square Error of Approximation (RMSEA), and Standardized Root Mean Square Residual (SRMR). Following established recommendations [22,23], ESEM was employed not only to evaluate overall model fit but also to investigate correlations among latent variables and compare factor correlations between traditional oblique CFA and ESEM models. Notably, employing a bifactor model for effective evaluation of measurement invariance is both rare and lacks comprehensive guidelines, as highlighted by Neufeld et al. [35]. Additionally, due to estimation issues noted by Stenling et al. [36], the bifactor model and the bifactor ESEM for testing the longitudinal invariance of the DASS-Y were not considered.
In addition to global fit indices, item-level performance within both the traditional oblique CFA and ESEM frameworks was evaluated following established interpretive guidelines. For the traditional oblique CFA model, factor loadings of 0.50 or above were considered acceptable indicators of their intended constructs [37]. For the ESEM model, a more nuanced evaluation was required because cross-loadings are theoretically expected and do not necessarily indicate poor item performance [38]. Rather than applying a single threshold (e.g., 0.40), the tiered criteria recommended by Morin et al. was adopted [39], which account for the inherent complexity of ESEM solutions. First, target factor loadings were examined: loadings greater than 0.50 were considered fully satisfactory, loadings between 0.30 and 0.50 were deemed acceptable but warranting attention in future psychometric studies, and loadings below 0.30 called into question the adequacy of the indicator.
Second, cross-loadings were evaluated in relation to target loadings. Given that cross-loadings can be either positive or negative, absolute values were used for interpretation. Cross-loadings with absolute values below 0.30 were considered negligible, while those exceeding 0.40 warranted closer examination. Critically, even when cross-loadings were theoretically meaningful (reflecting the expected symptom overlap among depression, anxiety, and stress), the absolute value of a cross-loading should remain lower than the target loading, with a difference of at least 0.10 (ideally 0.20) to ensure clear factor interpretation. Items were retained if they met two joint criteria: (i) exhibited a target loading of at least 0.50 (fully satisfactory) or between 0.30 and 0.50 with theoretical justification, and (ii) demonstrated clear differentiation from non-target factors (i.e., target loading exceeding any cross-loading by at least 0.10). Items failing to meet these criteria or showing poor fit in the Rasch analysis were considered for exclusion.
For the invariance testing, three nested models were compared to determine if the DASS-Y satisfied the criteria for longitudinal measurement invariance. The changes in CFI (ΔCFI), RMSEA (ΔRMSEA), and SRMR (ΔSRMR) were employed to evaluate whether the DASS-Y maintained measurement equivalence across different timepoints, using the thresholds suggested by Chen [40]. The Differential Item Functioning (DIF) contrast was utilized to detect potential variations in item functioning across different timepoints, with values exceeding 0.50 considered indicative of significant DIF.
Descriptive statistics showed that DASS-Y item mean scores ranged from 0.38 (Item 4) to 0.97 (Item 8) at Time 1, and from 0.45 (Item 4) to 0.98 (Item 8) at Time 2 (Tables S1 and S2). The items with the highest and lowest scores remained consistent across both timepoints. Inter-item correlations were significant, with Pearson’s r-values ranging from 0.23 to 0.90 at Time 1 (Table S1) and from 0.38 to 0.87 at Time 2 (Table S2).
Test-retest reliability for the overall DASS-Y scale and its three subscales was evaluated using ICC (3, k). The ICC for the full scale was 0.69, while the depression, anxiety, and stress subscales yielded values of 0.67, 0.65, and 0.64, respectively. Agreement between timepoints was further assessed using Bland-Altman plots (Fig. 1, Fig. 2, Fig. 3 and Fig. 4). The analyses showed minimal systematic bias across all measures, with mean differences of 1.20 (full scale), 1.20 (depression), 1.90 (anxiety), and 0.15 (stress). These biases were not statistically significant. Collectively, these results indicated acceptable test-retest reliability because all ICC values exceeded the predetermined threshold of 0.60 and the Bland-Altman plots demonstrated consistent agreement.
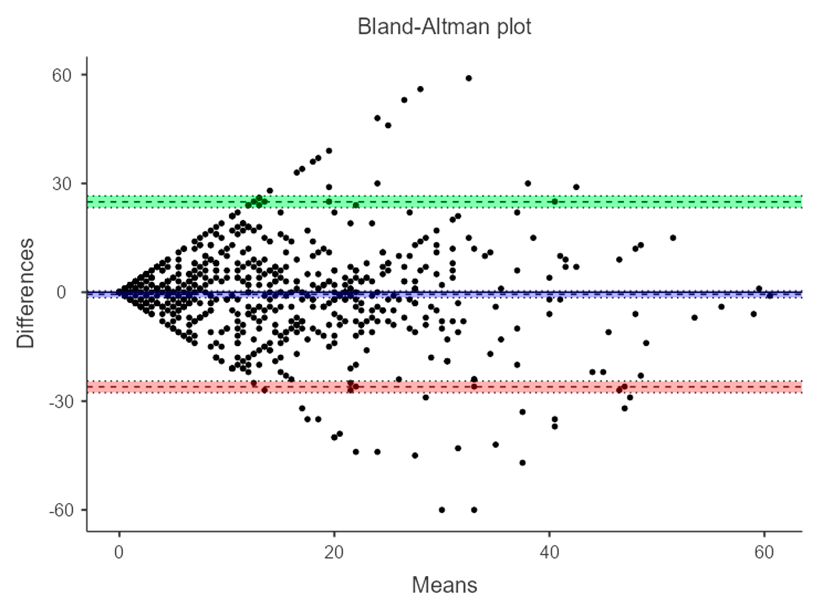
Figure 1: Bland-Altman plot of general distress (DASS-21 total score) at Time 1 and Time 2.
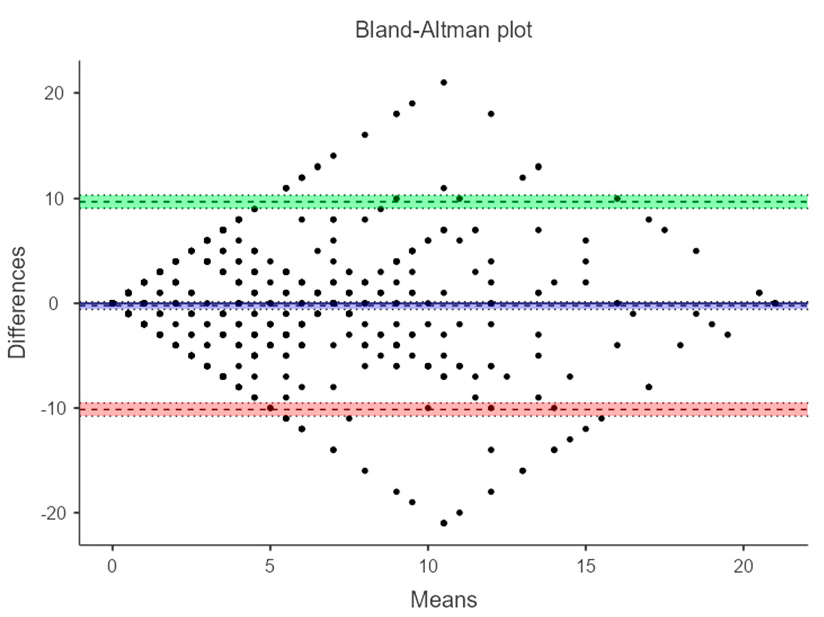
Figure 2: Bland-Altman plot of depression subscale scores at Time 1 and Time 2.
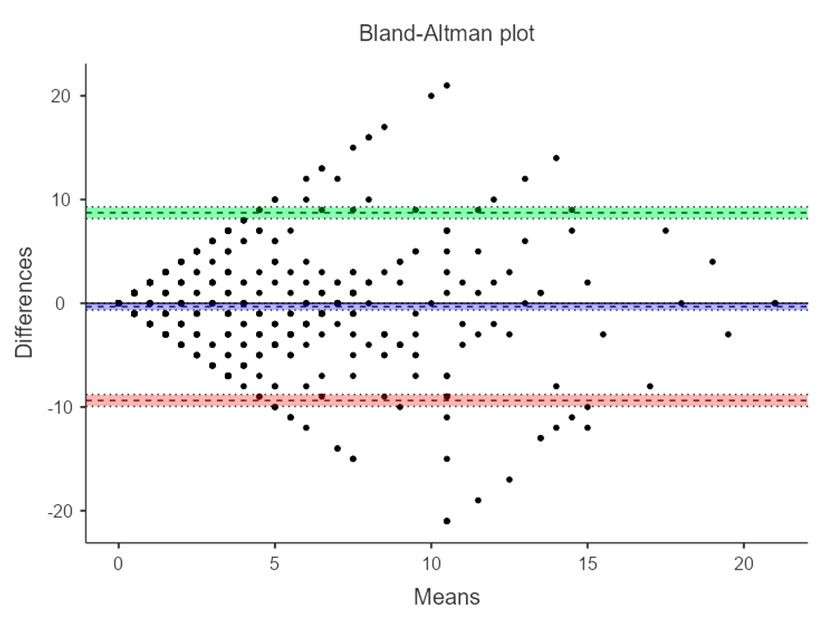
Figure 3: Bland-Altman plot of anxiety subscale scores at Time 1 and Time 2.
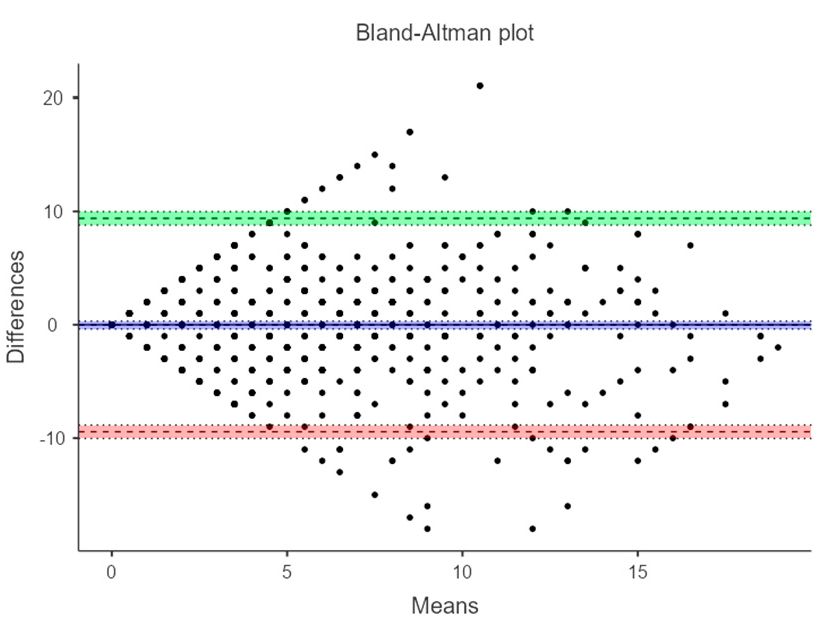
Figure 4: Bland-Altman plot of stress subscale scores at Time 1 and Time 2.
Infit and outfit statistics obtained in the Rasch analysis demonstrated satisfactory item validity for all DASS-Y items, with values falling within the acceptable range of 0.50 to 1.50 (Table 1). These results indicated that all items contributed meaningfully to the measurement and no items required removal. Moreover, person separation reliability coefficients were calculated for each subscale at both timepoints. For the depression subscale, reliability values were 0.79 and 0.82 at Time 1 and Time 2, respectively. The anxiety subscale had reliability values of 0.68 and 0.74, while the stress subscale had coefficients of 0.81 and 0.83 at Time 1 and Time 2, respectively.
Table 1: Fit statistics of Rasch analysis for the DASS-Y Items at Time 1 and Time 2 in Study 1 (n = 736).
| Item | Time 1 | Time 2 | ||||||
|---|---|---|---|---|---|---|---|---|
| Difficulty | Point-Biserial | Infit MnSq | Outfit MnSq | Difficulty | Point-Biserial | Infit MnSq | Outfit MnSq | |
| Depression subscale | ||||||||
| Item 3: Felt joyless. | 0.41 | 0.81 | 1.04 | 1.00 | 0.39 | 0.88 | 0.85 | 0.83 |
| Item 5: Despised life | −0.17 | 0.85 | 0.96 | 0.93 | −0.41 | 0.88 | 0.98 | 0.95 |
| Item 10: Lacked anticipation | −0.13 | 0.80 | 1.20 | 1.25 | 0.15 | 0.86 | 1.12 | 1.07 |
| Item 13: Persistently sad | 0.10 | 0.83 | 0.86 | 0.84 | −0.02 | 0.86 | 1.16 | 1.19 |
| Item 16: Self-loathing | 0.00 | 0.82 | 1.05 | 0.99 | 0.00 | 0.88 | 0.88 | 0.84 |
| Item 17: Felt worthless | 0.00 | 0.82 | 1.10 | 1.08 | 0.15 | 0.87 | 0.99 | 0.93 |
| Item 21: Life seemed bleak | −0.20 | 0.87 | 0.78 | 0.77 | −0.26 | 0.89 | 0.96 | 0.92 |
| Anxiety subscale | ||||||||
| Item 2: Dry sensation in my mouth | 0.09 | 0.76 | 1.13 | 1.31 | 0.39 | 0.82 | 1.16 | 1.10 |
| Item 4: Encountered respiratory challenges | 0.45 | 0.75 | 1.06 | 1.15 | 0.43 | 0.84 | 0.94 | 0.95 |
| Item 7: Experienced trembling | 0.48 | 0.76 | 1.08 | 1.20 | 0.34 | 0.80 | 1.33 | 1.35 |
| Item 9: Concerned about panic moments and embarrassing myself | −0.42 | 0.83 | 0.96 | 0.90 | −0.32 | 0.87 | 0.89 | 0.83 |
| Item 15: Sensation of near panic | −0.54 | 0.84 | 0.97 | 0.95 | −0.67 | 0.86 | 1.07 | 1.06 |
| Item 19: Conscious of the beat of my heart | 0.19 | 0.80 | 1.01 | 1.01 | −0.12 | 0.86 | 0.88 | 0.91 |
| Item 20: Felt uneasy without cause | −0.24 | 0.83 | 0.77 | 0.76 | −0.06 | 0.88 | 0.73 | 0.73 |
| Stress subscale | ||||||||
| Item 1: Difficult to decompress | 0.02 | 0.78 | 0.84 | 0.83 | 0.18 | 0.81 | 0.92 | 0.93 |
| Item 6: Tended to over-react | 0.26 | 0.73 | 0.98 | 1.04 | 0.62 | 0.78 | 1.03 | 1.00 |
| Item 8: Expending considerable anxious energy | −0.47 | 0.82 | 0.80 | 0.77 | −0.61 | 0.84 | 0.83 | 0.80 |
| Item 11: Getting agitated | 0.39 | 0.73 | 0.94 | 0.88 | 0.76 | 0.76 | 1.08 | 1.06 |
| Item 12: Difficult to relax | 0.22 | 0.70 | 1.22 | 1.21 | −0.14 | 0.76 | 1.27 | 1.22 |
| Item 14: Intolerant of anything | 0.03 | 0.67 | 1.41 | 1.41 | −0.22 | 0.75 | 1.25 | 1.26 |
| Item 18: Felt rather touchy | −0.45 | 0.82 | 0.79 | 0.78 | −0.60 | 0.86 | 0.71 | 0.70 |
Prior to longitudinal measurement invariance assessment, model evaluation was conducted using WLSMV (weighted least squares mean and variance adjusted) estimation, appropriate for the ordinal nature of the four-point Likert response format. The one-factor model yielded acceptable CFI, NNFI, and SRMR values but inadequate RMSEA values exceeding 0.10 at both timepoints (0.108 and 0.112, respectively), indicating poor model fit. The oblique three-factor CFA model yielded acceptable values for CFI, NNFI, and SRMR. However, RMSEA values exceeded the 0.08 threshold at both timepoints (0.085 and 0.084, respectively), indicating inadequate model fit (Table 2). Moreover, latent factor correlations in the three-factor CFA model were excessively high (ranging from 0.78 to 0.90), raising concerns about discriminant validity among the depression, anxiety, and stress dimensions. Conversely, the ESEM model demonstrated good fit across all indices, with RMSEA values well below the recommended threshold (0.056 and 0.062). Crucially, the ESEM model yielded substantially lower latent factor correlations (ranging from 0.40 to 0.60), indicating adequate discriminant validity while acknowledging the theoretically expected overlap among negative affectivity constructs.
Further evaluation of factor loadings under the ESEM framework indicated that all items met the pre-specified retention criteria [39]. More specifically, target factor loadings (see Table S3) were fully satisfactory, consistently exceeding the 0.50 threshold. At Time 1, target loadings ranged from 0.60 to 0.82 for depression, 0.50 to 0.78 for anxiety, and 0.51 to 0.81 for stress. At Time 2, target loadings ranged from 0.70 to 0.92 for depression, 0.54 to 0.82 for anxiety, and 0.50 to 0.83 for stress. Regarding cross-loadings, no item exhibited absolute values exceeding 0.30, indicating negligible associations with non-target factors. Moreover, the differences between target loadings and the absolute values of cross-loadings were consistently greater than 0.20, supporting clear factor differentiation. The overall loading patterns were consistent with the intended three-factor structure, demonstrating adequate construct specificity despite the symptom overlap inherently captured by ESEM. Consequently, no items were excluded based on factor loading performance.
Table 2: Comparison of model fit indices for different factor structures at two timepoints (n = 736).
| Model | χ2 (df) | CFI | NNFI | RMSEA (90% CI) | SRMR | Latent Factor Correlations | ||
|---|---|---|---|---|---|---|---|---|
| D-A | D-S | A-S | ||||||
| One-factor | 1817.01 (189) | 0.923 | 0.915 | 0.108 (0.098, 0.119) | 0.065 | Not applicable | ||
| 1938.74 (189) | 0.934 | 0.927 | 0.112 (0.100, 0.125) | 0.055 | ||||
| Three-factor | 1053.28 (186) | 0.959 | 0.954 | 0.085 (0.069, 0.090) | 0.049 | 0.88 | 0.85 | 0.78 |
| 1148.97 (186) | 0.964 | 0.959 | 0.084 (0.071, 0.098) | 0.040 | 0.90 | 0.88 | 0.85 | |
| ESEM | 500.51 (150) | 0.984 | 0.977 | 0.056 (0.041, 0.073) | 0.028 | 0.58 | 0.58 | 0.40 |
| 574.47 (150) | 0.984 | 0.978 | 0.062 (0.043, 0.082) | 0.024 | 0.60 | 0.60 | 0.53 | |
Longitudinal measurement invariance was subsequently tested following a sequential constraint approach. The baseline model (configural invariance) allowed item errors to correlate across the two timepoints. Progressively restrictive constraints were then imposed, including equal factor loadings (metric invariance) and equal item intercepts (scalar invariance). Model comparison results are presented in Table 3. The ESEM approach satisfied the criteria for both metric and scalar invariance, thereby establishing longitudinal measurement invariance. Moreover, DIF contrast analysis yielded no values exceeding 0.50 (item difficulties are reported in Table 1), corroborating the longitudinal measurement invariance of the DASS-Y and affirming consistent item functioning across timepoints.
Table 3: Comparison of model fit indices for different factor structures at two timepoints (n = 736).
| Model | χ2 | df | Comparison | Δχ2 | Δdf | p-Value | CFI | ΔCFI | RMSEA | ΔRMSEA | SRMR | ΔSRMR |
|---|---|---|---|---|---|---|---|---|---|---|---|---|
| M0 | 1326.99 | 711 | <0.001 | 0.991 | 0.034 | 0.026 | ||||||
| M1 | 1393.96 | 768 | M1–M0 | 66.97 | 57 | <0.001 | 0.991 | 0 | 0.033 | −0.001 | 0.033 | 0.007 |
| M2 | 1435.39 | 786 | M2–M1 | 41.43 | 18 | <0.001 | 0.991 | 0 | 0.034 | 0.001 | 0.033 | 0 |
3.1.1 Participants and Procedure
Convenience sampling was employed in Study 2, initiated through personal invitations to school principals. Three primary schools (approximately 1800 students in total) located in a city in Southwest China and three middle schools (approximately 4500 students in total) located in two cities in central and southwest China agreed to participate. All participating schools were public institutions within urban districts. Notably, the central city’s level of economic development falls within the middle to slightly below-middle range among major Chinese cities, while the southwestern city exhibits a relatively high level of economic development among major Chinese cities [28]. The student participants were predominantly from local urban households, reflecting the typical intake of these city-based public schools. With the support of school principals, an online survey was administered between December 2022 and December 2023. This process replicated the procedures from Study 1, including obtaining parental consent and having students complete the survey in school computer laboratories under supervision. The same IRB reference number was used as in Study 1.
The sample comprised 2321 primary school students (49.98% female, 50.02% male) and 1676 middle school students (46.96% female, 53.04% male). Both samples closely matched the gender distribution of the broader Chinese student population in their respective age groups, with the primary school population comprising 47.02% females and 52.98% males [41], and the middle school population comprising 46.58% females and 53.42% males [42], supporting the representativeness of the samples. Among primary school students, 65.6% had siblings (n = 1522), with grade distribution as follows: Grade 4 (n = 722, 31.1%), Grade 5 (n = 817, 35.2%), and Grade 6 (n = 782, 33.7%). Among middle school students, 83.6% had siblings (n = 1401), with grade distribution as follows: Grade 7 (n = 550, 32.8%), Grade 8 (n = 561, 33.5%), and Grade 9 (n = 565, 33.7%).
Consistent with Study 1, the simplified Chinese version of the DASS-Y was utilized in Study 2. The instrument maintained robust internal reliability across different educational levels. The depression subscale demonstrated very good internal consistency, with McDonald’s ω values of 0.88 and 0.87 for primary and middle school students, respectively. Similarly, the anxiety subscale exhibited excellent internal consistency, with ω coefficients of 0.88 and 0.84 for primary and middle school students, respectively. The stress subscale also demonstrated very good internal consistency, with ω values of 0.89 and 0.88 for primary and middle school students, respectively.
The data were analyzed using Jamovi (version 2.6.44). Study 2 expanded the investigation of the DASS-Y’s psychometric properties across different educational levels, beginning with a comprehensive analysis using descriptive statistics and Pearson correlations. To examine the DASS-Y’s measurement equivalence across educational levels, both Rasch analysis and ESEM were employed. Rasch analysis was used to scrutinize item validity and evaluate item consistency across primary and middle school students through DIF contrast. Building on Study 1’s findings demonstrating ESEM’s superiority over traditional CFA, ESEM was applied to verify model fit for both primary and middle school students, and then measurement invariance was tested across these groups using this confirmed structure.
The DASS-Y scores varied between primary and middle school students. Primary school students’ mean scores ranged from 0.11 (Item 2 and Item 4) to 0.41 (Item 11), while middle school students’ scores ranged from 0.25 (Item 4) to 0.86 (Item 1). Significant correlations were observed across items, with Pearson’s r-values ranging from 0.27 to 0.68 among primary school students, and from 0.25 to 0.67 among middle school students (Tables S4 and S5).
Rasch analysis showed that all items had acceptable validity with infit/outfit values in satisfactory ranges (Table 4). Person separation reliability was acceptable, with values exceeding 0.50. More specifically, in the depression subscale, person separation reliability was 0.59 for primary school students and 0.69 for middle school students; for anxiety, it was 0.55 and 0.56, respectively; for stress, it was 0.69 and 0.76, respectively.
Table 4: Fit statistics of Rasch analysis for the DASS-Y Items among middle and primary school students in Study 2.
| Item | Middle School Students (n = 1676) | Primary School Students (n = 2321) | ||||||
|---|---|---|---|---|---|---|---|---|
| Difficulty | Point-Biserial | Infit MnSq | Outfit MnSq | Difficulty | Point-Biserial | Infit MnSq | Outfit MnSq | |
| Depression subscale | ||||||||
| Item 3: Felt joyless | 0.66 | 0.62 | 1.11 | 1.22 | 0.42 | 0.68 | 0.96 | 0.99 |
| Item 5: Despised life | −0.16 | 0.76 | 1.02 | 1.02 | −0.68 | 0.74 | 1.31 | 1.36 |
| Item 10: Lacked anticipation | −0.23 | 0.66 | 1.27 | 1.36 | −0.15 | 0.68 | 1.26 | 1.35 |
| Item 13: Persistently sad | 0.02 | 0.74 | 0.93 | 0.95 | 0.13 | 0.73 | 0.95 | 0.96 |
| Item 16: Self-loathing | 0.32 | 0.73 | 0.89 | 0.83 | 0.09 | 0.72 | 0.90 | 0.86 |
| Item 17: Felt worthless | −0.42 | 0.76 | 0.95 | 0.95 | 0.10 | 0.75 | 0.83 | 0.86 |
| Item 21: Life seemed bleak | −0.18 | 0.79 | 0.84 | 0.84 | 0.08 | 0.77 | 0.78 | 0.78 |
| Anxiety subscale | ||||||||
| Item 2: Dry sensation in my mouth | 0.56 | 0.61 | 1.08 | 1.17 | 0.29 | 0.67 | 1.00 | 1.11 |
| Item 4: Encountered respiratory challenges | 0.40 | 0.61 | 1.01 | 1.02 | 0.46 | 0.67 | 0.91 | 0.95 |
| Item 7: Experienced trembling | −0.10 | 0.67 | 1.06 | 1.07 | 0.17 | 0.69 | 1.05 | 1.08 |
| Item 9: Concerned about panic moments and embarrassing myself | −0.26 | 0.74 | 0.89 | 0.84 | −0.23 | 0.79 | 0.96 | 0.93 |
| Item 15: Sensation of near panic | −0.44 | 0.73 | 0.98 | 0.96 | 0.03 | 0.76 | 0.96 | 0.94 |
| Item 19: Conscious of the beat of my heart | −0.21 | 0.71 | 1.06 | 1.07 | −0.22 | 0.75 | 1.05 | 1.10 |
| Item 20: Felt uneasy without cause | 0.04 | 0.67 | 0.92 | 0.90 | −0.49 | 0.77 | 1.05 | 1.05 |
| Stress subscale | ||||||||
| Item 1: Difficult to decompress | −0.45 | 0.78 | 0.96 | 0.97 | −0.08 | 0.78 | 1.02 | 0.99 |
| Item 6: Tended to over-react | 0.25 | 0.73 | 0.94 | 0.95 | 0.25 | 0.75 | 0.95 | 0.95 |
| Item 8: Expending considerable anxious energy | −0.09 | 0.77 | 0.89 | 0.89 | 0.19 | 0.76 | 0.95 | 0.89 |
| Item 11: Getting agitated | 0.06 | 0.72 | 1.02 | 1.00 | −0.56 | 0.78 | 1.14 | 1.15 |
| Item 12: Difficult to relax | 0.48 | 0.65 | 1.15 | 1.17 | 0.42 | 0.68 | 1.01 | 0.93 |
| Item 14: Intolerant of anything | −0.01 | 0.67 | 1.26 | 1.33 | −0.36 | 0.75 | 1.18 | 1.20 |
| Item 18: Felt rather touchy | −0.24 | 0.79 | 0.80 | 0.78 | 0.14 | 0.80 | 0.75 | 0.70 |
Following the confirmation of item validity, ESEM demonstrated good factorial validity for both primary school (χ2 (150) = 398.14, CFI = 0.989, NNFI = 0.985, RMSEA = 0.027, and SRMR = 0.023) and middle school (χ2 (150) = 477.79, CFI = 0.989, NNFI = 0.984, RMSEA = 0.036, and SRMR = 0.025) samples. To complement the model-level evaluation, DIF contrast analysis from the Rasch framework was employed to examine item-level measurement equivalence across educational levels. This analysis showed that only a few items in each subscale exhibited substantial DIF. More specifically, Items 5 and 17 in the depression subscale, Item 20 in the anxiety subscale, and Item 11 in the stress subscale demonstrated notable DIF (see Table 4 for details). Partial invariance testing was subsequently conducted after removing items exhibiting DIF. Table 5 presents the results of these partial invariance examinations, which supported that the scale achieved scalar invariance at the measurement model level.
Table 5: Fit Indices for measurement invariance testing across middle and primary school students after removing items exhibiting differential item functioning.
| Model | χ2 | df | Comparison | Δχ2 | Δdf | p-Value | CFI | ΔCFI | RMSEA | ΔRMSEA | SRMR | ΔSRMR |
|---|---|---|---|---|---|---|---|---|---|---|---|---|
| M0 | 892.21 | 300 | <0.001 | 0.989 | 0.031 | 0.024 | ||||||
| M1 | 1003.09 | 354 | M1–M0 | 110.88 | 54 | <0.001 | 0.988 | −0.001 | 0.030 | −0.001 | 0.033 | 0.009 |
| M2 | 1342.32 | 372 | M2–M1 | 339.23 | 18 | <0.001 | 0.981 | −0.007 | 0.036 | 0.006 | 0.036 | 0.003 |
Despite the DASS-Y’s increasing use across diverse cultural contexts, two critical gaps had remained unaddressed: the lack of evidence regarding measurement invariance across time and developmental stages, and uncertainty about whether traditional CFA adequately captures the scale’s factor structure given the inherent overlap among depression, anxiety, and stress symptoms in youth. The present study addressed these issues through two complementary investigations. By integrating longitudinal and cross-group invariance tests within the more flexible ESEM framework, the present study provided crucial evidence for the scale’s robustness and addressed a key theoretical controversy regarding its factor structure. Study 1 established longitudinal invariance over a three-month period among senior high school students, while Study 2 demonstrated measurement invariance across primary and middle school populations. Notably, ESEM provided a superior fit compared to traditional CFA and addressed the excessive inter-factor correlations observed in the oblique three-factor model. Within this ESEM framework, the DASS-Y demonstrated robust measurement invariance both across time and between different age groups, supporting its use for tracking changes in youth mental health and making valid comparisons across developmental stages.
4.1 Factor Structure and Reliability
Establishing the internal factor structure is a foundational step in validating any newly developed scale. According to standard scale validation procedures [15], confirming the dimensional structure of the DASS-Y must precede tests of the convergent validity with established diagnostic instruments (e.g., RCADS, PHQ-A), as this ensures that subsequent correlations can be meaningfully interpreted. The superiority of ESEM over traditional CFA warrants particular attention because it addresses a fundamental methodological issue in DASS research. While the unidimensional model’s poor fit was expected, given that it inappropriately treats depression, anxiety, and stress as a single undifferentiated construct, the three-factor CFA model’s inadequate fit warrants deeper consideration. Despite correctly specifying three distinct factors, the traditional CFA model failed to achieve acceptable fit indices, likely due to its unrealistic constraint of zero cross-loadings. This constraint is particularly problematic for depression, anxiety, and stress, which share overlapping symptoms both theoretically and clinically [43,44,45].
When items that naturally have secondary associations with related constructs are forced to load on only one factor, the model compensates by inflating inter-factor correlations, leading to both poor model fit and excessively high correlations [22,23], such as the 0.90 correlation between depression and anxiety at Time 2 in the present study—a pattern consistently observed in previous DASS-Y validation studies [17]. By permitting items to load freely on multiple factors, ESEM allows these natural cross-loadings to be explicitly modeled rather than forcing them into the error terms or inflating factor correlations [46]. Notably, the oblique three-factor structure yielded high correlations (ranging from 0.78 to 0.90), with depression-anxiety reaching 0.90 at Time 2. Though partially attributable to the unrealistic factor structure constraints discussed above, these high correlations exceed those reported in most other countries [9,10,18,19,20], potentially reflecting unique contextual factors in China.
Within China’s intensely competitive academic environment, the pervasive emphasis on scholastic achievement often functions as a diffuse stressor that simultaneously elicits worry about the future, feelings of inadequacy, and general tension, resulting in the frequent co-occurrence of these emotional states [47]. Moreover, traditional collectivist norms that promote emotional restraint may lead to psychological distress being expressed primarily through somatic complaints or interpersonal difficulties, rather than through differentiated emotional symptoms [48]. Future studies should continue to examine the DASS-Y across diverse cultural contexts to determine whether these high inter-factor correlations represent a culturally-specific pattern or a more universal characteristic of youth emotional distress that emerges when appropriate statistical methods are applied.
Test-retest reliability in the present study was moderate (ICCs = 0.64–0.69). To examine the score instability suggested by these ICC values, Bland-Altman analyses were conducted. The results showed no statistically significant systematic bias across all dimensions. This indicates that the observed score fluctuations were more likely attributable to the random variation inherent in emotional states or to measurement error, rather than to a fixed, directional flaw in the scale itself. Therefore, the measurement process can be considered stable. The interpretation of this reliability as moderate and acceptable is supported by converging evidence. A meta-analysis integrating test-retest correlations across multiple psychological constructs, such as personality traits, self-esteem, and subjective well-being, indicated that negative affect is inherently variable, therefore justifying ICCs below 0.70 for its measurement [49]. As indicated by widely used psychometric evaluation guidelines, ICC values within the range of 0.60 to 0.74 can be considered “good” [32]. Moreover, compared to the lower reliability estimates (ICCs = 0.54–0.58) reported in prior validation studies of the DASS-Y [20], the present findings not only fell within but were even slightly better than the instrument’s expected performance range. This further supports that the DASS-Y demonstrates acceptable test-retest reliability for use with senior high school students.
4.2 Analysis and Interpretation of DIF
The present study examined measurement invariance between primary and middle school student groups. Through Rasch analysis, four items (Items 5, 17, 20, and 11) exhibiting DIF were identified, distributed across three subscales. To assess measurement invariance while accounting for these DIF items, partial invariance testing was conducted after removing these items. The results showed that the remaining items achieved scalar invariance at the measurement model level, supporting the scale’s use for cross-educational-stage comparisons through a partial invariance approach. Based on current evidence, no item revisions are required, as the detected DIF is limited to a small number of items. Collectively, these findings support that the DASS-Y exhibits adequate measurement equivalence between primary and middle school student groups.
While the partial invariance results support the scale’s use for cross-group comparisons, the DIF patterns themselves can be systematically interpreted from a cognitive developmental perspective. The DIF analysis shows how items occupy different relative positions within each group’s construct hierarchy. Within primary school students’ depression hierarchy, Item 5 (“Despised life”) functioned as one of the more accessible depression indicators (difficulty = −0.68) compared to other depression items such as “Felt worthless” (−0.42), “Self-loathing” (0.09), or “Lacked anticipation” (−0.13). This item’s relatively low difficulty position may reflect that “Despised life” is a global, dramatic phrase that concrete-operational thinkers can readily adopt as an emotional expression without grasping its existential implications [50,51]. In contrast, items requiring self-evaluation (“Felt worthless”, “Self-loathing”) or future-oriented cognition (“Lacked anticipation”) demand more abstract thinking and therefore occupy higher positions within primary students’ depression hierarchy. However, within middle school students’ depression hierarchy, “Despised life” occupies a middle position (−0.16) similar to other items because adolescents’ formal operational thinking allows them to understand its deeper meaning, making it no longer function as an easily-accessible expression but rather as a genuine indicator of moderate depression [52]. Similarly, within the anxiety subscale, Item 20 (“Felt uneasy without cause”) was more accessible within primary students’ hierarchy because identifying causeless anxiety requires less metacognitive awareness than recognizing specific panic sensations (Item 15) or respiratory challenges (Item 4), consistent with younger children’s tendency toward diffuse somatic complaints [53]. These findings suggest items requiring less abstract reasoning function as early indicators within younger children’s symptom hierarchies.
4.3 Theoretical and Practical Implications
The present findings carry several theoretical implications for understanding emotional distress among youth. First, the superiority of ESEM over traditional CFA reinforces the theoretical position that depression, anxiety, and stress among adolescents are inherently overlapping constructs rather than discrete entities [43,44,45]. This supports a dimensional conceptualization of youth emotional distress, wherein these negative affective states share common underlying processes while retaining distinct features. Second, the established measurement invariance across time and developmental stages suggests that the latent constructs assessed by the DASS-Y remain conceptually stable throughout adolescence, despite surface-level differences in item endorsement patterns showed by DIF analysis. This provides empirical support for viewing depression, anxiety, and stress as developmentally continuous constructs that can be meaningfully compared across different age groups.
From a practical perspective, these findings have important implications for youth mental health assessment in educational and clinical settings. The demonstrated longitudinal invariance enables practitioners to use the DASS-Y for tracking changes in emotional distress over time, supporting its application in monitoring intervention effectiveness and developmental trajectories. The established measurement equivalence across primary and middle school students allows for valid screening and comparison across educational stages, facilitating early identification of at-risk youth before symptoms escalate. Moreover, the scale’s robust psychometric properties across diverse Chinese adolescent samples support its use in school-based mental health programs, where efficient and reliable assessment instruments are essential for large-scale screening and prevention efforts [16]. Collectively, these findings establish a solid foundation for using the DASS-Y in both research and applied contexts targeting youth mental health across developmental stages.
4.4 Limitations and Future Directions
Although the present study yielded meaningful findings, several limitations warrant consideration. First, while the demographic characteristics of the sample (e.g., gender ratio) aligned with the general profile of Chinese students, and detailed information on the geographical regions, school types (public, urban), and the socioeconomic profiles of the sampled cities were provided, the omission of students from rural areas and private educational institutions may limit the ability to fully capture the socioeconomic, regional, and cultural diversity of Chinese youth. Future research should employ probability sampling strategies to enhance sample representativeness. Second, the extended data collection period in Study 2 (nearly one year) may have introduced temporal confounds across grade groups because students were assessed at different points in the academic year. Fluctuations in academic demands, seasonal stressors (e.g., exam periods), and school-related events could have systematically influenced reported levels of depression, anxiety, and stress. Consequently, observed differences between primary and middle school students, while tested for measurement invariance, might partially reflect these transient contextual factors rather than purely developmental differences. Future multi-wave studies with synchronized data collection points across groups, or studies controlling for academic calendar events, would help disentangle developmental trends from situational influences.
Third, although clarifying the internal factor structure through ESEM represents a crucial foundational step in scale validation, the absence of convergent validity testing with established self-report measures (e.g., RCADS) and criterion validity testing against gold-standard clinical diagnoses represents a significant limitation. Without such evidence, the interpretation of DASS-Y scores remains limited to the scale’s internal structure rather than its relationship to the broader nomological network of youth psychopathology. It must therefore be emphasized that the present findings do not support the use of the DASS-Y for clinical screening or diagnosis. Future research should prioritize examining these forms of validity to complete the validation process.
Fourth, the study’s exclusive focus on non-clinical samples excluded youth with diagnosed psychiatric conditions, limiting understanding of the scale’s performance in clinical populations. Although establishing validity in non-clinical adolescents and school children is a crucial first step, future research should recruit participants with confirmed mental health diagnoses to evaluate the DASS-Y’s diagnostic utility and clinical sensitivity. Finally, given the excessively high inter-factor correlations observed among the Chinese participants, which may reflect culture-specific patterns of emotional expression, the generalizability of these findings to adolescent populations in other cultural contexts remains uncertain. Therefore, caution is warranted when applying the DASS-Y in cross-cultural settings without additional validation.
Despite the DASS-Y’s increasing use across diverse cultural contexts, evidence for its temporal stability and measurement equivalence across developmental stages had remained absent. The present two-study investigation addressed these gaps by applying ESEM to examine longitudinal invariance among senior high school students and cross-educational-stage invariance between primary and middle school populations. The most significant finding challenges conventional analytic approaches: traditional CFA produced excessively high inter-factor correlations that threatened discriminant validity, whereas ESEM demonstrated that depression, anxiety, and stress among adolescents are best conceptualized as inherently overlapping dimensions rather than artificially discrete constructs. Within this framework, the DASS-Y exhibited robust measurement invariance both across time and across developmental stages, confirming that the underlying latent constructs remain stable and comparable from primary school through high school. The DIF analysis further showed that items requiring less abstract reasoning function as more accessible indicators within younger children’s symptom hierarchies, illustrating how emotional distress manifests through developmentally appropriate cognitive expressions while the underlying constructs maintain equivalence. This developmental insight establishes the DASS-Y as a valid tool for tracking emotional trajectories and making cross-age comparisons during the critical period when academic pressures and social transitions place youth at heightened risk for psychological difficulties.
Acknowledgement:
Funding Statement: The study was supported by a special grant from the Taishan Scholars Project (Project No. tsqn202211130).
Author Contributions: The authors confirm contribution to the paper as follows: Conceptualization, Xu Wang, Cui-Hong Cao and I-Hua Chen; methodology, Cui-Hong Cao and Xiao-Ling Liao; formal analysis and investigation, Xing-Yong Jiang and I-Hua Chen; writing—original draft preparation, Xu Wang and I-Hua Chen; writing—review and editing, Mark D. Griffiths and Chung-Ying Lin; funding acquisition, I-Hua Chen; resources, Xiao-Ling Liao and Xing-Yong Jiang; supervision, I-Hua Chen and Chung-Ying Lin. All authors reviewed and approved the final version of the manuscript.
Availability of Data and Materials: The datasets used during the current study are available from the corresponding authors upon reasonable request.
Ethics Approval: Ethical approval was obtained from the Institutional Review Board (IRB) of the Jiangxi Psychological Consultant Association (IRB reference: JXSXL-2022-CL15). Because the present study involved human participants and was conducted within Jiangxi Province, the IRB of this association, the recognized and competent ethics oversight body for such research within this jurisdiction, reviewed and approved it. Informed consent to participate was obtained from the parents of any participant under the age of 18 years.
Conflicts of Interest: The authors declare no conflicts of interest.
Supplementary Materials: The supplementary material is available online at https://www.techscience.com/doi/10.32604/ijmhp.2026.075149/s1.
References
1. Liang S , Zeng Q . Factors affecting children’s mental health during the coronavirus disease 2019 pandemic. JAMA Pediatr. 2021; 175( 3): 319– 20. doi:10.1001/jamapediatrics.2020.4933. [Google Scholar] [CrossRef]
2. Fowler S , Szabó M . The emotional experience associated with worrying in adolescents. J Psychopathol Behav Assess. 2013; 35( 1): 65– 75. doi:10.1007/s10862-012-9316-3. [Google Scholar] [CrossRef]
3. Livheim F , Tengström A , Bond FW , Andersson G , Dahl J , Rosendahl I . Psychometric properties of the Avoidance and Fusion Questionnaire for Youth: A psychological measure of psychological inflexibility in youth. J Context Behav Sci. 2016; 5( 2): 103– 10. doi:10.1016/j.jcbs.2016.04.001. [Google Scholar] [CrossRef]
4. Szabo M , Lovibond PF . Development and psychometric properties of the DASS-Youth (DASS-Y): An extension of the Depression Anxiety Stress Scales (DASS) to adolescents and children. Front Psychol. 2022; 13: 766890. doi:10.3389/fpsyg.2022.766890. [Google Scholar] [CrossRef]
5. Chorpita BF , Yim L , Moffitt C , Umemoto LA , Francis SE . Assessment of symptoms of DSM-IV anxiety and depression in children: A revised child anxiety and depression scale. Behav Res Ther. 2000; 38( 8): 835– 55. doi:10.1016/s0005-7967(99)00130-8. [Google Scholar] [CrossRef]
6. Johnson JG , Harris ES , Spitzer RL , Williams JBW . The Patient Health Questionnaire for Adolescents: Validation of an instrument for the assessment of mental disorders among adolescent primary care patients. J Adolesc Health. 2002; 30( 3): 196– 204. doi:10.1016/s1054-139x(01)00333-0. [Google Scholar] [CrossRef]
7. Cao CH , Liao XL , Gamble JH , Li LL , Jiang XY , Li XD , et al. Evaluating the psychometric properties of the Chinese Depression Anxiety Stress Scale for Youth (DASS-Y) and DASS-21. Child Adolesc Psychiatry Ment Health. 2023; 17( 1): 106. doi:10.1186/s13034-023-00655-2. [Google Scholar] [CrossRef]
8. Jiang J , Chen J , Lin Z , Tang X , Hu Z . Validation and psychometric properties of the Depression Anxiety Stress Scale for Youth in Chinese adolescents. Front Psychol. 2024; 15: 1466426. doi:10.3389/fpsyg.2024.1466426. [Google Scholar] [CrossRef]
9. Sarfika R , Malini H , Wicaksana AL , Wenny BP , Saifudin IMMY . Cross cultural adaptation and psychometric evaluation of the Indonesian version of the Depression Anxiety Stress Scales for Youth (IDASS-Y). Heliyon. 2024; 10( 19): e38830. doi:10.1016/j.heliyon.2024.e38830. [Google Scholar] [CrossRef]
10. Shabani MJ , Gharraee B , Zahedi Tajrishi K . Exploring the psychometric properties of the Persian Depression Anxiety Stress Scale for Youth (DASS-Y): Factor structure and reliability in Iranian children and adolescents. Front Psychol. 2025; 15: 1452878. doi:10.3389/fpsyg.2024.1452878. [Google Scholar] [CrossRef]
11. Zhou XH , Shen ZZ , Cao CH , Liao XL , Jiang XY , Griffiths MD , et al. Psychometric evaluation of DASS versions among Spanish and Chinese teachers using exploratory structural equation modeling (ESEM). Acta Psychol. 2024; 251: 104626. doi:10.1016/j.actpsy.2024.104626. [Google Scholar] [CrossRef]
12. Lovibond PF , Lovibond SH . The structure of negative emotional states: Comparison of the Depression Anxiety Stress Scales (DASS) with the Beck Depression and Anxiety Inventories. Behav Res Ther. 1995; 33( 3): 335– 43. doi:10.1016/0005-7967(94)00075-u. [Google Scholar] [CrossRef]
13. Ghafari M , Nadi T , Bahadivand-Chegini S , Doosti-Irani A . Global prevalence of unmet need for mental health care among adolescents: A systematic review and meta-analysis. Arch Psychiatr Nurs. 2022; 36: 1– 6. doi:10.1016/j.apnu.2021.10.008. [Google Scholar] [CrossRef]
14. Schmitt JC , Valiente RM , García-Escalera J , Arnáez S , Espinosa V , Sandín B , et al. Prevention of depression and anxiety in subclinical adolescents: Effects of a transdiagnostic Internet-delivered CBT program. Int J Environ Res Public Health. 2022; 19( 9): 5365. doi:10.3390/ijerph19095365. [Google Scholar] [CrossRef]
15. Boateng GO , Neilands TB , Frongillo EA , Melgar-Quiñonez HR , Young SL . Best practices for developing and validating scales for health, social, and behavioral research: A primer. Front Public Health. 2018; 6: 149. doi:10.3389/fpubh.2018.00149. [Google Scholar] [CrossRef]
16. Connors EH , Moffa K , Carter T , Crocker J , Bohnenkamp JH , Lever NA , et al. Advancing mental health screening in schools: Innovative, field-tested practices and observed trends during a 15-month learning collaborative. Psychol Sch. 2022; 59( 6): 1135– 57. doi:10.1002/pits.22670. [Google Scholar] [CrossRef]
17. Obeid S , Kanj G , Mohammed Ali A , El Khoury MA , Malaeb D , Sakr F , et al. The Depression Anxiety Stress Scales for Youth (DASS-Y): Psychometric properties of an Arabic translation and validation of a shortened form (DASS-Y-12) based on the adult DASS-12. Int J Adolesc Youth. 2025; 30( 1): 2512843. doi:10.1080/02673843.2025.2512843. [Google Scholar] [CrossRef]
18. Śliwerski A , Koszałkowska K , Socha I . Assessing stress, anxiety, and depression in children and adolescents: Validation of the DASS-Y in Poland. PLoS One. 2025; 20( 8): e0323835. doi:10.1371/journal.pone.0323835. [Google Scholar] [CrossRef]
19. Jovanović V . The Depression Anxiety Stress Scales for Youth (DASS-Y): Evidence of validity and cross-national and gender measurement invariance. Eur Child Adolesc Psychiatry. 2025; 34( 4): 1317– 27. doi:10.1007/s00787-024-02561-0. [Google Scholar] [CrossRef]
20. Akçay E , Çevirici AD , Şenel M , Aydoğmuş YE , Çevirici T , Dinç GŞ , et al. Psychometric properties of the Turkish version of the Depression Anxiety Stress Scale for Youth (DASS-Y) in psychiatric and non-psychiatric samples. BMC Psychol. 2025; 13( 1): 1305. doi:10.1186/s40359-025-03656-2. [Google Scholar] [CrossRef]
21. Gomez R , Stavropoulos V , Griffiths MD . Confirmatory factor analysis and exploratory structural equation modelling of the factor structure of the Depression Anxiety and Stress Scales-21. PLoS One. 2020; 15( 6): e0233998. doi:10.1371/journal.pone.0233998. [Google Scholar] [CrossRef]
22. Marsh HW , Guo J , Dicke T , Parker PD , Craven RG . Confirmatory factor analysis (CFA), exploratory structural equation modeling (ESEM), and set-ESEM: Optimal balance between goodness of fit and parsimony. Multivariate Behav Res. 2020; 55( 1): 102– 19. doi:10.1080/00273171.2019.1602503. [Google Scholar] [CrossRef]
23. van Zyl LE , Heijenk B , Klibert J , Shankland R , Verger NB , Rothmann S , et al. Grit across nations: The cross-national equivalence of the Grit-O Scale. J Happiness Stud. 2022; 23( 7): 3179– 213. doi:10.1007/s10902-022-00543-0. [Google Scholar] [CrossRef]
24. Yılmaz Koğar E , Koğar H . Using a bifactor exploratory structural equation modeling framework to examine the factor structure of the Depression Anxiety and Stress Scales-21. Curr Psychol. 2023; 42( 29): 25807– 21. doi:10.1007/s12144-022-03710-x. [Google Scholar] [CrossRef]
25. Vitoratou S , Pickles A . A note on contemporary psychometrics. J Ment Health. 2017; 26( 6): 486– 8. doi:10.1080/09638237.2017.1392008. [Google Scholar] [CrossRef]
26. Chen IH , Chen CY , Liao XL , Chen XM , Zheng X , Tsai YC , et al. Psychometric properties of the Depression, Anxiety, and Stress Scale (DASS-21) among different Chinese populations: A cross-sectional and longitudinal analysis. Acta Psychol. 2023; 240: 104042. doi:10.1016/j.actpsy.2023.104042. [Google Scholar] [CrossRef]
27. Simon P , Bernardo A . Longitudinal measurement invariance of the Depression Anxiety Stress Scale (DASS-21) in Filipino adolescents. Transactions NAST PHL. 2023; 44( 2022): 1– 7. doi:10.57043/transnastphl.2022.2557. [Google Scholar] [CrossRef]
28. National Bureau of Statistics of China . Annual GDP Data of major cities (2024) [Internet]. Beijing, China: Data Query Platform of the National Bureau of Statistics; 2024 [cited 2026 Feb 11]. Available from: https://data.stats.gov.cn/easyquery.htm?cn=E0105. [Google Scholar]
29. Ministry of Education of the People’s Republic of China . 2023 Education statistics: Number of students in regular senior secondary education by types [Internet]. Beijing, China: Ministry of Education Government Portal; 2024 [cited 2026 Feb 11]. Available from: http://www.moe.gov.cn/jyb_sjzl/moe_560/2023/quanguo/202501/t20250120_1176359.html. [Google Scholar]
30. MacKenzie E , McMaugh A , Van Bergen P , Parada RH . Online support seeking, co-rumination, and mental health in adolescent girls. Front Psychiatry. 2023; 14: 1040636. doi:10.3389/fpsyt.2023.1040636. [Google Scholar] [CrossRef]
31. Koo TK , Li MY . A guideline of selecting and reporting intraclass correlation coefficients for reliability research. J Chiropr Med. 2016; 15( 2): 155– 63. doi:10.1016/j.jcm.2016.02.012. [Google Scholar] [CrossRef]
32. Cicchetti DV . Guidelines, criteria, and rules of thumb for evaluating normed and standardized assessment instruments in psychology. Psychol Assess. 1994; 6( 4): 284– 90. doi:10.1037/1040-3590.6.4.284. [Google Scholar] [CrossRef]
33. Slocum-Gori SL , Zumbo BD . Assessing the unidimensionality of psychological scales: Using multiple criteria from factor analysis. Soc Indic Res. 2011; 102( 3): 443– 61. doi:10.1007/s11205-010-9682-8. [Google Scholar] [CrossRef]
34. Jafari P , Bagheri Z , Safe M . Item and response-category functioning of the Persian version of the KIDSCREEN-27: Rasch partial credit model. Health Qual Life Outcomes. 2012; 10( 1): 127. doi:10.1186/1477-7525-10-127. [Google Scholar] [CrossRef]
35. Neufeld SAS , St Clair M , Brodbeck J , Wilkinson PO , Goodyer IM , Jones PB . Measurement invariance in longitudinal bifactor models: Review and application based on the p factor. Assessment. 2024; 31( 4): 774– 93. doi:10.1177/10731911231182687. [Google Scholar] [CrossRef]
36. Stenling A , Ivarsson A , Lindwall M , Gucciardi DF . Exploring longitudinal measurement invariance and the continuum hypothesis in the Swedish version of the Behavioral Regulation in Sport Questionnaire (BRSQ): An exploratory structural equation modeling approach. Psychol Sport Exerc. 2018; 36: 187– 96. doi:10.1016/j.psychsport.2018.03.002. [Google Scholar] [CrossRef]
37. Hair JF , Black WC , Babin BJ , Anderson RE . Multivariate data analysis. 8th ed. London, UK: Cengage Learning; 2019. [Google Scholar]
38. Alamer A , Marsh H . Exploratory structural equation modeling in second language research: An applied example using the dualistic model of passion. Stud Second Lang Acquis. 2022; 44( 5): 1477– 500. doi:10.1017/s0272263121000863. [Google Scholar] [CrossRef]
39. Morin AJS , Myers ND , Lee S . Modern factor analytic techniques: Bifactor models, exploratory structural equation modeling (ESEM), and bifactor-ESEM. In: Tenenbaum G , Eklund RC , editors. Handbook of sport psychology. 4th ed. New York, NY, USA: Wiley; 2020. p. 1044– 73. doi: 10.1002/9781119568124.ch51. [Google Scholar] [CrossRef]
40. Chen FF . Sensitivity of goodness of fit indexes to lack of measurement invariance. Struct Equ Model A Multidiscip J. 2007; 14( 3): 464– 504. doi:10.1080/10705510701301834. [Google Scholar] [CrossRef]
41. Ministry of Education of the People’s Republic of China . 2023 Education statistics: Number of students in primary education by yypes [Internet]. Beijing, China: Ministry of Education Government Portal; 2024 [cited 2026 Feb 11]. Available from: http://www.moe.gov.cn/jyb_sjzl/moe_560/2023/quanguo/202501/t20250120_1176386.html. [Google Scholar]
42. Ministry of Education of the People’s Republic of China . 2023 Education statistics: Number of students in junior secondary education by types [Internet]. Beijing, China: Ministry of Education Government Portal; 2024 [cited 2026 Feb 11]. Available from: http://www.moe.gov.cn/jyb_sjzl/moe_560/2023/quanguo/202501/t20250120_1176375.html. [Google Scholar]
43. Marien WE , Bell DJ . Anxiety- and depression-related thoughts in children: Development and evaluation of a cognition measure. J Clin Child Adolesc Psychol. 2004; 33( 4): 717– 30. doi:10.1207/s15374424jccp3304_7. [Google Scholar] [CrossRef]
44. Clark LA , Watson D . Tripartite model of anxiety and depression: Psychometric evidence and taxonomic implications. J Abnorm Psychol. 1991; 100( 3): 316– 36. doi:10.1037//0021-843x.100.3.316. [Google Scholar] [CrossRef]
45. Tems CL , Stewart SM , Skinner JR Jr , Hughes CW , Emslie G . Cognitive distortions in depressed children and adolescents: Are they state dependent or traitlike? J Clin Child Psychol. 1993; 22( 3): 316– 26. doi:10.1207/s15374424jccp2203_2. [Google Scholar] [CrossRef]
46. Asparouhov T , Muthén B . Exploratory structural equation modeling. Struct Equ Model A Multidiscip J. 2009; 16( 3): 397– 438. doi:10.1080/10705510903008204. [Google Scholar] [CrossRef]
47. Ye L , Posada A , Liu Y . A review on the relationship between Chinese adolescents’ stress and academic achievement. New Dir Child Adolesc Dev. 2019; 2019( 163): 81– 95. doi:10.1002/cad.20265. [Google Scholar] [CrossRef]
48. Wang X , Cao CH , Liao XL , Jiang XY , Griffiths MD , Chen IH , et al. Comparing the psychometric evidence of the Depression, Anxiety, and Stress Scale-21 (DASS-21) between Spanish and Chinese primary schoolteachers: Insights from classical test theory and rasch analysis. BMC Psychol. 2025; 13( 1): 450. doi:10.1186/s40359-025-02728-7. [Google Scholar] [CrossRef]
49. Anusic I , Schimmack U . Stability and change of personality traits, self-esteem, and well-being: Introducing the meta-analytic stability and change model of retest correlations. J Pers Soc Psychol. 2016; 110( 5): 766– 81. doi:10.1037/pspp0000066. [Google Scholar] [CrossRef]
50. Piaget J , Cook M . The origins of intelligence in children. New York, NY, USA: International Universities Press; 1952. [Google Scholar]
51. Widen SC , Russell JA . Children acquire emotion categories gradually. Cogn Dev. 2008; 23( 2): 291– 312. doi:10.1016/j.cogdev.2008.01.002. [Google Scholar] [CrossRef]
52. Nook EC , Sasse SF , Lambert HK , McLaughlin KA , Somerville LH . Increasing verbal knowledge mediates development of multidimensional emotion representations. Nat Hum Behav. 2017; 1: 881– 9. doi:10.1038/s41562-017-0238-7. [Google Scholar] [CrossRef]
53. Domènech-Llaberia E , Jané C , Canals J , Ballespí S , Esparó G , Garralda E . Parental reports of somatic symptoms in preschool children: Prevalence and associations in a Spanish sample. J Am Acad Child Adolesc Psychiatry. 2004; 43( 5): 598– 604. doi:10.1097/00004583-200405000-00013. [Google Scholar] [CrossRef]
Cite This Article
 Copyright © 2026 The Author(s). Published by Tech Science Press.
This work is licensed under a Creative Commons Attribution 4.0 International License , which permits unrestricted use, distribution, and reproduction in any medium, provided the original work is properly cited.
 Downloads
 Citation Tools