
 Login
Login Register
 Submit a Paper
 Propose a Special lssue
 Open Access
ARTICLE
Explainable Gradient Boosting for Transparent Phishing URL Detection: A Cross-Dataset, Statistically Validated SHAP Analysis of XGBoost, LightGBM, and CatBoost
Department of Software Engineering, Daffodil International University, Birulia, Savar, Dhaka, Bangladesh
* Corresponding Author: S. M. Nihal Ahmed. Email:
Journal of Cyber Security 2026, 8, 667-703. https://doi.org/10.32604/jcs.2026.089357
Received 23 July 2026; Accepted 27 August 2026; Issue published 14 September 2026
 View Full Text
 Download PDF
Abstract
Phishing remains one of the most persistent attack vectors in cybersecurity, and the gradient-boosting models that now dominate its automated detection are frequently deployed as opaque classifiers, which limits analyst trust and slows incident response. This paper presents a cross-dataset, explainability-driven evaluation of three gradient boosting algorithms–XGBoost, LightGBM, and CatBoost—for phishing URL classification, paired with a SHAP (Shapley Additive Explanations)-based framework that attributes every prediction to specific, human-readable features rather than treating the classifier as a black box. To eliminate a data leakage risk present in an earlier evaluation protocol—in which hyperparameter tuning and final evaluation shared the same held-out split—all experiments reported here use a corrected 60:20:20 train/validation/test protocol, with a validation-only random hyperparameter search and a test partition touched exactly once per dataset. Under this protocol, on the original 2015–2017 benchmark (9581 samples, 48 features), XGBoost reached 99.11% test accuracy (F1 = 0.991, ROC-AUC [Receiver Operating Characteristic–Area Under the Curve] = 0.999), with LightGBM and CatBoost each at 98.70% (F1 = 0.986); paired McNemar tests and five-seed repeated runs show these differences are not statistically significant (); this significance testing was performed on this benchmark only and was not repeated on the other three datasets. The same pipeline was replicated on three additional, more recent phishing datasets (PhiUSIIL, 2023; a 2026 URL-Phish benchmark; and LegitPhish, 2025), where accuracy ranged from 96.08%–96.27% on the hardest, most recent benchmark to near-ceiling performance on PhiUSIIL—a result we treat with caution given the disproportionate influence of a single similarity-index feature. A quantitative, reproducible criterion for SHAP feature reliance (mean exceeding 5% of a model’s per-dataset maximum) shows that all three models rely on a substantially narrower evidence base than earlier, leakage-affected estimates suggested–roughly half of the 48 features on the original benchmark. We further test, rather than merely hypothesize, whether narrower SHAP reliance predicts adversarial vulnerability: a SHAP-guided perturbation experiment across all four datasets shows that XGBoost, not the narrowest-relying LightGBM, is the most susceptible to feature-guided evasion (50.0% mean evasion rate vs. 32.4% for LightGBM), indicating that SHAP breadth alone does not predict robustness. Training and inference time, per-row SHAP computation cost, classification-threshold sensitivity, probability calibration, and performance under a realistic 90:10 class imbalance are also reported. These findings support feature-attribution analysis as a useful complement to accuracy when comparing similarly performing gradient boosting models, while showing that some of the more intuitive claims about that attribution require direct testing rather than inference.Keywords
Widespread internet adoption has reshaped how people communicate, transact, and share information. In the United Kingdom alone, the share of the population using the internet rose from 85.00% in 2010 to 94.78% in 2016 [1], a pattern repeated across most connected economies. This growth has been accompanied by a parallel rise in cybercrime [2], and phishing has become one of its most common instruments: attackers use deceptive text, email, or websites to trick users into installing malware or disclosing sensitive credentials [3].
Data from the Anti-Phishing Working Group illustrates the scale of the problem [4] (Fig. 1). Unique phishing sites climbed steadily through 2021, from 611,877 in Q1 to 888,585 by Q4. The upward trend continued into 2022, peaking at 1,270,883 sites in Q3 and exceeding 2021 levels in every quarter. Activity peaked further in Q1 2023 at 1,624,144 sites before declining to 1,286,208 in Q2 and 999,956 in Q3, then rising again to 1,077,501 in Q4. The volatility of this trend is itself informative: phishing campaigns are not a fixed target but an adversarial process that reacts to takedown efforts, seasonal opportunities, and defender behavior, which is one reason static, rule-based countermeasures struggle to keep pace.
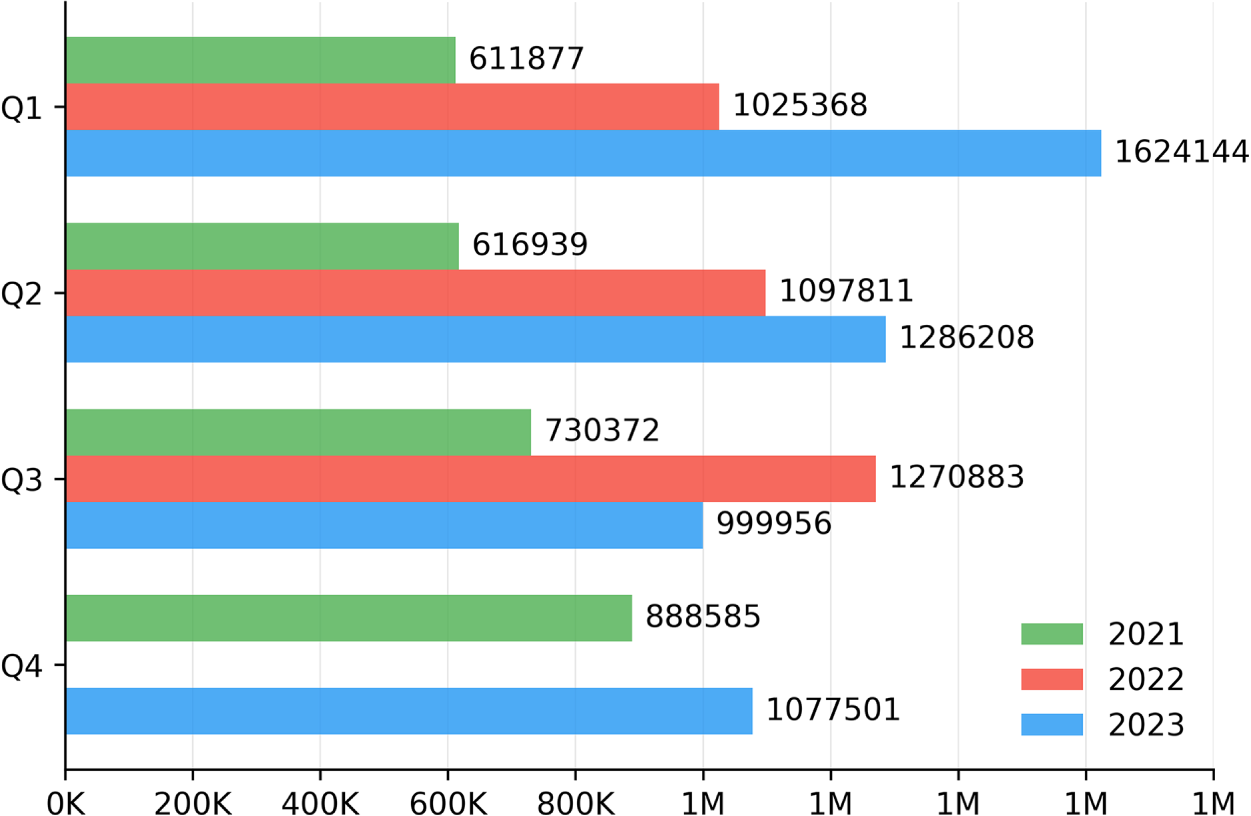
Figure 1: Count of unique phishing websites per quarter, 2021–2023 (source: APWG [4]).
Phishing campaigns take many forms, including spear phishing, whaling, smishing, vishing, pharming, clone phishing, and man-in-the-middle phishing, but the majority of these ultimately rely on one of two delivery mechanisms to reach the victim. Website-based phishing clones a legitimate site’s appearance so closely that credentials entered by a victim are captured and forwarded to the attacker. Email-based phishing sends messages that appear legitimate—often mimicking a bank, employer, or prize notification—to lure the recipient into submitting personal information through an embedded form or link. This study focuses on the URL- and webpage-feature-based detection of the underlying malicious website, which is the common endpoint of most of these variants.
Research on automated countermeasures has followed several distinct lines. Blacklisting, used by major browsers such as Chrome and Firefox, is effective against known threats but fails against zero-day phishing sites that have not yet been reported [5]. Machine learning (ML) classifiers built on handcrafted URL and page features have reported accuracies approaching 99% [6–10]. Deep learning (DL) architectures such as LSTM, CNN, and fully connected networks extract patterns directly from raw or lightly processed inputs, typically reaching around 97% accuracy [11,12]. More recently, transformer-based and hybrid pipelines have been applied to the natural-language components of phishing content [13], and ensemble methods that combine multiple base learners have pushed reported accuracy above 99% [14,15]. A recent structured review of intelligent phishing-detection approaches situates gradient boosting and hybrid pipelines within this broader landscape and highlights explainability as an area still receiving comparatively little systematic evaluation [16], and a broader overview of ML, DL, and hybrid phishing-detection systems reaches a similar conclusion: despite the field’s rapid growth, explainability and adversarial robustness remain comparatively under-evaluated relative to raw accuracy [17].
This progression toward higher accuracy has come at a cost: most of these approaches offer little insight into why a given URL is flagged. Ensemble and boosting methods in particular behave as black boxes, aggregating hundreds of decision trees in ways that resist manual inspection. For a security analyst deciding whether to block a domain, quarantine an email, or escalate an alert, a bare prediction carries limited operational value–and an unexplained false positive erodes trust in the system faster than an explained one. This gap between predictive performance and interpretability motivates the present study.
A preliminary version of this study evaluated three gradient boosting algorithms—XGBoost, LightGBM, and CatBoost—for phishing URL detection, paired with a SHAP-based explainability layer, on a single 2015–2017 benchmark, but relied on an evaluation protocol with a known limitation: hyperparameter tuning had been guided by performance on the same held-out split used for final reporting, and several claims—including the accuracy ranking between models and the practical consequence of LightGBM’s narrower SHAP reliance—remained untested. This work addresses those limitations directly rather than restating them as caveats. We re-ran the full pipeline under a corrected 60:20:20 train/validation/test protocol with a validation-only hyperparameter search, replicated it on three additional and more recent phishing datasets, added paired statistical significance testing, evaluated performance under realistic class imbalance, defined a quantitative criterion for SHAP feature reliance, and–rather than speculating about adversarial robustness–ran a SHAP-guided evasion experiment to test it directly. The contributions of this paper are as follows:
• We benchmark XGBoost, LightGBM, and CatBoost on four phishing URL/webpage datasets spanning 2015–2026 under a leakage-free protocol in which hyperparameters are selected on a dedicated validation split and the test partition is used exactly once per dataset, reporting accuracy, precision, recall, F1, ROC-AUC, PR-AUC, and Matthews correlation coefficient (MCC).
• We test, rather than assume, whether the accuracy differences among the three models are statistically meaningful, using paired McNemar tests and five-seed repeated training on the primary benchmark, and evaluate performance under a realistic 90:10 class imbalance, under validation-selected decision thresholds, and under reliability-diagram-based probability calibration checks.
• We define a quantitative, reproducible criterion for SHAP feature reliance and use it to show that all three models draw on a narrower evidence base than earlier, leakage-affected estimates suggested, and we evaluate the faithfulness, resampling stability, and analyst actionability of the resulting explanations.
• We directly test the previously untested hypothesis that narrower SHAP reliance predicts greater vulnerability to feature-guided adversarial evasion, and report a counter-intuitive result that qualifies how SHAP breadth should be interpreted as a robustness signal.
The remainder of this paper is organized as follows. Section 2 reviews prior work on phishing detection across machine learning, deep learning, hybrid, and ensemble approaches. Section 3 describes the four datasets, preprocessing, and the three gradient boosting architectures. Section 4 presents the SHAP-based explainability framework, including the quantitative non-triviality criterion. Section 5 details the corrected experimental protocol and evaluation metrics. Section 6 reports and analyzes the results, including statistical validation, cross-dataset generalization, and the adversarial evasion experiment. Section 7 discusses the limitations that remain, and Section 8 concludes the paper.
Anti-phishing research spans a range of strategies, from static blacklists and heuristic rules to learned models operating on URL, hyperlink, and page-content features. This section synthesizes prior work by methodological family and identifies the gap that motivates the present study.
2.1 Machine Learning-Based Detection
Supervised ML remains the dominant paradigm for phishing detection because it scales well to the large labeled datasets now available [5]. Mohanty et al. combined chi-square and ANOVA feature ranking with several classical classifiers, finding that k-nearest neighbors (kNN) achieved the highest accuracy at 99.8% [6]. Abdillah et al. evaluated 13 ML algorithms across varying class ratios and reported a peak accuracy of 98.84% using a 60:40 legitimate-to-phishing split [7]. Shirazi et al. used an adversarial autoencoder to synthesize additional training samples and found that gradient boosting outperformed kNN, decision trees, random forest, and SVM variants, reaching 97.45% [8]. Sharma et al. compared feature-selection strategies across eight algorithms and reported that random forest improved from 96.6% to 97.79% accuracy once feature selection was applied [9]. Abdul Samad et al. specifically examined the effect of class balance and found that gradient boosting and XGBoost achieved 98.27% and 98.21% accuracy, respectively, on balanced data [10]. Al-Haija and Badawi trained several ML classifiers directly on lexical URL features and reported that ensemble tree methods were consistently among the strongest performers, reinforcing the case for boosting-based approaches on this task [18]. Taken together, these studies establish tree-based ensembles as consistently competitive, but few of them examine what the models are actually attending to when they classify a URL, and fewer still validate their tuning protocol against test-set leakage.
2.2 Deep Learning-Based Detection
DL methods trade handcrafted features for learned representations, aiming to capture patterns that are difficult to specify manually [11]. Somesha et al. demonstrated that DL architectures can achieve high detection accuracy directly from raw phishing website features without extensive manual feature engineering [19]. Almousa et al. tuned LSTM, CNN, and fully connected architectures and reported accuracies of 97.37%, 97.27%, and 96.77% respectively after hyperparameter optimization [11]. Birthriya et al. combined word2vec-, PCA-, and NLP-derived hybrid URL features with an attention-augmented CNN, reporting 99.83% accuracy on a custom dataset [20]—part of the same authors’ broader line of work on phishing detection that also includes the multi-objective XGBoost feature-selection approach discussed below [21]. Across the studies surveyed above, a recurring pattern is that the DL architectures were trained on larger sample sizes and required more extensive hyperparameter search than the boosting studies discussed elsewhere in this review to reach comparable accuracy [11,19,20]; more broadly, DL models’ internal representations are also considerably harder to inspect than a tree ensemble’s feature splits, which motivates the tree-ensemble-plus-SHAP framework adopted in this study.
2.3 Hybrid and Transformer-Based Detection
Because many phishing indicators are textual (email body, page copy, brand names), some work has applied NLP architectures directly to phishing content. Haynes et al. fine-tuned two pre-trained transformer models, BERT and ELECTRA, to classify phishing URLs from raw URL text alone, without handcrafted features, and reported that both models achieved competitive detection performance while requiring only a few minutes of fine-tuning [13]. Their results are broadly comparable to, rather than clearly better than, the best ML and ensemble figures reported above, suggesting that for structured URL/host features—as opposed to free-text content–transformer architectures do not currently offer a decisive advantage over tree-based methods, while adding substantially more computational overhead and even less interpretability.
2.4 Ensemble-Based and Optimization-Augmented Learning
Ensemble methods that stack or combine multiple base learners have produced the strongest reported results. Kalabarige et al. built a multilayer stacked ensemble combining MLP, kNN, random forest, logistic regression, and XGBoost, reaching 98.90% accuracy [14]. A follow-up study by the same group used gradient boosting for hybrid feature selection within a boosting-based multilayer ensemble, achieving 98.80% [15]. Wei and Sekiya examined whether such elaborate ensemble constructions are actually necessary, systematically comparing the sufficiency of simpler vs. more complex ensemble configurations for phishing website detection, and found that modest ensembles could approach the accuracy of far more complex stacked architectures [12]. Beyond stacking, a separate line of work couples gradient boosting with metaheuristic search: Birthriya et al. recently combined multi-objective evolutionary optimization with XGBoost for joint feature selection and hyperparameter tuning, reporting consistent gains over prior multi-objective boosting hybrids on several phishing benchmarks [21]. This line of work shows that XGBoost is already a common substrate for optimization-augmented phishing detection, which sharpens rather than removes the gap this paper addresses: none of these optimization-focused studies evaluates the breadth or actionability of the resulting model’s feature attributions, or tests whether the resulting model differs in adversarial robustness from a differently tuned counterpart with similar accuracy.
Across all four lines of work, accuracy has been treated as the primary–often the only–criterion for comparing models. Explainability, where it is discussed at all, is typically presented as an afterthought rather than as part of the evaluation itself, and SHAP-boosting combinations of the kind explored here already exist in adjacent cybersecurity tasks, so we do not claim to be first to pair SHAP with a gradient boosting classifier [18,21]. What remains largely unaddressed is a joint evaluation, under a tuning protocol that does not leak test information, of (i) a quantitative and reproducible definition of how broadly a model relies on the available feature space, (ii) whether that reliance is faithful, stable under resampling, and actionable for a security analyst, and (iii) whether narrower reliance actually predicts greater vulnerability to feature-guided adversarial evasion, tested directly rather than left as an inference. This is the gap addressed in this paper.
This study evaluates three tree-based gradient boosting algorithms—XGBoost, LightGBM, and CatBoost–selected because they are the current standard for structured/tabular classification tasks, offering strong accuracy, efficient training on datasets of this scale, and native support for feature-importance extraction, which makes them a natural fit for a SHAP-based explainability pipeline.
3.1 Datasets and Preprocessing
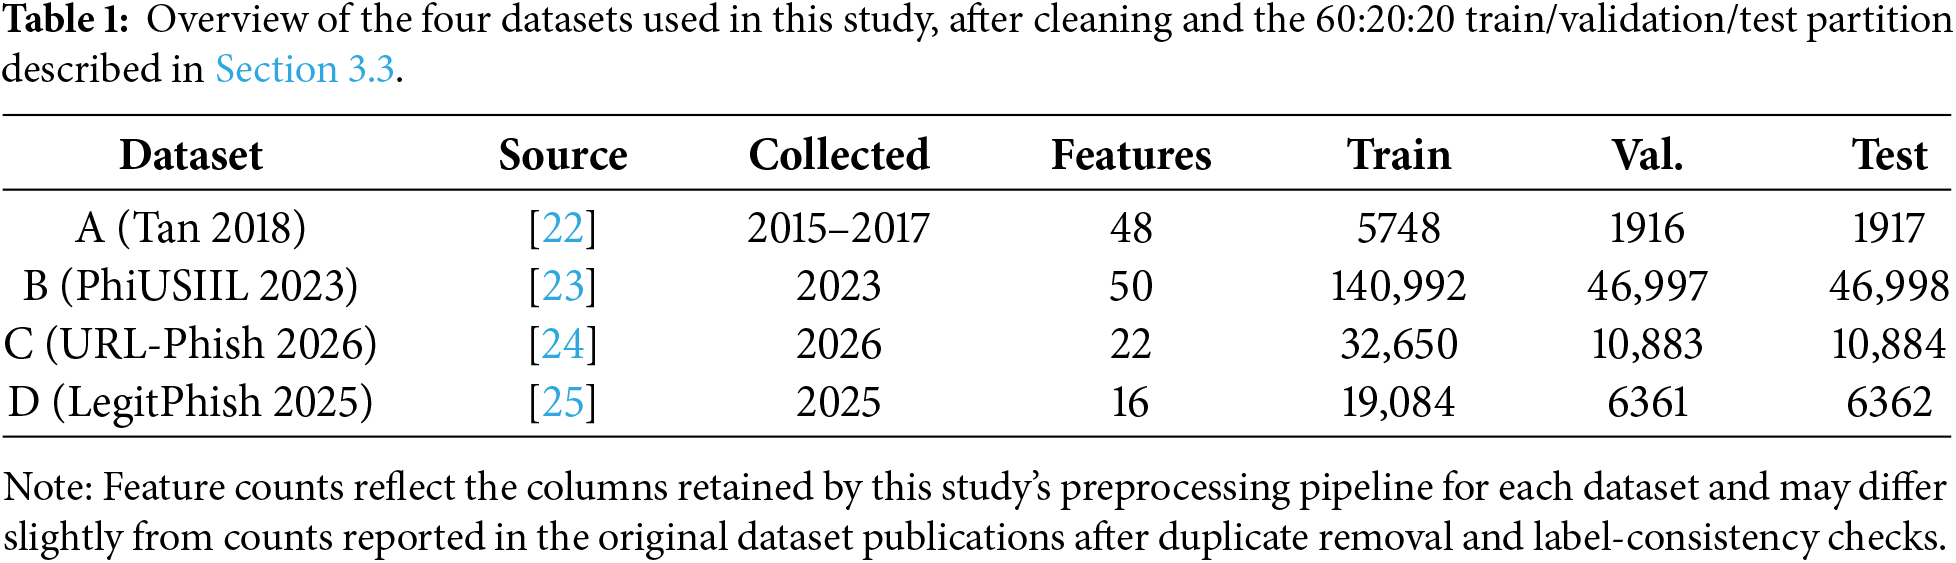
To address the single-dataset limitation of the earlier version of this work, the full pipeline was independently re-run on four phishing URL/webpage feature datasets that differ in feature source and extraction method (lexical, host-based, content-based, and similarity-index-based features, described per dataset below) and span eleven years of collection dates. Dataset A is the original 2015–2017 benchmark used in the earlier version of this study [22]; it remains the primary point of comparison with prior literature (Section 6.8). Dataset B is PhiUSIIL, a 2023 similarity-index-based phishing URL corpus [23]. Dataset C is a 2026 feature-engineered URL-Phish benchmark [24], the most recent dataset evaluated in this study. Dataset D is LegitPhish, a 2025 phishing/legitimate URL feature dataset [25]. Table 1 summarizes the four datasets as processed by this study’s pipeline.
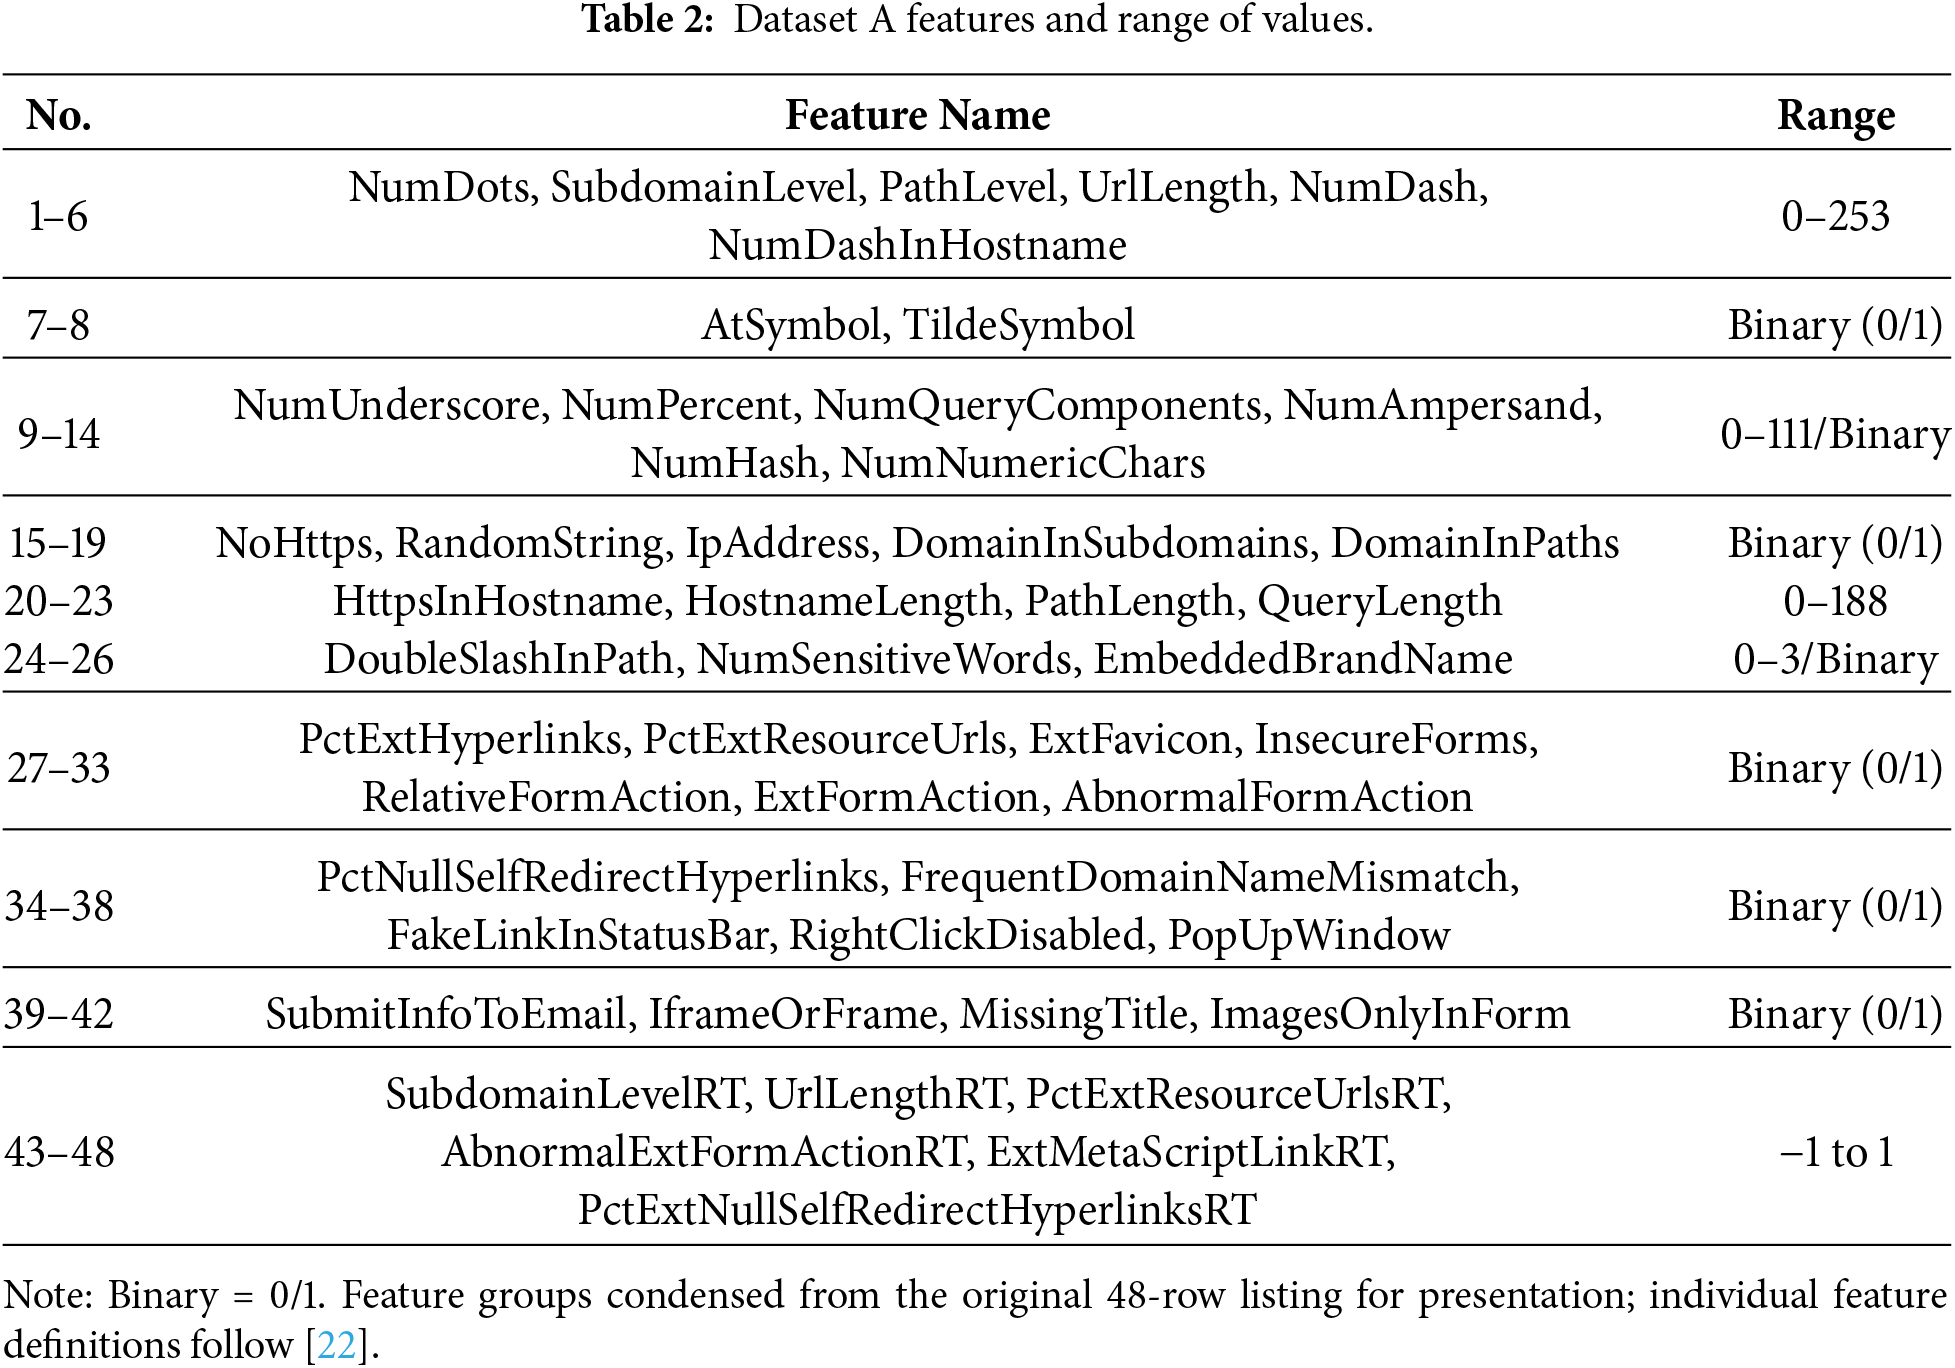
Dataset A comprises 48 lexical, host-based, and content-based features extracted from web pages, spanning four data types–binary indicators (e.g., presence of an IP address in the URL, use of HTTPS), discrete counts (e.g., number of dots, dashes, or query components), categorical flags (e.g., abnormal form action, right-click disabled), and continuous-valued attributes (e.g., URL length, hostname length)—summarized in Table 2. Datasets B, C, and D use their own published feature sets (50, 22, and 16 features, respectively); full per-feature listings for these three datasets are available from the corresponding author on request, consistent with the Availability of Data and Materials statement at the end of this article.
For all four datasets, preprocessing was limited to validation and cleaning rather than transformation: duplicate rows were removed, label consistency was verified, and rows with missing critical fields were dropped prior to partitioning. Feature scaling was not applied, as tree-based gradient boosting models split on raw feature thresholds and are invariant to monotonic transformations of individual features. Each cleaned dataset was then partitioned 60:20:20 into training, validation, and test sets, as described in Section 3.3.
Extreme Gradient Boosting (XGBoost) [26] builds an additive ensemble of regression trees, where each new tree is fit to the negative gradient (residual) of the loss function with respect to the current ensemble’s predictions. Following the additive-training formulation of [26], let
The initial prediction is set to the mean of the target values, and each subsequent tree is constructed using a greedy, gain-maximizing split algorithm. Fig. 2 illustrates this residual-fitting process for the phishing classification task.
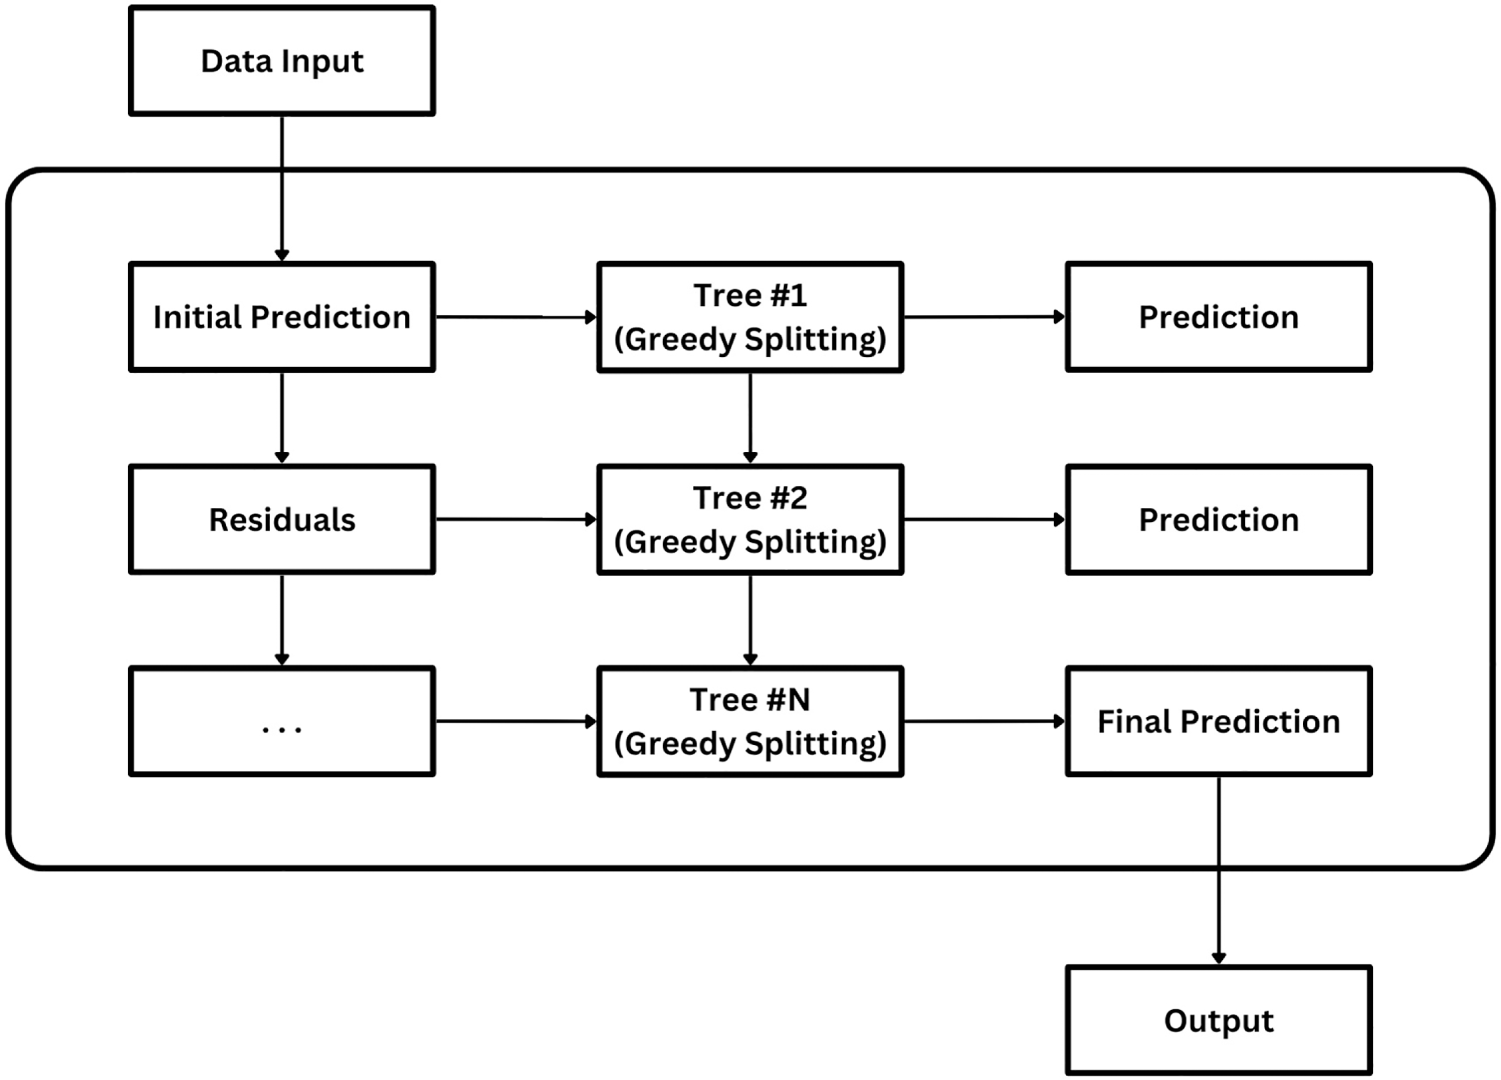
Figure 2: Sequential residual-fitting process of XGBoost.
LightGBM (Light Gradient Boosting Machine) [27] accelerates the same additive boosting framework using histogram-based split finding, which bins continuous features before searching for the optimal split point, substantially reducing the number of candidate splits evaluated at each node. Combined with leaf-wise (rather than level-wise) tree growth, this makes LightGBM considerably faster on large feature sets than depth-first boosting implementations, and it has been applied successfully to other high-throughput tasks such as traffic-flow prediction [28] and click-through-rate prediction in online advertising [29]. Fig. 3 illustrates this histogram-based, leaf-wise growth process.
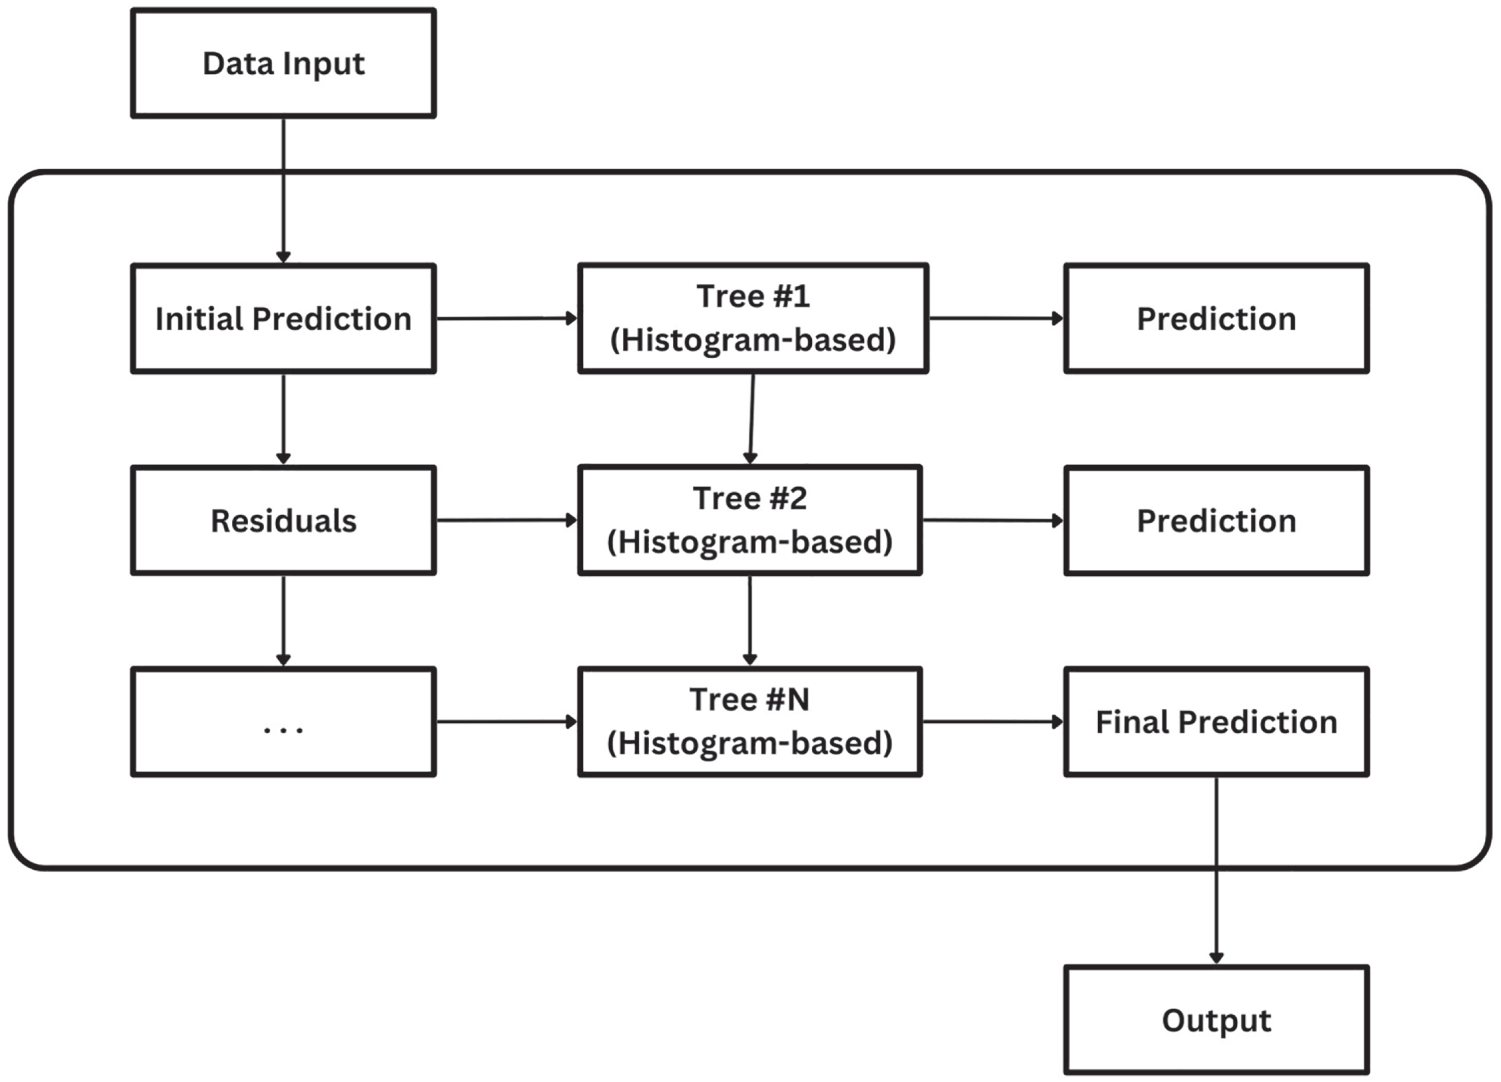
Figure 3: Histogram-based, leaf-wise tree growth in LightGBM.
CatBoost (Categorical Boosting) [30] was designed to handle categorical features natively and to reduce the prediction-shift bias that ordinary gradient boosting can introduce. It builds symmetric (oblivious) trees, in which every node at a given depth splits on the same feature and threshold, and uses ordered boosting—a permutation-based scheme that computes residuals using only previously seen examples—to mitigate target leakage [30]. Symmetric trees also make CatBoost’s inference path easier to reason about, since every sample follows a fixed, uniform depth regardless of feature values. Fig. 4 illustrates this symmetric tree structure.
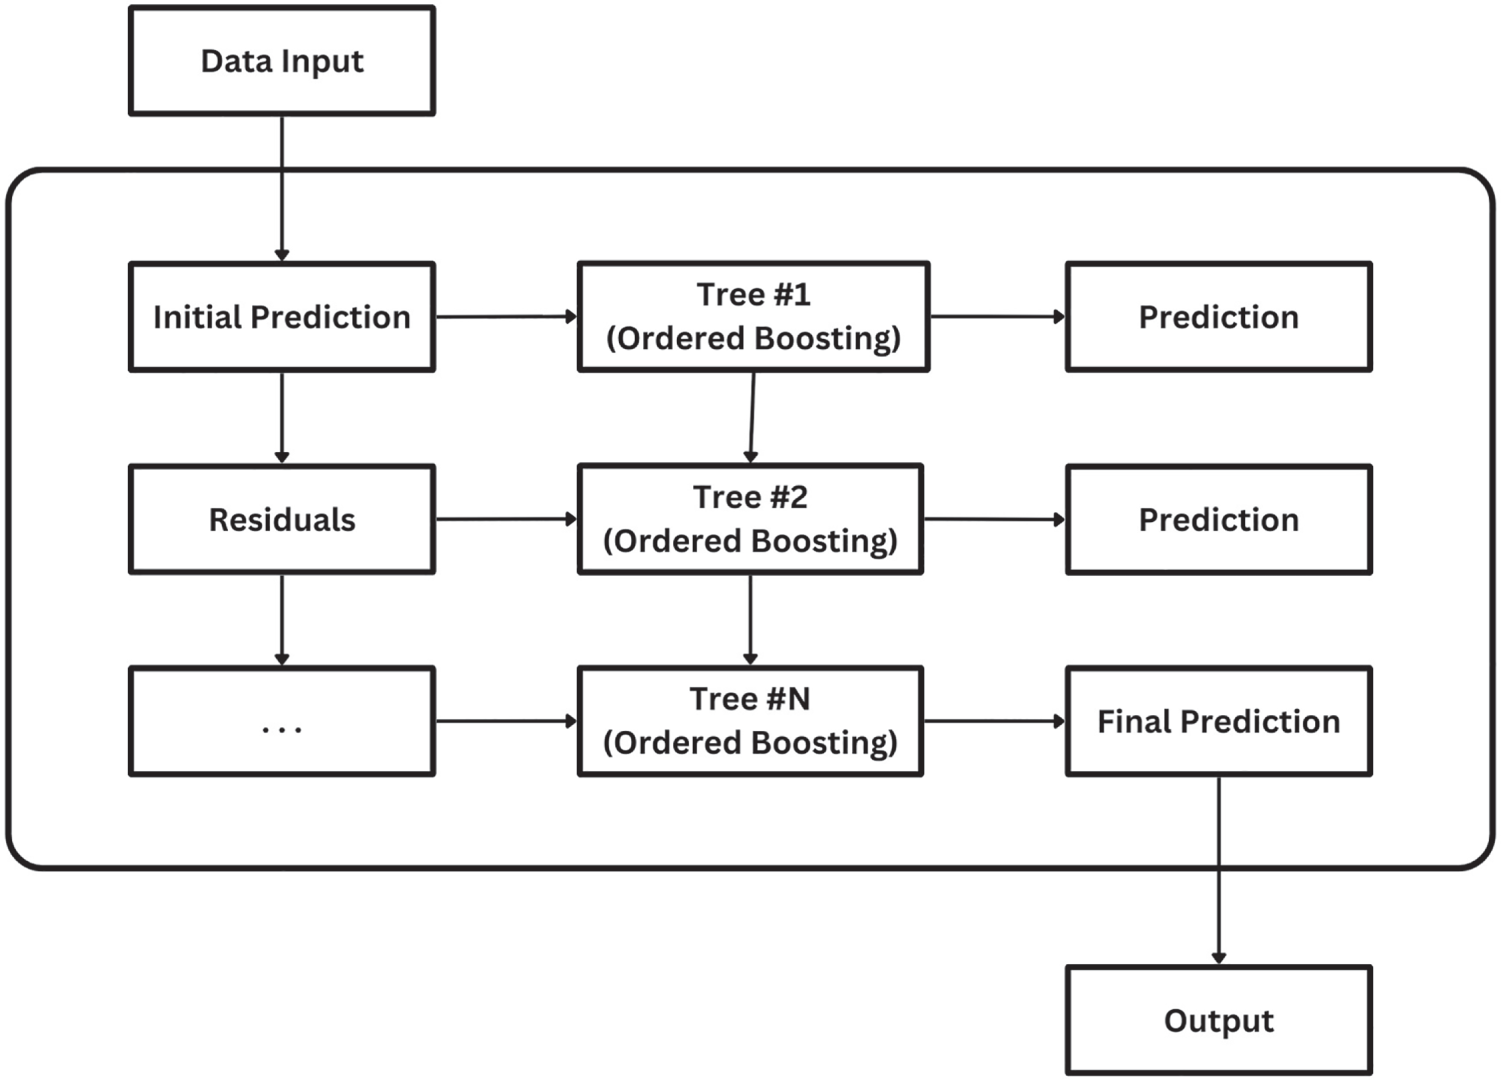
Figure 4: Symmetric (oblivious) tree structure used by CatBoost.
3.3 Corrected Training and Tuning Protocol
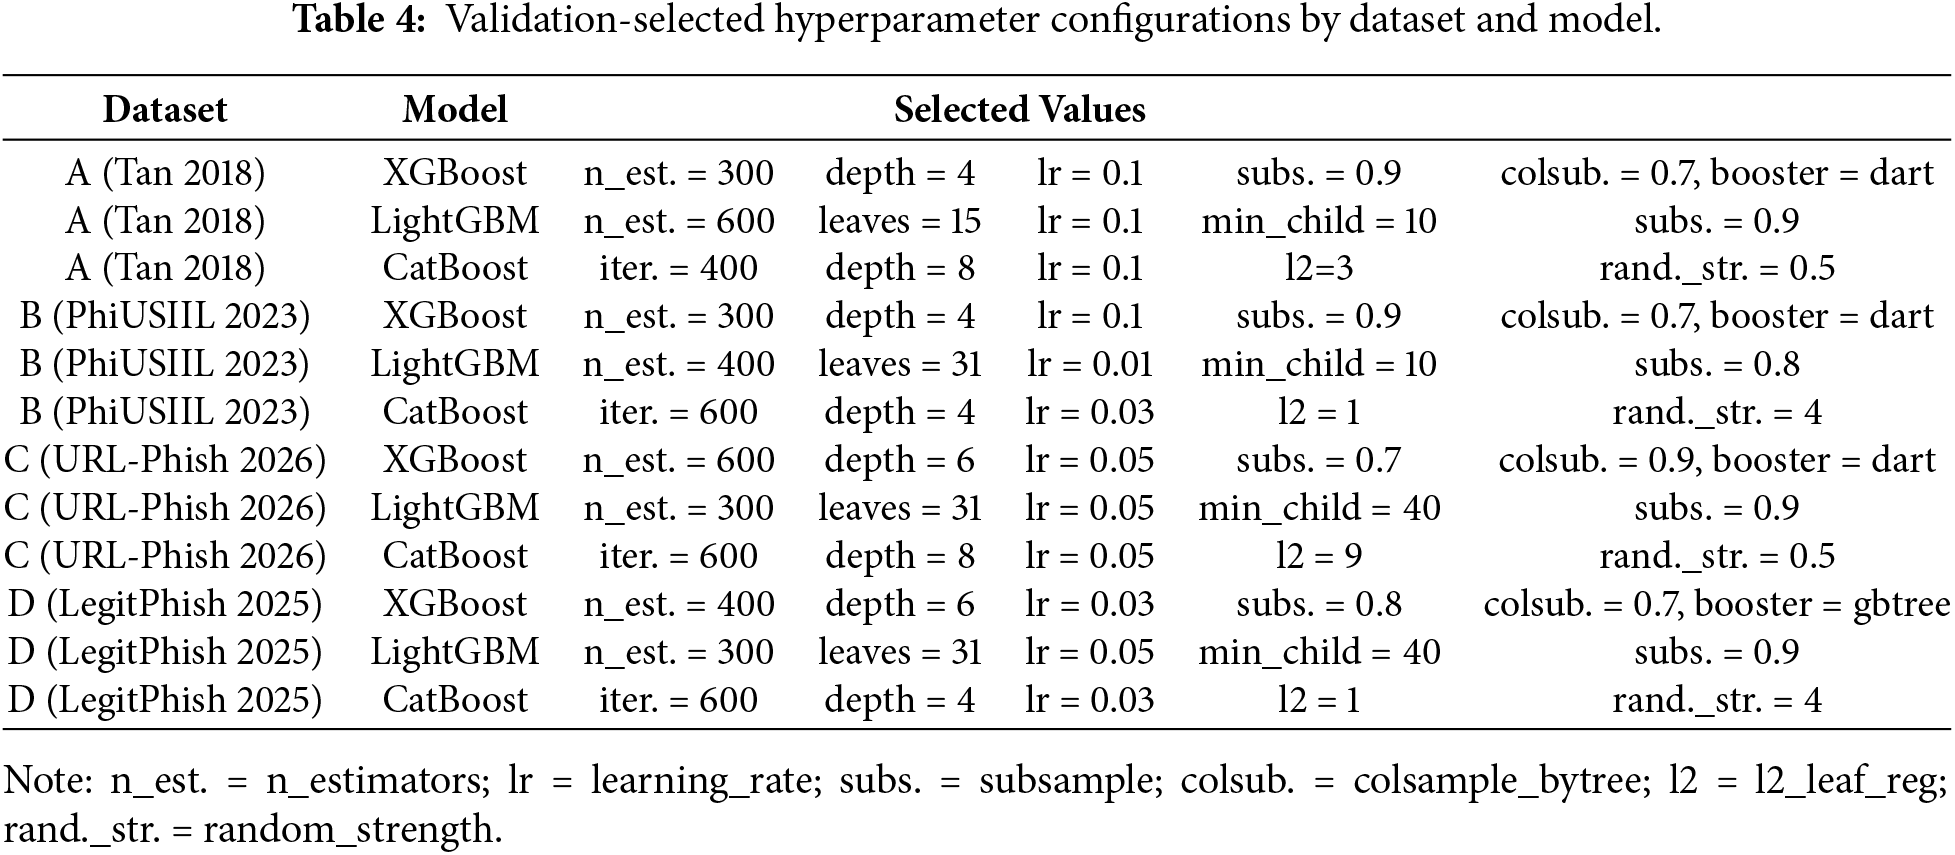
The earlier version of this study tuned hyperparameters by directly observing accuracy on the same 20% held-out split used for final reporting, a protocol decision that meant the reported test accuracies were likely-optimistic upper bounds rather than unbiased estimates of generalization performance. This revision replaces that protocol entirely. For each of the four datasets, the cleaned data was partitioned 60:20:20 into training, validation, and test sets using a fixed random seed (42). Hyperparameters were selected using a random search restricted to the training and validation partitions only: for each model, 15 candidate configurations were drawn from the search space in Table 3, each configuration was fit on the training partition, and the configuration with the highest validation-set ROC-AUC was retained. The test partition was not accessed at any point during model selection. Final metrics reported in Section 6 are computed once, on this held-out test partition, using the validation-selected configuration—eliminating this leakage pathway entirely. This random search selects a configuration but does not, by itself, constitute a formal ablation study: it does not isolate or report the individual contribution of each hyperparameter (e.g., booster choice, tree depth, learning rate) to the resulting performance, since candidate configurations vary on several hyperparameters simultaneously. No such ablation was performed in this work; we return to this as an explicit limitation in Section 7.
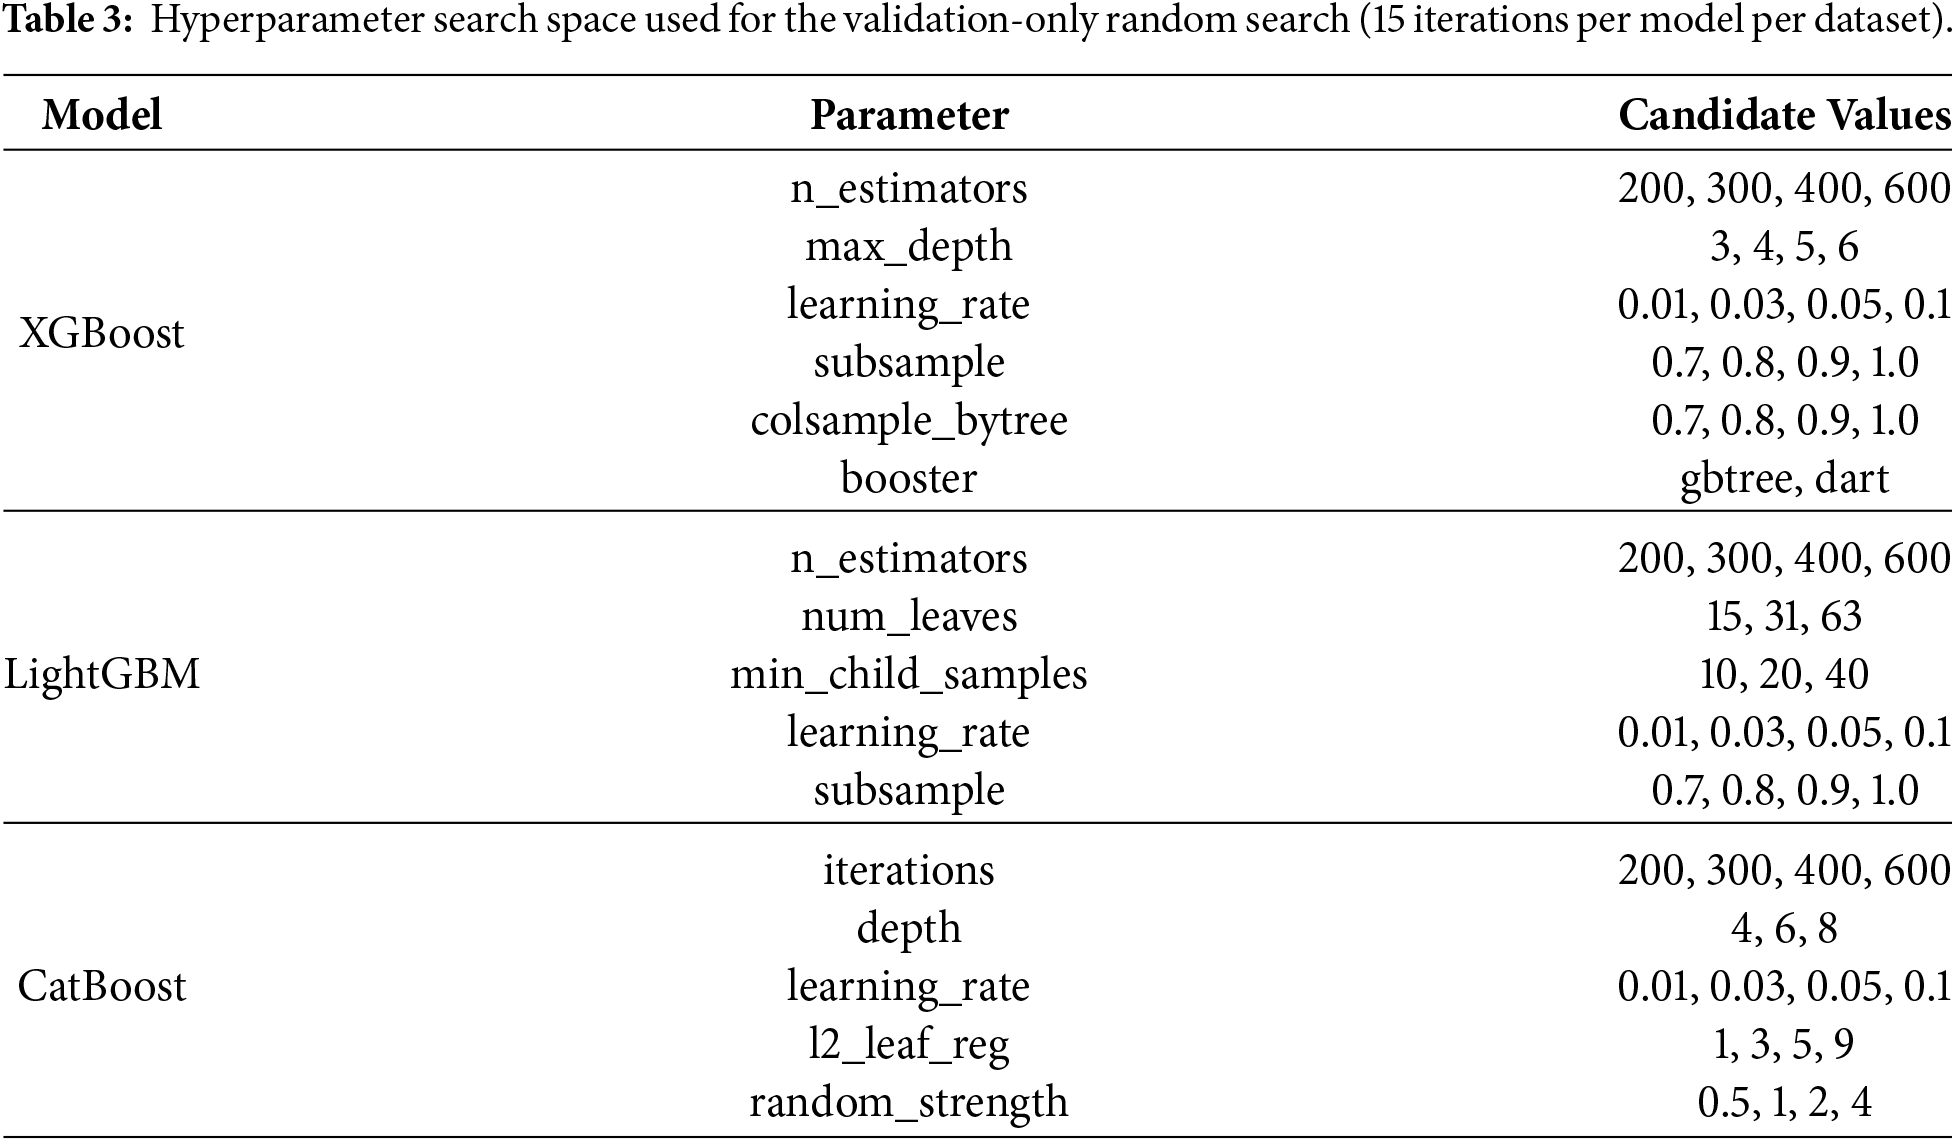
Table 4 lists the validation-selected configuration for each model on each dataset. Two patterns are visible. First, the selected configurations differ meaningfully across datasets—for example, XGBoost’s booster switches from dart on datasets A, B, and C to gbtree on dataset D—which is expected under a protocol where selection responds to genuine differences in each dataset’s structure rather than converging on a single global optimum. Second, because selection is now driven by validation ROC-AUC rather than by directly-observed test accuracy, the specific values differ from those reported in the earlier, leakage-affected version of this study; this is the intended effect of the correction, not an inconsistency.
A prediction without justification has limited value in an operational security context, where analysts must decide whether to act on an alert and defend that decision if challenged. This section describes the explainability layer applied uniformly across all three trained models on all four datasets.
We use Shapley Additive Explanations (SHAP) [31] to attribute each model’s output to individual input features. SHAP is grounded in cooperative game theory: each feature is treated as a “player” contributing to a “payout” (the model’s prediction), and the Shapley value fairly distributes that payout across all features based on their marginal contribution across every possible feature subset. Formally, the Shapley value for feature
where
4.2 A Quantitative Criterion for Feature Reliance
The earlier version of this study used the terms “non-trivial” and “negligible” to describe SHAP-attributed features descriptively, without a stated quantitative rule. We formalize this distinction here. For each trained model
i.e., its mean absolute SHAP value exceeds 5% of that model’s largest mean absolute SHAP value on that dataset. This threshold is applied identically across all three models and all four datasets and is used consistently throughout Section 6.
4.3 From Attribution to Decision-Making
The framework produces three complementary levels of explanation, extended in this revision beyond the two used previously. Global explanations aggregate SHAP values across the entire test set to rank which features consistently drive predictions, summarized per model as ranked bar charts (mean
This structure is what distinguishes the proposed framework from simply reporting accuracy: it allows a direct comparison of decision quality across models, not just decision correctness. Section 6 uses this comparison, together with a direct adversarial evasion test (Section 6.10), to differentiate XGBoost, LightGBM, and CatBoost beyond their accuracy scores.
Each of the four datasets (Table 1) was partitioned 60:20:20 into training, validation, and test sets using a fixed random seed. All three models were trained on the identical training split and evaluated on the identical held-out test split within each dataset, ensuring a fair, controlled comparison across models. As described in Section 3.3, the validation split—not the test split—was used to select hyperparameters; the test split was accessed exactly once, for the final metrics reported in Section 6.
Model performance was evaluated using standard classification metrics derived from the confusion matrix—true positives (TP), true negatives (TN), false positives (FP), and false negatives (FN), with the “phishing” class treated as positive, as defined in Eqs. (4)–(7):
To provide a fuller picture of model performance, three additional metrics are reported throughout: the area under the ROC curve (ROC-AUC), the area under the precision-recall curve (PR-AUC), and the Matthews correlation coefficient (MCC), which remains informative under class imbalance (Section 6.5). Alongside these metrics, SHAP-derived feature counts (Section 4) were used as a complementary indicator of explanation breadth for each model. Because a discriminative model is not necessarily a well-calibrated one, reliability diagrams (Section 6.4) were also produced for all three models on all four datasets, to check whether predicted probabilities can be interpreted at face value rather than only used for ranking.
Classification threshold selection was evaluated explicitly rather than left at the default 0.5. For each model and dataset, Youden’s J statistic [33] (
Statistical significance between models was assessed on the primary dataset (A) using two complementary approaches: paired McNemar’s test [34] on matched test-set predictions between each pair of models, and five independent training runs per model using different random seeds (42–46), from which the mean and standard deviation of each metric are reported. Realistic class imbalance was evaluated on dataset A by re-sampling the test set to a 90:10 legitimate-to-phishing ratio and re-computing all metrics without retraining.
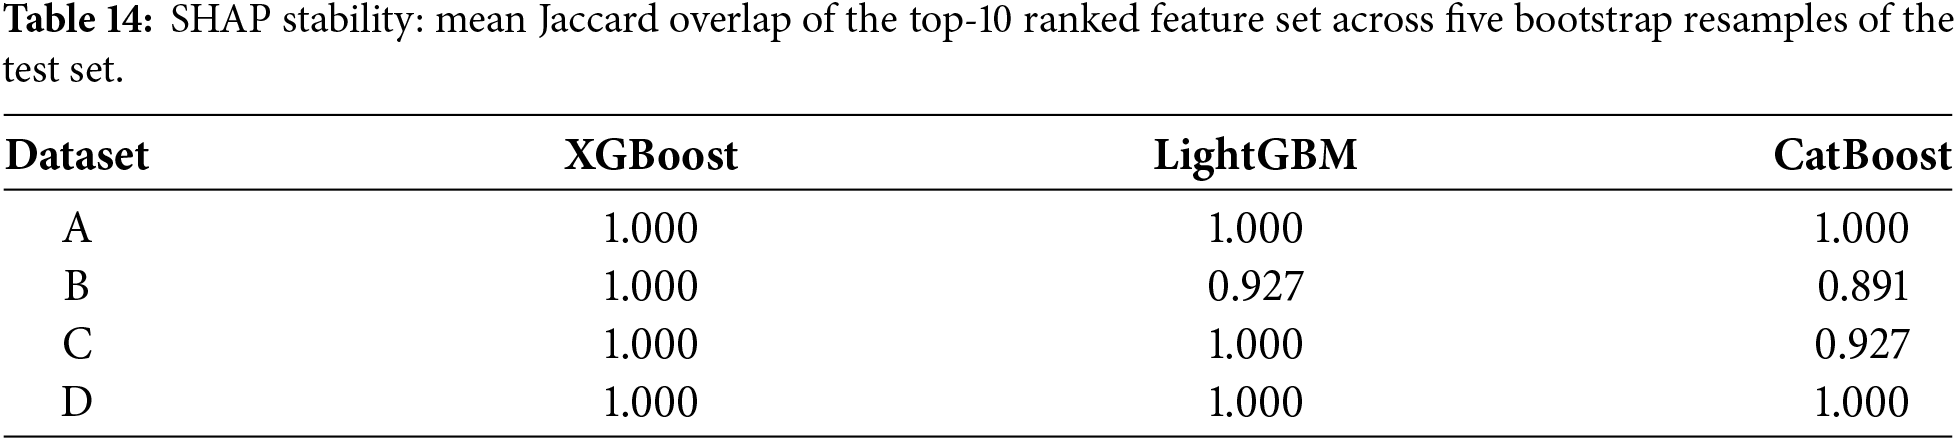
For the explainability framework, SHAP faithfulness was evaluated by removing each model’s top-5 and top-10 SHAP-ranked features and measuring the resulting drop in ROC-AUC and F1 relative to the full-feature model. Stability was evaluated by computing the mean Jaccard overlap of the top-10 SHAP-ranked feature set across five bootstrap resamples of the test set. Analyst actionability was evaluated by categorizing each model’s top-10 SHAP-ranked features (per dataset) into four groups—URL structure (instantly checkable by eye), domain/host signals (checkable via a quick WHOIS or DNS lookup), page content or behavioral signals (requiring the page to be loaded), and other/opaque statistical composites—and reporting the percentage of top-10 features falling into the two directly actionable categories. This categorization was implemented as a deterministic, keyword-based classifier (a fixed, fully disclosed keyword list mapping feature-name substrings to categories, applied identically to every feature), designed and applied by a single author (S. M. N. Ahmed); it was not independently re-implemented or re-checked by a second author, and no inter-rater agreement statistic was computed. We note this as a limitation of the actionability assessment in Section 7. Finally, a SHAP-guided adversarial evasion experiment perturbed the top-5 and top-10 SHAP-ranked features of 300 correctly classified phishing samples per dataset (Gaussian perturbation,
6.1 Classification Performance across Datasets
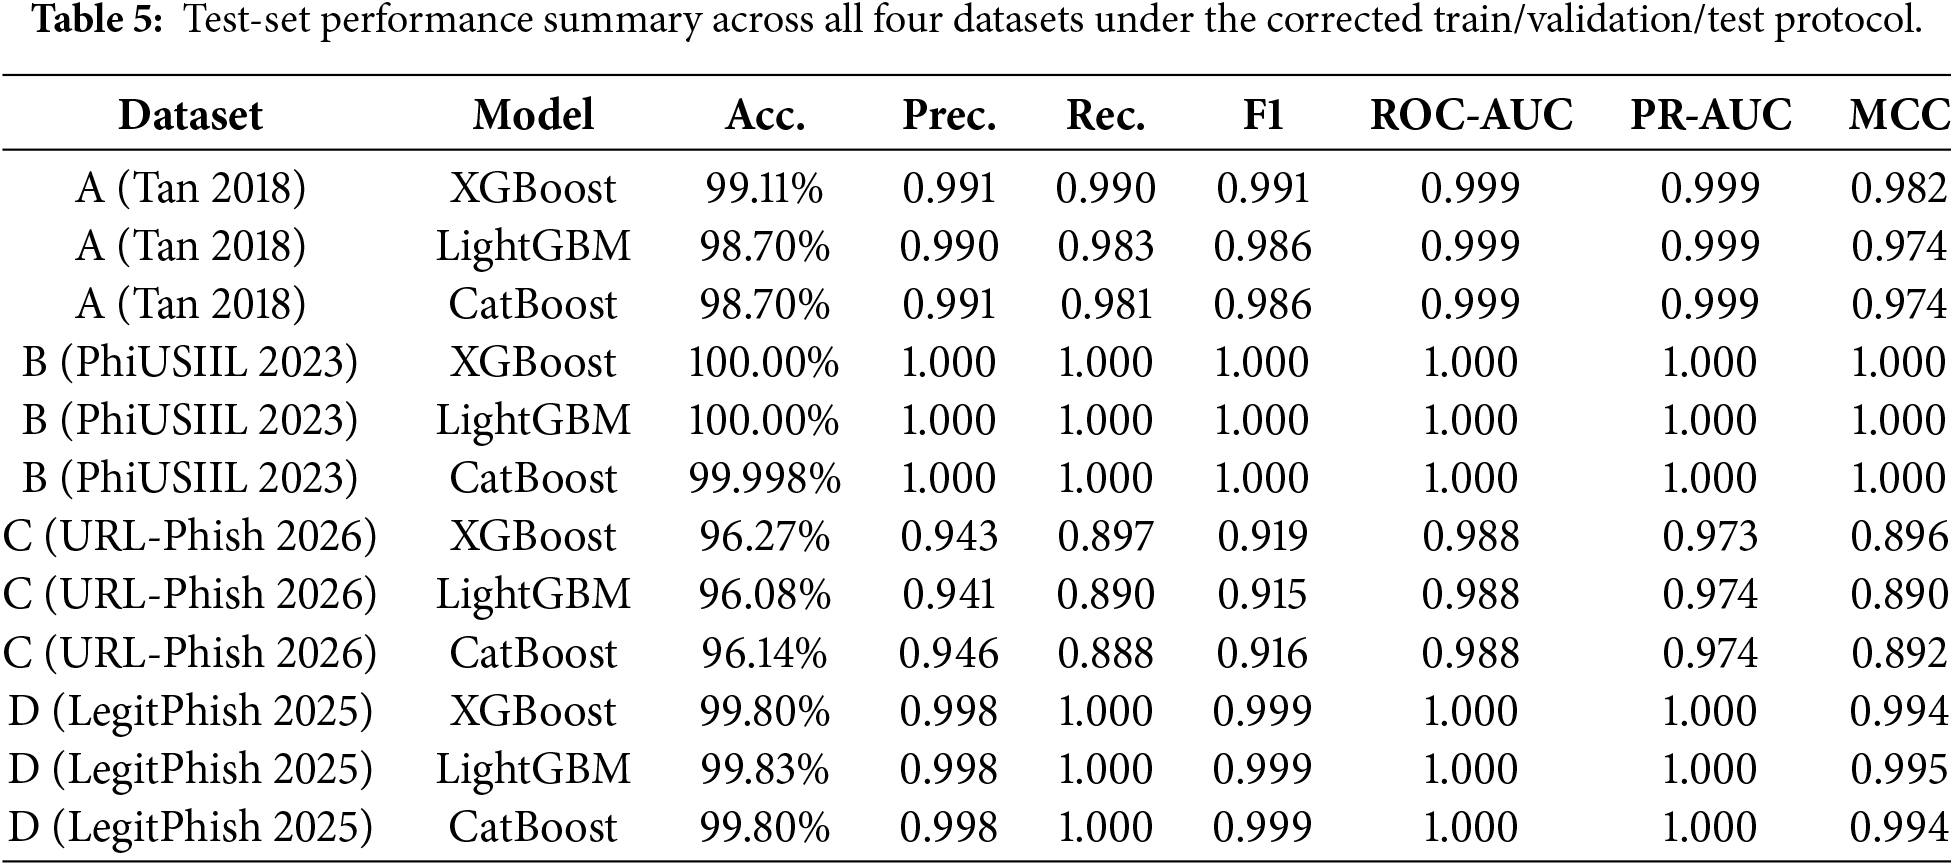
Table 5 summarizes accuracy, precision, recall, F1, ROC-AUC, PR-AUC, and MCC for all three models on all four datasets, computed once on each held-out test partition under the corrected protocol of Section 3.3. On the primary benchmark (dataset A), XGBoost achieved the highest test accuracy (99.11%, F1 = 0.991, MCC = 0.982), narrowly ahead of LightGBM and CatBoost, which tied at 98.70% accuracy (F1 = 0.986 for both). This ordering differs from the earlier, leakage-affected version of this study, in which CatBoost had nominally led; under the corrected protocol, XGBoost is the nominal top performer on dataset A, though Section 6.2 shows this ordering is not statistically distinguishable from LightGBM’s or CatBoost’s performance. Statistical significance testing was performed on dataset A only (Section 6.2); the accuracy differences among models on datasets B, C, and D reported in Table 5 are therefore descriptive rather than statistically validated, and should not be read as establishing that any model is superior to, or statistically equivalent to, another on those three datasets.
Figs. 5–7 present the corresponding metric comparison, confusion matrices, and ROC/precision-recall curves for dataset A; the equivalent panels for datasets B–D appear in Figs. 8–16 and 17 summarizes accuracy across all four datasets in a single view.
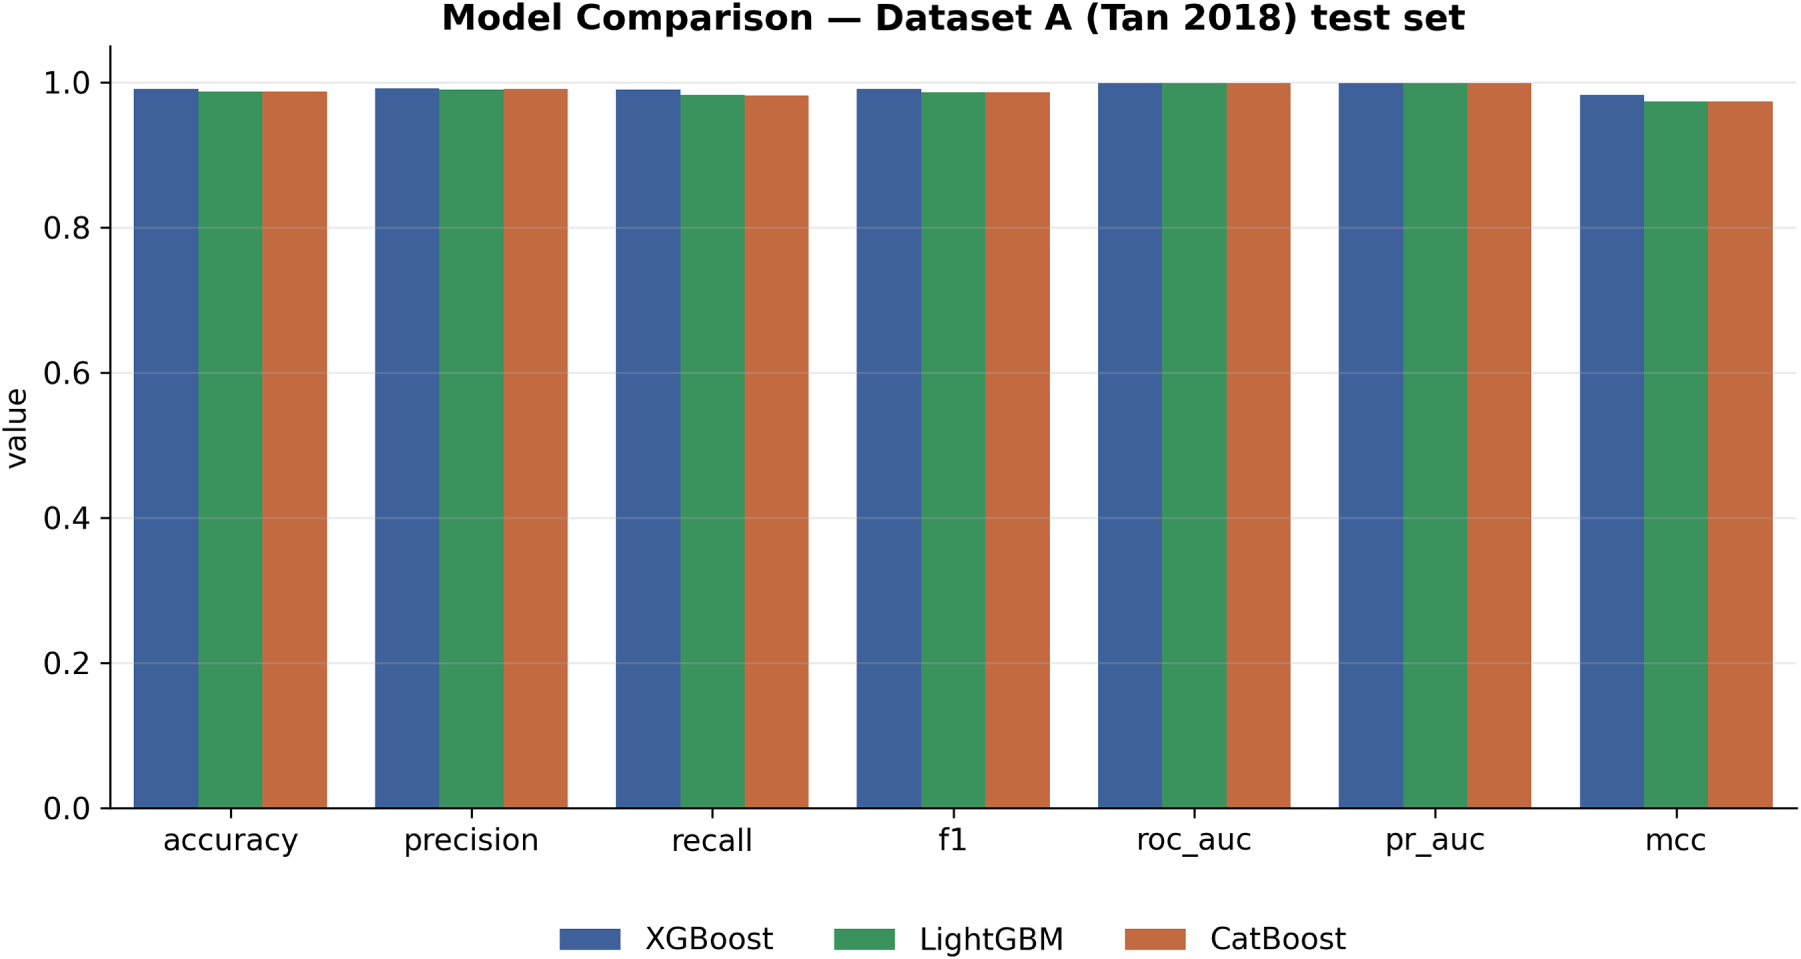
Figure 5: Accuracy, precision, recall, F1, ROC-AUC, PR-AUC, and MCC comparison across models, dataset A test set.
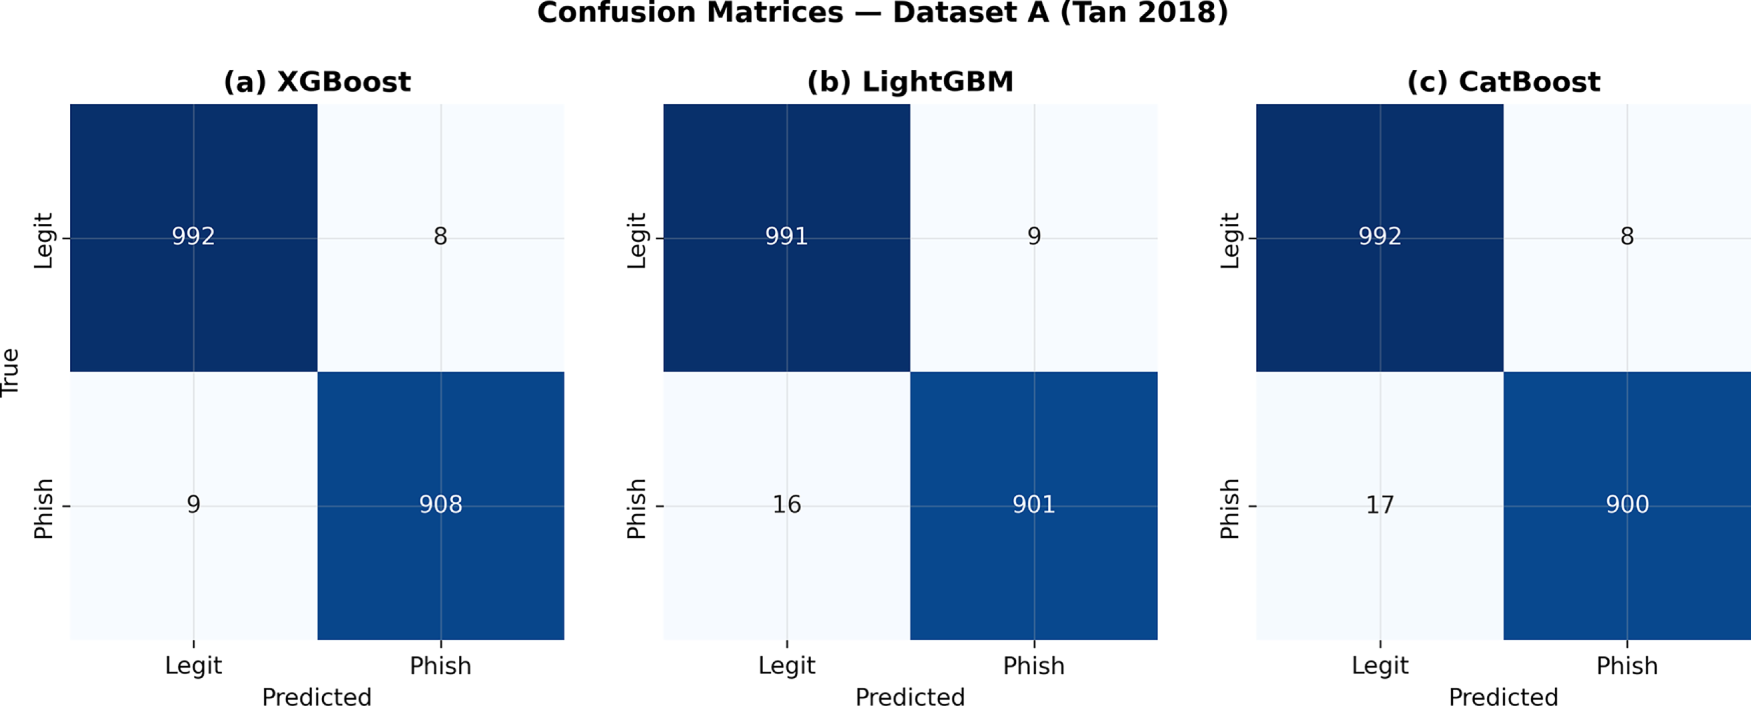
Figure 6: Confusion matrices for (a) XGBoost; (b) LightGBM; (c) CatBoost, dataset A test set.
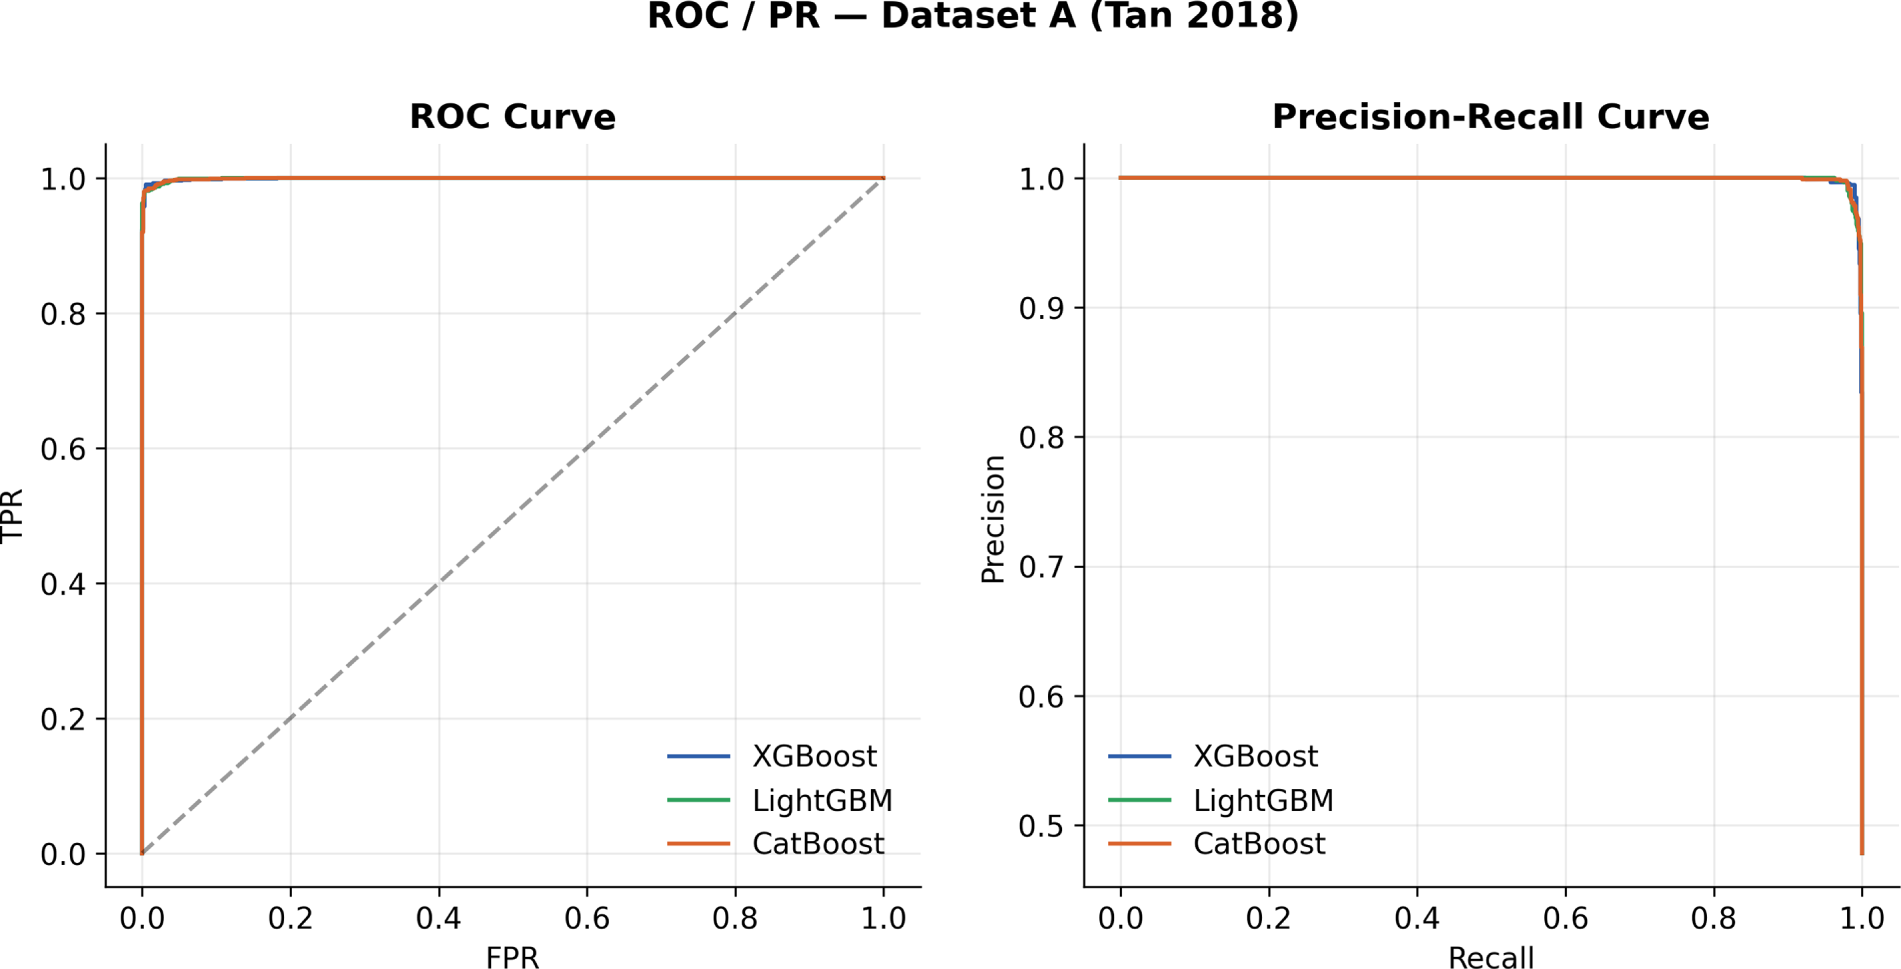
Figure 7: ROC and precision–recall curves for all three models, dataset A test set.
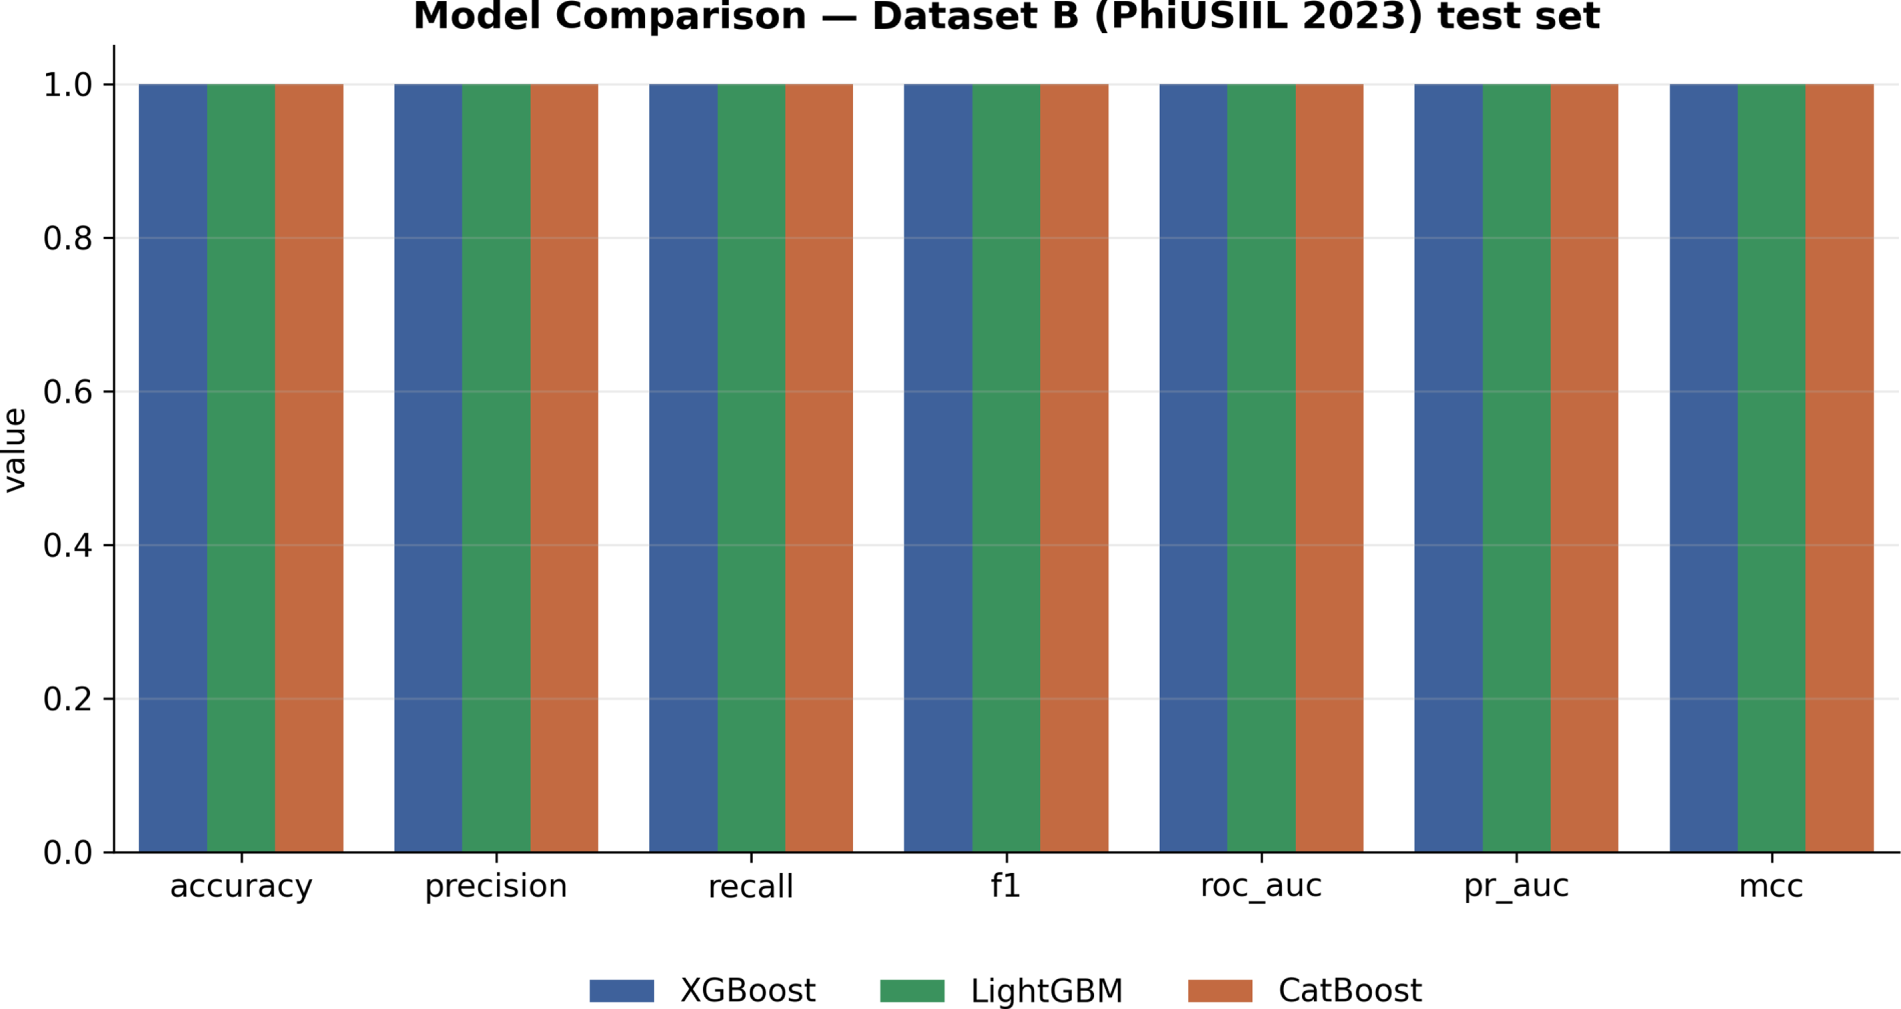
Figure 8: Accuracy, precision, recall, F1, ROC-AUC, PR-AUC, and MCC comparison across models, dataset B (PhiUSIIL) test set.
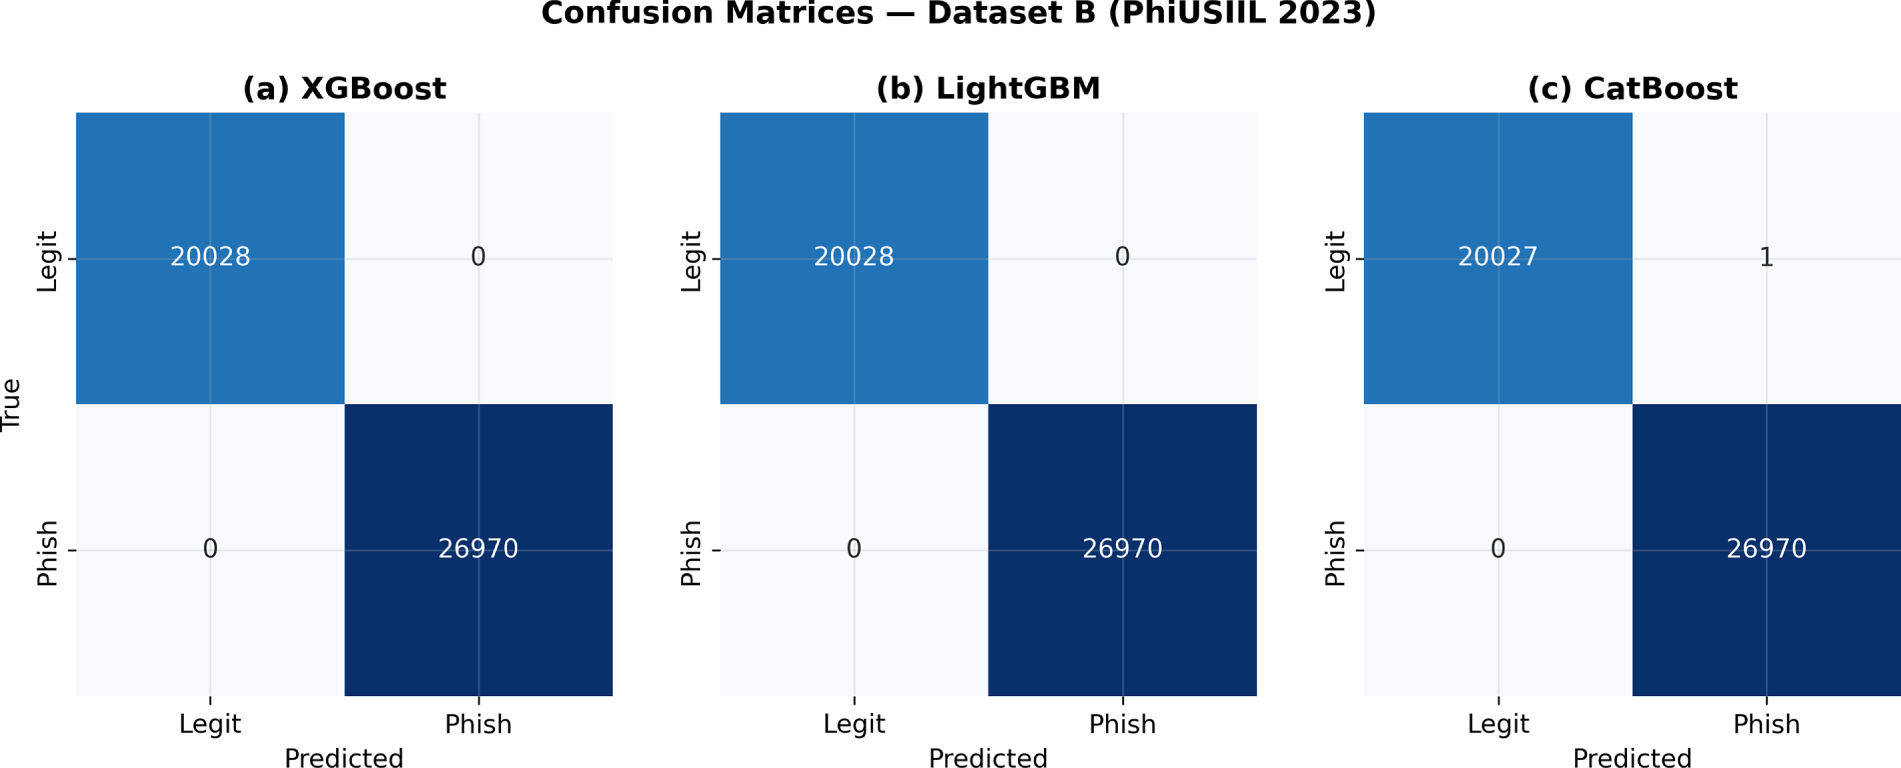
Figure 9: Confusion matrices for (a) XGBoost; (b) LightGBM; (c) CatBoost, dataset B test set.
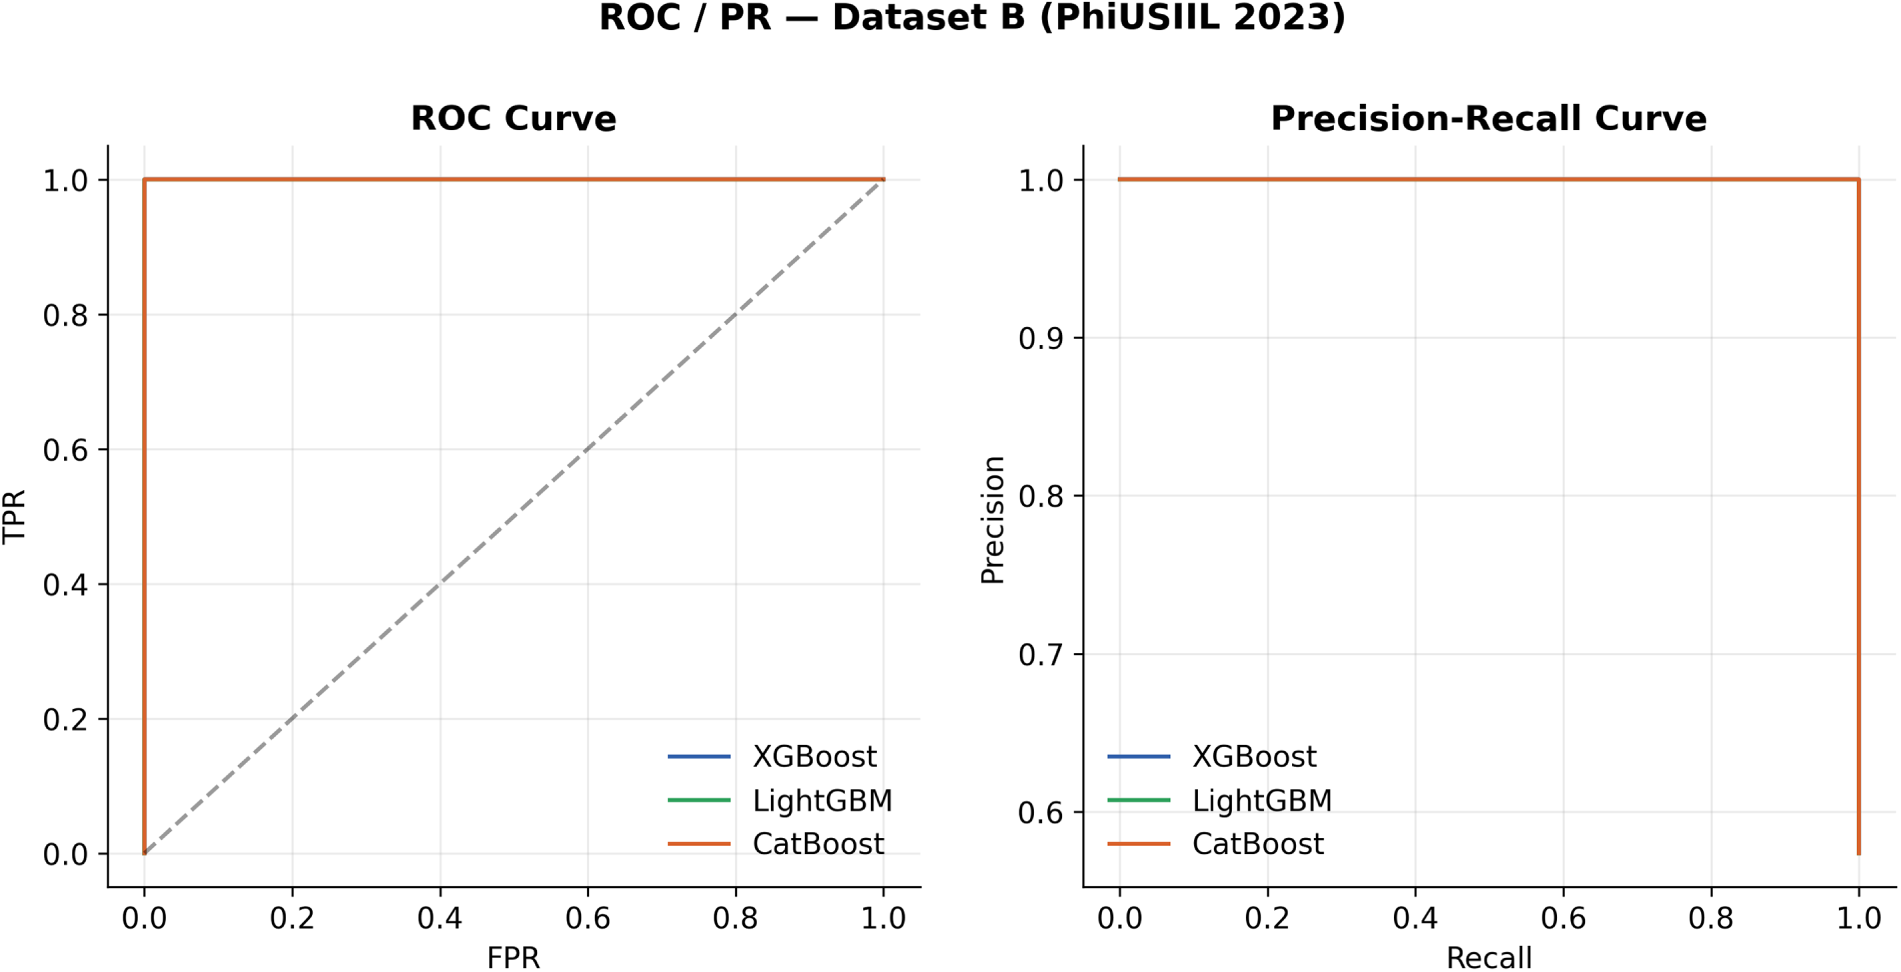
Figure 10: ROC and precision–recall curves for all three models, dataset B test set.
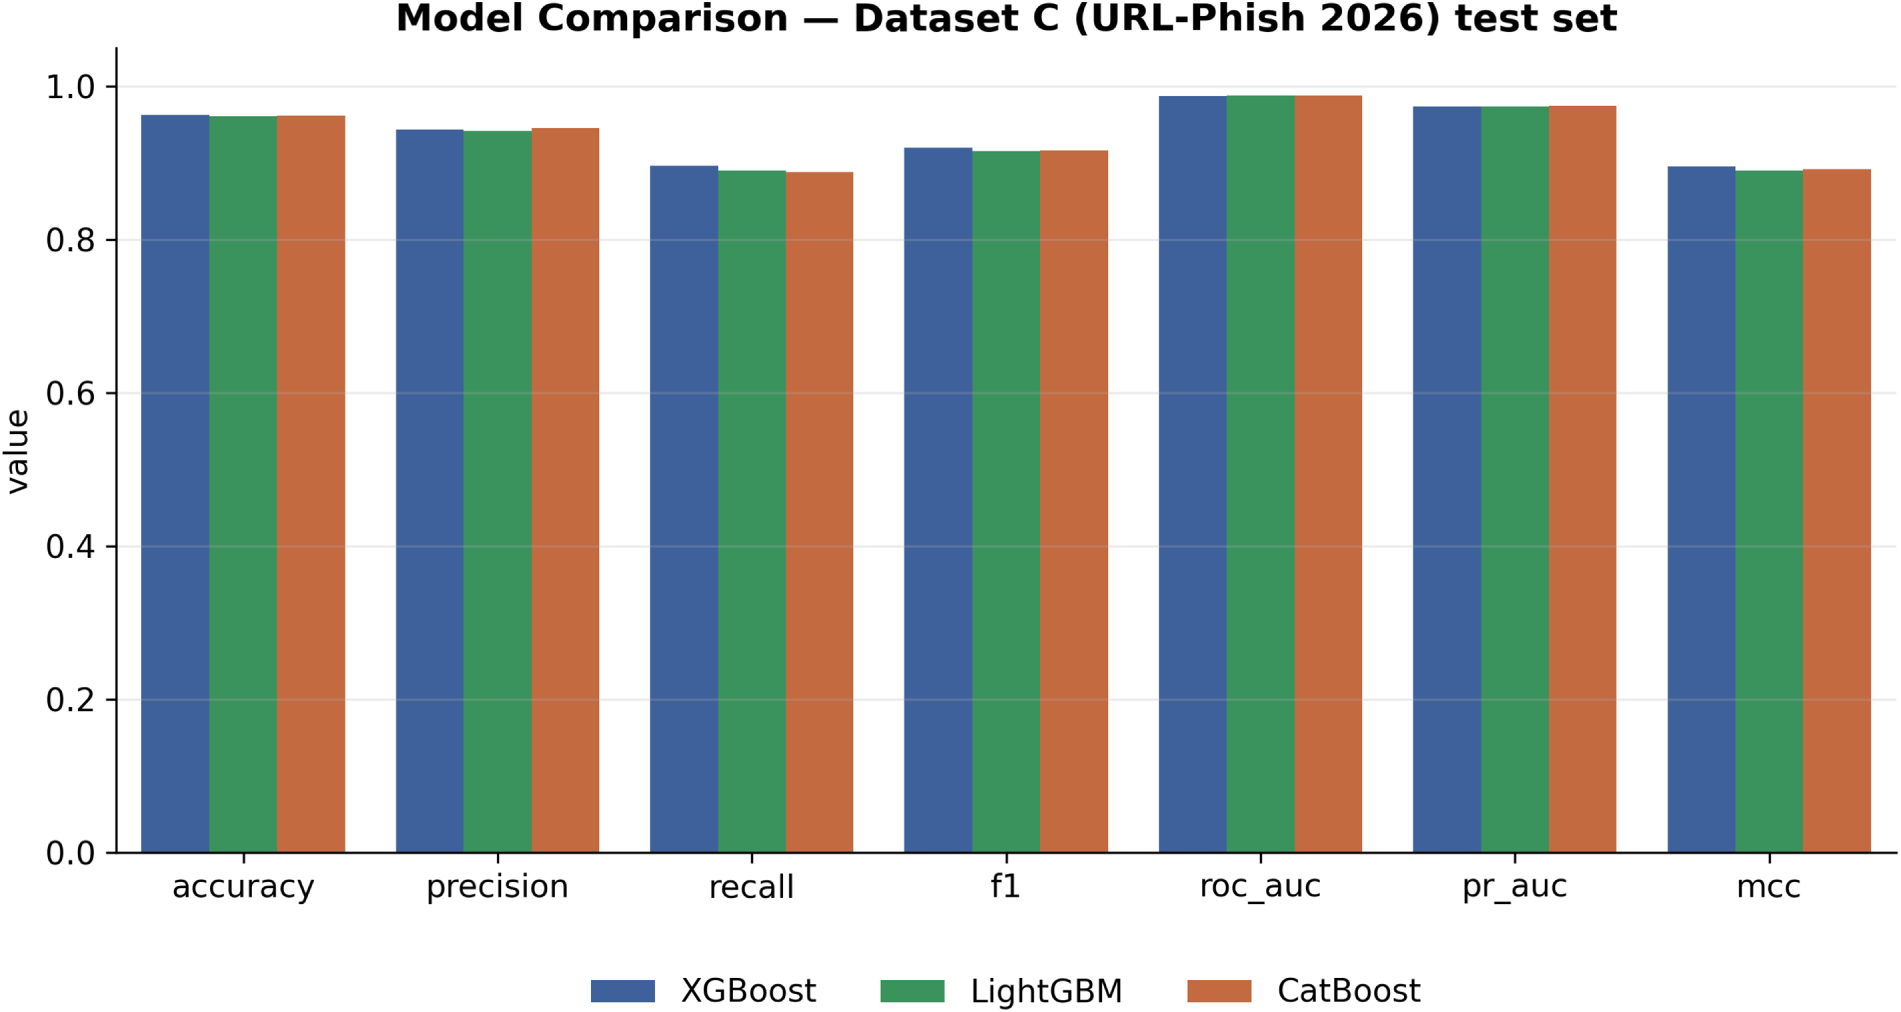
Figure 11: Accuracy, precision, recall, F1, ROC-AUC, PR-AUC, and MCC comparison across models, dataset C (URL-Phish 2026) test set.
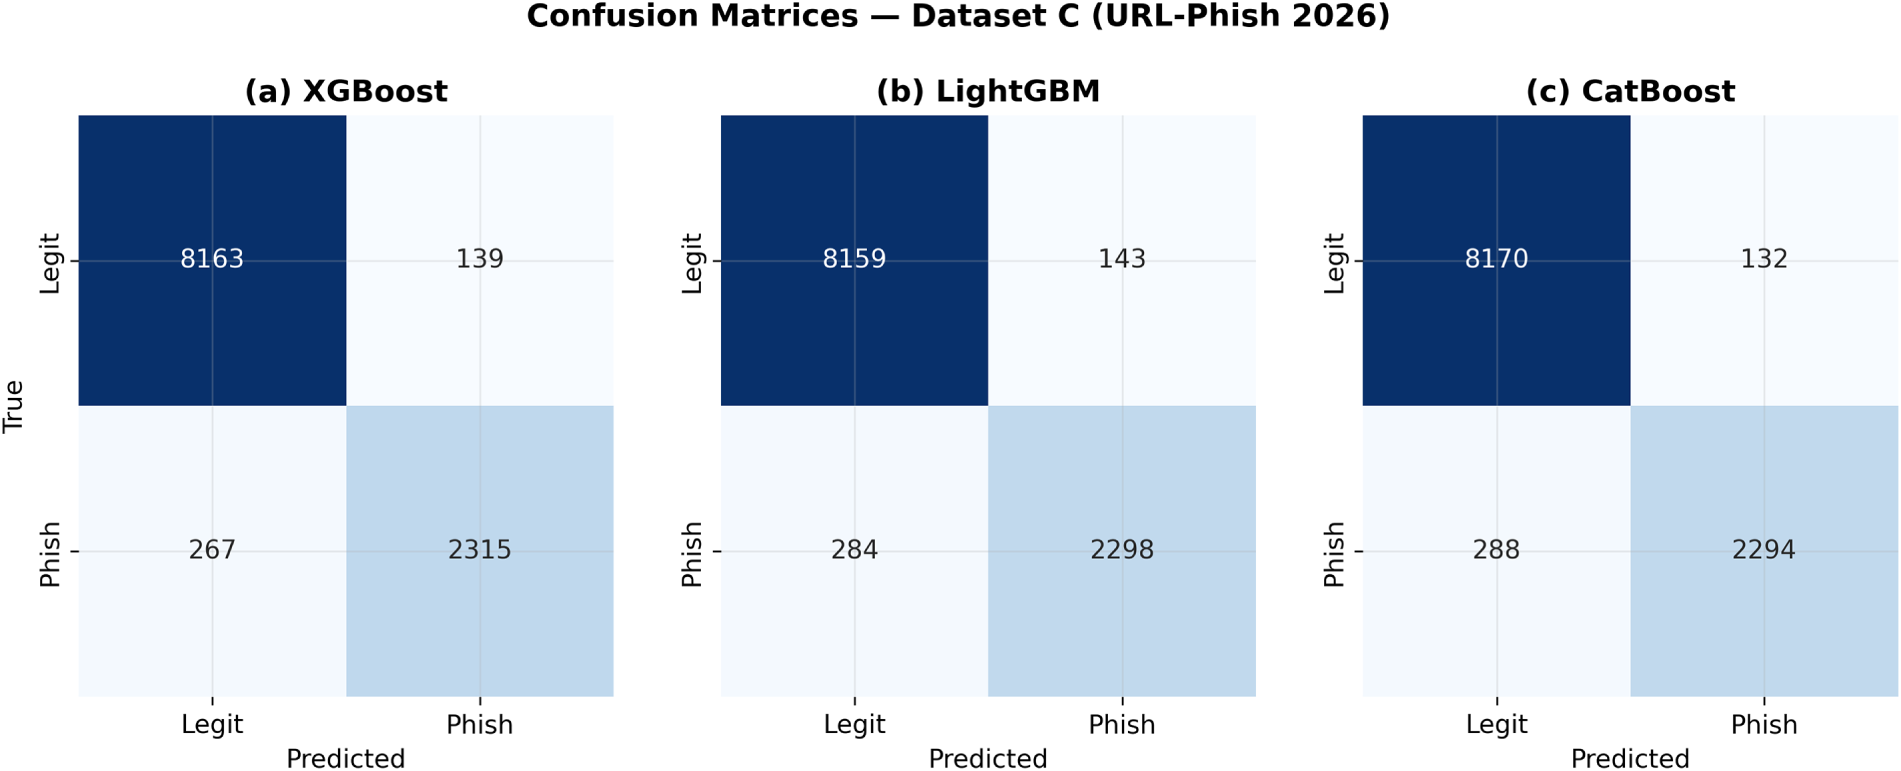
Figure 12: Confusion matrices for (a) XGBoost; (b) LightGBM; (c) CatBoost, dataset C test set.
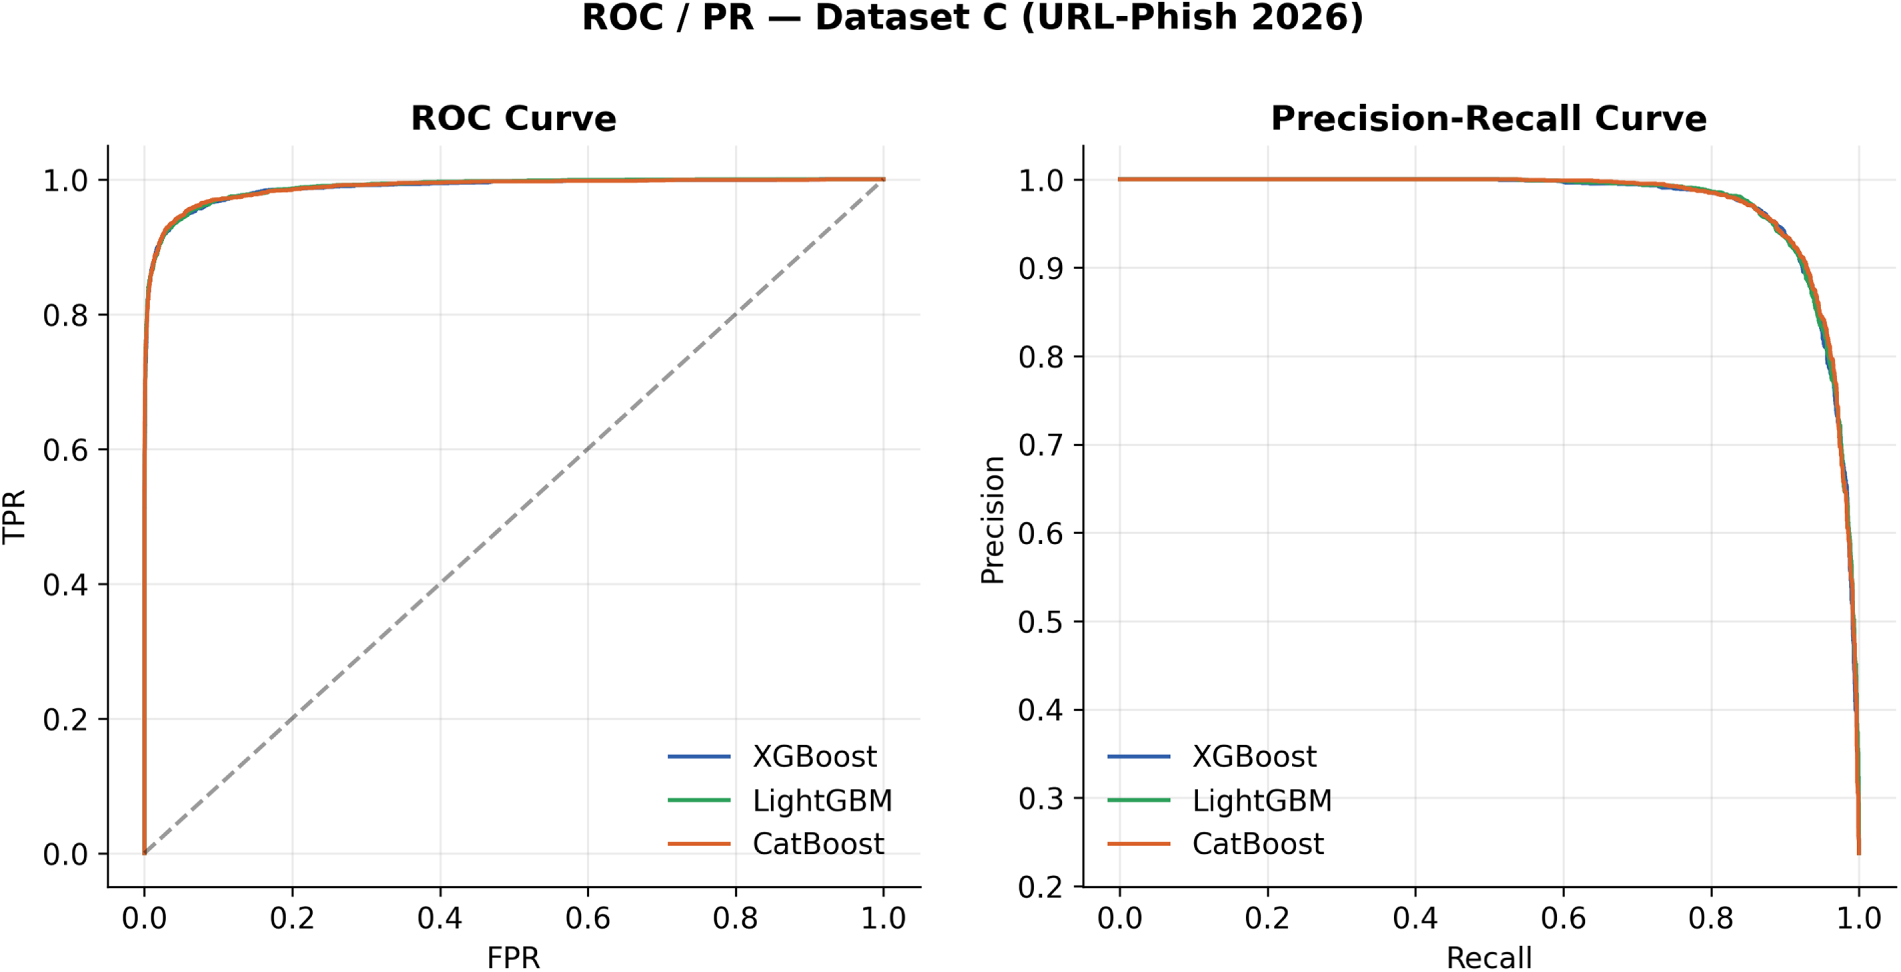
Figure 13: ROC and precision–recall curves for all three models, dataset C test set.
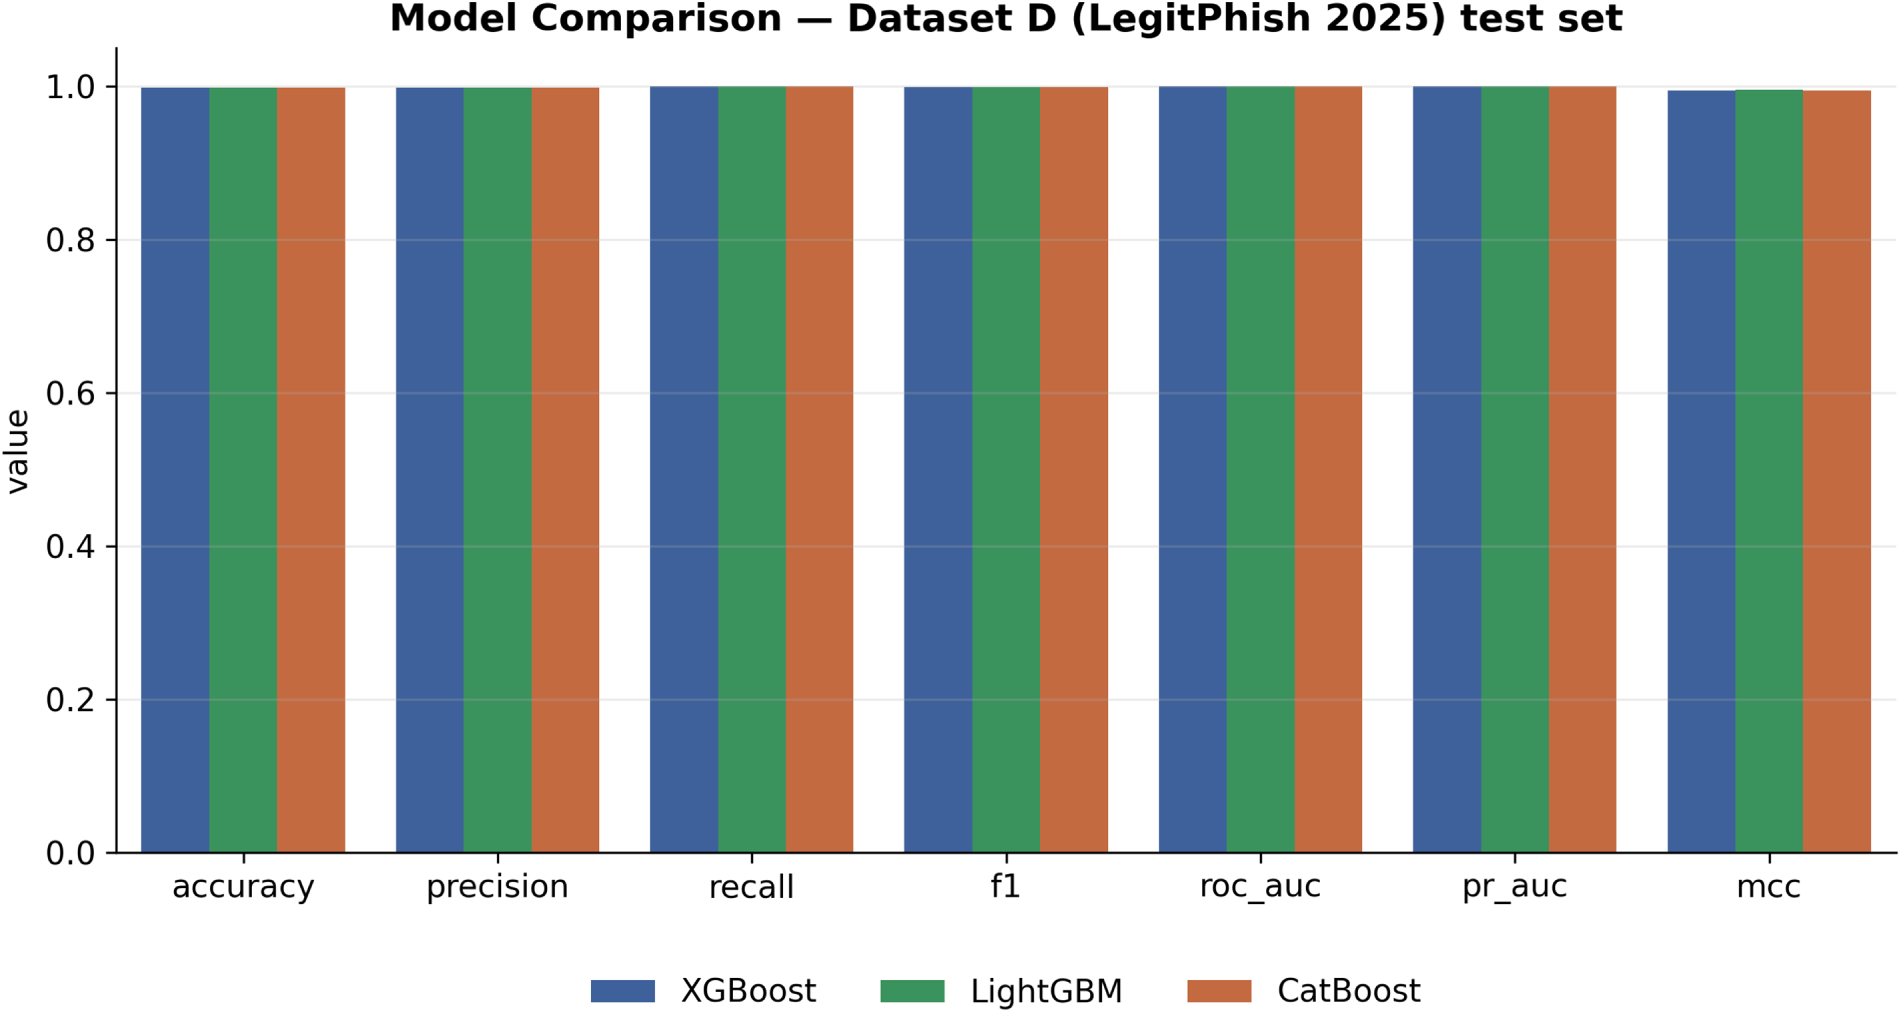
Figure 14: Accuracy, precision, recall, F1, ROC-AUC, PR-AUC, and MCC comparison across models, dataset D (LegitPhish) test set.
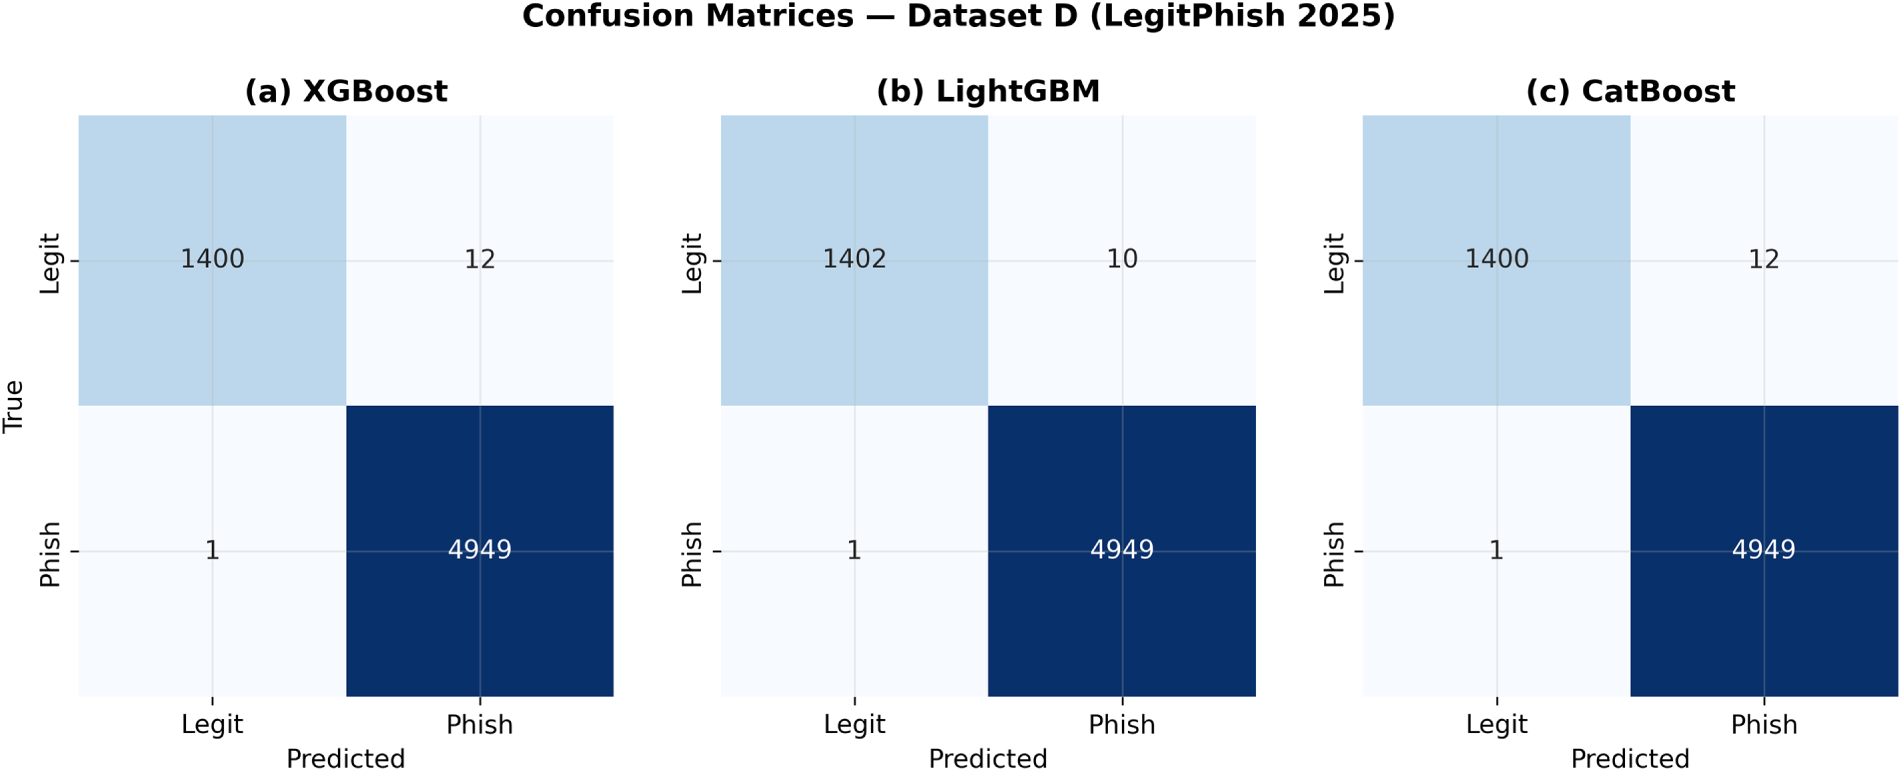
Figure 15: Confusion matrices for (a) XGBoost; (b) LightGBM; (c) CatBoost, dataset D test set.
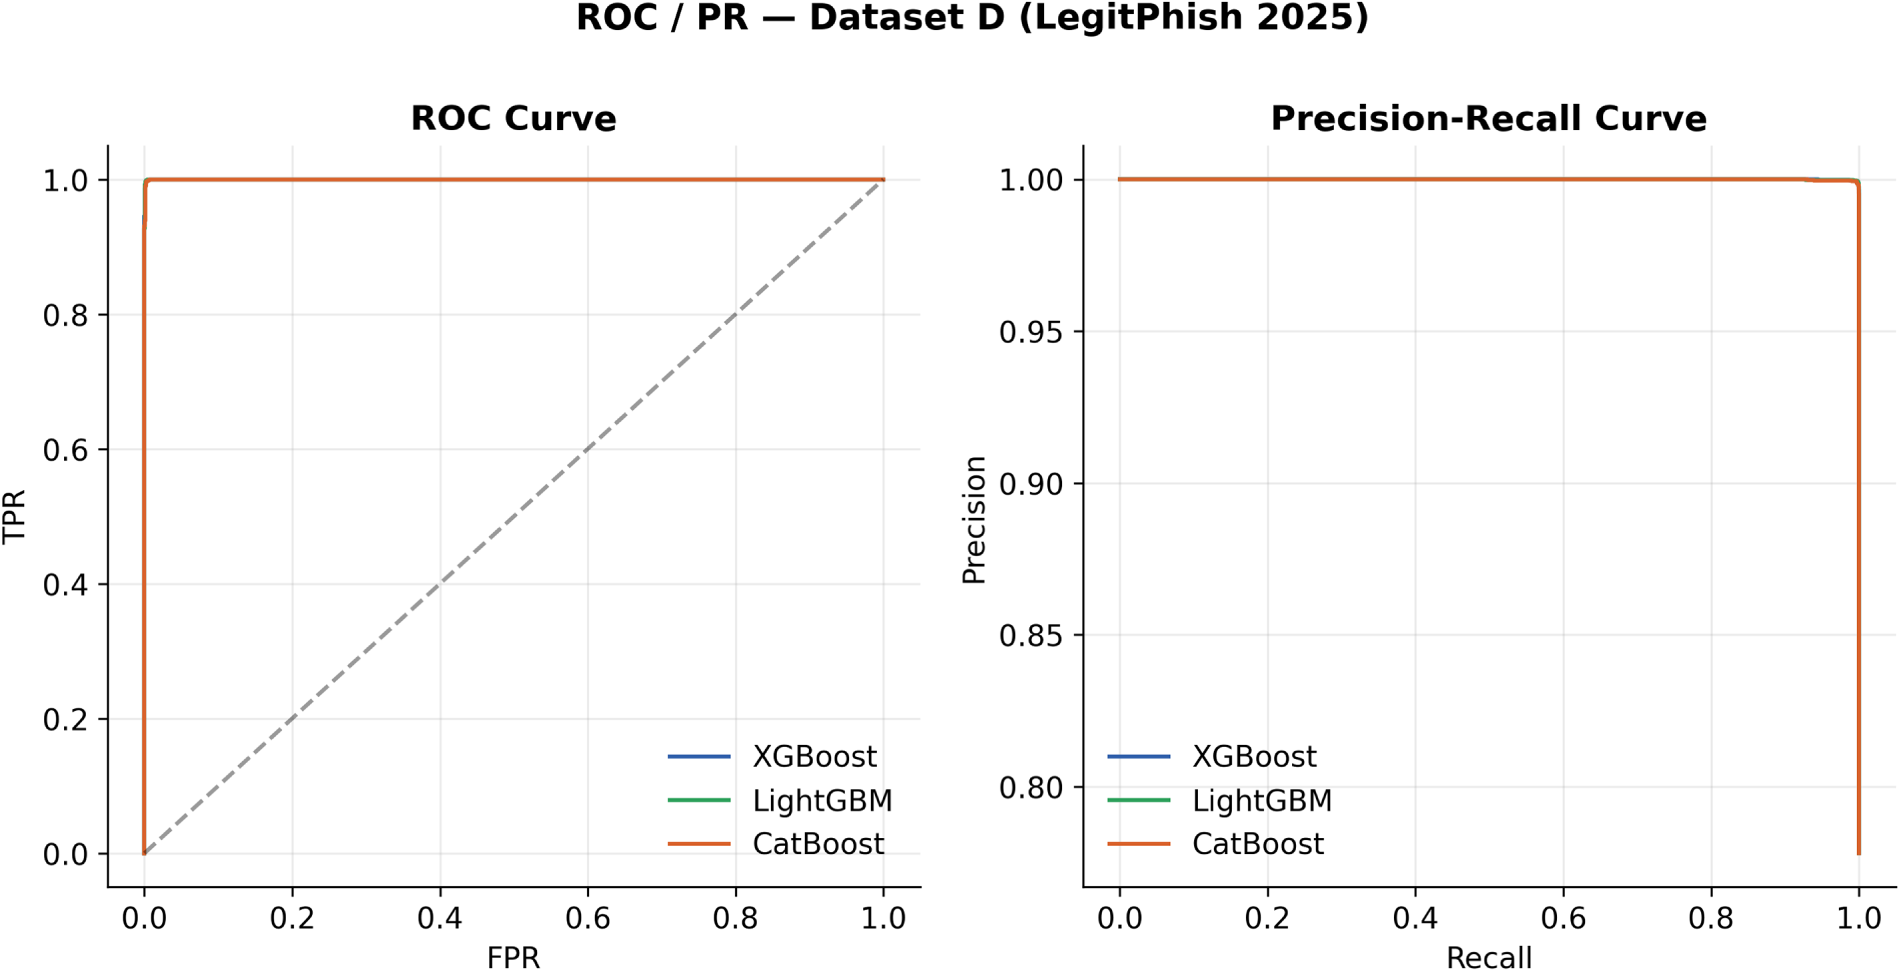
Figure 16: ROC and precision–recall curves for all three models, dataset D test set.
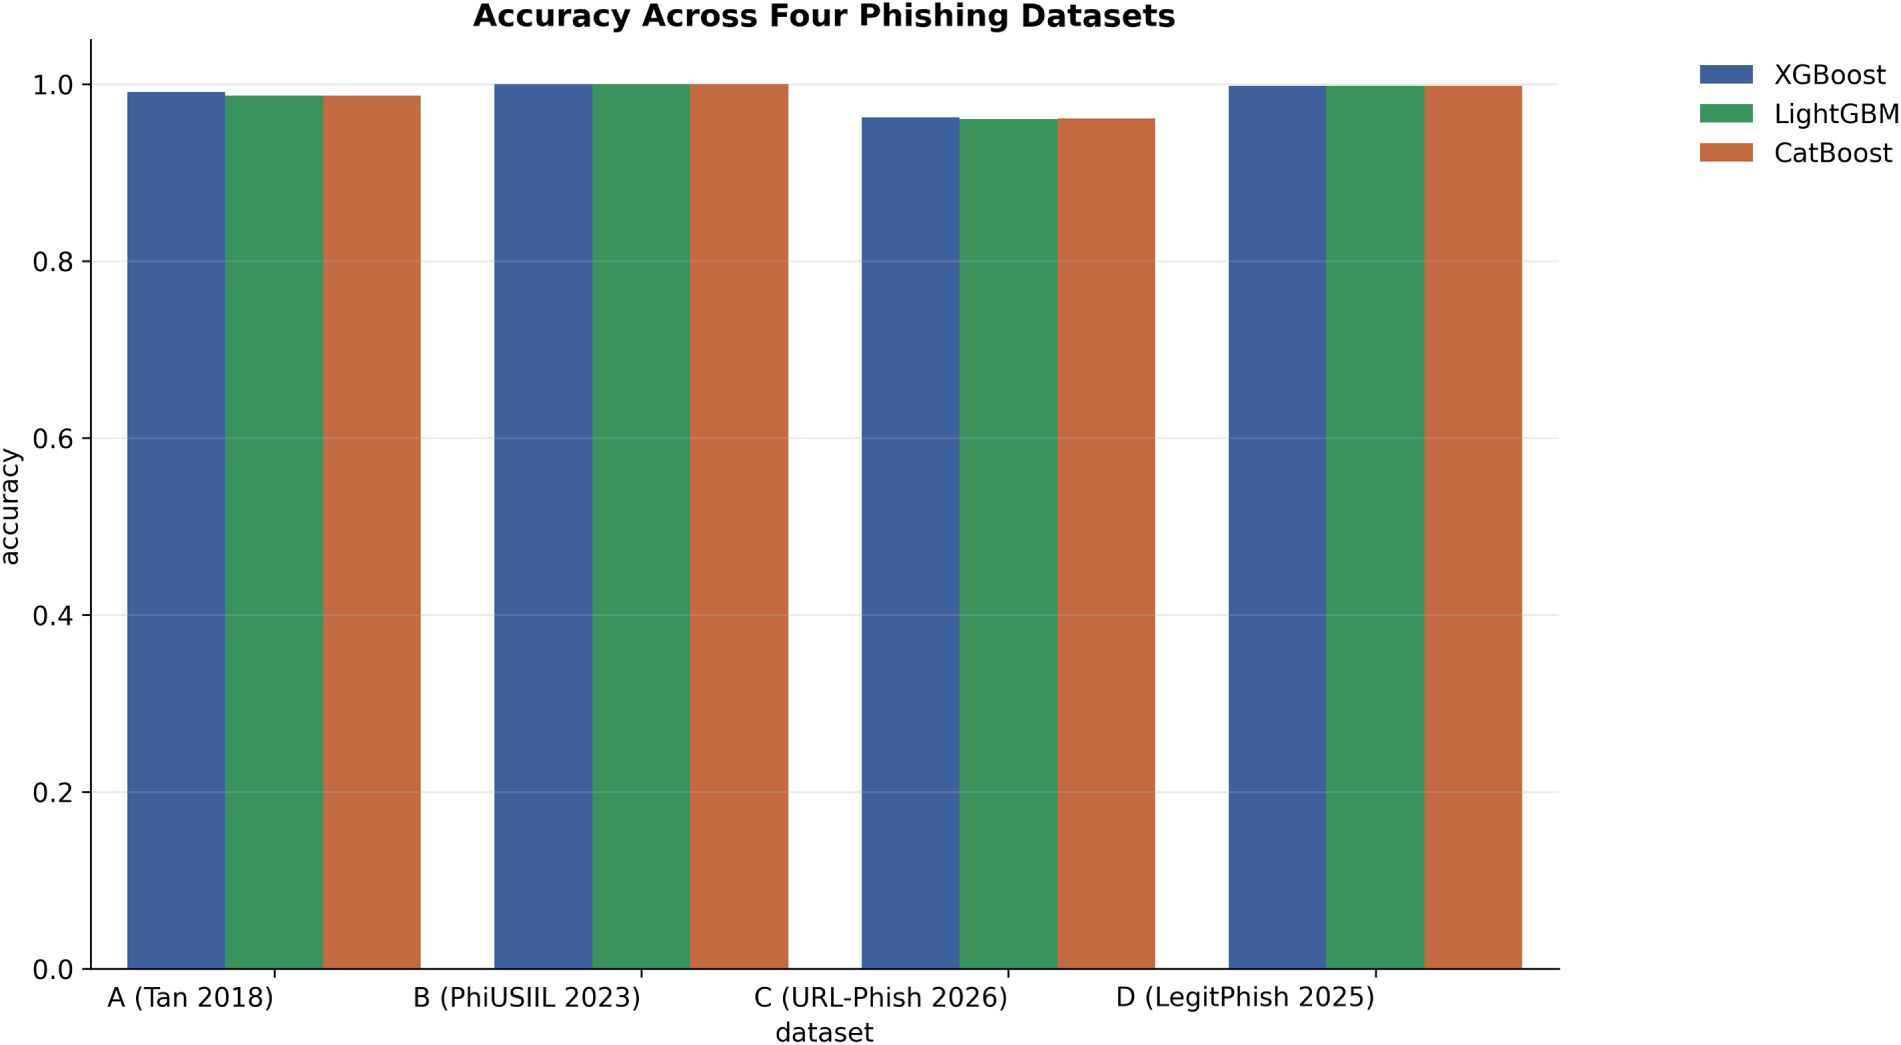
Figure 17: Test accuracy for XGBoost, LightGBM, and CatBoost across all four phishing datasets.
6.2 Statistical Robustness of the Model Ranking
The earlier version of this study reported an accuracy spread of 0.35 percentage points across the three models on dataset A and explicitly declined to treat that ranking as validated, since no significance test had been run. We now report that test. Table 6 shows paired McNemar tests on matched test-set predictions for all three model pairs on dataset A: none of the three pairwise differences reaches significance at
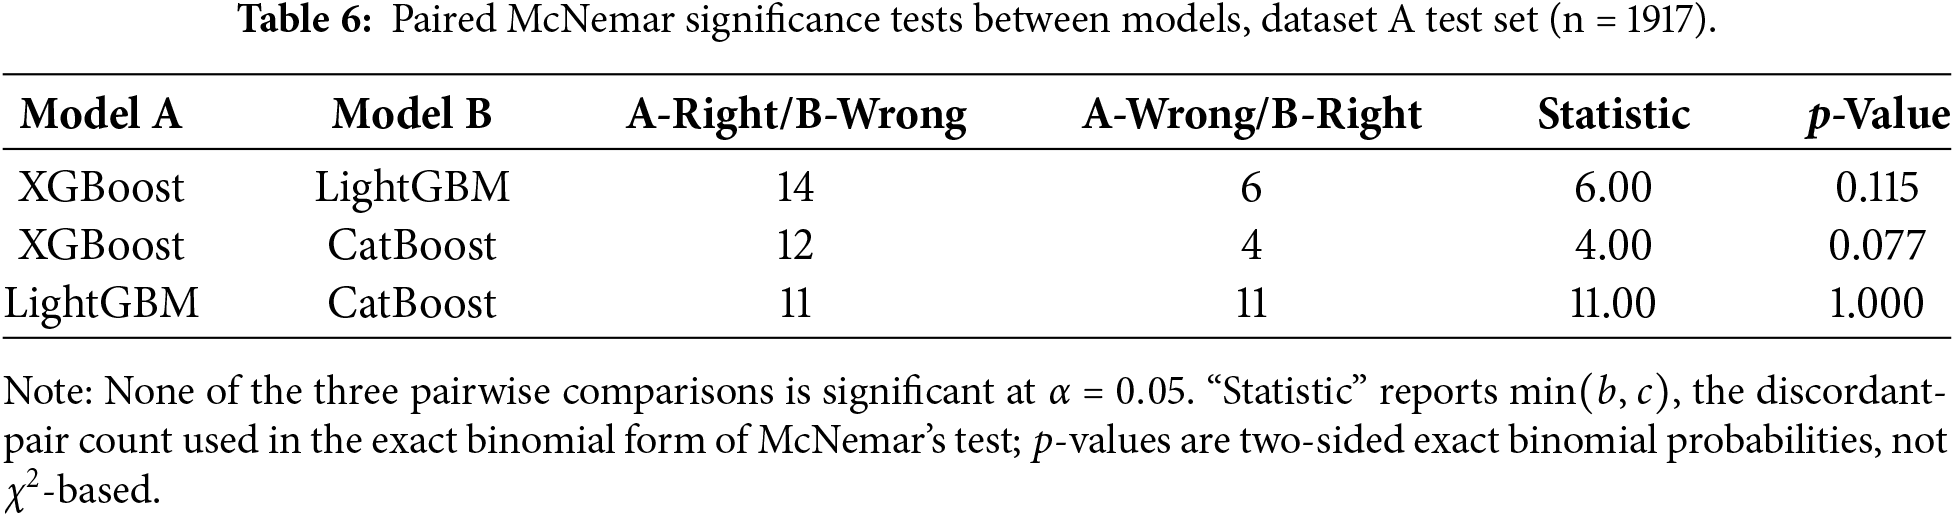

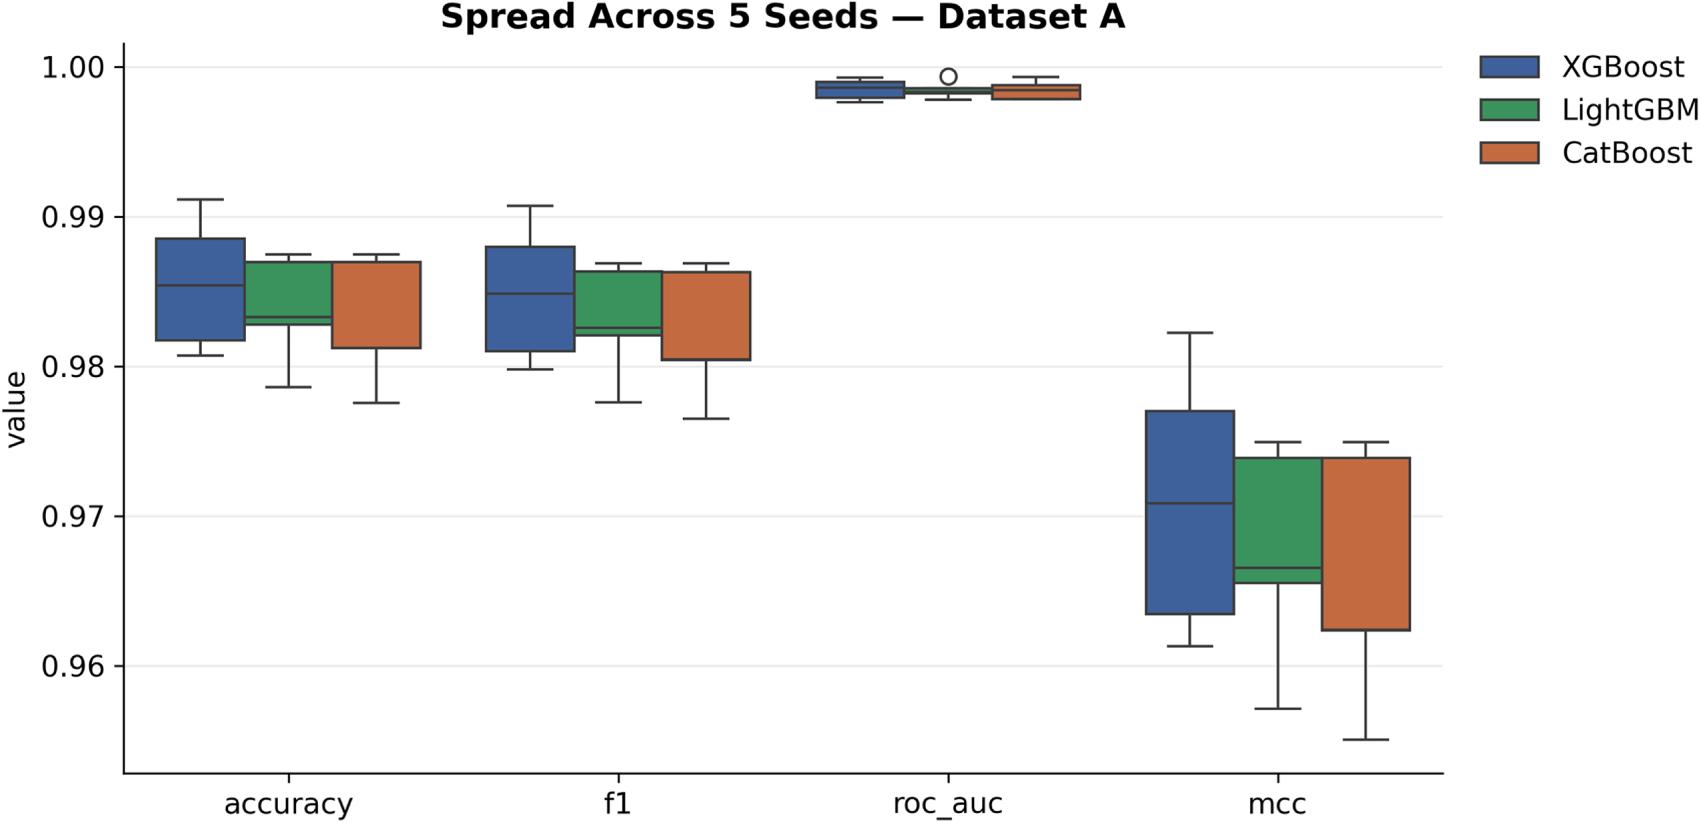
Figure 18: Distribution of test-set metrics across five random seeds (42–46), dataset A.
6.3 Effect of Classification Threshold
Reported accuracy in Table 5 uses the default 0.5 decision threshold. Because a security operations team may prefer to trade precision for recall (or vice versa) depending on alert-handling capacity, Table 8 additionally reports the validation-selected Youden’s-J threshold and its effect on test accuracy. The magnitude and even the direction of the shift away from 0.5 varies substantially by dataset: on dataset A, the selected thresholds for XGBoost and CatBoost stay close to 0.5 (0.441 and 0.457), while LightGBM’s validation-selected threshold is markedly lower (0.070), and applying it to the test set reduces accuracy by 0.47 percentage points relative to the default—because Youden’s J balances sensitivity and specificity rather than maximizing accuracy directly, this is expected rather than anomalous. On datasets B and D, where the models are highly confident, validation-selected thresholds sit close to 1.0. Fig. 19 visualizes the selected threshold against the 0.5 baseline for every model/dataset combination.
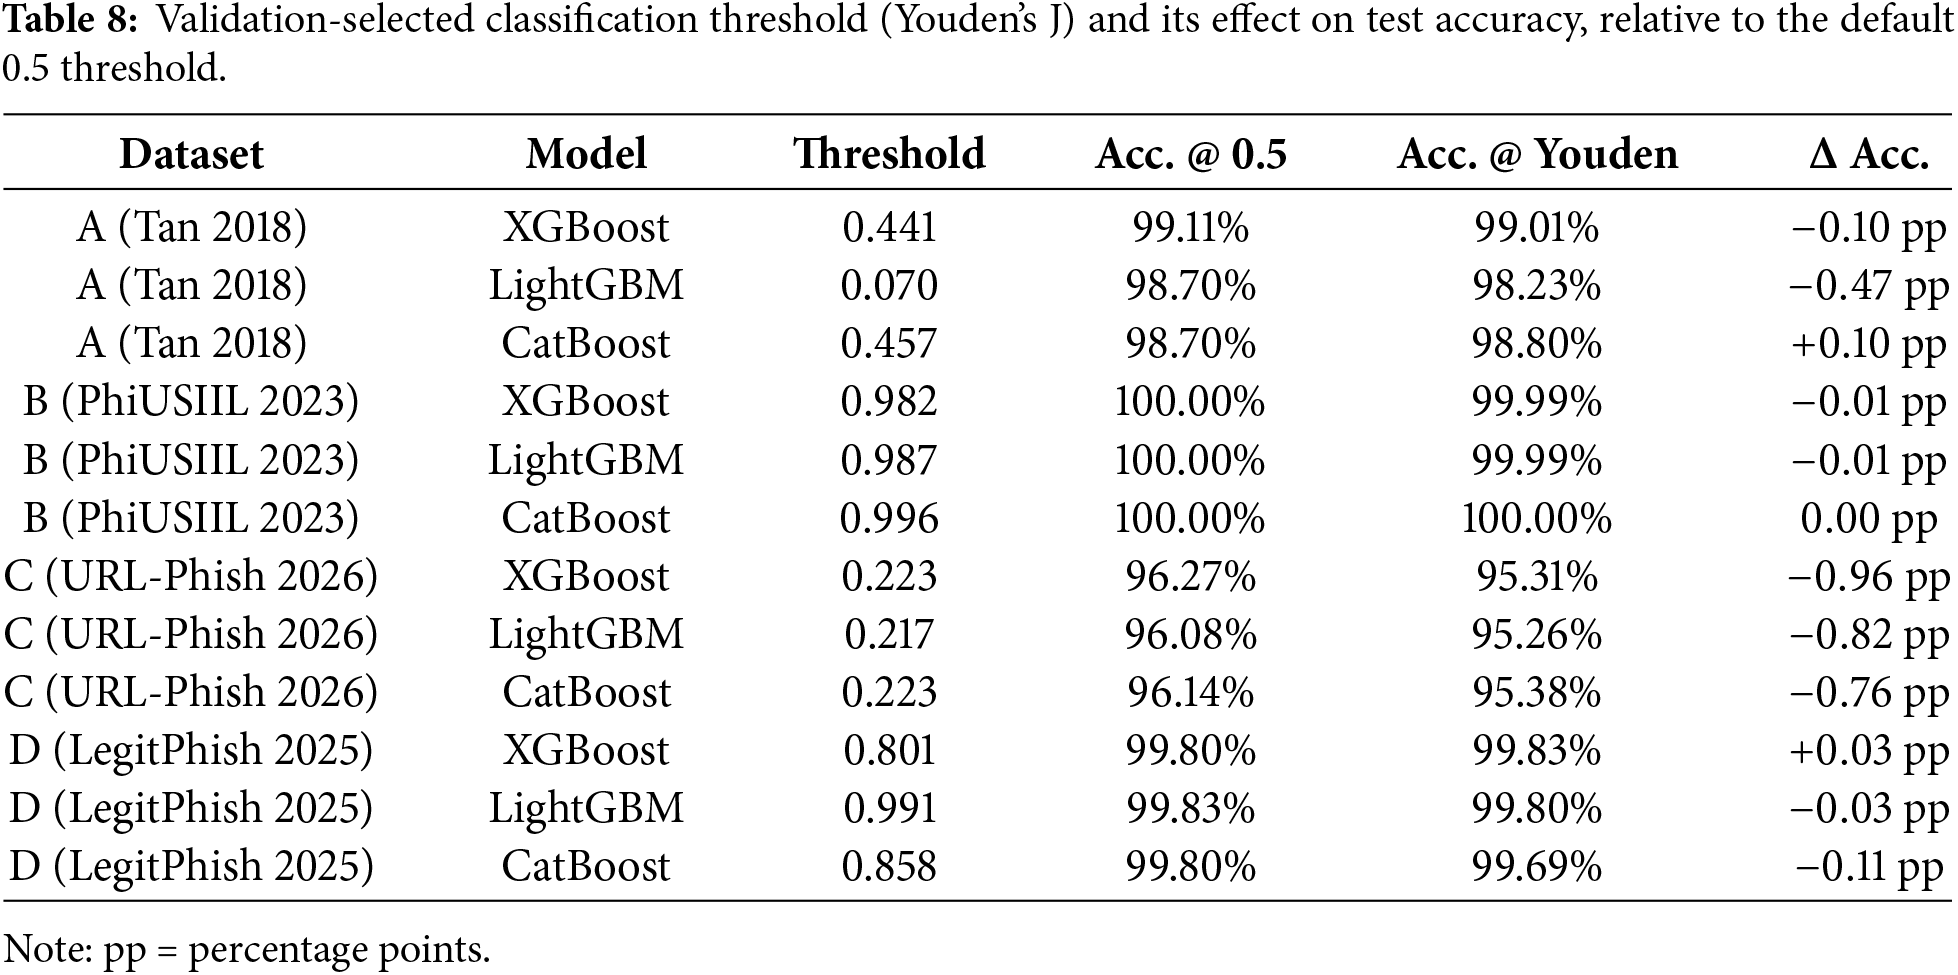
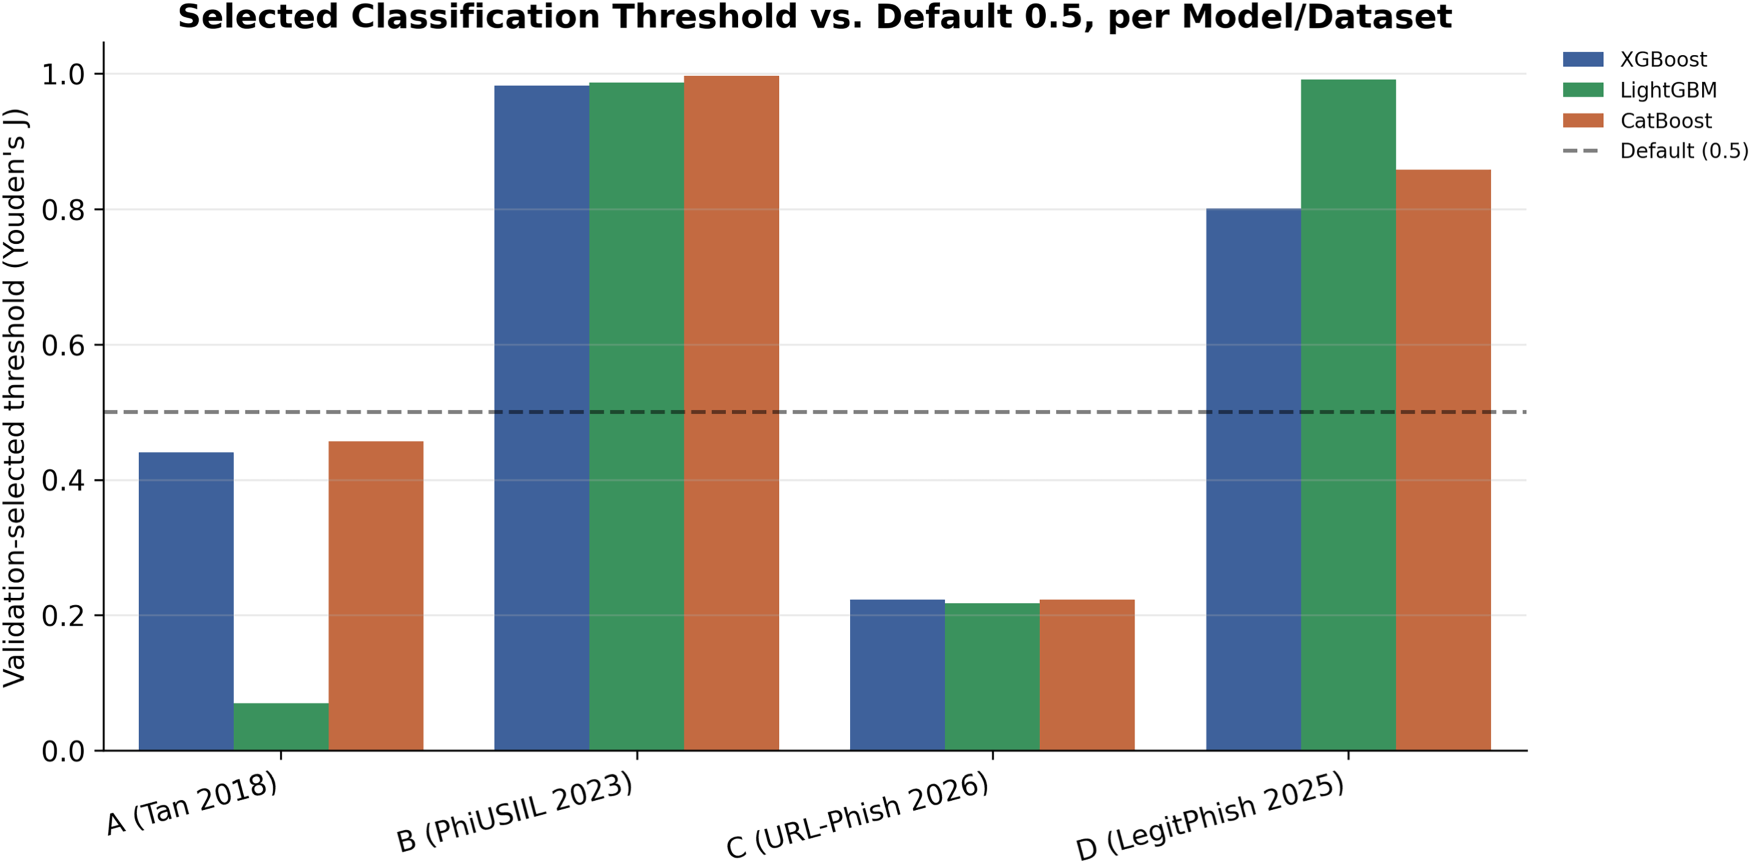
Figure 19: Validation-selected classification threshold (Youden’s J) vs. the default 0.5 threshold, by model and dataset.
Accuracy, ROC-AUC, and the threshold analysis above all evaluate the model as a ranker or a binary decision rule, but neither checks whether a predicted probability of, say, 0.7 corresponds to an empirical phishing rate of roughly 70% among similarly scored pages. This distinction matters operationally whenever predicted probabilities are used directly—to prioritize an analyst’s queue, to set a risk-proportionate action (block vs. flag vs. ignore), or to average scores across models—rather than only compared against a fixed threshold. We therefore report reliability diagrams (observed phishing frequency vs. mean predicted probability, computed over quantile-binned test-set predictions) for all three models on all four datasets in Figs. 20–23.
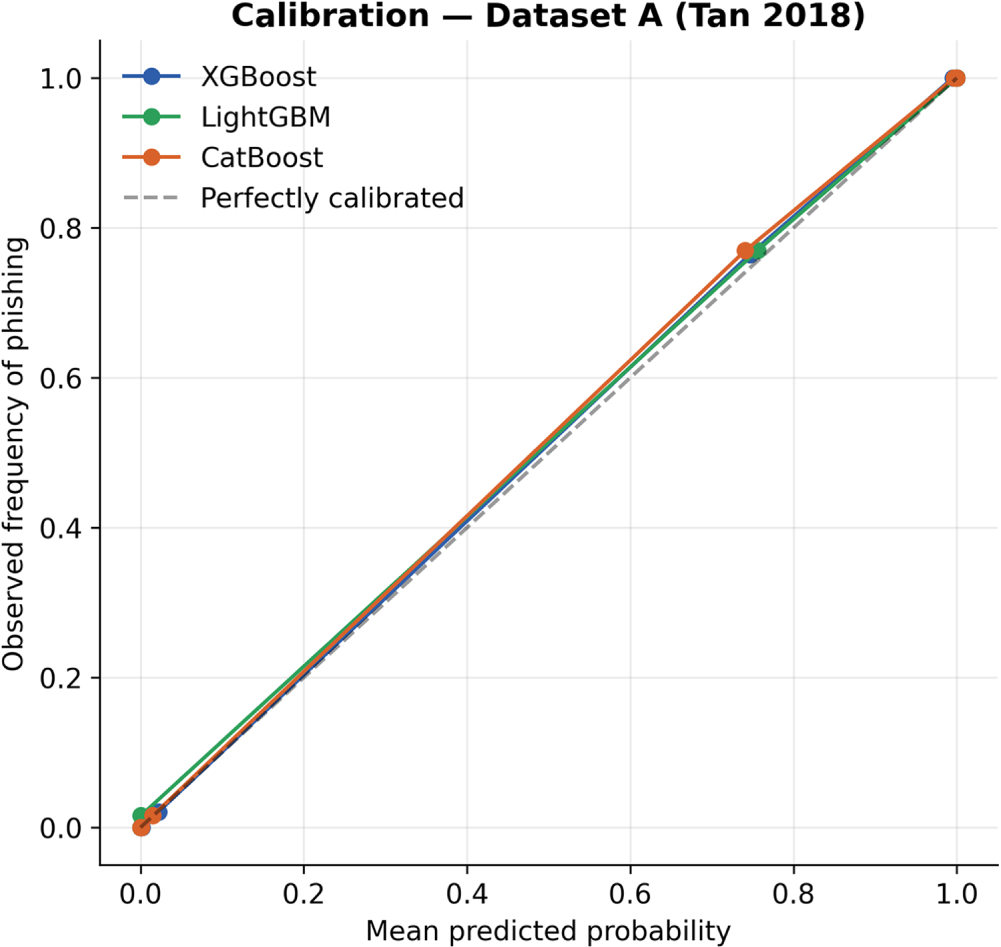
Figure 20: Reliability diagram (observed phishing frequency vs. mean predicted probability) for all three models, dataset A test set.
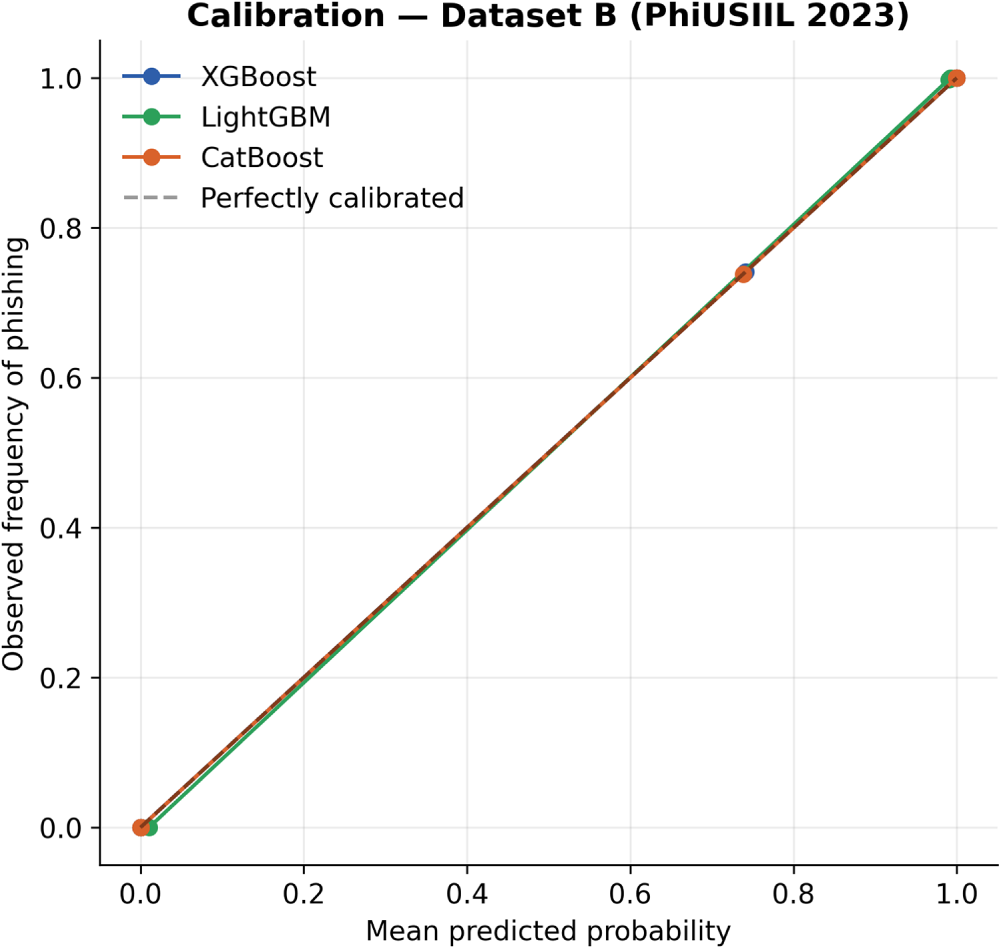
Figure 21: Reliability diagram for all three models, dataset B (PhiUSIIL) test set.
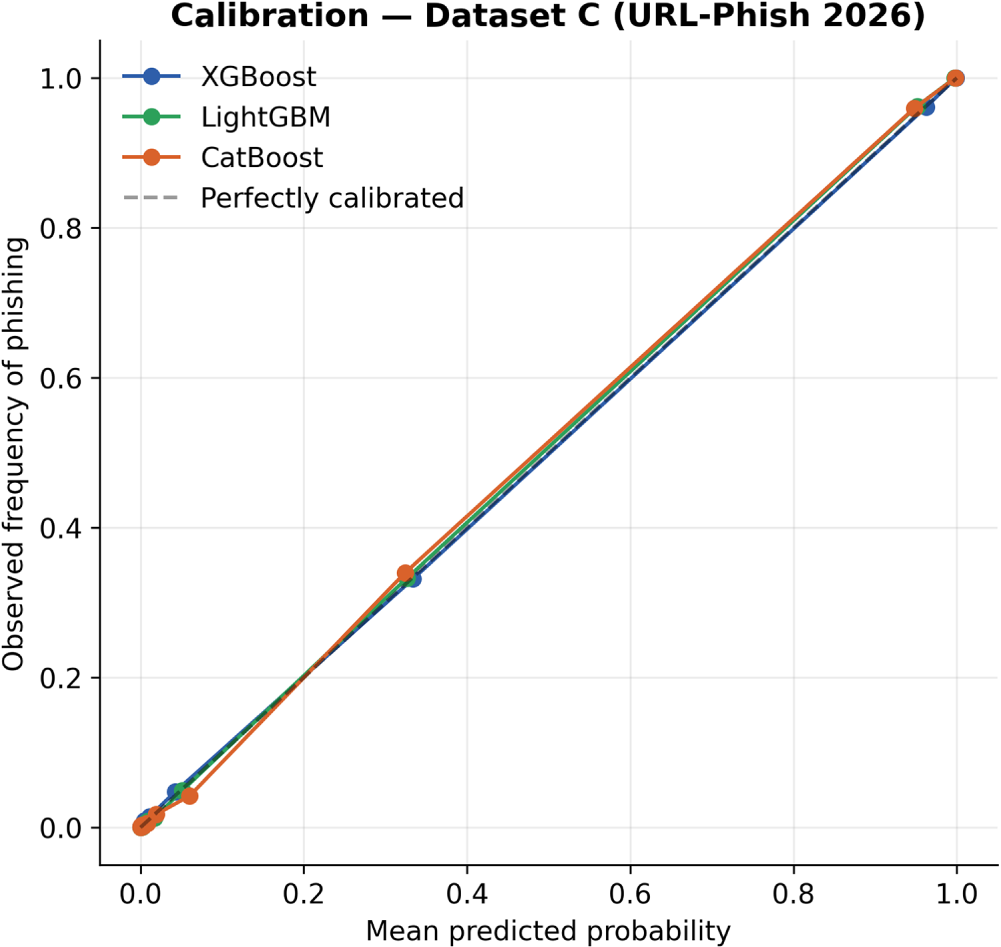
Figure 22: Reliability diagram for all three models, dataset C (URL-Phish 2026) test set.
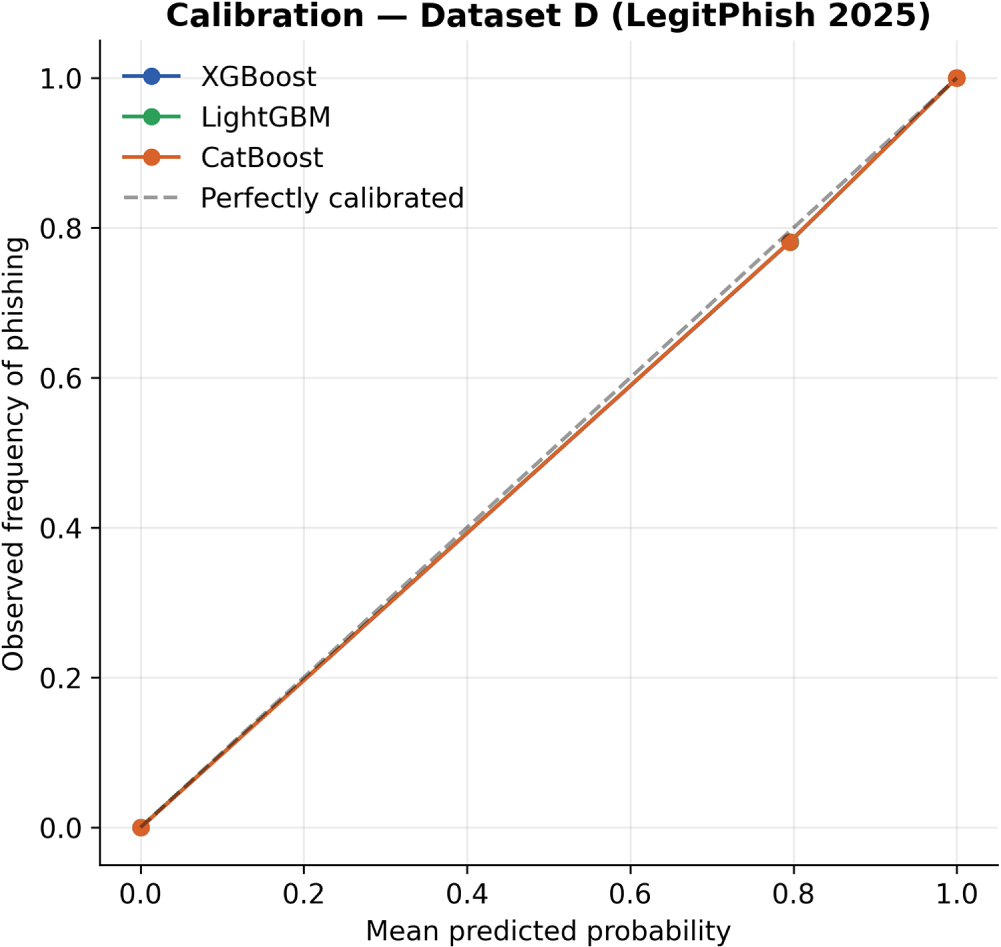
Figure 23: Reliability diagram for all three models, dataset D (LegitPhish 2025) test set.
On dataset A (Fig. 20), all three models track the diagonal, perfectly-calibrated reference line closely across the full probability range, with the largest visible departure in the upper-middle bin, where observed phishing frequency runs slightly ahead of the mean predicted probability for all three models—a mild, consistent underconfidence rather than the overconfidence more commonly reported for boosted-tree classifiers. Dataset B (Fig. 21) shows near-perfect calibration for all three models, consistent with the near-ceiling discrimination already reported for this dataset in Section 6.6: with almost every prediction pushed to the extremes of the probability range, there is little room for miscalibration to appear. Dataset C (Fig. 22), already identified as the hardest of the four benchmarks, shows the same close tracking of the diagonal overall, with the most visible (still modest) departures concentrated in the lowest-probability bin, where CatBoost’s curve sits slightly apart from XGBoost’s and LightGBM’s—consistent with dataset C being the dataset on which the three models’ behavior is otherwise least uniform (Sections 6.6 and 6.9). Dataset D (Fig. 23) shows all three models’ reliability curves essentially overlapping one another and the diagonal at every bin, with very few intermediate-probability predictions—most test-set scores are pushed close to 0 or 1, leaving only a single well-calibrated intermediate bin near 0.8.
Taken together, none of the three models shows the systematic over- or under-confidence that would make their raw probability outputs unreliable for direct use; the deviations from perfect calibration that do appear are small, dataset-specific, and concentrated in the same datasets and probability ranges already flagged as harder to classify (dataset C) or trivially separable (dataset B) elsewhere in this section, rather than indicating a calibration problem specific to any one of the three algorithms.
6.5 Performance under Realistic Class Imbalance
The 50:50 phishing/legitimate class balance used in Table 5 does not reflect the class distribution encountered in live web traffic, where legitimate pages vastly outnumber phishing pages. Table 9 re-evaluates all three models on dataset A after resampling the test set to a realistic 90:10 legitimate-to-phishing ratio, without retraining (Fig. 24). As anticipated in the original manuscript’s limitations discussion, precision is the metric most affected: it drops to 0.932 (XGBoost), 0.924 (LightGBM), and 0.930 (CatBoost)—roughly six to seven percentage points below the balanced-test precision in Table 5—while recall and ROC-AUC remain largely stable. This confirms, rather than merely anticipates, that precision reported under artificial class balance overstates the alert quality a security team would actually observe in deployment.

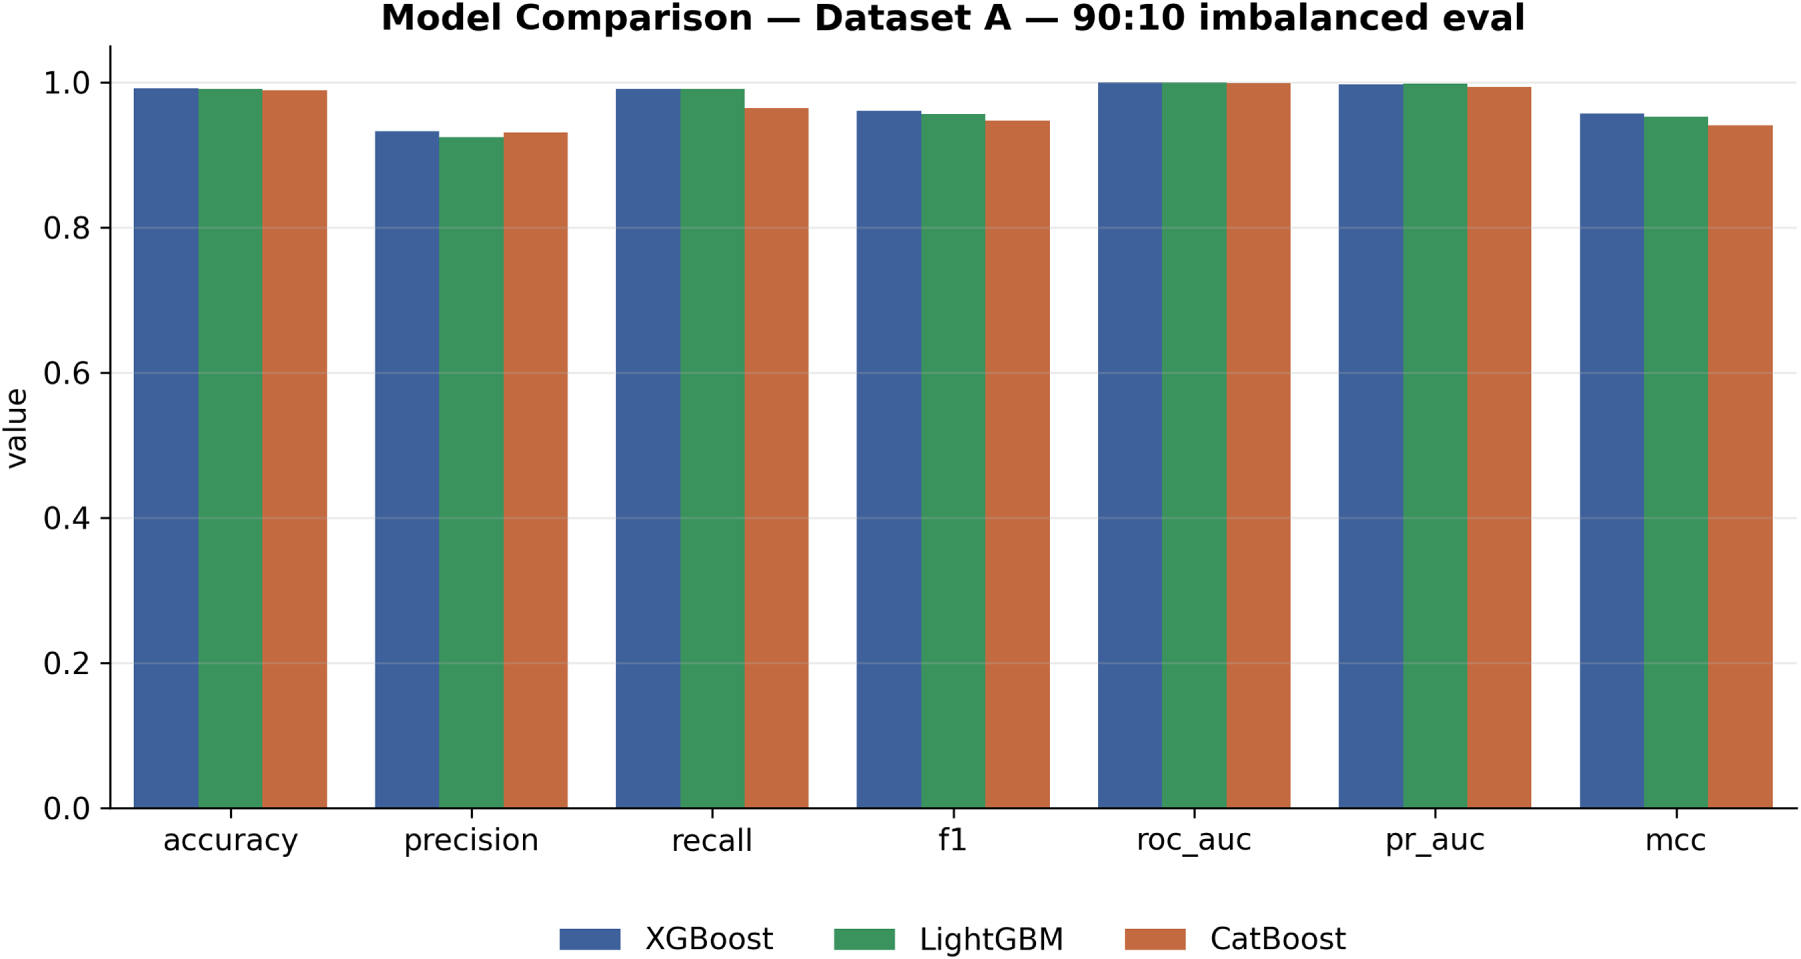
Figure 24: Model comparison on dataset A under the resampled 90:10 imbalanced test set.
6.6 Cross-Dataset Generalization
Fig. 17 and Table 5 show that accuracy is not uniform across the four datasets (see also the per-dataset SHAP feature-importance charts in Figs. 25–28), and the pattern is informative in itself. As noted in Section 6.1, the statistical significance testing of Section 6.2 was conducted on dataset A only; the cross-dataset comparisons below are therefore descriptive observations about accuracy and SHAP behavior, not statistically validated claims of difference or equivalence between datasets or models. Dataset C—the most recently collected benchmark (2026)—is the hardest of the four for all three models (96.08%–96.27% accuracy, ROC-AUC
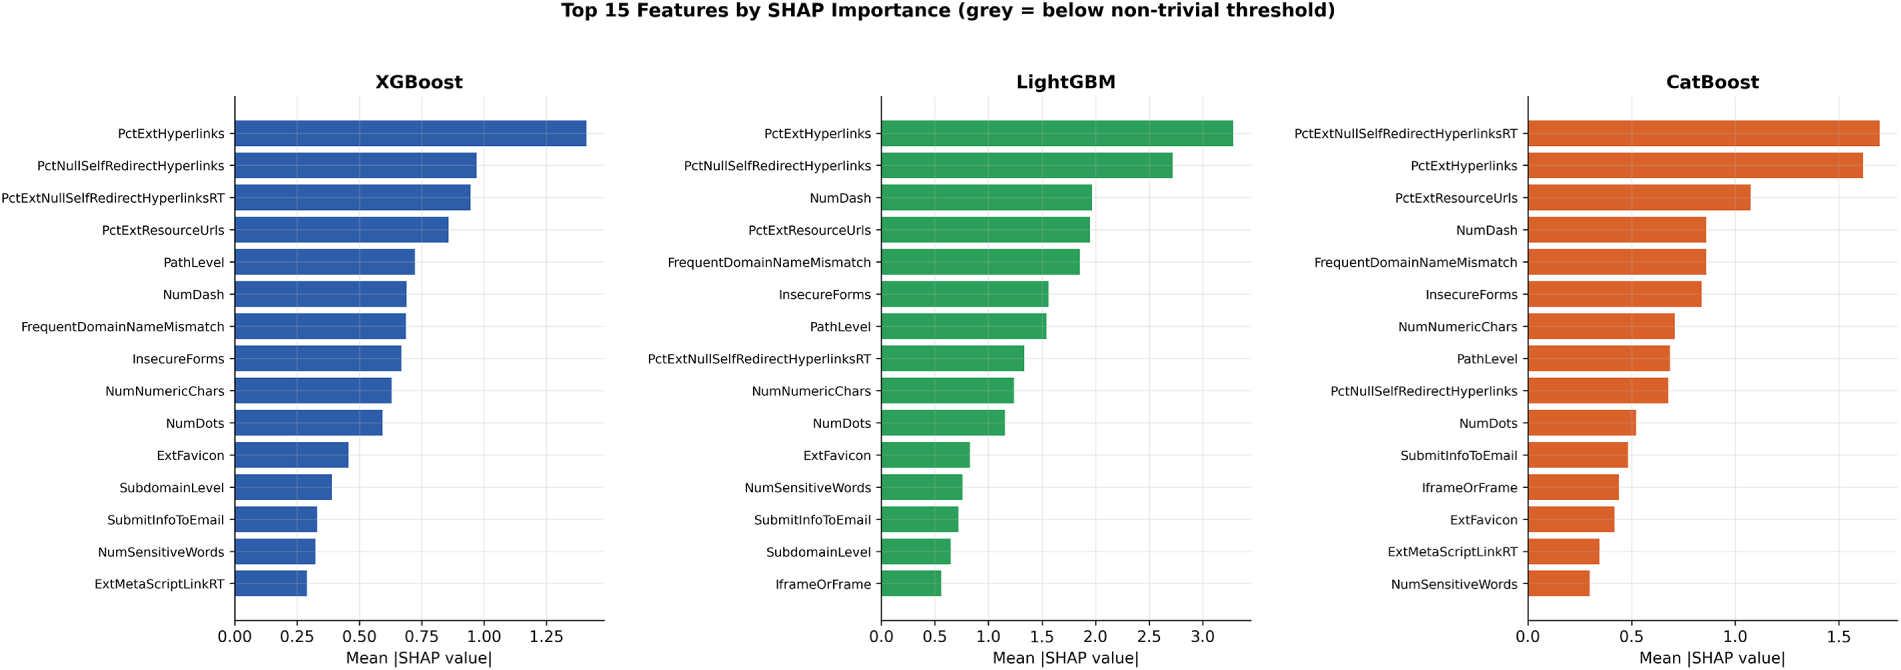
Figure 25: Top-15 features by mean
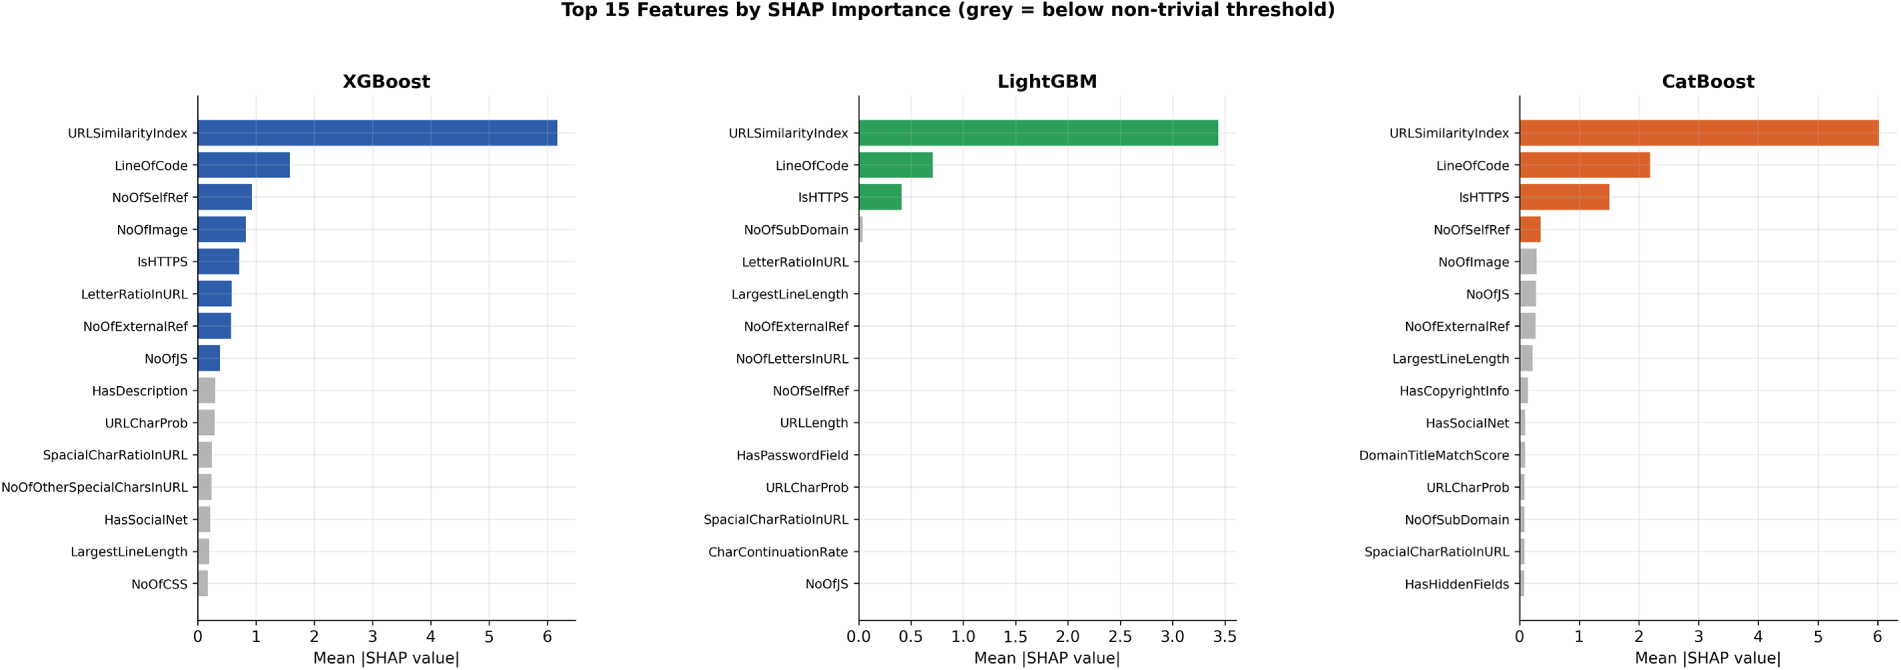
Figure 26: Top-15 features by mean
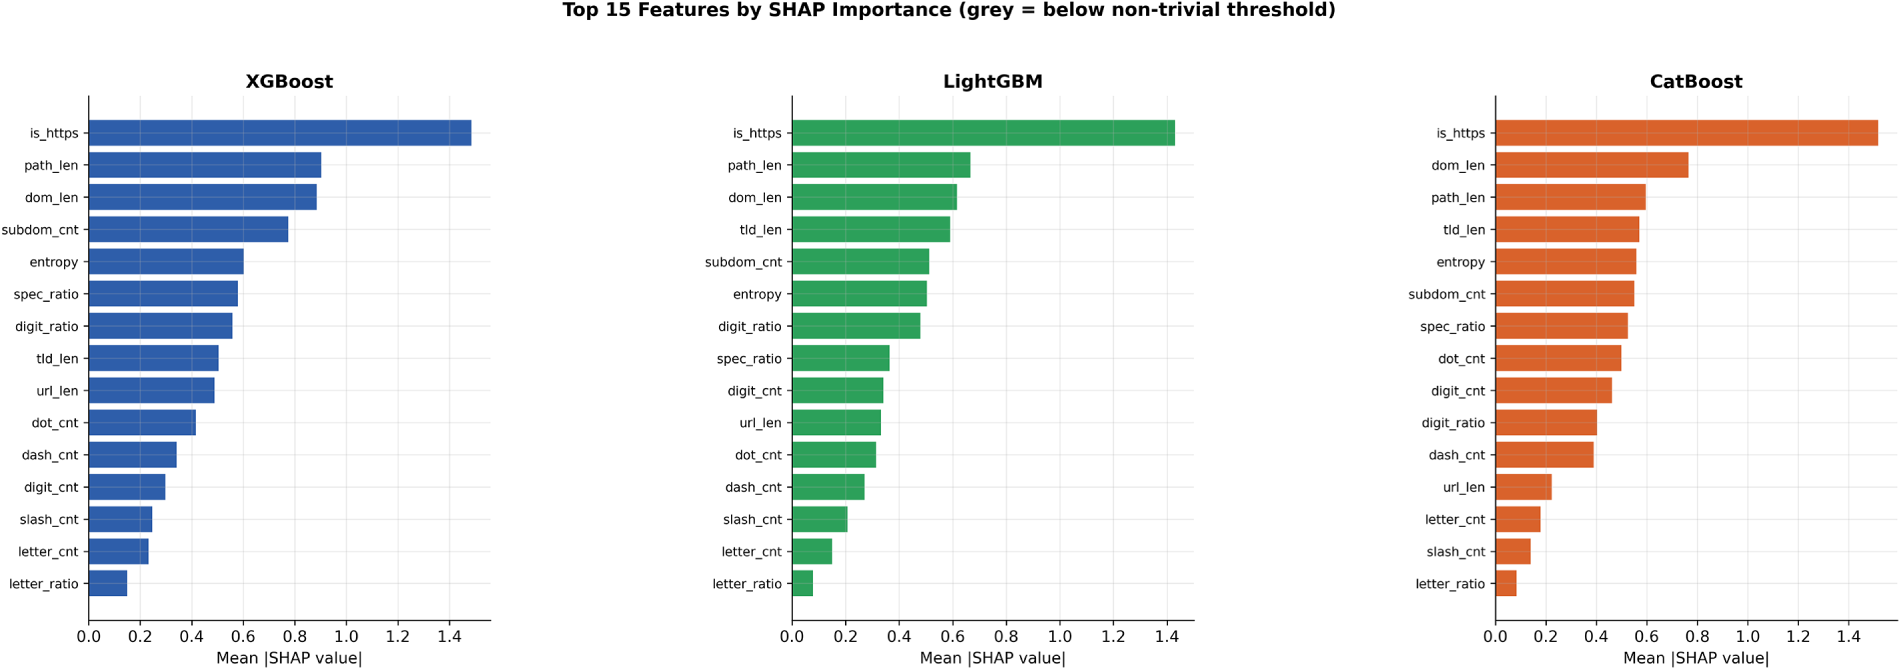
Figure 27: Top-15 features by mean
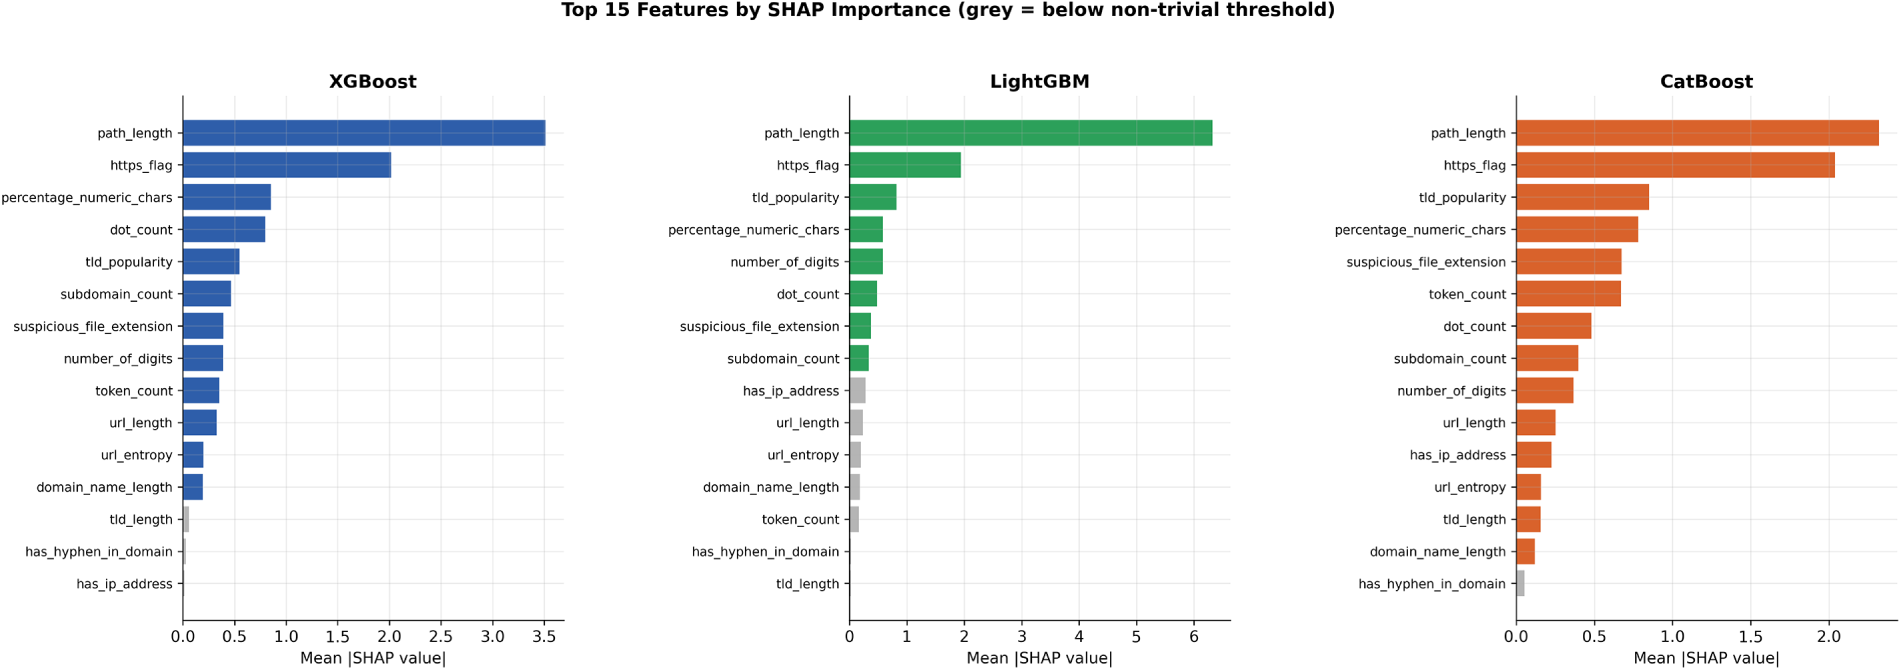
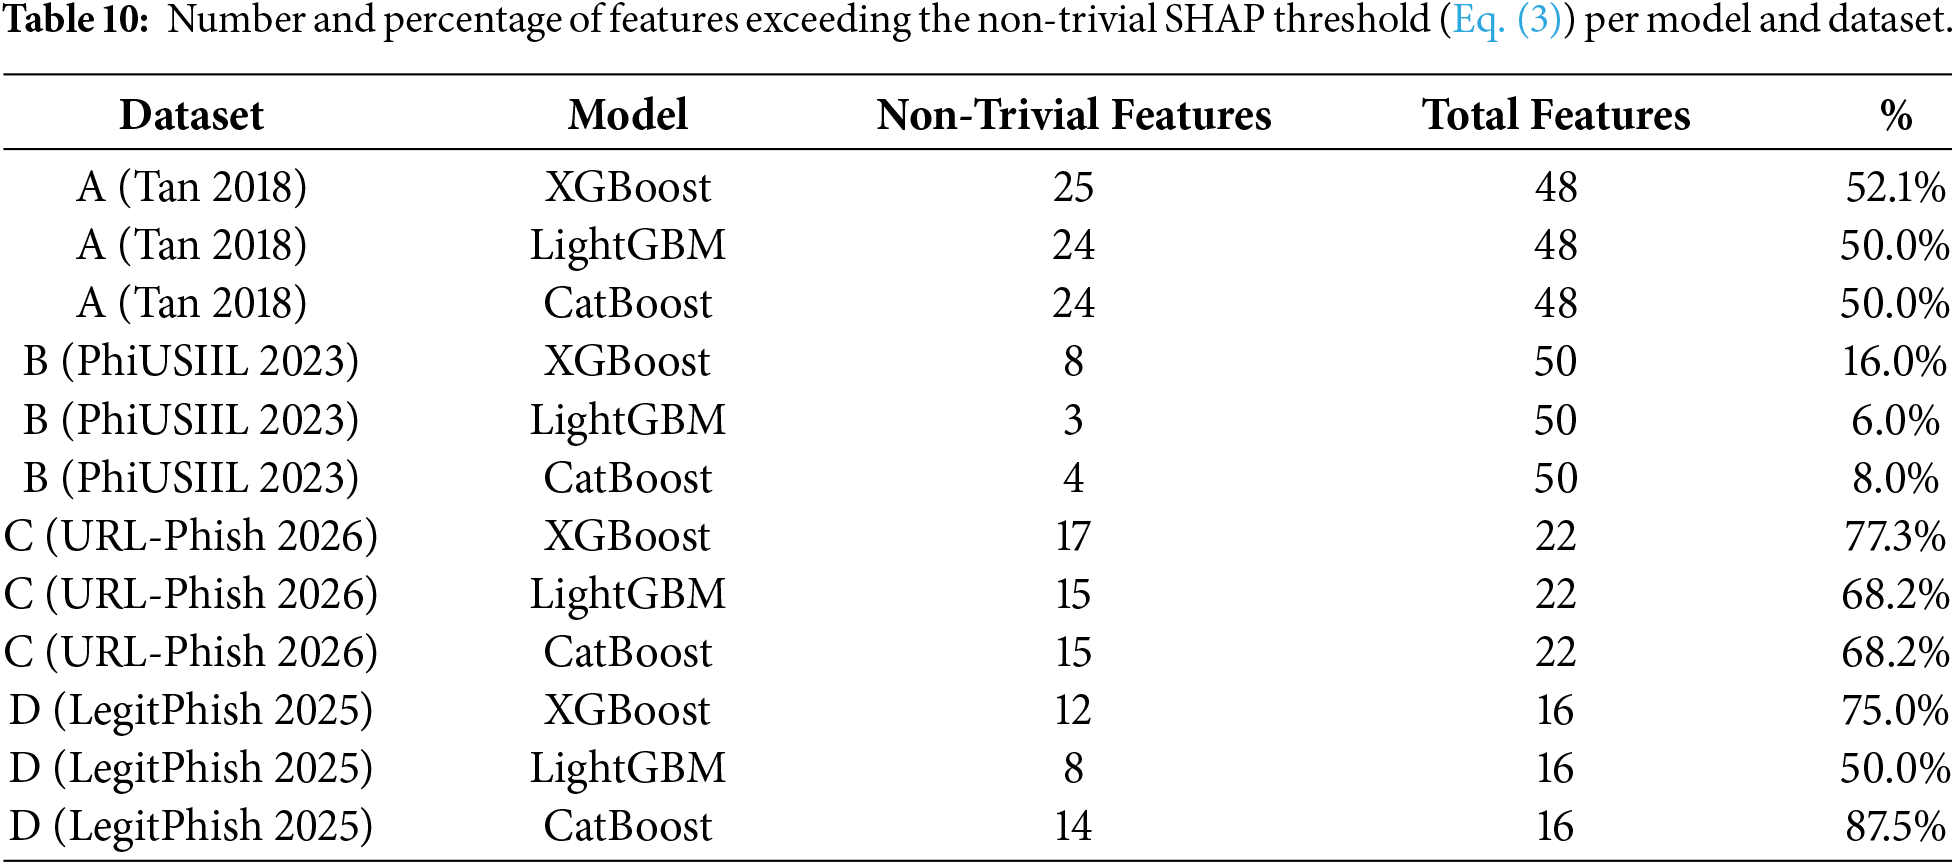
Figure 28: Top-15 features by mean
6.7 Explainability Analysis: Feature Reliance Breadth
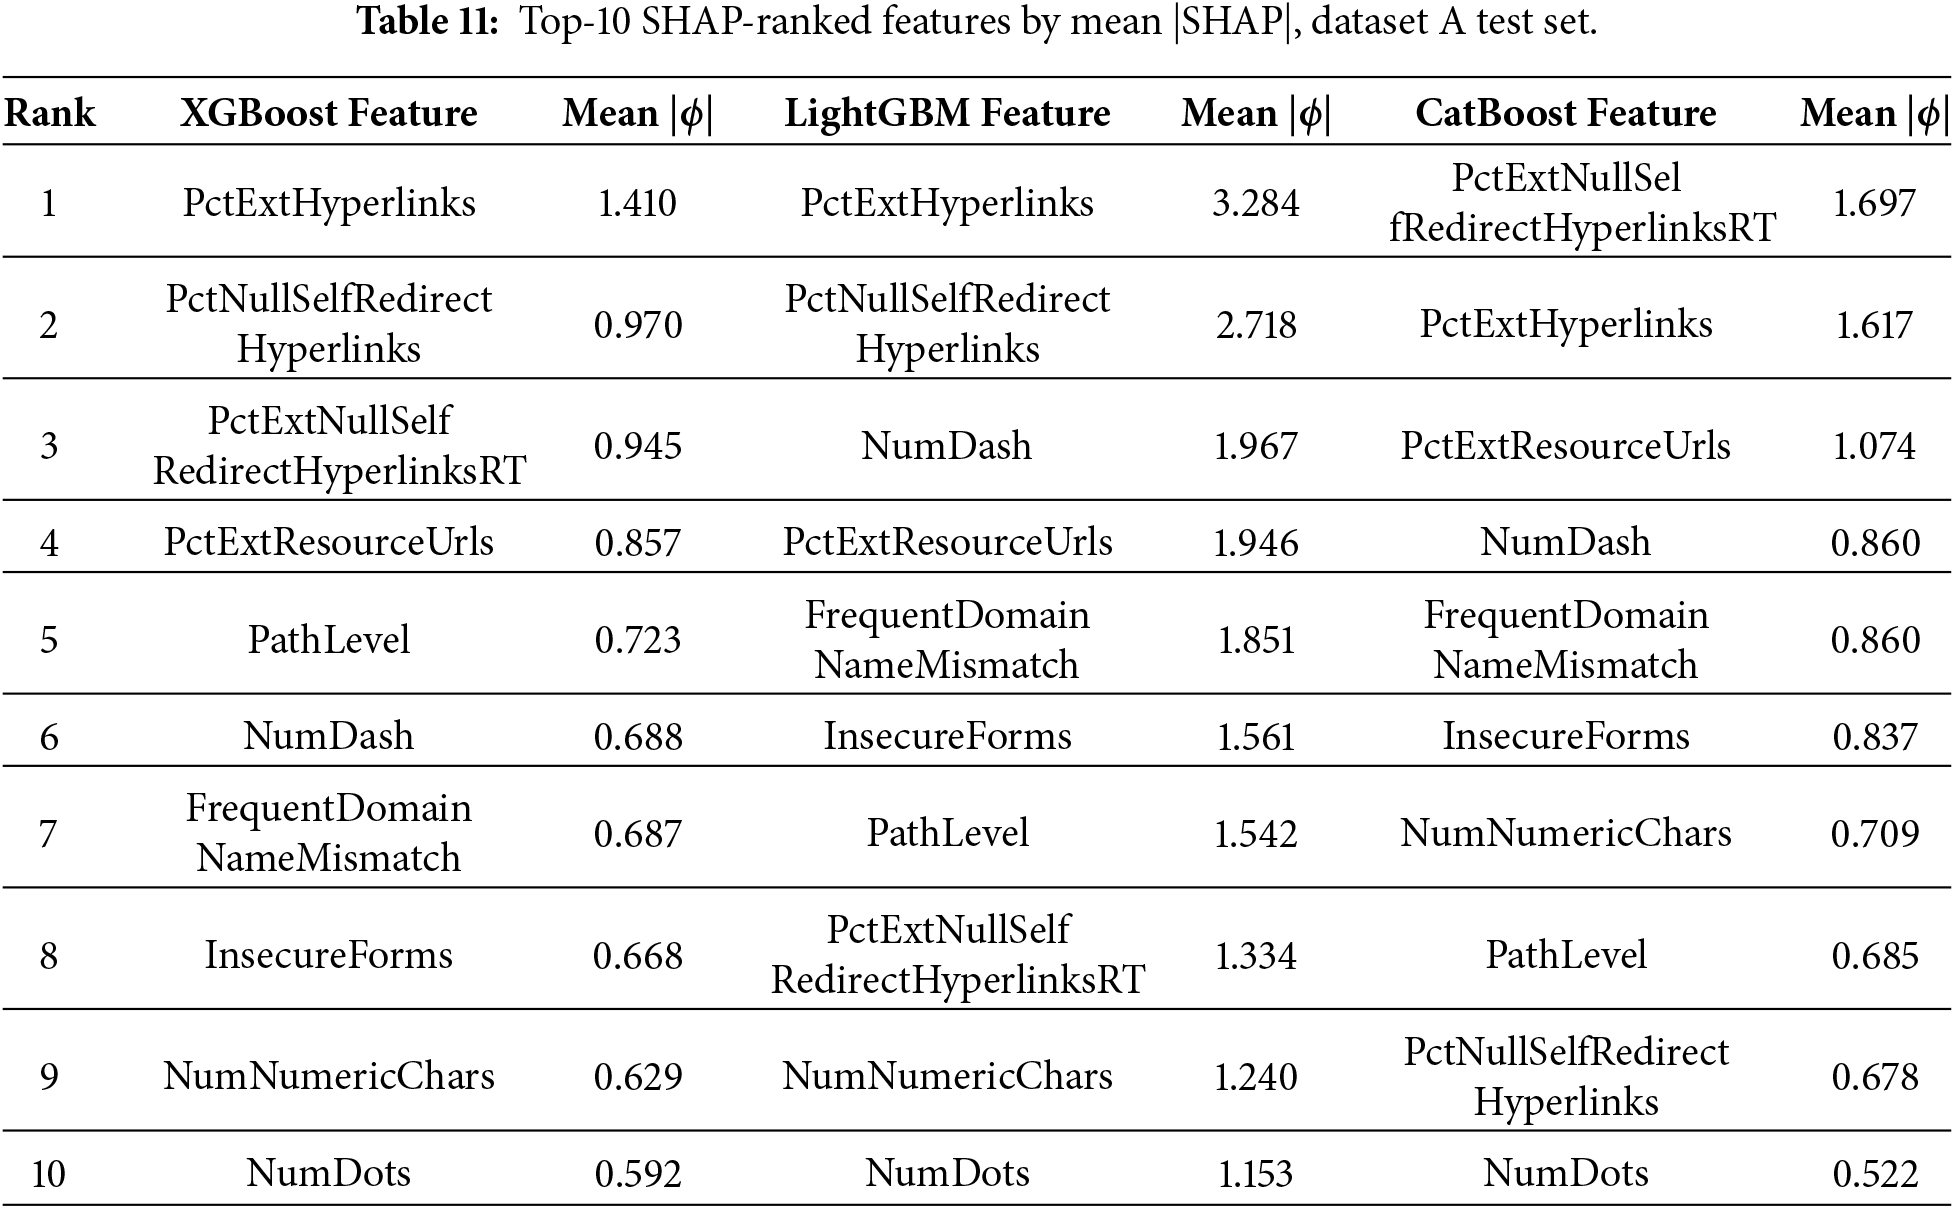
Table 10 reports, for every model and dataset, how many features clear the non-trivial threshold of Eq. (3). On dataset A, the corrected pipeline shows all three models relying on roughly half of the 48 available features (24–25 non-trivial features, 50.0%–52.1%)—substantially narrower than the 42–45-feature range reported in the earlier, leakage-affected version of this study. This is a direct consequence of the corrected tuning protocol rather than a change in the underlying phenomenon: models selected without access to the test set generalize differently, and their SHAP attributions on a genuinely held-out set are correspondingly more concentrated. Reliance breadth also varies sharply by dataset: dataset C, with only 22 total features, sees 15–17 (68%–77%) marked non-trivial, while dataset B sees only 3–8 of 50 (6%–16%), consistent with the single-feature dominance discussed in Section 6.6.
Table 11 lists the top-10 SHAP-ranked features for each model on dataset A with their mean absolute SHAP values, replacing the beeswarm summary plots used in the earlier version of this study with an explicit, tabulable ranking; the corresponding ranked bar charts for all four datasets, with the non-trivial threshold marked, appear in Figs. 25–28.
6.8 Comparison with Prior Work
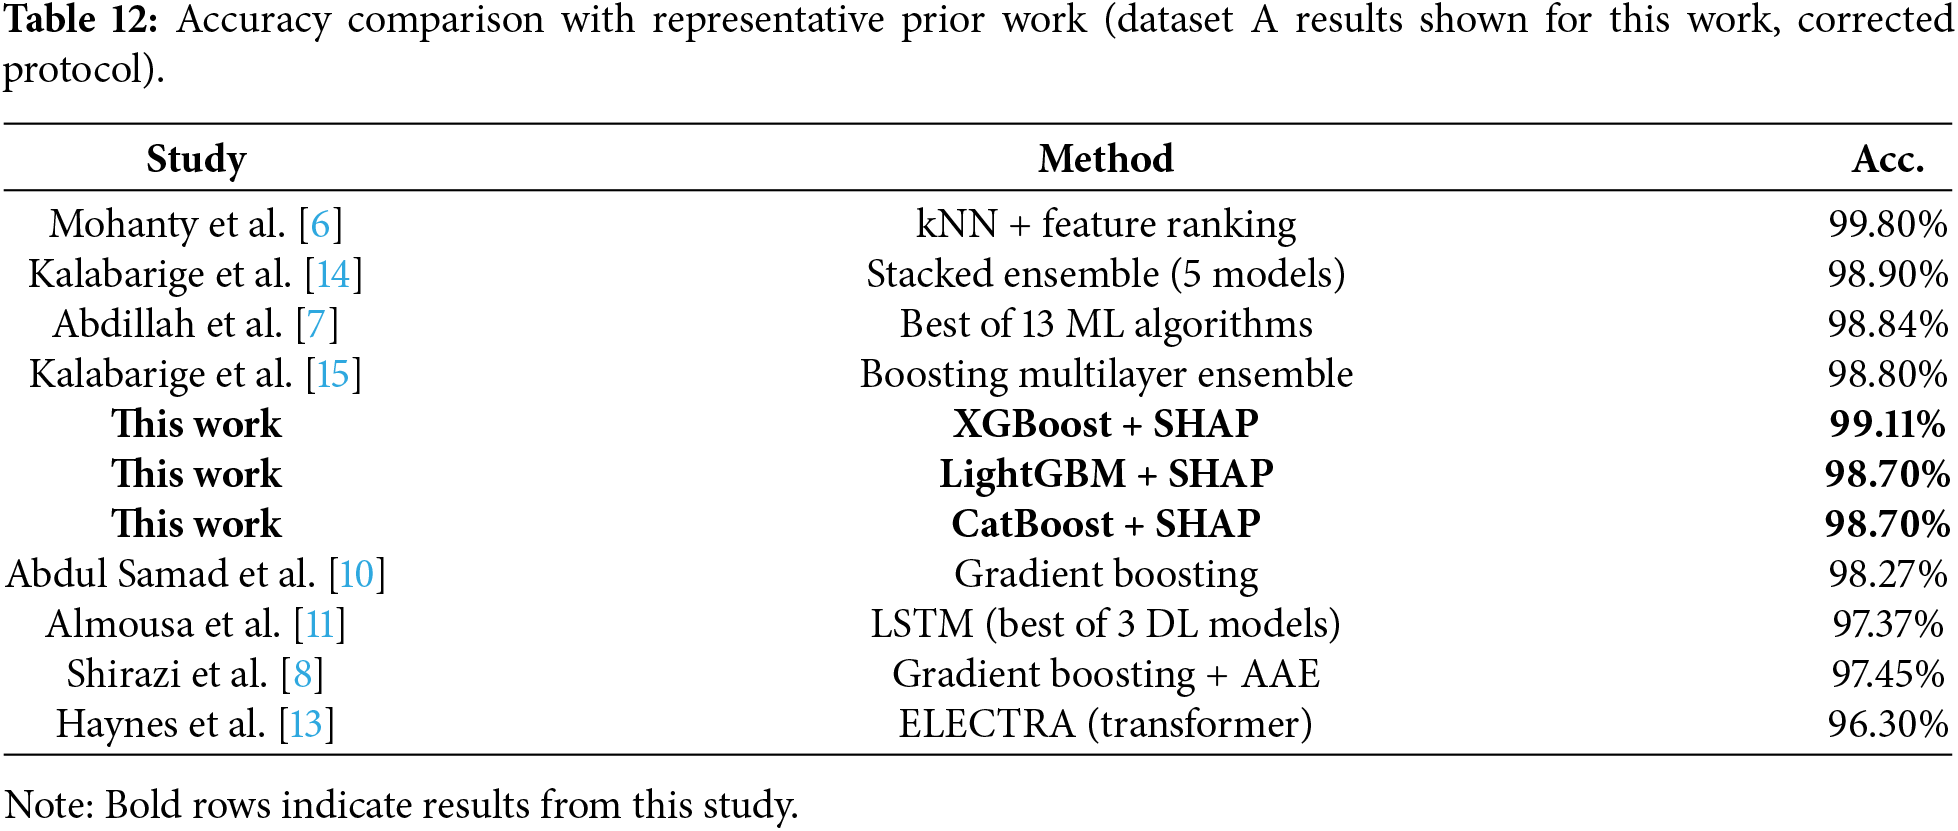
Table 12 situates the corrected dataset-A results against the accuracy figures reported in Section 2. Under the corrected protocol, XGBoost’s 99.11% accuracy is competitive with, though still below, Mohanty et al.’s kNN classifier and Kalabarige et al.’s stacked ensemble [6,14]. None of the comparison studies reports feature-level explanations, statistical significance testing, or an assessment of decision-reliance breadth, which remains the axis on which this study contributes rather than the leaderboard position on dataset A alone.
6.9 SHAP Faithfulness, Stability, and Analyst Actionability
Whether the SHAP attributions are actually faithful to model behavior, stable under resampling, and useful to a human analyst—rather than simply reported at face value—remained an open question in the earlier version of this study. We evaluate all three directly.
Faithfulness. Table 13 reports the ROC-AUC drop after removing each model’s top-5 and top-10 SHAP-ranked features, relative to the full-feature model. The drop is consistently small on datasets A, B, and D (ROC-AUC drop
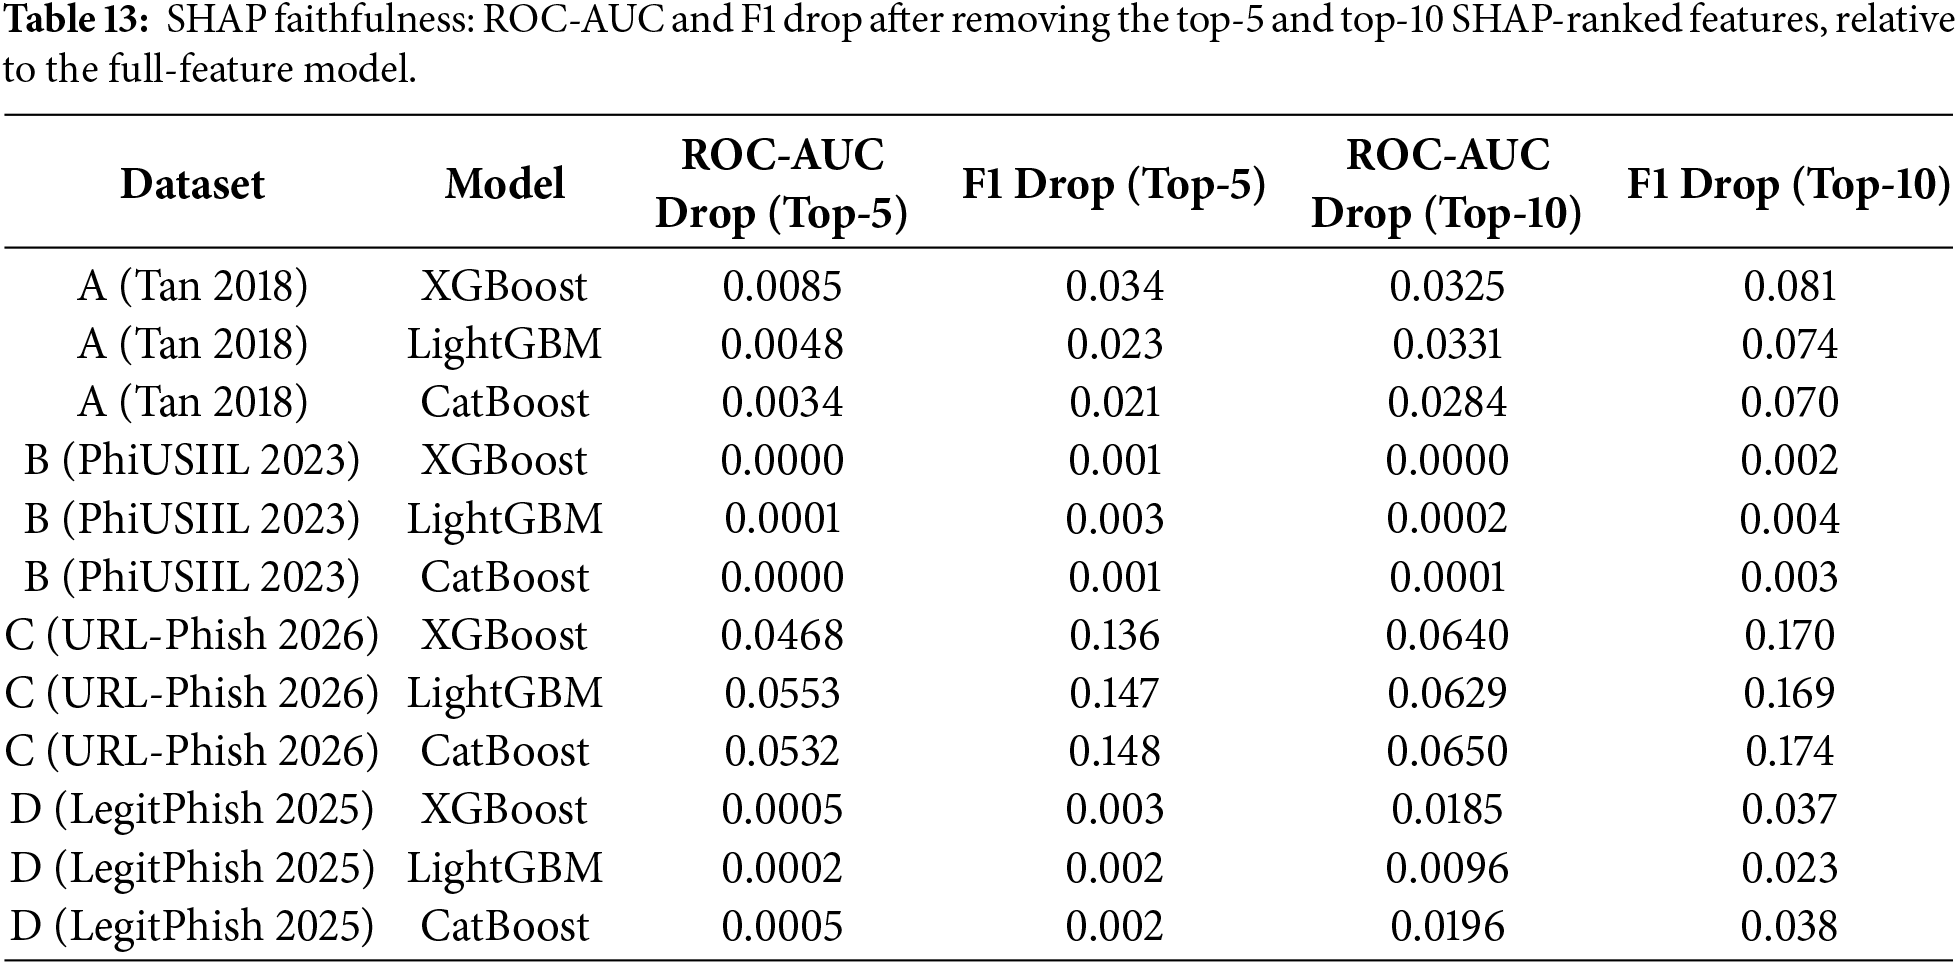
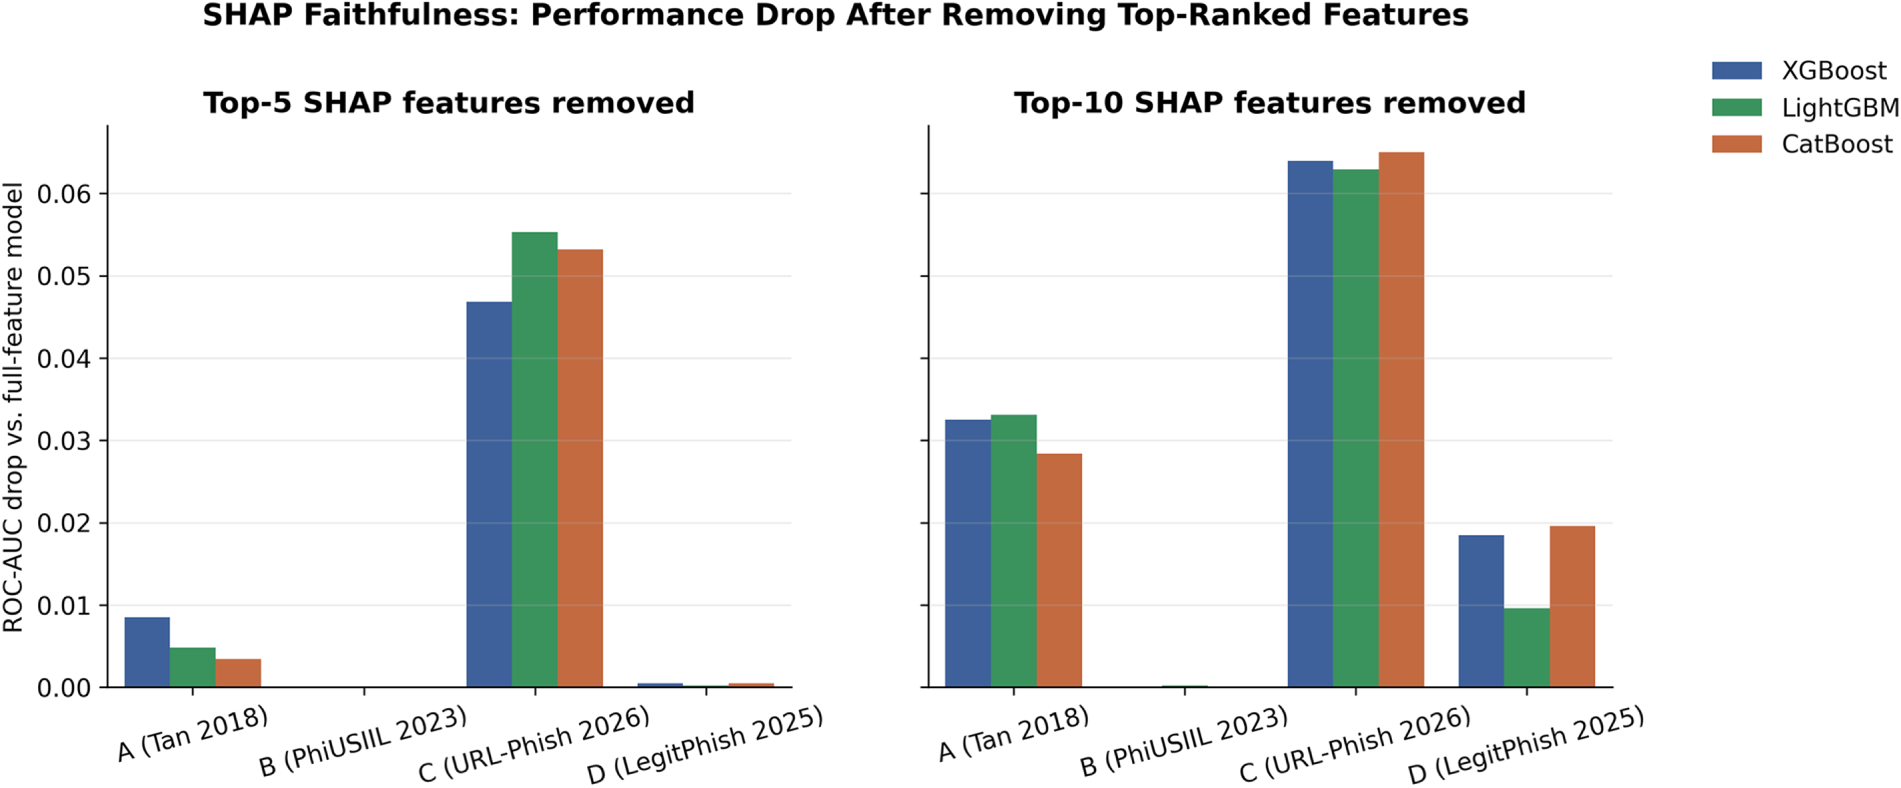
Figure 29: SHAP faithfulness: ROC-AUC drop after removing the top-5 and top-10 SHAP-ranked features, by model and dataset.
Stability. Table 14 reports the mean Jaccard overlap of the top-10 SHAP-ranked feature set across five bootstrap resamples of the test set. The ranking is perfectly stable (Jaccard = 1.000) in 9 of 12 model/dataset combinations, and only mildly less stable for CatBoost on datasets B and C (0.891 and 0.927) and LightGBM on dataset B (0.927). Feature-attribution rankings in this study are therefore not an artifact of a single resampling of the test set.
Analyst actionability. Table 15 categorizes each model’s top-10 SHAP-ranked features (pooled across all four datasets, 40 ranked entries per model) into four groups. Averaged across datasets, 32.5% (XGBoost), 40.0% (LightGBM), and 35.0% (CatBoost) of top-10 features fall into the two directly actionable categories—checkable from the URL string itself or via a quick WHOIS/DNS lookup, without loading the page. The remaining majority of top-ranked features, in every model, are page-content/behavioral signals that require rendering the page or opaque statistical composites (e.g., the ...RT features in dataset A, which are derived ratio terms rather than directly observable page properties). This is an operationally relevant limitation of feature-attribution explanations in this domain: a SHAP explanation is only as actionable as the underlying feature is inspectable, and roughly two-thirds of the highest-ranked evidence across these models requires either loading the flagged page or accepting an opaque composite score at face value. As noted in Section 5, this categorization was implemented as a fixed, keyword-based rule classifier rather than a per-feature manual judgment call; it was designed and applied by a single author without independent re-implementation or a formal agreement check (Section 7), and the percentages above should be read with that caveat. Fig. 30 visualizes this category breakdown by model and dataset.
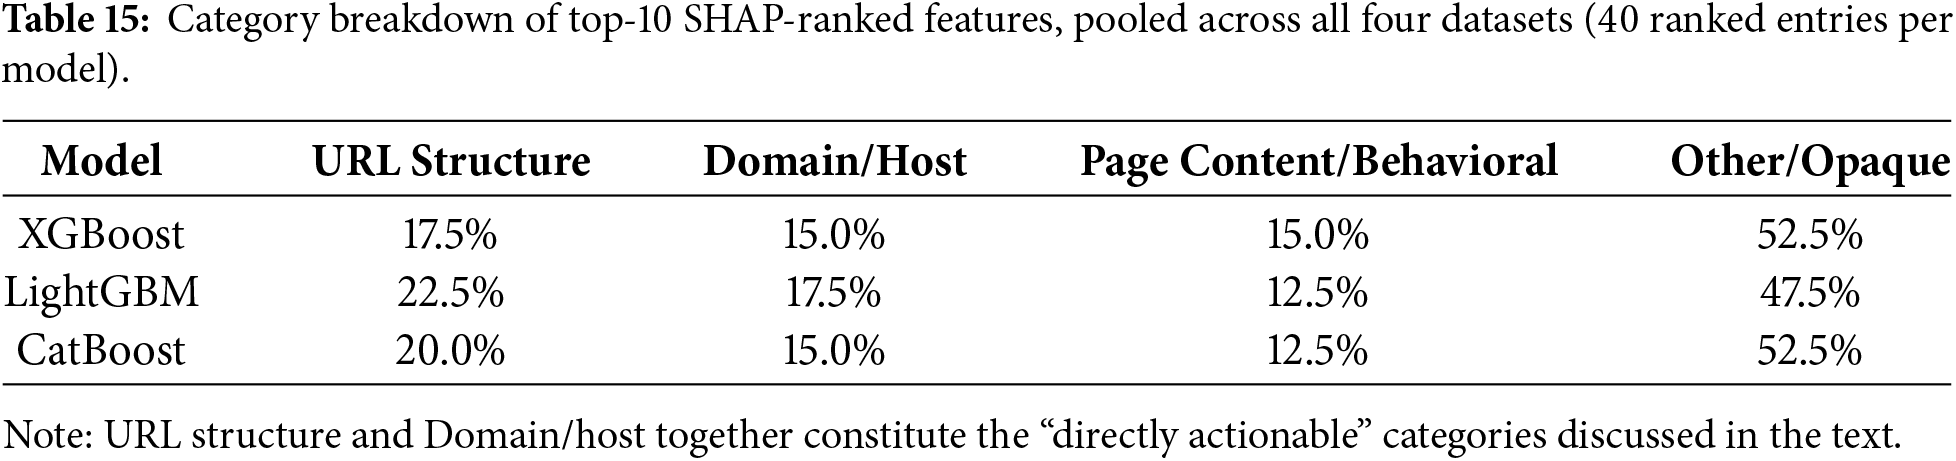
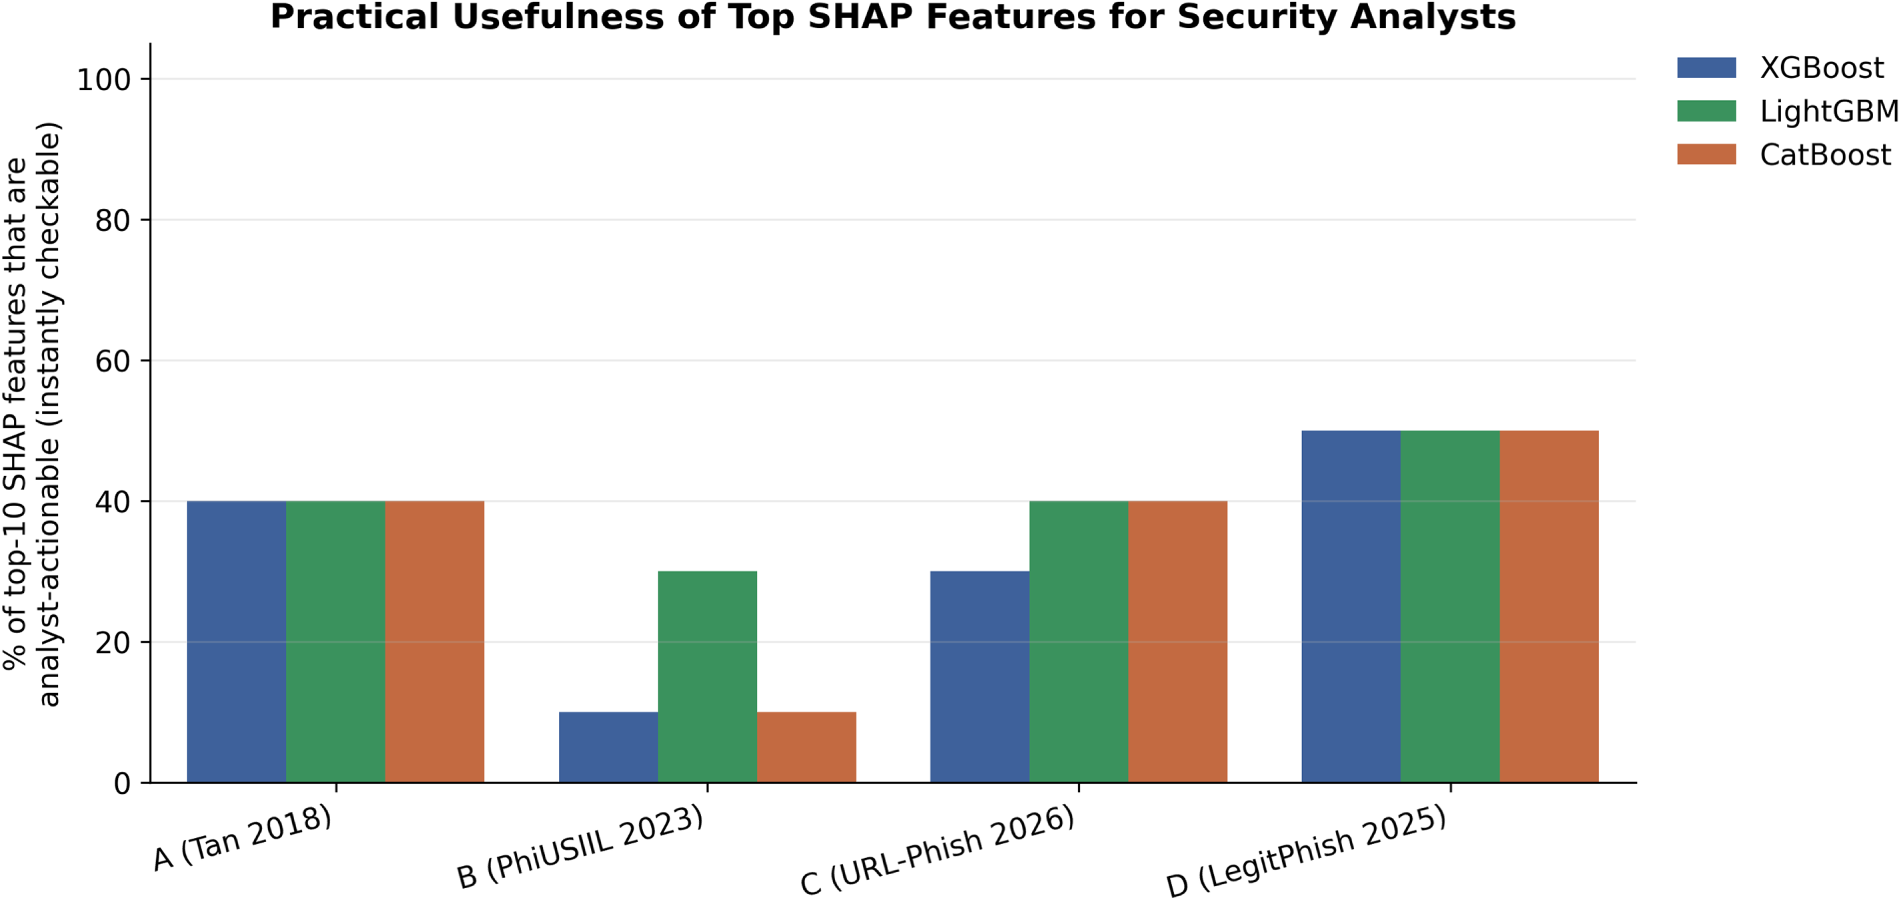
Figure 30: Percentage of top-10 SHAP-ranked features classified as directly actionable by a security analyst, by model and dataset.
6.10 SHAP-Guided Adversarial Evasion: Testing, Not Assuming, the Robustness Hypothesis
The earlier version of this study observed that LightGBM relied on fewer SHAP non-trivial features than XGBoost or CatBoost, but stopped short of testing whether this narrower reliance actually translated into greater vulnerability to adversarial evasion. We test this directly here. Table 16 reports the mean SHAP-guided evasion rate and the gap over a random-feature perturbation baseline, aggregated across all four datasets, alongside each model’s average non-trivial feature count from Table 10.
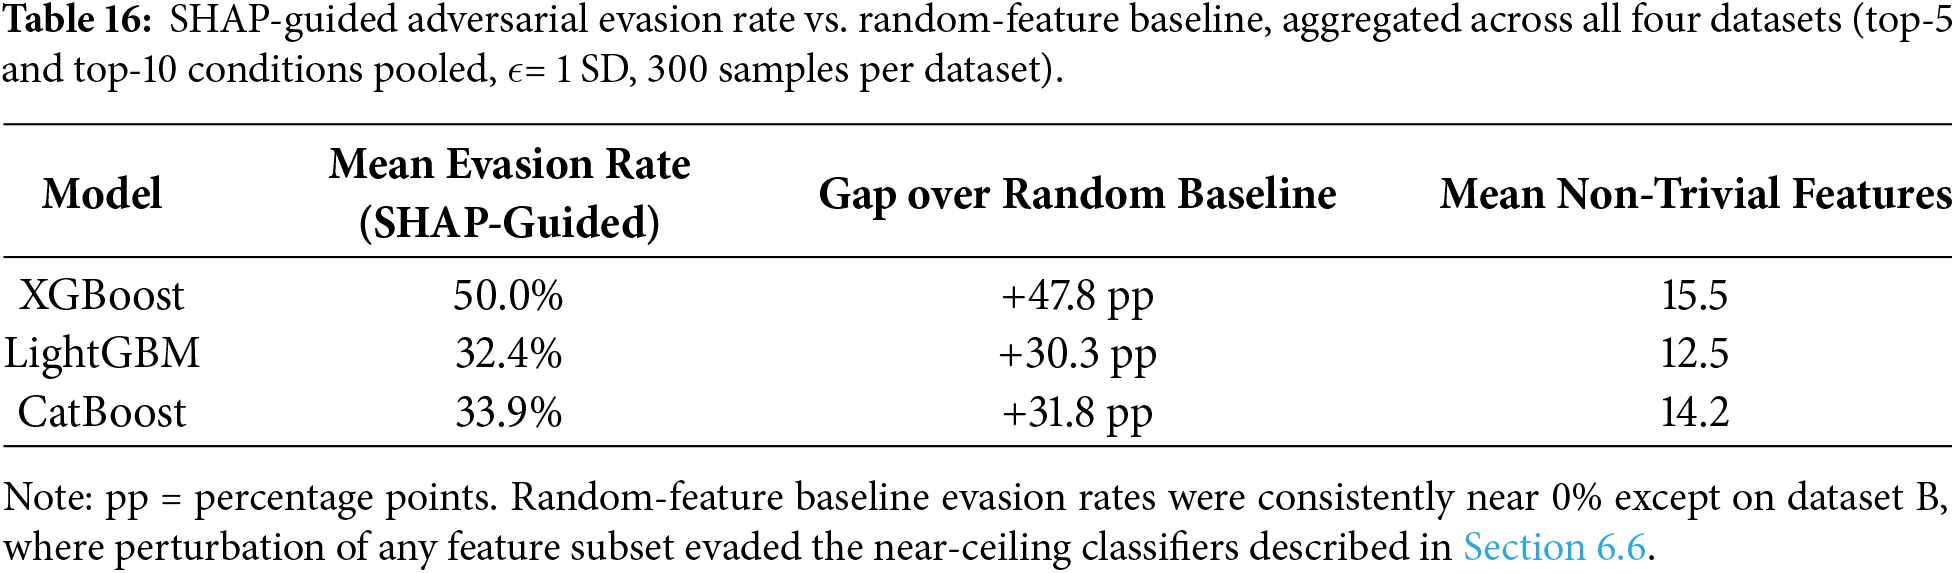
The result does not support the intuitive hypothesis raised in the earlier manuscript. XGBoost—which relies on the broadest, not the narrowest, set of non-trivial SHAP features on average (15.5 features vs. LightGBM’s 12.5)—is the most vulnerable to SHAP-guided evasion (50.0% mean evasion rate), while LightGBM, the narrowest-relying model, is the least vulnerable (32.4%). Breadth of SHAP reliance, at least as measured here, is not a reliable predictor of adversarial robustness in either direction: a model is not made more robust simply by depending on more features, nor is a model with narrower reliance necessarily easier to evade. Fig. 31 shows this pattern holds across individual datasets, not only in aggregate, and is most pronounced on dataset B, where all three models’ near-ceiling separability (Section 6.6) makes them uniformly easy to evade with only a handful of perturbed features—a further reason to treat dataset B’s raw accuracy figures with caution rather than as a deployment-ready result.
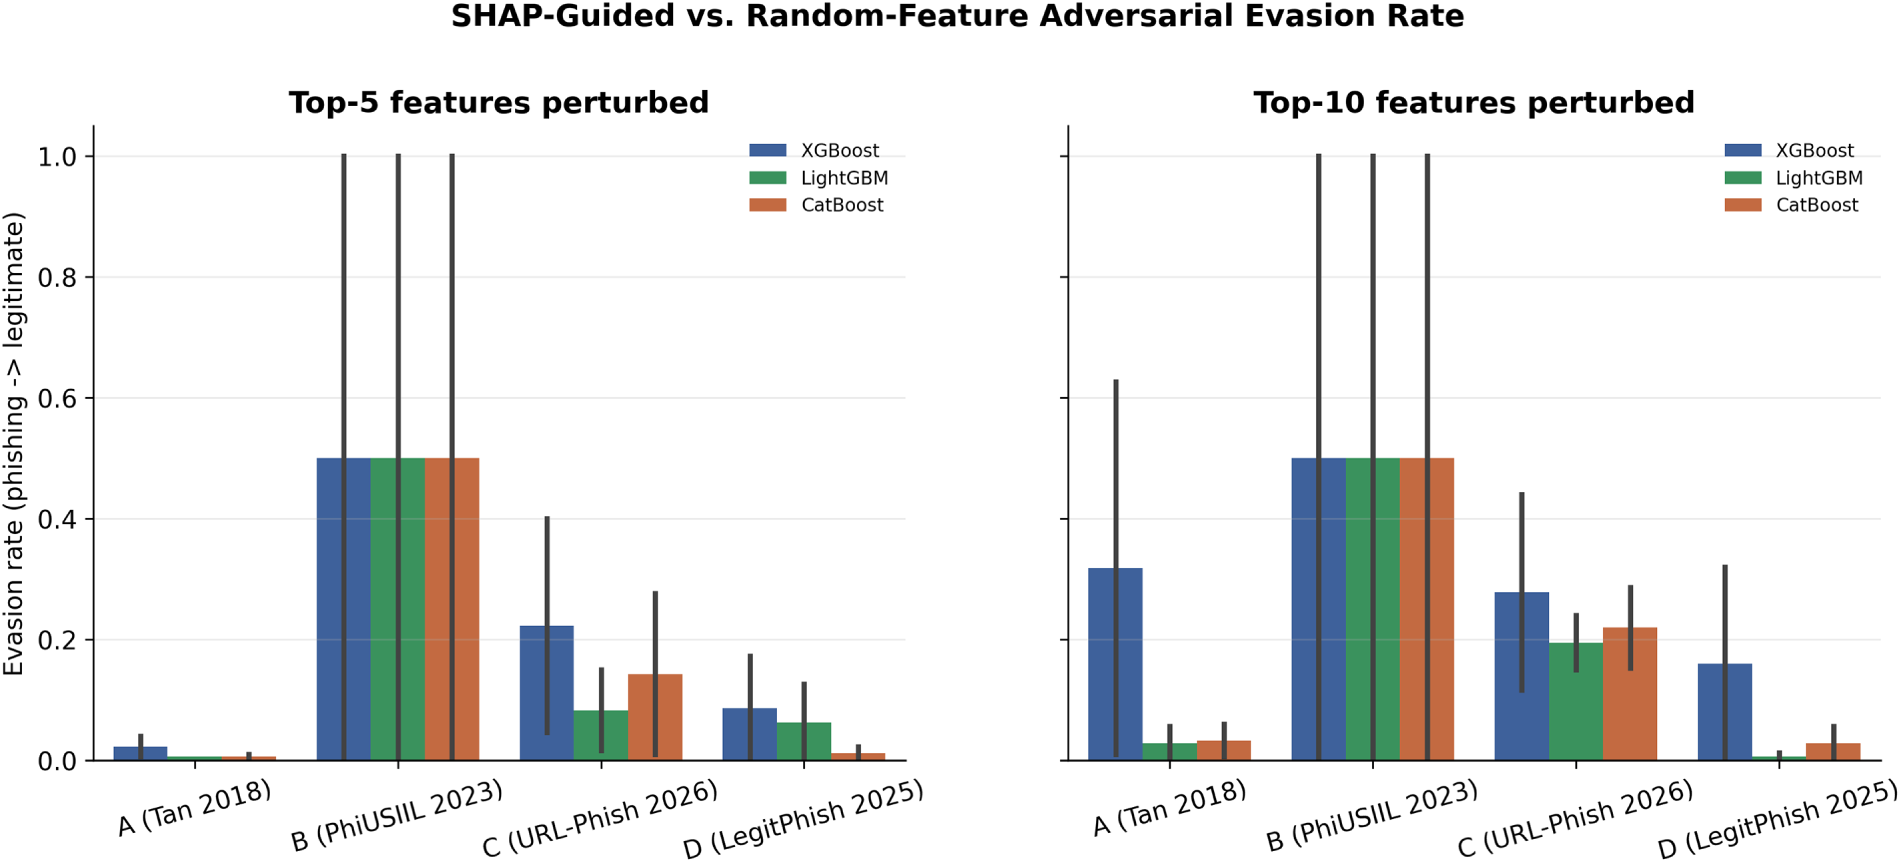
Figure 31: SHAP-guided vs. random-feature adversarial evasion rate, by model and dataset, for top-5 and top-10 perturbed features.
This finding narrows, rather than broadens, what can be claimed about SHAP breadth in this domain: it remains a useful descriptive signal of how concentrated a model’s decision process is, and Section 6.9 shows it correlates with how actionable the resulting explanation is, but it should not, on this evidence, be used on its own as a proxy for adversarial robustness. We return to this point in Section 7.
The earlier version of this study did not report training time, inference time, memory consumption, or SHAP computation cost. Table 17 reports training time, full-test-set inference time, and per-sample inference time for all three models on all four datasets, measured on identical hardware. Table 18 separately reports the wall-clock cost of computing TreeSHAP explanations, since this cost is incurred at explanation time rather than at training or inference time and scales differently across models. Peak memory consumption is not reported: we attempted to record it alongside these measurements but were unable to obtain a reliable per-model reading with the profiling method available in our training environment, and rather than report the resulting all-zero values as if they were meaningful, we omit memory figures entirely. This is a genuine gap in the computational evaluation, not a null result, and we flag it explicitly as a limitation below (Section 7) rather than as a reported finding.
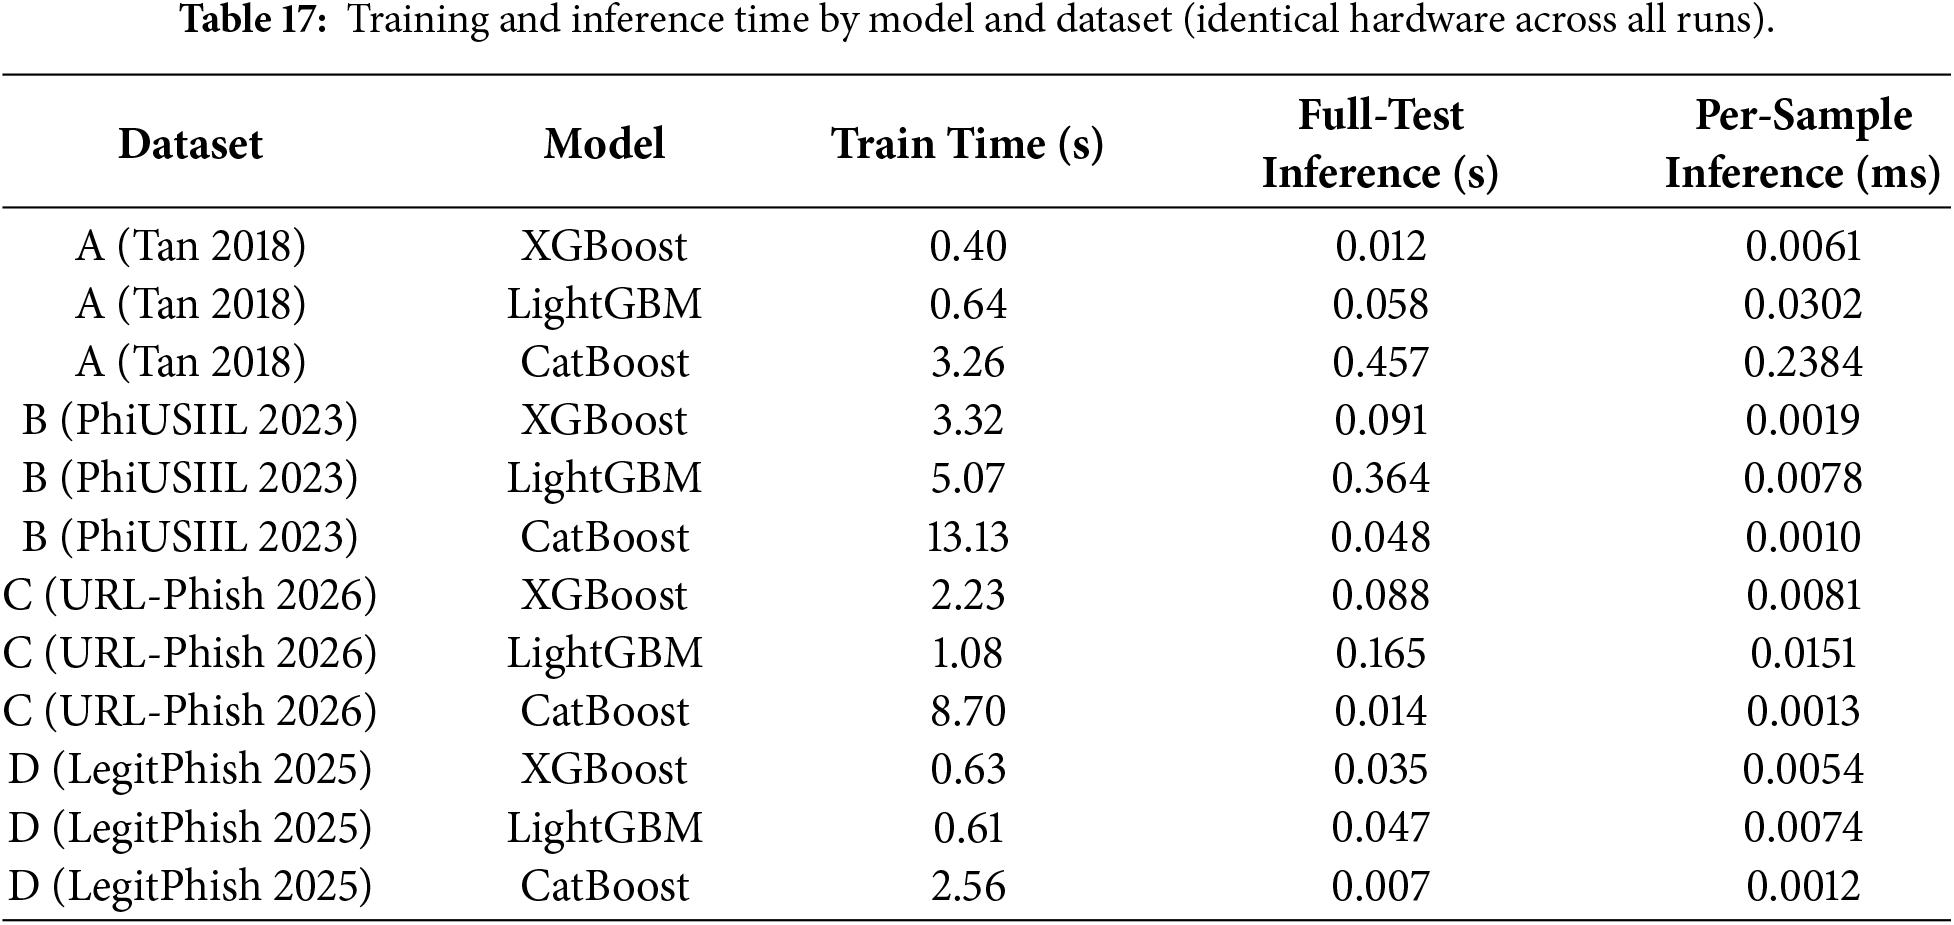
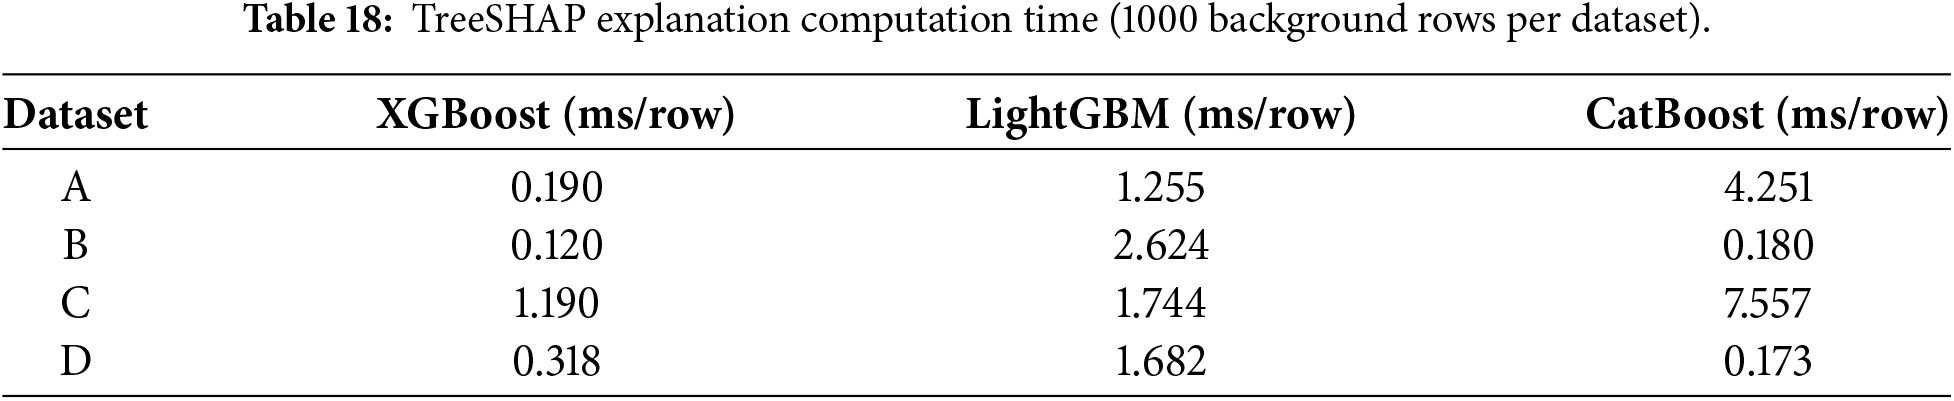
Across all four datasets, CatBoost is consistently the slowest to train (2.6–13.1 s vs. well under 6 s for the other two models) but is not consistently the slowest at inference or SHAP computation—on dataset D, CatBoost has both the lowest inference and the lowest SHAP cost of the three models, and on dataset B it has the lowest inference cost but not the lowest SHAP cost (XGBoost is cheaper to explain per row there), while on datasets A and C it is the most expensive to explain per row (4.3 and 7.6 ms/row). XGBoost is the fastest to train on datasets A and B, but LightGBM trains marginally faster on datasets C and D (1.08 vs. 2.23 s, and 0.61 vs. 0.63 s, respectively); XGBoost nonetheless has the lowest or near-lowest SHAP computation cost on three of four datasets. These results indicate that the practical cost of explaining a CatBoost model varies substantially by dataset in a way that training time alone does not predict, which is relevant for any deployment that budgets explanation latency as part of the alerting pipeline.
The corrected protocol and expanded experiments in this revision close most of the gaps identified in the earlier version of this study, but several limitations remain and should guide how these results are interpreted.
No formal hyperparameter ablation was performed. Hyperparameter selection uses a validation-only random search over 15 configurations per model per dataset (Section 3.3), which removes the test-set leakage that motivated this revision, but this is a coarser search than a full grid or nested
Statistical testing performed on one dataset. McNemar tests and five-seed repeated training (Section 6.2) were conducted on dataset A only, due to the computational cost of repeating this procedure across all four datasets, several of which exceed 30,000 training samples. The accuracy rankings on datasets B, C, and D (Table 5) have not been tested for significance and should be read with the same caution the significance analysis motivates for dataset A.
Dataset B’s near-ceiling performance likely reflects feature dominance rather than task difficulty. As discussed in Section 6.6, a single feature (URLSimilarityIndex) dominates SHAP attributions on dataset B, and all three models are trivially evaded by adversarial perturbation on this dataset (Section 6.10). We treat dataset B’s headline accuracy as a property of this specific feature engineering choice rather than as evidence about the general difficulty of phishing detection in 2023, and recommend that future replications either exclude this feature or report results with and without it.
Adversarial evasion experiment uses a simplified perturbation model. The evasion experiment (Section 6.10) applies Gaussian perturbation directly to feature values without constraining perturbations to remain realizable by an actual attacker manipulating a URL or webpage (e.g., some perturbed feature combinations may not correspond to any real, renderable page). The reported evasion rates should therefore be read as an upper bound on susceptibility to feature-space perturbation, not as a validated estimate of real-world attacker success rates.
Peak memory consumption is not reported. As noted in Section 6.11, peak memory consumption could not be reliably measured with the profiling approach used in this study’s training environment, and no memory figures are reported anywhere in this manuscript as a result. This should be read as a remaining gap in the computational evaluation rather than as evidence that memory usage is negligible or comparable across models; training and inference time (Table 17) are reported in its place, and dedicated, reliable memory profiling remains an item for future work.
Analyst-actionability categorization was not independently re-checked. The four-category classification of top-10 SHAP-ranked features (Section 6.9) used to compute the actionability percentages was implemented as a deterministic, keyword-based rule classifier—a fixed, fully disclosed list of feature-name substrings mapped to categories, applied identically and reproducibly to every feature—designed and applied by a single author (S. M. N. Ahmed). This is more reproducible than an unstructured manual judgment call, since the rules themselves are reported in full and any reader can re-apply them, but the rule set was neither independently re-implemented by a second author nor checked against a manual categorization, and no inter-rater or rule-vs.-manual agreement statistic was computed. Some feature names could plausibly be assigned to more than one category (e.g., an HTTPS-related feature has both a URL-structure and a domain/host reading), and the current rule set resolves such cases by a fixed first-match-wins keyword order rather than by adjudicated consensus. Future replications should independently re-implement or manually audit the rule set and report an agreement statistic such as Cohen’s
Feature listings for datasets B–D are not reproduced in full in the main text. Table 1 reports feature counts for all four datasets, and Table 11 and Figs. 25–28 report the SHAP-ranked features that matter most for classification, but the complete feature listings for datasets B, C, and D (as opposed to dataset A, reproduced in Table 2) are available from the corresponding author on request rather than tabulated here, in the interest of length.
Addressing these remaining points—particularly a full grid or nested cross-validation search, dataset-B feature auditing, and a more realistic (constrained) adversarial perturbation model—is the most direct path toward a still stronger follow-up study, and we outline this as future work in the conclusion below.
This paper re-evaluated three gradient boosting models – XGBoost, LightGBM, and CatBoost—for phishing URL detection under a corrected, leakage-free training protocol, extended the evaluation from one dataset to four spanning 2015–2026, and paired the classification results with a SHAP-based explainability framework whose central claims are now tested rather than asserted. Under a 60:20:20 train/validation/test split with validation-only hyperparameter selection, XGBoost reached the highest accuracy on the primary benchmark (99.11%, dataset A), narrowly ahead of LightGBM and CatBoost (98.70% each); paired McNemar tests and five-seed repeated training show this ranking is not statistically significant, and we report it descriptively rather than as evidence of one model’s superiority. This significance testing was conducted on dataset A only and was not repeated on the other three datasets; the accuracy figures reported across datasets B, C, and D are likewise descriptive rather than statistically validated. Across those three additional datasets, accuracy ranged from 96.08%–96.27% on the most recent (2026) benchmark to near-ceiling on a 2023 benchmark whose near-perfect separability we attribute, with appropriate caution, to a single dominant feature rather than to the general tractability of the task.
A quantitative, reproducible definition of SHAP feature reliance—a feature counted as non-trivial when its mean
Future work should prioritize a full grid or nested cross-validation search in place of the random search used here; extending the statistical significance testing of Section 6.2 to datasets B, C, and D; auditing and, where appropriate, excluding dominant single features such as URLSimilarityIndex on dataset B; and replacing the Gaussian perturbation model in Section 6.10 with attacker-realizable perturbations constrained to renderable URLs and pages, which would tighten the evasion-rate estimates from an upper bound toward a validated measure of real-world adversarial risk.
Acknowledgement: Not applicable. AI-based tools were used for grammatical and language refinement, LaTeX formatting, and reorganization of this manuscript during revision; the experimental pipeline, results, and analysis reported herein were produced and reviewed by the authors, and no AI tools were used in the development of the research methodology or in the generation of the underlying results.
Funding Statement: The authors received no specific funding for this study.
Author Contributions: The authors confirm contribution to the paper as follows: conceptualization, S. M. Nihal Ahmed and Afrim Hossen Khan; methodology, S. M. Nihal Ahmed; software, S. M. Nihal Ahmed; validation, S. M. Nihal Ahmed, Afrim Hossen Khan, and Md. Mazbaur Rashid; formal analysis, S. M. Nihal Ahmed and Afrim Hossen Khan; investigation, S. M. Nihal Ahmed, Afrim Hossen Khan, and Md. Mazbaur Rashid; data curation, S. M. Nihal Ahmed and Md. Mazbaur Rashid; writing—original draft preparation, S. M. Nihal Ahmed; writing—review and editing, Afrim Hossen Khan and Md. Mazbaur Rashid; visualization, S. M. Nihal Ahmed; supervision, Afrim Hossen Khan. All authors reviewed and approved the final version of the manuscript.
Availability of Data and Materials: The datasets that support the findings of this study are openly available: Dataset A in Mendeley Data at https://doi.org/10.17632/h3cgnj8hft.1 [22]; Dataset B (PhiUSIIL) as described in [23] (https://doi.org/10.1016/j.cose.2023.103545); Dataset C (URL-Phish) in Mendeley Data at https://data.mendeley.com/datasets/65z9twcx3r/2 [24]; and Dataset D (LegitPhish) in Mendeley Data at https://data.mendeley.com/datasets/hx4m73v2sf/1 [25]. The full implementation, including data preprocessing, the validation-only hyperparameter search, model training, the SHAP-based explainability pipeline, and the evaluation code used to produce every table and figure in this manuscript, is publicly available as a Kaggle notebook at https://www.kaggle.com/code/smnihalahmed/cs-pish-final. The trained model configurations (Table 4) and the full results tables underlying this manuscript are available from the corresponding author upon reasonable request.
Ethics Approval: Not applicable. This study did not involve human or animal subjects; it uses publicly available, pre-anonymized phishing URL/webpage feature datasets.
Conflicts of Interest: The authors declare no conflicts of interest.
References
1. International Telecommunication Union (ITU). Percentage of Individuals using the Internet 2000–2017. 2018 [cited 2026 Aug 26]. Available from: https://www.itu.int/en/ITU-D/Statistics/Documents/statistics/2018/Individuals_Internet_2000-2017.xls. [Google Scholar]
2. Ahmad T. Corona virus (COVID-19) pandemic and work from home: challenges of cybercrimes and cybersecurity. SSRN Electron J. 2020. doi:10.2139/ssrn.3568830. [Google Scholar] [CrossRef]
3. IBM. Phishing attack. 2025 [cited 2026 Aug 26]. Available from: https://www.ibm.com/topics/phishing. [Google Scholar]
4. Anti-Phishing Working Group (APWG). Phishing activity trends reports 2021–2023. 2023 [cited 2026 Aug 26]. Available from: https://apwg.org/trendsreports/. [Google Scholar]
5. Tang L, Mahmoud QH. A survey of machine learning-based solutions for phishing website detection. Mach Learn Knowl Extr. 2021;3(3):672–94. doi:10.3390/make3030034. [Google Scholar] [CrossRef]
6. Mohanty S, Sahoo M, Acharya AA. Predicting phishing URL using filter-based feature selection. In: Proceedings of the 2022 Second International Conference on Computer Science, Engineering and Applications (ICCSEA); 2022 Sep 8; Gunupur, India. p. 1–5. [Google Scholar]
7. Abdillah R, Shukur Z, Mohd M, Harum N, Wahab JA, Yusop OM. Performance evaluation of phishing classification techniques. IEEE Access. 2023;11:38721–38. [Google Scholar]
8. Shirazi H, Muramudalige SR, Ray I, Jayasumana AP. Improved phishing detection algorithms using adversarial autoencoder synthesized data. In: Proceedings of the 2020 IEEE 45th Conference on Local Computer Networks (LCN); 2020 Nov 16–19; Sydney, NSW, Australia. p. 24–32. [Google Scholar]
9. Sharma SR, Parthasarathy R, Honnavalli PB. A feature selection comparative study for web phishing datasets. In: Proceedings of the 2020 IEEE International Conference on Electronics, Computing and Communication Technologies (CONECCT); 2020 Jul 2–4; Bangalore, India. p. 1–6. [Google Scholar]
10. Abdul Samad SR, Balasubaramanian S, Al-Kaabi AS, Almakdi S, Alsolami F, Alqahtani A, et al. Performance impact of fine-tuned machine learning model for phishing detection. Electronics. 2023;12(7):1642. doi:10.3390/electronics12071642. [Google Scholar] [CrossRef]
11. Almousa M, Basavaraju S, Anwar M. Phishing detection using deep learning and hyperparameter tuning. Secur Priv. 2022;5(6):e256. [Google Scholar]
12. Wei Y, Sekiya Y. Sufficiency of ensemble machine learning methods for phishing websites detection. IEEE Access. 2022;10:124103–13. doi:10.1109/access.2022.3224781. [Google Scholar] [CrossRef]
13. Haynes K, Shirazi H, Ray I. Lightweight URL-based phishing detection using natural language processing transformers for mobile devices. Procedia Comput Sci. 2021;191:127–34. doi:10.1016/j.procs.2021.07.040. [Google Scholar] [CrossRef]
14. Kalabarige LR, Rao RS, Pais AR, Annappa B. Stacked ensemble learning model for phishing detection. IEEE Access. 2022;10:79543–52. [Google Scholar]
15. Kalabarige LR, Rao RS, Pais AR, Annappa B. Boosting-based hybrid feature selection model for phishing detection. IEEE Access. 2023;11:71180–93. [Google Scholar]
16. Kytidou E, Tsikriki T, Drosatos G, Rantos K. Machine learning techniques for phishing detection: a review of methods, challenges, and future directions. Intell Decis Technol. 2025;19(6):4356–79. [Google Scholar]
17. Vennela A, Akarapu RB, Rakshith BL, Asirvatham LG, Sunil G. Intelligent cybersecurity systems for phishing attack detection—an overview. Comput Electr Eng. 2026;130:110829. doi:10.1016/j.compeleceng.2025.110829. [Google Scholar] [CrossRef]
18. Al-Haija QA, Al Badawi A. URL-based phishing websites detection via machine learning. In: Proceedings of the 2021 International Conference on Data Analytics for Business and Industry (ICDABI); 2021 Oct 25–26; Sakheer, Bahrain. p. 644–9. [Google Scholar]
19. Somesha M, Pais AR, Rao RS, Rathour VS. Efficient deep learning techniques for the detection of phishing websites. Sādhanā. 2020;45(1):229. [Google Scholar]
20. Birthriya SK, Ahlawat P, Jain AK. Phishing URLs detection method using hybrid feature and convolutional neural networks with attention mechanisms. In: Communications in computer and information science. Cham, Switzerland: Springer; 2024. p. 290–303. [Google Scholar]
21. Birthriya SK, Ahlawat P, Jain AK. A novel multi-objective optimization-XGBoost based feature selection and optimization for enhanced phishing website detection. Clust Comput. 2025;28(10):664. [Google Scholar]
22. Tan CL. Phishing dataset for machine learning: feature evaluation. Mendeley Data. 2018:V1. doi:10.17632/h3cgnj8hft.1. [Google Scholar] [CrossRef]
23. Prasad A, Chandra S. PhiUSIIL: a diverse security profile empowered phishing URL detection framework based on similarity index and incremental learning. Comput Secur. 2024;136:103545. [Google Scholar]
24. Dam Minh L, Tran Cong H. URL-phish: a feature-engineered dataset for phishing detection. Mendeley Data. 2026:V2. doi:10.17632/65z9twcx3r.2. [Google Scholar] [CrossRef]
25. Potpelwar RS, Kulkarni UV, Waghmare JM. LegitPhish: a large-scale annotated dataset for URL-based phishing detection. Data Brief. 2025;63:111972. [Google Scholar]
26. Chen T, Guestrin C. XGBoost: a scalable tree boosting system. In: Proceedings of the 22nd ACM SIGKDD International Conference on Knowledge Discovery and Data Mining (KDD); 2016 Aug 13–17; San Francisco, CA, USA. p. 785–94. [Google Scholar]
27. Ke G, Meng Q, Finley T, Wang T, Chen W, Ma W, et al. LightGBM: a highly efficient gradient boosting decision tree. In: Advances in Neural Information Processing Systems (NeurIPS). Red Hook, NY, USA: Curran Associates, Inc.; 2017. p. 3146–54. [Google Scholar]
28. Hua Y. An efficient traffic classification scheme using embedded feature selection and LightGBM. In: Proceedings of the 2020 Information Communication Technologies Conference (ICTC); 2020 May 29–31; Nanjing, China. p. 125–30. [Google Scholar]
29. He X, Pan J, Jin O, Xu T, Liu B, Xu T, et al. Practical lessons from predicting clicks on ads at Facebook. In: Proceedings of the 8th International Workshop on Data Mining for Online Advertising (ADKDD); 2014 Aug 24–27; New York, NY, USA. p. 1–9. [Google Scholar]
30. Prokhorenkova L, Gusev G, Vorobev A, Dorogush AV, Gulin GA. CatBoost: unbiased boosting with categorical features. In: Advances in Neural Information Processing Systems (NeurIPS). Red Hook, NY, USA: Curran Associates, Inc.; 2018. p. 6639–49. [Google Scholar]
31. Lundberg SM, Lee SI. A unified approach to interpreting model predictions. In: Advances in Neural Information Processing Systems (NeurIPS). Red Hook, NY, USA: Curran Associates, Inc.; 2017. p. 4765–74. [Google Scholar]
32. Lundberg SM, Erion G, Chen H, DeGrave A, Prutkin JM, Nair B, et al. From local explanations to global understanding with explainable AI for trees. Nat Mach Intell. 2020;2(1):56–67. [Google Scholar]
33. Youden WJ. Index for rating diagnostic tests. Cancer. 1950;3(1):32–5. [Google Scholar]
34. McNemar Q. Note on the sampling error of the difference between correlated proportions or percentages. Psychometrika. 1947;12(2):153–7. [Google Scholar]
Cite This Article
 Copyright © 2026 The Author(s). Published by Tech Science Press.
This work is licensed under a Creative Commons Attribution 4.0 International License , which permits unrestricted use, distribution, and reproduction in any medium, provided the original work is properly cited.
 Downloads
 Citation Tools
