
 Submit a Paper
 Propose a Special lssue
 Open Access
REVIEW

An Overview of Modern Cartographic Trends Aligned with the ICA’s Perspective
1 Faculty of Civil Engineering, Damascus University, Damascus, 20872, Syria
2 College of Engineering, King Saud University, Riyadh, 11421, Saudi Arabia
* Corresponding Author: Maan Habib. Email:
Revue Internationale de Géomatique 2023, 32, 1-16. https://doi.org/10.32604/rig.2023.043399
Received 01 July 2023; Accepted 13 September 2023; Issue published 30 September 2023
 View Full Text
 Download PDF
Abstract
This study provides a comprehensive overview of modern cartography innovations and emerging trends, highlighting the importance of geospatial representation in various fields. It discusses recent advancements in geospatial data collection techniques, including satellite and aerial imagery, Light Detection and Ranging (LiDAR) technology, and crowdsourcing. The research also investigates the integration of big data, machine learning, and real-time processing in Geographic Information Systems (GIS), as well as advances in geospatial visualization. In addition, it examines the role of cartography in addressing global challenges such as climate change, disaster management, and urban planning in line with the International Cartographic Association’s (ICA) perspectives. The study discusses the ethical considerations and challenges associated with modern cartography, including privacy, data security, and accessibility issues. Finally, it outlines future directions and opportunities in cartography, focusing on the potential applications of artificial intelligence, interdisciplinary collaborations, and open-source platforms. This discussion aims to emphasize the significance of continued research and development in cartography and encourage interdisciplinary collaboration for a better understanding of the world.Keywords
Cartography is the art and science of producing maps, and it is at the heart of human history because it plays a pivotal role in representing the world [1]. The development of map-making stretches from the earliest cave paintings to today’s high-resolution satellite images [2,3]. In the era of rapidly evolving technology and increasing global connectivity, maps have become an indispensable tool for understanding and navigating the world [4–6]. Since the earliest known maps from ancient civilizations, cartography has played a vital role in various fields, including exploration, navigation, transportation, urban planning, and environmental management. Currently, most computerized data produced today has a geospatial component, and cartography has long focused on representing, analyzing, and transmitting this location-based data [7,8]. Over the years, various methods, tools, and technologies have been introduced in cartography to allow for effective communication of this data [9–11]. These cartographic developments have facilitated the ability to navigate the environment, comprehend complex natural and societal phenomena, and provide critical insights for social, political, and economic decision-making [12–17].
The International Cartographic Association (ICA) plays a pivotal role in shaping the trajectory of cartography and geospatial information science. This role, as highlighted by Virrantaus et al. [18], stems from the inherent power of maps and geographic information to connect, integrate, and represent data sets based on geographical locations. ICA’s research drives innovations in cartography, with their Commissions and Working Groups transforming theories into practice. Concurrently, the broader geospatial community, as noted by Bill et al. [19] and Kraak [20], emphasizes the interdisciplinary nature of geographic information science and its potential to address societal challenges. The ICA and geospatial community envision a future where geospatial information becomes a transformative force. The relationship between cartography and geospatial science/engineering has been a subject of discourse, leading to varying viewpoints: (1) Cartography encompasses all processes from geospatial data collection to visualization; (2) Cartographic works begin with existing data, transforming them into valuable information presented through maps or map-like representations; (3) Cartography primarily deals with the visualization and communication of geospatial data. Given the ICA’s emphasis on the second viewpoint, this manuscript aligns its discussions, accordingly, focusing on how existing geospatial data is transformed and visualized in modern contexts [18].
Recently, the proliferation of satellite and aerial imagery [21–23], Light Detection and Ranging (LiDAR) technology [24,25], and the increasing accessibility of geospatial data through crowdsourcing and volunteer geographic information [26–29] have driven the growth of cartography. These developments have expanded the possibilities of geographic information systems (GIS) [30–32], which now integrate big data [33,34], machine learning [35,36], and real-time data processing to create more sophisticated and accurate maps [37,38]. In addition, new visualization techniques, such as augmented reality (AR) [39,40] and virtual reality (VR) [41,42], have revolutionized map design and representation, making them more interactive and engaging.
This study aims to provide an overview of the innovations and emerging trends in modern cartography, focusing on transforming geospatial data into meaningful visual representations. It also examines the role of cartography in addressing global challenges, such as climate change, disaster management, and urban planning, and navigates the ethical considerations associated with the field. Finally, this research outlines future directions and opportunities in the field, emphasizing the potential applications of Artificial Intelligence (AI), interdisciplinary collaborations, and open-source platforms.
2 Advancements in Geospatial Science/Engineering
The ICA [43] defines cartography as “the discipline dealing with the conception, production, dissemination, and study of maps”. It continues, “A map is a symbolized image of geographic reality, representing selected features or characteristics, resulting from the creative efforts of cartographers, and is designed for use when spatial relationships are of special relevance”. In practice, the cartographic process (Fig. 1) is an intricate procedure involving several key steps [44,45]. It is a continuous cycle starting with an environment filled with spatial data. It involves data collection using advanced technologies, followed by pattern perception based on expertise and map purpose. Cartographers then prepare this data, deciding on its visualization by considering scale and theme. During encoding, data is transformed using symbolization and possibly generalized for clarity before being produced for its audience. Map users then decode and interpret the symbols to extract insights. These maps influence decisions, from travel to urban planning. They also shape our spatial behavior and understanding of environments. At its core is map abstraction, artfully simplifying complex realities [46]. Each step of the cartographic process is integral and requires different skills and tools.
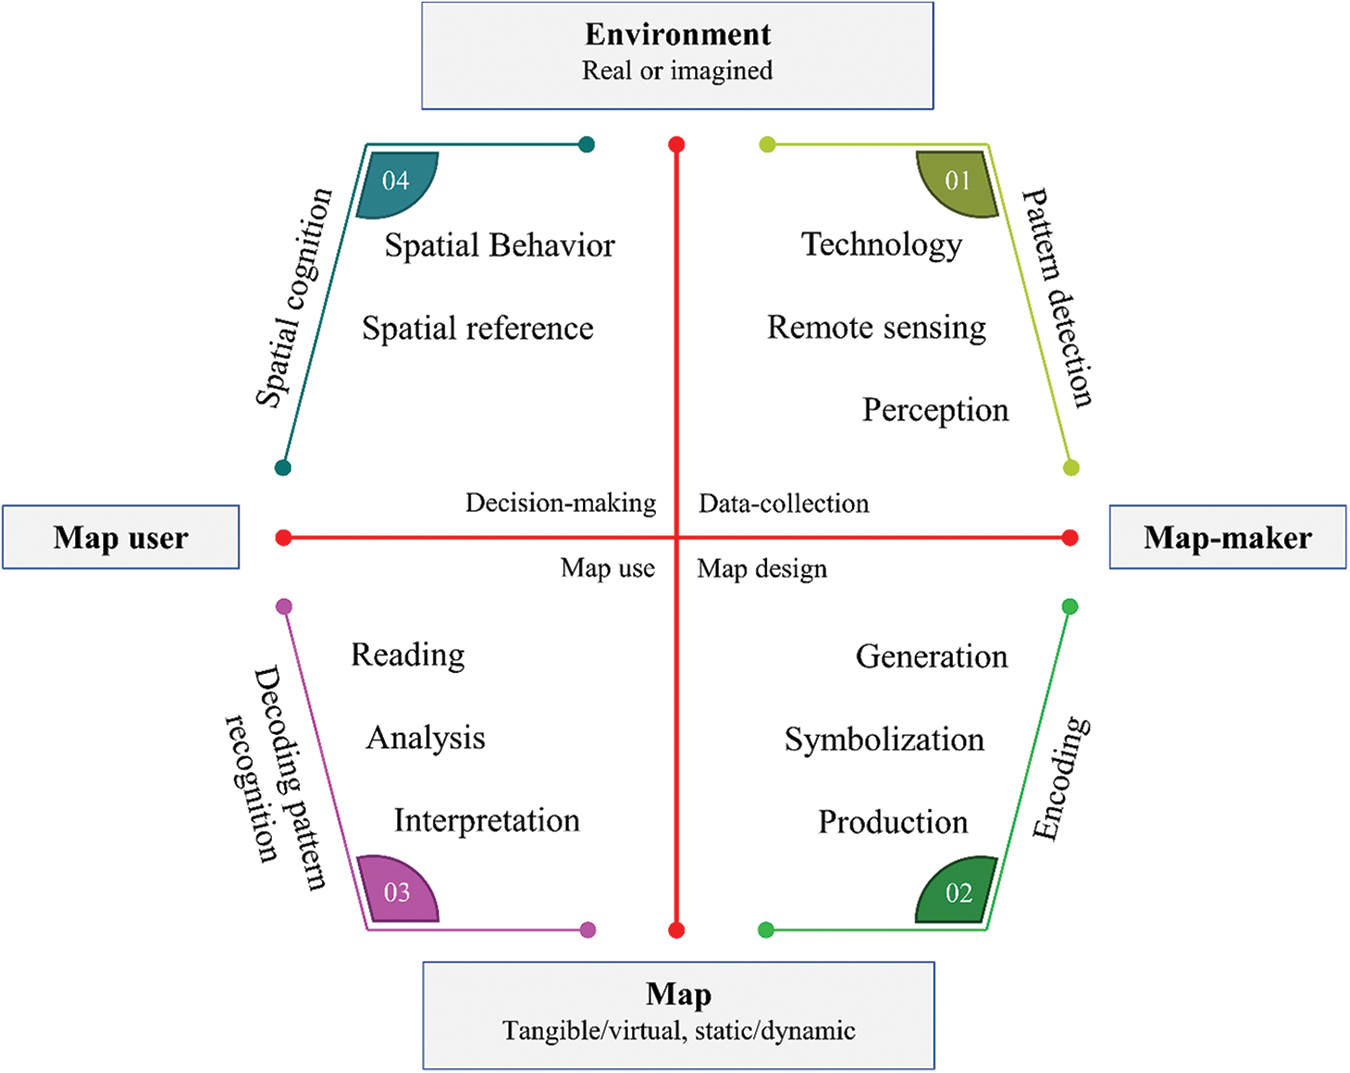
Figure 1: Cartographic process
In contrast, the advancements in geospatial science/engineering profoundly impact cartography. The availability of high-resolution, multi-temporal data means that maps can now be updated more frequently, ensuring they represent the most current state of the landscape. In addition, integrating diverse datasets, such as LiDAR-derived topography with satellite imagery, allows for richer map visualizations. Automation in data processing also means that cartographers can focus more on the design, aesthetics, and usability of maps, enhancing the user experience and the utility of the maps.
1. Data collection: The first step in the cartographic process is data collection. This can involve fieldwork in which surveyors measure and record information about the physical world or gather existing data from databases, satellite imagery, aerial photos, or other sources. The collected data can relate to a wide range of characteristics, including physical attributes (topography or hydrography), biological factors (vegetation or wildlife distributions), or even human aspects (population density or infrastructure).
2. Data processing: After collecting the data, it must be processed. This typically involves converting raw data into a usable format utilizing the software. The data can also require cleansing or transformation. For example, survey data must be converted from spherical coordinates (latitude, longitude, and elevation) to a flat, two-dimensional map projection.
3. Symbolization: Cartographers represent the data on the map with symbols. This can include using dots to represent cities, lines to represent roads, or colored areas to represent various vegetation types. The choice of symbols can significantly affect how the map is interpreted, so choosing symbols that accurately represent the data is crucial.
4. Map design: The design phase determines how all the map elements will fit together. This includes the map’s layout and additional elements such as the map’s key, scale bar, and title. A well-designed map must be both visually appealing and easy to understand.
5. Map production: Involves printing physical copies of the map, creating a digital version for use in a GIS, or publishing the map online. The production method of a map will depend on its intended use.
6. Map use and evaluation: It is used for its intended purpose, whether guiding travelers, assisting scientists to understand patterns in data, or informing policymakers. Map users or professional peers can evaluate the map, offering feedback that can be utilized to improve future maps.
Cartographers must be detail-oriented and meticulous, with strong spatial thinking abilities and a good understanding of geography, mathematics, and design principles. With the rise of digital technology and GIS, they must also be proficient with advanced software and managing complex datasets.
2.1 Innovations in Geospatial Data Collection
The geospatial industry is transforming rapidly, driven by modern technologies that allow for more accurate, detailed, and practical spatial data analysis [47–51]. Artificial intelligence and Machine Learning (ML) play pivotal roles in the geospatial industry by processing vast datasets, enabling faster analysis of satellite imagery, and predicting trends. Using geospatial sensors, the Internet of Things (IoT) also provides real-time data, such as location, weather conditions, and movement patterns. In contrast, the advent of 5G technology enhances data transmission speed, facilitating real-time geospatial analysis and utilizing more complex applications. Big data analytics tools manage, process, and analyze the enormous volumes of data produced by the geospatial sector, generating meaningful insights for better decision-making. Cloud computing is increasingly essential for efficiently storing, accessing, and processing these large datasets and promotes collaboration across locations. The industry also benefits from advancements in satellite technology, with micro and nanosatellites offering detailed and frequent imagery, while drones capture high-resolution topography and imagery, especially in inaccessible areas. Augmented reality and virtual reality technologies provide immersive approaches to visualize and interact with geospatial data, and the potential of blockchain technology ensures the provenance and integrity of spatial data. These technologies collectively drive the geospatial industry forward, facilitating more accurate decisions and predictions and fostering innovation across many sectors. Technological advancements have significantly improved the methods and techniques used for geospatial data collection, as depicted in Fig. 2. These innovations have enabled cartographers to capture more accurate, detailed, and up-to-date geospatial information, enhancing the quality and utility of maps and GIS. This section discusses some of the most notable innovations in geospatial data collection, including remote sensing, LiDAR technology, and crowdsourcing.
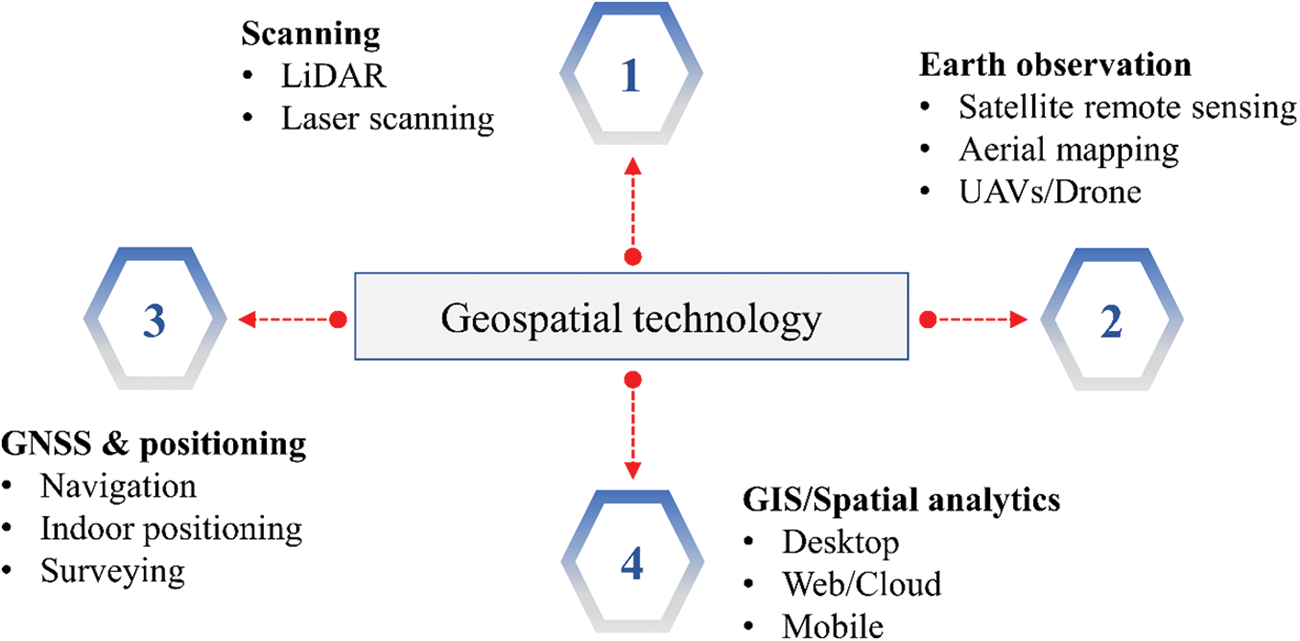
Figure 2: Elements of geospatial technology
Remote sensing technologies, particularly satellite imagery, have revolutionized geospatial data collection by providing continuous, large-scale, high-resolution data on the Earth’s surface. The availability of multispectral and hyperspectral sensors on satellites allows cartographers to capture detailed information about land cover, vegetation, and environmental conditions. Unmanned Aerial Vehicles (UAVs) or drones complement these technologies by offering flexible, localized data collection [52,53]. In addition, the increasing accessibility and affordability of satellite imagery have enabled researchers and practitioners to access and analyze geospatial data for various applications, such as environmental monitoring [54,55], urban planning [56,57], and disaster management [58]. LiDAR is a remote sensing technology that uses laser pulses to measure distances and build detailed, three-dimensional representations of the Earth’s surface. LiDAR technology has been widely adopted in cartography to capture high-resolution elevation data and generate accurate digital elevation models [59,60]. These models are essential for various applications, including flood risk assessment, infrastructure planning, and forestry management. In addition, recent advancements in drone-mounted LiDAR systems have expanded the potential applications of this technology, enabling the collection of geospatial data in inaccessible or hazardous areas [61]. Crowdsourcing and volunteer geographic information (VGI) have emerged as practical tools for collecting geospatial data, allowing individuals and communities to contribute local knowledge and observations to mapping projects [62]. They are valuable for mapping areas with limited or outdated geospatial data and capturing dynamic phenomena, including traffic conditions, natural disasters, and social events [63]. Platforms such as OpenStreetMap, Google Map Maker, and various citizen science initiatives enable users to collect, edit, and share geospatial data, creating more accurate and up-to-date maps [64,65].
Geographic Information Systems have evolved considerably over the years, driven by advancements in computing power, data storage, and geospatial analysis techniques, as depicted in Fig. 3. These developments have enabled cartographers and GIS professionals to manage, analyze, and visualize geospatial data more effectively, leading to innovative solutions and insights across various domains [66]. This section describes some of the most significant advances in GIS, including improvements in data integration and management, enhanced geospatial analysis capabilities, and the development of web-based GIS platforms. Integrating and managing diverse geospatial data from various sources is a substantial development in GIS [67]. Modern GIS platforms can handle vector, raster, point cloud, and non-spatial data, such as text, images, and multimedia. It enables cartographers and GIS professionals to create comprehensive and multi-layered maps that incorporate various types of information, such as land use, demographics, infrastructure, and environmental conditions. In addition, advanced data management techniques, such as data compression, indexing, and caching, have improved the performance and efficiency of GIS, allowing users to work with large datasets and complex geospatial analyses more effectively.
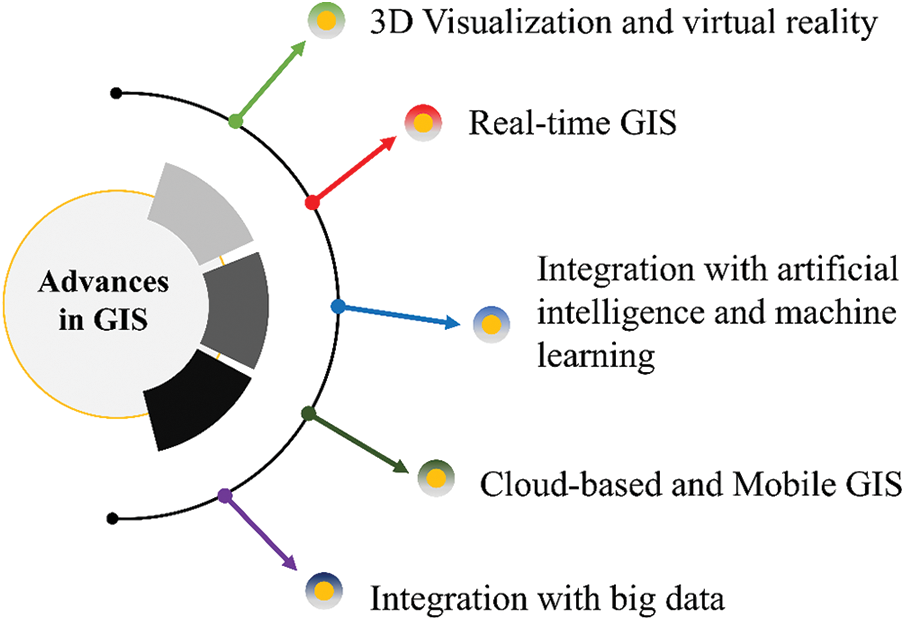
Figure 3: The evolution of GIS
The advancements in GIS technology have also led to the development of sophisticated geospatial analysis tools and techniques [68]. These include spatial statistics, network analysis, and geospatial modeling, which enable users to identify patterns, trends, and relationships within geospatial data. For instance, spatial statistics can be employed to analyze the distribution of natural resources, disease outbreaks, or crime incidents, while network analysis can help optimize transportation routes, model traffic flow, or plan emergency response strategies [69–71]. In contrast, geospatial modeling allows cartographers and GIS professionals to simulate and predict future scenarios, such as land use change, urban growth, or climate change impacts [72,73]. The emergence of web-based GIS platforms and mobile applications has significantly expanded the accessibility and usability of GIS technology. Web-based GIS platforms, such as ArcGIS Online, Carto, and Mapbox, allow users to create, edit, and share geospatial data and maps through a user-friendly, browser-based interface, eliminating the need for specialized software and hardware. In addition, mobile applications, such as Google Maps, Apple Maps, and various GIS apps, enable users to access and interact with geospatial data on the go, enhancing the utility and significance of GIS in daily life.
The landscape of cartography has been dynamically evolving, especially with the influx of technological advancements rooted in geospatial science/engineering. As one navigates through modern cartographic trends, it is evident that these are not isolated developments but are deeply intertwined with innovations in geospatial technologies [74]. The evolution of cartography, marked by Fraser Taylor’s term “cybercartography” in 1997 [75], denotes the shift towards digital, multimedia-rich mapping. The ICA’s establishment of the Neo-cartography Commission in 2011–15 further emphasized this shift, highlighting the democratization of map-making [20]. Modern cartography, termed “cartography 2.0”, empowers even amateurs to create maps tailored to immediate needs, facilitated by technology [76]. However, foundational cartographic principles, like maps as abstractions of reality, remain unchanged. Today’s cartography, enriched by technology, democratizes map-making and emphasizes the power of spatially organizing information.
• Digital Mapping: The transition from traditional paper maps to digital formats has been transformative. Digital maps offer flexibility in representation, ease of dissemination, and the capability for real-time updates. With platforms such as OpenStreetMap and Google Maps, users can now interact with, modify, and use maps in previously unimaginable ways.
• 3D Mapping: With the advent of technologies such as LiDAR and 3D modeling software, cartographers can now create detailed three-dimensional representations of landscapes, buildings, and other features. These 3D maps provide a more immersive experience and are particularly useful in urban planning, disaster management, and virtual tourism.
• Real-Time Mapping: Powered by the IoT and real-time data collection methods, maps can be updated instantaneously. This is crucial in applications such as traffic management, disaster response, and environmental monitoring, where timely information can be pivotal.
• Interactive Maps: Modern cartography emphasizes user interaction. Interactive maps, often web-based, allow users to zoom, pan, query, and modify the map content based on their requirements. They offer personalized experiences and are instrumental in education, tourism, and public information dissemination.
The technological backbone supporting these trends includes integrating big data, machine learning algorithms, and advanced visualization techniques. For instance, big data analytics power the real-time processing of vast amounts of geospatial data, enabling real-time mapping. Machine learning, on the other hand, aids in automated feature extraction, anomaly detection, and predictive mapping. Advanced visualization techniques, supported by augmented and virtual reality, take map interactivity and immersion to new heights. Modern cartography is a confluence of art, science, and technology, where geospatial engineering innovations play a pivotal role in shaping cartographic trends.
3.1 Emerging Trends in Map Design and Representation
Incorporating AR and VR in cartography has created new opportunities for immersive and interactive geospatial experiences. AR-enhanced maps overlay digital information, such as labels, directions, or points of interest, onto the real world, providing users with contextualized and easily accessible geospatial data [77]. On the other hand, VR allows users to explore virtual representations of geographic spaces, enabling them to visualize complex geospatial data more intuitively and engagingly. In addition, 3D geographical scenes have emerged as a groundbreaking tool for reshaping how geospatial data is perceived [78]. These scenes go beyond the traditional 2D maps and satellite images, offering users a multi-dimensional perspective of terrains, cityscapes, and natural landscapes. They blend topographical data with satellite imagery, leading to accurate and lifelike depictions of Earth’s surface. These technologies hold great potential for applications in tourism, navigation, education, urban planning, and others [79]. The introduction of 3D mapping has revolutionized the representation and comprehension of geospatial data. These maps provide a more realistic and detailed visualization of geographic features, such as elevation, terrain, and infrastructure, by incorporating three-dimensional data. There are numerous applications for three-dimensional mapping, including city planning, transportation, infrastructure management, and environmental analysis [80]. In particular, integrating 3D mapping with Building Information Modeling (BIM) has facilitated more efficient and accurate construction, management, and visualization of infrastructure projects. The growing demand for user-friendly and engaging maps has emerged in response to interactive and multimedia maps, allowing users to access, manipulate, and customize geospatial data according to their needs. These maps often integrate multimedia elements, such as audio, video, and animation, to enhance the user experience and provide additional context [8]. Popular examples of interactive maps include web-based maps, mobile apps, and touchscreen-enabled kiosks. These maps have been widely adopted in various sectors, such as tourism, transportation, real estate, and environmental management, for their ability to provide users with real-time, customizable, and context-specific information.
3.2 Cartography in Addressing Global Challenges
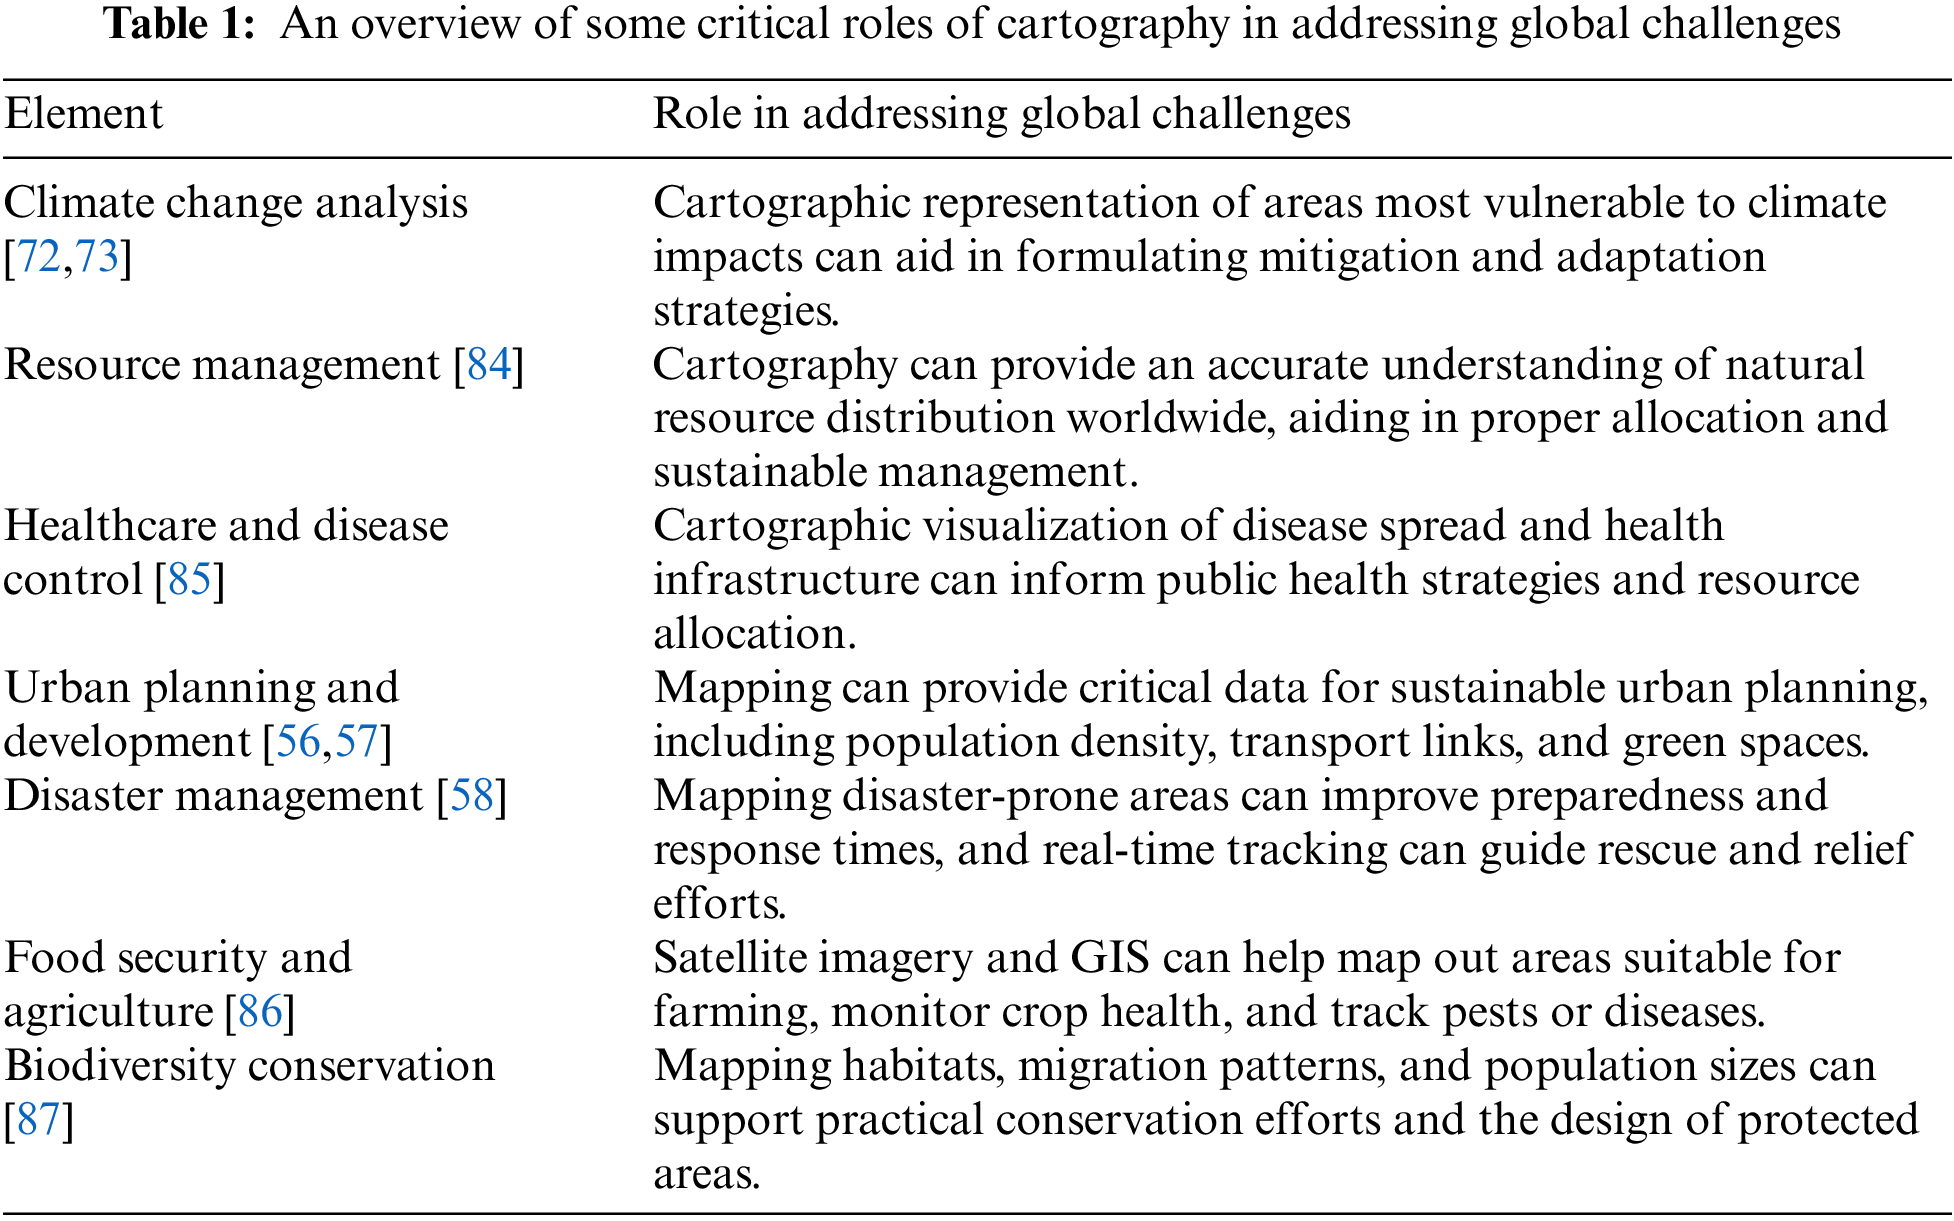
Effective monitoring and managing climate change and its impacts require accurate and up-to-date geospatial data. Modern cartography is crucial in tracking environmental changes, such as deforestation, land use change, and the melting of polar ice caps. Remote sensing technologies and satellite imagery provide continuous, large-scale data that can be utilized to identify trends, patterns, and anomalies in environmental conditions. Furthermore, sophisticated GIS tools enable the integration and analysis of various data types, such as temperature, precipitation, and vegetation, to develop predictive models and inform climate change mitigation and adaptation strategies. Modern cartography and geospatial analysis are essential disaster management and risk assessment tools. High-resolution maps and 3D models help identify vulnerable areas, assess potential hazards, and plan emergency response and evacuation routes [81,82]. In addition, real-time geospatial data, such as satellite imagery and social media feeds, can monitor ongoing disasters and track their impacts. Table 1 lists an overview of some critical roles of cartography in addressing global challenges.
Advanced GIS platforms facilitate the integration of various data sources, enabling decision-makers to develop comprehensive disaster management plans and allocate resources effectively. Cartography is also critical in post-disaster recovery by providing updated maps and geospatial data to support reconstruction and rehabilitation initiatives. With rapid urbanization and population growth, sustainable and efficient urban planning has become a top priority for governments and city planners worldwide [83]. Modern cartography and geospatial technologies provide valuable tools for managing urban growth, optimizing transportation networks, and enhancing the livability of cities. High-resolution maps and 3D models offer detailed representations of urban landscapes, infrastructure, and land use patterns, enabling planners to make informed decisions and identify opportunities for improvement. In addition, smart cities rely heavily on geospatial data and real-time monitoring to optimize city operations, such as traffic management, public transportation, waste management, and energy distribution. As global challenges continue to evolve, the role of cartography in addressing these issues will become increasingly important. The advancements in geospatial data collection, GIS technologies, and map design and representation will enhance understanding of the world and empower decision-makers, researchers, and practitioners to develop innovative solutions for a more sustainable and resilient future.
4 Ethical Considerations and Challenges in Modern Cartography
As cartography embraces advanced technologies and becomes increasingly integrated into various aspects of our lives, it is essential to address the ethical considerations and challenges associated with the field [88–91]. This section discusses some primary concerns related to modern cartography, including privacy and data security, accessibility and inclusivity in map design, and the potential misuse of geospatial data. The widespread use of high-resolution satellite imagery, aerial photography, and location-based data collection has raised concerns about privacy and data security. As geospatial data becomes more detailed and accurate, there is an increased risk of infringing on personal privacy and revealing sensitive information. For instance, street-level imagery can capture individuals’ faces or license plates, whereas location-based data can reveal patterns of movement and behavior. To address these concerns, cartographers and data providers must develop and implement robust privacy policies, anonymize data, and employ data encryption techniques to protect user information and ensure compliance with data protection regulations.
Inclusivity and accessibility in map design are vital to ensure that geospatial information is available and comprehensible to diverse users. However, traditional cartographic practices and designs can inadvertently exclude specific populations, such as individuals with disabilities or limited digital literacy. Modern cartographers must consider factors such as color contrast, font size, and alternative representations for different data types to promote inclusivity and accessibility. Developing user-friendly digital interfaces, voice-activated features, and tactile maps can also help make geospatial information more accessible to a broader audience.
The increasing availability and accessibility of geospatial data also present challenges regarding potential misuse and the spread of disinformation. Inaccurate or outdated maps can lead to confusion, misinterpretation, and misguided decision-making, while deliberately manipulated geospatial data can be used for nefarious purposes, such as spreading propaganda or misinformation. Cartographers and data providers must ensure their maps’ and geospatial data’s accuracy and reliability and promote transparency in data sources and methodologies to combat these issues. Furthermore, establishing industry standards and ethical guidelines can help foster a culture of responsibility and integrity within the cartographic community.
5 Challenges and Opportunities
As the field of cartography continues to advance, new opportunities and directions for research and development are emerging. This section outlines some of the most promising areas for future growth and innovation in cartography, focusing on the potential applications of artificial intelligence, interdisciplinary collaborations, and the role of open-source platforms and data sharing. Artificial intelligence can transform the cartography field by automating complex tasks, improving the accuracy of geospatial data, and enabling the development of more sophisticated mapping techniques. Some potential applications of AI in cartography include:
• Automated feature extraction and classification [92]: Machine learning algorithms can identify and classify geographic features from satellite and aerial imagery, such as roads, buildings, and vegetation, significantly reducing the time and effort required for manual interpretation and digitization.
• Predictive modeling and analysis [93]: AI-powered tools can help analyze large volumes of geospatial data and identify patterns, trends, and relationships, enabling more accurate predictions and simulations of future scenarios, such as climate change, urban growth, or natural disasters.
• Enhanced geospatial visualization [94]: AI techniques, such as generative adversarial networks (GANs) and style transfer, can create more realistic and aesthetically pleasing visualizations of geospatial data, improving user experience and map comprehension.
• Automated map generalization [95]: AI can assist in the process of map generalization, ensuring that maps are readable and relevant at various scales by intelligently deciding which features to display or omit.
• Sentiment mapping using natural language processing [96]: Extracting sentiments from geolocated social media posts, AI can map the mood or sentiment of regions, providing valuable insights for various applications from tourism to emergency response.
The growing recognition of the importance of geospatial information in various fields has created numerous opportunities for interdisciplinary collaboration and research [97]. Cartographers can work closely with experts from diverse domains, such as environmental science, urban planning, public health, and social sciences, to develop innovative mapping techniques and geospatial analyses that address complex, real-world problems. These collaborations can help bridge the gap between theory and practice, foster knowledge exchange, and drive the development of new cartographic tools and methodologies [98].
Open-source platforms and data sharing initiatives have played a critical role in democratizing access to geospatial information and fostering innovation in cartography [99]. These platforms have enabled researchers, professionals, and enthusiasts worldwide to collaborate, learn, and contribute to advancing the field by providing free, open access to mapping tools, geospatial data, and educational resources. Future opportunities in this area include the development of new open-source tools and platforms, establishing data sharing standards and protocols, and promoting open data policies among governments and organizations [100].
In reality, many factors influence geographic mapping, each playing a role in how spatial information is represented and interpreted [101–103]. A well-designed map considers these factors to ensure accuracy, clarity, and relevance for its intended audience. The scale determines the level of detail, while the choice of projection can distort areas, shapes, distances, and directions. The quality and source of data directly impact map reliability, and the design, including colors and symbols, shapes user perception. Map resolution defines detail granularity, and technological tools can pose limitations. Temporal elements highlight the importance of the map’s relevance over time, whereas cultural and political nuances can shape territorial representations. In addition, the map’s intended purpose tailors its content, and human error at any stage can introduce inaccuracies.
In recent years, the evolution of modern cartography has been significantly influenced by advances in geospatial data collection, GIS technologies, and innovative map design and representation techniques. Integrating new technologies such as artificial intelligence, augmented reality, and virtual reality has expanded cartography’s potential applications and capabilities, transforming how people visualize and interact with geospatial data. As the world faces increasingly complex challenges, the role of cartography in providing valuable insights and solutions has become pivotal. This study investigates the latest innovations in geospatial data collection and GIS, emerging trends in map design and representation, and the role of cartography in addressing global issues. In addition, it discusses modern cartography’s ethical considerations and challenges and outlines future directions and opportunities. As the field of cartography continues to make strides, it becomes paramount for researchers, professionals, and policymakers to collaborate to develop and implement robust ethical frameworks, foster interdisciplinary alliances, and advocate for open-source platforms and data sharing. Accordingly, the cartographic community can continue to innovate and push the boundaries of geospatial representation, allowing for a deeper understanding of the world and more effective responses to global challenges.
Acknowledgement: The authors would like to thank the editors and reviewers for their review and recommendations.
Funding Statement: The authors received no specific funding for this study.
Author Contributions: The authors confirm their contribution to the paper as follows: Study conception and design: M. Habib and M. Okayli; data collection: M. Habib; analysis and interpretation of results: M. Okayli and M. Habib; draft manuscript preparation: M. Habib. All authors reviewed the results and approved the final version of the manuscript.
Availability of Data and Materials: The authors confirm that the data supporting the findings of this study are available within the article and supplementary material.
Conflicts of Interest: The authors declare that they have no conflicts of interest to report regarding the present study.
References
1. Krygier, J. B. (1995). Cartography as an art and a science? The Cartographic Journal, 32(1), 3–10. [Google Scholar]
2. Cosgrove, D. (2005). Maps, mapping, modernity: Art and cartography in the twentieth century. Imago Mundi, 57(1), 35–54. [Google Scholar]
3. Lapaine, M. (2019). Mapping in cartography. Proceedings of the International Cartographic Association, 2(2019), 1–3. [Google Scholar]
4. Dodge, M., Kitchin, R., Perkins, C. (2011). The map reader: Theories of mapping practice and cartographic representation. John Wiley & Sons. [Google Scholar]
5. Li, Z. (2012). Theories of map design in the digital era. Cartography and Geographic Information Science, 39(2), 71–75. [Google Scholar]
6. Gartner, G., Huang, H. (2016). Recent research developments in modern cartography in Europe. International Journal of Cartography, 2(1), 1–5. [Google Scholar]
7. Robinson, A. C., Demšar, U., Moore, A. B., Buckley, A., Jiang, B. et al. (2017). Geospatial big data and cartography: Research challenges and opportunities for making maps that matter. International Journal of Cartography, 3(sup1), 32–60. [Google Scholar]
8. Crampton, J. W., Krygier, J. (2018). An introduction to critical cartography. ACME: An International E-Journal for Critical Geographies, 4(1), 11–33. [Google Scholar]
9. MacEachren, A. M., Kraak, M. J. (2001). Research challenges in geo-visualization. Cartography and Geographic Information Science, 28(1), 3–12. [Google Scholar]
10. Griffin, A. L., Fabrikant, S. I. (2012). More maps, more users, more devices means more cartographic challenges. Cartographic Journal, 49(4), 298–301. [Google Scholar]
11. Miller, H. J., Goodchild, M. F. (2015). Data-driven geography. GeoJournal, 80(4), 449–461. [Google Scholar]
12. Biljecki, F., Ledoux, H., Stoter, J. (2016). Generation of multi-LOD 3D city models in CityGML with the procedural modeling engine Random3Dcity. The ISPRS Annals of the Photogrammetry, Remote Sensing and Spatial Information Sciences, 3, 51–59. [Google Scholar]
13. Nagaraj, A., Stern, S. (2020). The economics of maps. Journal of Economic Perspectives, 34(1), 196–221. [Google Scholar]
14. McDonald, Y. J., Anderson, K. M., Caballero, M. D., Ding, K. J., Fisher, D. H. et al. (2022). A systematic review of geospatial representation of United States community water systems. AWWA Water Science, 4(1), e1266. [Google Scholar]
15. Prutzer, E. (2022). Mapping pedagogies: Applying cartographic practice to the public sphere. Learning, Media and Technology, 47(1), 39–52. [Google Scholar]
16. Horbiński, T., Zagata, K. (2022). View of cartography in video games: Literature review and examples of specific solutions. KN-Journal of Cartography and Geographic Information, 72(2), 117–128. [Google Scholar]
17. McFarland, S. (2023). Putting workers on the map: Towards a labour cartography. Cartographica: The International Journal for Geographic Information and Geovisualization, 58(1), 21–38. [Google Scholar]
18. Virrantaus, K., Fairbairn, D., Kraak, M. J. (2009). ICA research agenda on cartography and GI science. The Cartographic Journal, 46(2), 63–75. [Google Scholar]
19. Bill, R., Blankenbach, J., Breunig, M., Haunert, J. H., Heipke, C. et al. (2022). Geospatial information research: State of the art, case studies and future perspectives. PFG-Journal of Photogrammetry, Remote Sensing and Geoinformation Science, 90(4), 349–389. [Google Scholar]
20. Kraak, M. J. (2011). Is there a need for neo-cartography? Cartography and Geographic Information Science, 38(2), 73–78. [Google Scholar]
21. Oghaz, M. M. D., Razaak, M., Kerdegari, H., Argyriou, V., Remagnino, P. (2019). Scene and environment monitoring using aerial imagery and deep learning. 2019 15th International Conference on Distributed Computing in Sensor Systems (DCOSS), pp. 362–369. Santorini, Greece, IEEE. [Google Scholar]
22. Li, Q., Deliberty, T. (2022). Integrating drones, participatory mapping and GIS to enhance resiliency for remote villages. Transactions in GIS, 26(2), 818–838. [Google Scholar]
23. Wang, S. Y., Zhou, Y. N., Yang, X. Z., Feng, L., Wu, T. J. et al. (2023). BSNet: Boundary-semantic-fusion network for farmland parcel mapping in high-resolution satellite images. Computers and Electronics in Agriculture, 206, 107683. [Google Scholar]
24. Yépez Rincón, F. D., Lozano García, D. F. (2019). Synergetic efficiency of Lidar and WorldView-2 for 3D urban cartography in Northeast Mexico. Geocarto International, 34(2), 164–178. [Google Scholar]
25. Šupinský, J., Kaňuk, J., Nováková, M., Hochmuth, Z. (2022). LiDAR point clouds processing for large-scale cave mapping: A case study of the Majko dome in the Domica cave. Journal of Maps, 18(2), 268–275. [Google Scholar]
26. Goodchild, M. F. (2007). Citizens as sensors: The world of volunteered geography. GeoJournal, 69(4), 211–221. [Google Scholar]
27. Basiri, A., Haklay, M., Foody, G., Mooney, P. (2019). Crowdsourced geospatial data quality: Challenges and future directions. International Journal of Geographical Information Science, 33(8), 1588–1593. [Google Scholar]
28. Bubalo, M., van Zanten, B. T., Verburg, P. H. (2019). Crowdsourcing geo-information on landscape perceptions and preferences: A review. Landscape and Urban Planning, 184(3), 101–111. [Google Scholar]
29. Bertolotto, M., McArdle, G., Schoen-Phelan, B. (2020). Volunteered and crowdsourced geographic information: The OpenStreetMap project. Journal of Spatial Information Science, (20), 65–70. [Google Scholar]
30. Krygier, J., Wood, D. (2016). Making maps: A visual guide to map design for GIS. Guilford Publications. [Google Scholar]
31. Jiang, B. (2019). New paradigm in mapping: A critique on cartography and GIS. Cartographica: The International Journal for Geographic Information and Geovisualization, 54(3), 193–205. [Google Scholar]
32. Lü, G., Batty, M., Strobl, J., Lin, H., Zhu, A. X. et al. (2019). Reflections and speculations on the progress in geographic information systems (GISA geographic perspective. International Journal of Geographical Information Science, 33(2), 346–367. [Google Scholar]
33. Graham, M., Shelton, T. (2013). Geography and the future of big data, big data, and the future of geography. Dialogues in Human Geography, 3(3), 255–261. [Google Scholar]
34. Huang, B., Wang, J. (2020). Big spatial data for urban and environmental sustainability. Geo-Spatial Information Science, 23(2), 125–140. [Google Scholar]
35. Feng, Y., Thiemann, F., Sester, M. (2019). Learning cartographic building generalization with deep convolutional neural networks. ISPRS International Journal of Geo-Information, 8(6), 258. [Google Scholar]
36. Zeng, C., Zhang, F., Luo, M. (2022). A deep neural network-based decision support system for intelligent geospatial data analysis in intelligent agriculture system. Soft Computing, 26(20), 10813–10826. [Google Scholar]
37. Gong, J., Geng, J., Chen, Z. (2015). Real-time GIS data model and sensor web service platform for environmental data management. International Journal of Health Geographics, 14(1), 1–13. [Google Scholar]
38. Li, W., Batty, M., Goodchild, M. F. (2020). Real-time GIS for smart cities. International Journal of Geographical Information Science, 34(2), 311–324. [Google Scholar]
39. Zollmann, S., Langlotz, T., Grasset, R., Lo, W. H., Mori, S. et al. (2020). Visualization techniques in augmented reality: A taxonomy, methods and patterns. IEEE Transactions on Visualization and Computer Graphics, 27(9), 3808–3825. [Google Scholar]
40. Dickmann, F., Keil, J., Dickmann, P. L., Edler, D. (2021). The impact of augmented reality techniques on cartographic visualization. KN-Journal of Cartography and Geographic Information, 71(4), 285–295. [Google Scholar]
41. Yu, D., Liang, H. N., Fan, K., Zhang, H., Fleming, C. et al. (2019). Design and evaluation of visualization techniques of off-screen and occluded targets in virtual reality environments. IEEE Transactions on Visualization and Computer Graphics, 26(9), 2762–2774. [Google Scholar] [PubMed]
42. Liu, Y., Castronovo, F., Messner, J., Leicht, R. (2020). Evaluating the impact of virtual reality on design review meetings. Journal of Computing in Civil Engineering, 34(1), 04019045. [Google Scholar]
43. International Cartographic Association (1995). The Definition of Cartography. A statement adopted by the 10th General Assembly, Barcelona, Spain. http://www.icaci.org [Google Scholar]
44. Kraak, M. J. (1998). The cartographic visualization process: From presentation to exploration. The Cartographic Journal, 35(1), 11–15. [Google Scholar]
45. Wandersee, J. H. (1990). Concept mapping and the cartography of cognition. Journal of Research in Science Teaching, 27(10), 923–936. [Google Scholar]
46. Dicken, P. (2007). Global shift: Mapping the changing contours of the world economy. SAGE Publications, Ltd. [Google Scholar]
47. Armstrong, M. P., Wang, S., Zhang, Z. (2019). The internet of things and fast data streams: Prospects for geospatial data science in emerging information ecosystems. Cartography and Geographic Information Science, 46(1), 39–56. [Google Scholar]
48. Das, H., Barik, R. K., Dubey, H., Roy, D. S. (2019). Cloud computing for geospatial big data analytics. In: Intelligent edge, fog and mist computing. Springer. [Google Scholar]
49. Mbunge, E., Akinnuwesi, B., Fashoto, S. G., Metfula, A. S., Mashwama, P. (2021). A critical review of emerging technologies for tackling COVID-19 pandemic. Human Behavior and Emerging Technologies, 3(1), 25–39. [Google Scholar] [PubMed]
50. Yusoff, I. M., Ramli, A., Al-Kasirah, N. A. M. (2021). Geospatial data and technology application towards managing flood disaster in the context of Industrial Revolution 4.0 (IR4. 0). Journal of Advanced Geospatial Science & Technology, 1(1), 38–69. [Google Scholar]
51. Andronie, M., Lăzăroiu, G., Iatagan, M., Hurloiu, I., Ștefănescu, R. et al. (2023). Big data management algorithms, deep learning-based object detection technologies, and geospatial simulation and sensor fusion tools in the internet of robotic things. ISPRS International Journal of Geo-Information, 12(2), 35. [Google Scholar]
52. Goudarzi, S., Kama, N., Anisi, M. H., Zeadally, S., Mumtaz, S. (2019). Data collection using unmanned aerial vehicles for internet of things platforms. Computers & Electrical Engineering, 75(6), 1–15. [Google Scholar]
53. Nwilag, B. D., Eyoh, A. E., Ndehedehe, C. E. (2023). Digital topographic mapping and modelling using low altitude unmanned aerial vehicle. Modeling Earth Systems and Environment, 9(2), 1463–1476. [Google Scholar]
54. Ruf, C. S., Chew, C., Lang, T., Morris, M. G., Nave, K. et al. (2018). A new paradigm in earth environmental monitoring with the CYGNUS small satellite constellation. Scientific Reports, 8(1), 8782. [Google Scholar] [PubMed]
55. Li, J., Pei, Y., Zhao, S., Xiao, R., Sang, X. et al. (2020). A review of remote sensing for environmental monitoring in China. Remote Sensing, 12(7), 1130. [Google Scholar]
56. Zhou, D., Xiao, J., Bonafoni, S., Berger, C., Deilami, K. et al. (2018). Satellite remote sensing of surface urban heat islands: Progress, challenges, and perspectives. Remote Sensing, 11(1), 48. [Google Scholar]
57. Cetin, M. (2019). The effect of urban planning on urban formations determining bioclimatic comfort area’s effect using satellite imagines on air quality: A case study of Bursa city. Air Quality, Atmosphere & Health, 12(10), 1237–1249. [Google Scholar]
58. Kaku, K. (2019). Satellite remote sensing for disaster management support: A holistic and staged approach based on case studies in Sentinel Asia. International Journal of Disaster Risk Reduction, 33(3), 417–432. [Google Scholar]
59. Habib, M., Alzubi, Y., Malkawi, A., Awwad, M. (2020). Impact of interpolation techniques on the accuracy of large-scale digital elevation model. Open Geosciences, 12(1), 190–202. [Google Scholar]
60. Saritha, G., Saravanan, T., Anbumani, K., Surendiran, J. (2021). Digital elevation model and terrain mapping using LiDAR. Materials Today: Proceedings, 46, 3979–3983. [Google Scholar]
61. Rhodes, M. W., Bennie, J. J., Spalding, A., French-Constant, R. H., Maclean, I. M. (2022). Recent advances in the remote sensing of insects. Biological Reviews, 97(1), 343–360. [Google Scholar] [PubMed]
62. Calazans Campelo, C. E., Bertolotto, M., Corcoran, P. (2017). Volunteered geographic information and the future of geospatial data. IGI Global. [Google Scholar]
63. Goodchild, M. F., Glennon, J. A. (2010). Crowdsourcing geographic information for disaster response: A research frontier. International Journal of Digital Earth, 3(3), 231–241. [Google Scholar]
64. Haworth, B. (2016). Emergency management perspectives on volunteered geographic information: Opportunities, challenges and change. Computers, Environment and Urban Systems, 57(1), 189–198. [Google Scholar]
65. Mahabir, R., Stefanidis, A., Croitoru, A., Crooks, A. T., Agouris, P. (2017). Authoritative and volunteered geographical information in a developing country: A comparative case study of road datasets in Nairobi, Kenya. ISPRS International Journal of Geo-Information, 6(1), 24. [Google Scholar]
66. Burrough, P. A., McDonnell, R. A., Lloyd, C. D. (2015). Principles of geographical information systems. Oxford University Press, USA. [Google Scholar]
67. Reddy, G. O. (2018). Spatial data management, analysis, and modeling in GIS: Principles and applications. In: Geospatial Technologies in Land Resources Mapping, Monitoring, and Management, pp. 127–142. [Google Scholar]
68. de Smith, M. J., Goodchild, M. F., Longley, P. (2007). Geospatial analysis: A comprehensive guide to principles, techniques and software tools. Troubador Publishing, Ltd. [Google Scholar]
69. Yang, B. (2019). GIS crime mapping to support evidence-based solutions provided by community-based organizations. Sustainability, 11(18), 4889. [Google Scholar]
70. Mollalo, A., Vahedi, B., Rivera, K. M. (2020). GIS-based spatial modeling of COVID-19 incidence rate in the continental United States. Science of the Total Environment, 728(2), 138884. [Google Scholar] [PubMed]
71. Mukherjee, F., Singh, D. (2020). Detecting flood prone areas in Harris County: A GIS-based analysis. GeoJournal, 85(3), 647–663. [Google Scholar]
72. Ahmed, S. (2018). Assessment of urban heat islands and impact of climate change on socioeconomic over Suez Governorate using remote sensing and GIS techniques. The Egyptian Journal of Remote Sensing and Space Science, 21(1), 15–25. [Google Scholar]
73. Aboelnour, M., Engel, B. A. (2018). Application of remote sensing techniques and geographic information systems to analyze land surface temperature in response to land use/land cover change in Greater Cairo Region, Egypt. Journal of Geographic Information System, 10(1), 57–88. [Google Scholar]
74. Fairbairn, D., Gartner, G., Peterson, M. P. (2021). Epistemological thoughts on the success of maps and the role of cartography. International Journal of Cartography, 7(3), 317–331. [Google Scholar]
75. Taylor, D. F. (2003). The concept of cybercartography. In: Maps and the Internet, pp. 405–420. Elsevier Science. [Google Scholar]
76. Kim, A. M. (2015). Critical cartography 2.0: From “participatory mapping” to authored visualizations of power and people. Landscape and Urban Planning, 142(22), 215–225. [Google Scholar]
77. Kounavis, C. D., Kasimati, A. E., Zamani, E. D. (2012). Enhancing the tourism experience through mobile augmented reality: Challenges and prospects. International Journal of Engineering Business Management, 4(5), 10. [Google Scholar]
78. Wang, W., Wu, X., He, A., Chen, Z. (2019). Modelling and visualizing holographic 3D geographical scenes with timely data based on the HoloLens. ISPRS International Journal of Geo-Information, 8(12), 539. [Google Scholar]
79. Ware, C., Plumlee, M. (2005). 3D geo visualization and the structure of visual space. In: Exploring geovisualization, pp. 567–576. Elsevier. [Google Scholar]
80. Biljecki, F., Stoter, J., Ledoux, H., Zlatanova, S., Çöltekin, A. (2015). Applications of 3D city models: State of the art review. ISPRS International Journal of Geo-Information, 4(4), 2842–2889. [Google Scholar]
81. Budiharto, W., Irwansyah, E., Suroso, J. S., Chowanda, A., Ngarianto, H. et al. (2021). Mapping and 3D modeling using quadrotor drone and GIS software. Journal of Big Data, 8, 1–12. [Google Scholar]
82. Habib, M. (2021). Quantifying topographic ruggedness using principal component analysis. Advances in Civil Engineering, 2021(1–4), 1–20. [Google Scholar]
83. Rahman, M. H., Islam, M. H., Neema, M. N. (2022). GIS-based compactness measurement of urban form at neighborhood scale: The case of Dhaka, Bangladesh. Journal of Urban Management, 11(1), 6–22. [Google Scholar]
84. Brown, G., Kangas, K., Juutinen, A., Tolvanen, A. (2017). Identifying environmental and natural resource management conflict potential using participatory mapping. Society & Natural Resources, 30(12), 1458–1475. [Google Scholar]
85. Rushton, G. (2003). Public health, GIS, and spatial analytic tools. Annual Review of Public Health, 24(1), 43–56. [Google Scholar] [PubMed]
86. Thenkabail, P. S., Knox, J. W., Ozdogan, M., Gumma, M. K., Congalton, R. G. et al. (2012). Assessing future risks to agricultural productivity, water resources and food security: How can remote sensing help? PE & RS, Photogrammetric Engineering & Remote Sensing, 78(8), 773–782. [Google Scholar]
87. Pereira, H. M., Navarro, L. M., Martins, I. S. (2012). Global biodiversity change: The bad, the good, and the unknown. Annual Review of Environment and Resources, 37(1), 25–50. [Google Scholar]
88. Kyttä, M., Broberg, A., Tzoulas, T., Snabb, K. (2013). Towards contextually sensitive urban densification: Location-based soft GIS knowledge revealing perceived residential environmental quality. Landscape and Urban Planning, 113(1), 30–46. [Google Scholar]
89. Skarlatidou, A., Cheng, T., Haklay, M. (2013). Guidelines for trust interface design for public engagement Web GIS. International Journal of Geographical Information Science, 27(8), 1668–1687. [Google Scholar]
90. Kitchin, R. (2016). The ethics of smart cities and urban science. Philosophical Transactions of the Royal Society A: Mathematical, Physical and Engineering Sciences, 374(2083), 20160115. [Google Scholar]
91. Monmonier, M. (2018). How to lie with maps. University of Chicago Press, USA. [Google Scholar]
92. Ahmed, M. Z. I., Sinha, N., Phadikar, S., Ghaderpour, E. (2022). Automated feature extraction on AsMap for emotion classification using EEG. Sensors, 22(6), 2346. [Google Scholar] [PubMed]
93. Adewale, A. M., Bamidele, A. O., Lateef, U. O. (2018). Predictive modeling and analysis of academic performance of secondary school students: Artificial neural network approach. International Journal of Science and Technology Education Research, 9(1), 1–8. [Google Scholar]
94. Döllner, J. (2020). Geospatial artificial intelligence: Potentials of machine learning for 3D point clouds and geospatial digital twins. PFG-Journal of Photogrammetry, Remote Sensing and Geoinformation Science, 88(1), 15–24. [Google Scholar]
95. Courtial, A., El Ayedi, A., Touya, G., Zhang, X. (2020). Exploring the potential of deep learning segmentation for mountain roads generalisation. ISPRS International Journal of Geo-Information, 9(5), 338. [Google Scholar]
96. Pandarachalil, R., Sendhilkumar, S., Mahalakshmi, G. S. (2015). Twitter sentiment analysis for large-scale data: An unsupervised approach. Cognitive Computation, 7(2), 254–262. [Google Scholar]
97. Balram, S., Dragicevic, S. (2006). Collaborative geographic information systems: Origins, boundaries, and structures. In: Collaborative Geographic Information Systems, pp. 1–23. IGI Global. [Google Scholar]
98. Harrower, M., Brewer, C. A. (2003). ColorBrewer.org: An online tool for selecting colour schemes for maps. The Cartographic Journal, 40(1), 27–37. [Google Scholar]
99. Mobasheri, A., Pirotti, F., Agugiaro, G. (2020). Open-source geospatial tools and technologies for urban and environmental studies. Open Geospatial Data, Software and Standards, 5(1), 1–4. [Google Scholar]
100. Conradie, P., Choenni, S. (2014). On the barriers for local government releasing open data. Government Information Quarterly, 31, S10–S17. [Google Scholar]
101. Dong, W., Ran, J., Wang, J. (2012). Effectiveness and efficiency of map symbols for dynamic geographic information visualization. Cartography and Geographic Information Science, 39(2), 98–106. [Google Scholar]
102. Dai, W., Yang, X., Na, J., Li, J., Brus, D. et al. (2019). Effects of DEM resolution on the accuracy of gully maps in loess hilly areas. Catena, 177(12), 114–125. [Google Scholar]
103. Habib, M. (2022). Fit-for-purpose conformal mapping for sustainable land administration in war-ravaged Syria. Heliyon, 8(5), e09384. [Google Scholar] [PubMed]
Cite This Article
 Copyright © 2023 The Author(s). Published by Tech Science Press.
This work is licensed under a Creative Commons Attribution 4.0 International License , which permits unrestricted use, distribution, and reproduction in any medium, provided the original work is properly cited.
 Downloads
 Citation Tools