
 Submit a Paper
 Propose a Special lssue
 Open Access
ARTICLE

Application of Fuzzy-AHP in GIS in Finding E-Scooter Trail for Street Art
School of Geomatics Science and Natural Resources, College of Built Environment, Universiti Teknologi MARA, Shah Alam, 40450, Selangor, Malaysia
* Corresponding Author: Nabilah Naharudin. Email:
Revue Internationale de Géomatique 2025, 34, 53-69. https://doi.org/10.32604/rig.2025.058078
Received 04 September 2024; Accepted 23 December 2024; Issue published 13 January 2025
 View Full Text
 Download PDF
Abstract
Tourism trails connect destinations, points of interest, and travel-related businesses. By enhancing connectivity, these trails reduce travel time, allowing tourists to maximize their exploration of sites, leading to more efficient and satisfying travel experiences. The rising popularity of e-scooters in urban areas has highlighted the need to identify safe and accessible routes, particularly in cities where safety concerns have led to restrictions. Multi-Criteria Decision Analysis (MCDA) and Geographic Information System (GIS) network analysis can be employed to determine optimal paths by considering multiple criteria. This study focuses on finding an optimal street art trail for e-scooters in Bukit Bintang using Fuzzy-AHP (FAHP) and GIS. The objectives of this study are to identify the criteria of optimal pathway conditions for e-scooters and to develop a framework to find potential trails for e-scooters by using FAHP and GIS. FAHP was used to compute criterion weights based on expert input, revealing Path Facility as the most critical factor (weight: 0.495), followed by Slope (0.194), Traffic Speed (0.172), and Obstruction (0.139). These weights were integrated into a GIS-based network model, with the Travelling Salesperson Problem (TSP) method applied to identify the optimal e-scooter route. The resulting map showcases the ideal e-scooter trail connecting street art locations, alongside details on path conditions, street art sites, nearby train stations, and e-scooter rental stations. This methodology effectively combines FAHP and GIS to determine optimal routes, aiding authorities in improving e-scooter infrastructure. Additionally, the map can be integrated into e-scooter-sharing applications or displayed at key transportation hubs to guide riders.Keywords
The regulations governing electric scooters vary across European countries and Malaysia, reflecting the evolving landscape of micro-mobility transportation. In Europe, the rapid introduction of e-scooters preceded regulatory frameworks, leading to concerns about safety and road usage. However, in response to public awareness and development, several European nations have implemented policies to ensure safe e-scooter operation, including speed limits, helmet requirements, and designated parking spaces. Meanwhile, in Malaysia, regulations are still under discussion, with fines imposed for unauthorized e-scooter use on public roads. Initiatives such as the National Regulatory Sandbox aim to assess and refine regulations to promote safe micro-mobility usage, highlighting the importance of balancing innovation with public safety concerns.
A few cities have either temporarily or completely banned e-scooters due to serious accidents that have raised serious safety concerns about riding them [1]. The e-scooter is an innovative mode of transportation that many travelers find very useful, but a lack of understanding of good paths makes it difficult for regulations to combine the existing infrastructure with this growing demand [2]. It has also been proven in several previous studies that, in comparison to other modes of transportation like cars and bicycles, the safety performance of this emerging micro-mobility has received comparatively less research [1]. This means more in-depth studies need to be done to overcome the problem regarding the appropriate path for e-scooters.
The right criteria play a very important role in choosing the optimal path, but what are the criteria that will determine the optimal path for e-scooter users if the main road cannot be used or has already been banned? It becomes quite difficult to find specific criteria for e-scooters where regulations are still unclear and not set, causing analysis of studies on existing bicycles and pedestrians’ paths to be made because both use the criteria that are pretty much the same, avoiding the main road [2].
After the criteria have been studied and selected, the question arises about how those criteria can help determine the optimal trail for e-scooters. MCDA can help determine the decision and solve the planning problem, but it comes with various criteria [3]. Other than that, GIS analysis, known as “network analysis” was introduced to ease users in examining the path or road network that leads to the destination. This makes the comparison of all MCDA methods and network analysis necessary because each of them comes with numerous strengths and weaknesses, so the purpose and expected output of the study must be in line with the method used.
The final problem is, after the criteria have been processed and network analysis has been done, how can the best pathway for e-scooters be analyzed? The result should also be compared to other studies to analyse and find out the weaknesses and strengths. Identifying the final output’s weaknesses will allow the research to improve in the next study, and all strengths can encourage others to use the same method. The analysis will be made on the potential and optimal paths, so the choices will be used to produce the final output map.
Thus, the aim of this study is to derive an optimal path for a street art trail for e-scooters using Fuzzy-AHP (FAHP) and Geographic Information System (GIS). The objectives of this study are to identify the criteria of optimal pathway conditions for e-scooters and to develop a framework to find potential trails for e-scooters by using Fuzzy-AHP and GIS.
This paper will be divided into four (4) sections, which start with Introduction, followed by Methodology, Results, Discussion and Conclusion. In the Introduction section, the background of the study was discussed as well as a review of related literature on finding e-scooter trails using Fuzzy-AHP and GIS. The second section focuses on explaining the methodology applied to find the potential trails for e-scooters. The Results section shows the output of the study, which is the weightage of criteria and the potential trail that were discussed thoroughly. Finally, the Conclusion section concludes the discussion of the paper.
1.1 Criteria for E-Scooter Trail
Table 1 shows the criteria for finding an optimal pathway condition for e-scooters that was adapted from several studies to ensure riders can ride micro-mobility vehicles such as e-scooters safely to avoid any incidents from happening to riders, pedestrians, and main road users. The main reason for this analysis is to identify road criteria that are suitable to be used and facilitate the network analysis process in choosing the most appropriate path to the specific destination by considering the list of criteria.
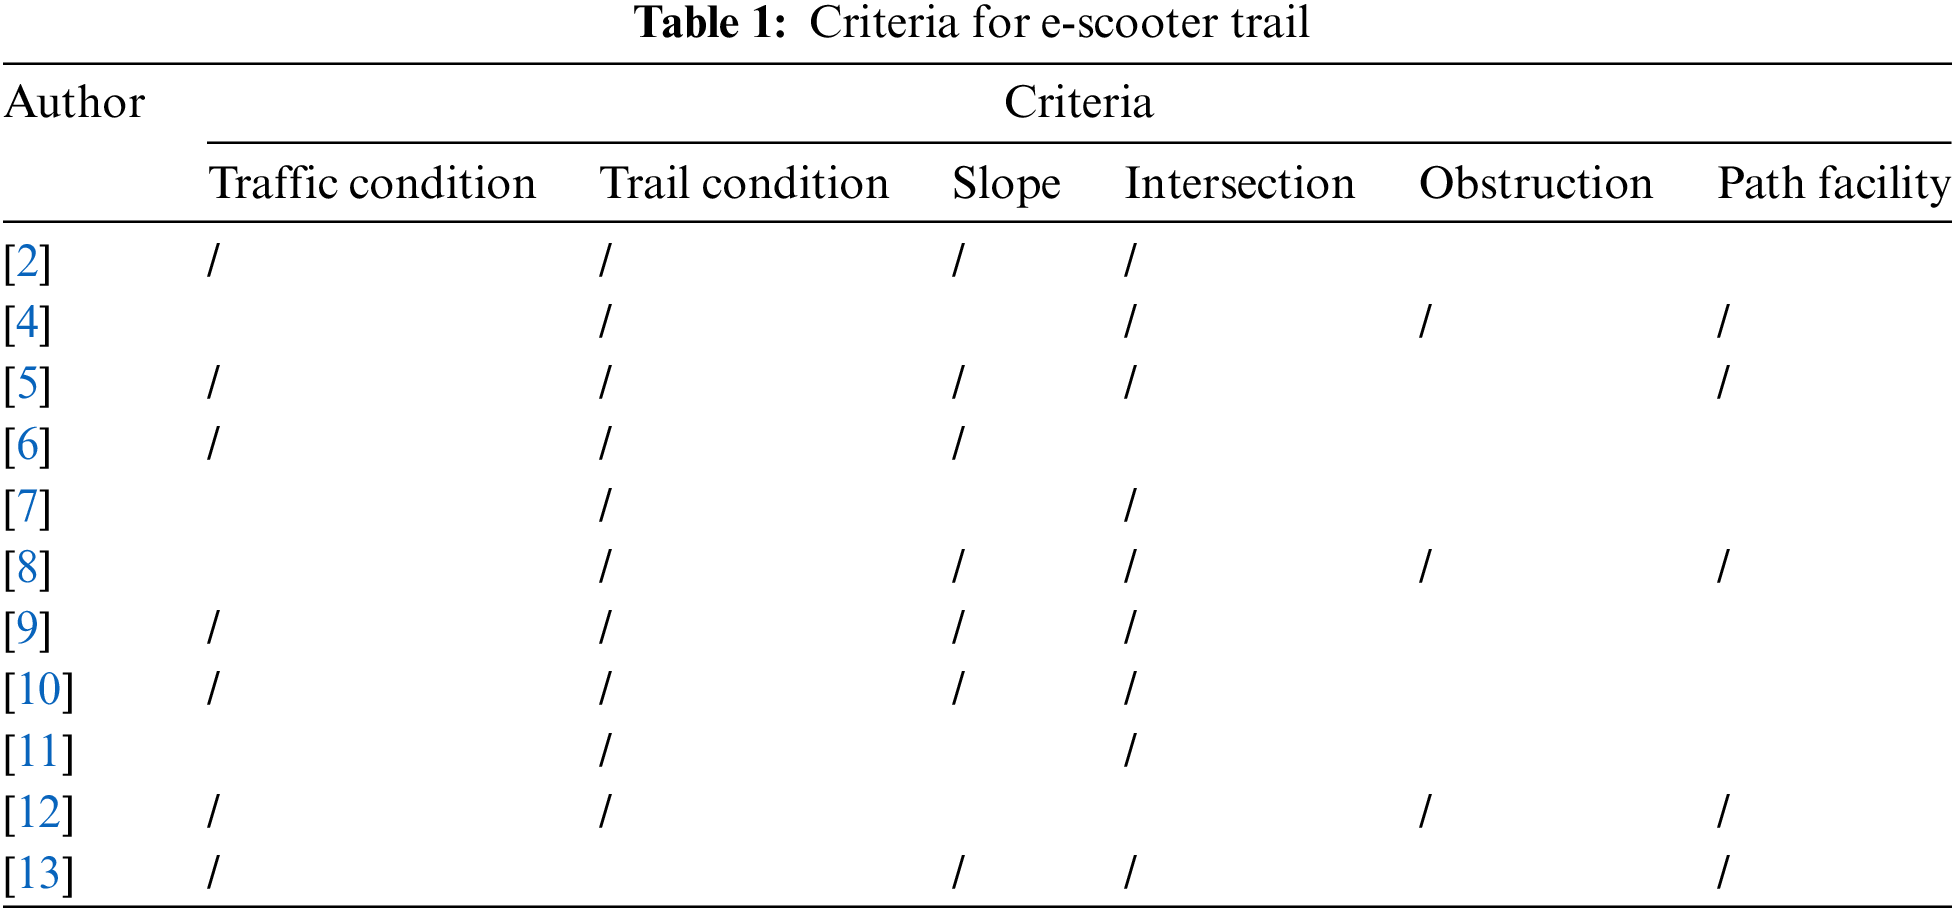
Multiple criteria have been highlighted in those studies because each of them has its advantages, such as the existence of curb cuts at the pathway to create accessibility at the route intersection and make users easier to cross the road, especially if there are elevations between the main road and the pathway. The curb cut width should be the same as the pathway if it is for multi-users and come with clear signage to make sure that all the road users can be alert when passing through the area. Other than that, an optimal pathway must have a guardrail to ensure that users do not slip into the main road and reduce the impact of vehicles if there is potential for cars to go over the ramp. Then, the pavement surface must be asphalt or cement concrete, which is very suitable and solid for the prevention of micro-mobility users from slipping over or gliding if the pathway conditions are wet [4].
The intersection is one of the criteria to be considered because it can be the potential area for incidents to occur while riding in the city. To prevent this from happening, well-designed road intersections with traffic lights must be chosen to allow users to safely cross or also find the path or trail with the fewest intersections to go to the destination. Then, other criteria that can be considered are that the pathway must come with streetlights which allow users to see more clearly when passing through it in the dark and can prevent criminal cases from happening at that place. Based on the study, the pathway should also be clear of any obstructions, such as trash cans and utility boxes, which can be a hazard for the user and potentially cause collision incidents. This incident can be prevented by grouping the obstruction in one place and making sure it is easy to see by using a bright color [4].
Spatial-MCDA or GIS-based Multicriteria Decision Analysis is a combination of several methods, extensions, and theories to put together decision-maker judgment and geospatial data to produce information related to spatial decision-making [3]. The Spatial-MCDA has remained famous and used for many years because it is very helpful in determining decisions and handling a situation [3]. In an aspect of the concept, Spatial-MCDA can be understood as one of the processes where one or many spatial alternatives are judged and chosen by a person or a group of people depending on various criteria [3]. The combination of these two techniques in producing the decision maker can also include the value of evaluation according to the preferences with the consideration of evaluation criteria into GIS-based procedures and gain feedback about the implication, where the implication can increase the decision maker result in confidence [3].
Spatial-MCDA amalgamates various methods and theories to incorporate decision-maker judgments and geospatial data, which is crucial for spatial decision-making. Widely recognized for its utility in decision-making processes, Spatial-MCDA allows for the evaluation of spatial alternatives based on multiple criteria, offering a systematic approach to decision-making. By integrating GIS capabilities with MCDA techniques, decision-makers can factor in preferences and evaluation criteria, enhancing confidence in decision outcomes. With MCDA methods offering compensatory and outranking approaches, decision-makers can effectively navigate complex decision landscapes, considering various criteria and alternative solutions.
Previous studies have highlighted various methodologies that could facilitate route optimization and planning. FAHP enhances AHP by addressing its limitations on uncertainty in judgments and unspecific rankings, which could improve the model performance for path planning, thereby enhancing navigational performance in mobile robot path planning [14]. On the other hand, in GIS routing analysis, using the TSP algorithm focuses on finding the shortest path connecting multiple points that could effectively minimize travel costs and optimize routes for tourism [15]. There was, however, limited integration of FAHP with TSP for enhanced route optimization, which this study attempted.
Based on the initial reading that has been made, due to the Malaysian regulations for micro-mobility being unclear and prohibited on the main roads, this study can be made to identify the proper trail for e-scooters by using several MCDA methods and GIS network analysis. This exposure is very useful in tourism because many tourist trails have been created in Malaysia which have been proven in many journals and have brought many benefits by making the journey smoother and more organized. Based on eleven journals and articles that have been studied, several criteria for creating an optimal pathway are traffic condition, trail condition, slope, and path intersections. This pre-study shows that the 4 criteria are very important and need to be emphasized in the study to create and produce the best route.
The method that was chosen and used is AHP which is flexible, straightforward, and allows the computation of the geometric mean of each pair-wise comparison to facilitate the group decision-making. Behind this advantage, the fuzzy approach will also be used to cover the disadvantages of AHP such as helping to solve the uncertain semantics of AHP. In the previous study, the use of the FAHP method has also demonstrated an improvement in navigational performance overall and has been suggested to be used for future studies. Next, the TSP method will be used as the GIS network analysis process, which allows the finding of the shortest route between two or more points, stop at multiple spots, and determine the optimal path. Based on the study of tourism, the TSP was applied to identify the most efficient route and effectively assist the people of the study area in selecting the most practical route that will serve as a guide for their travel arrangements and cut down on expenses.
The study employed FAHP for criteria rating and GIS for spatial data analysis. Data processing involved FAHP steps to determine criterion weightage, integrated with GIS to establish a network model for optimal e-scooter pathways using the TSP method as shown in Fig. 1.
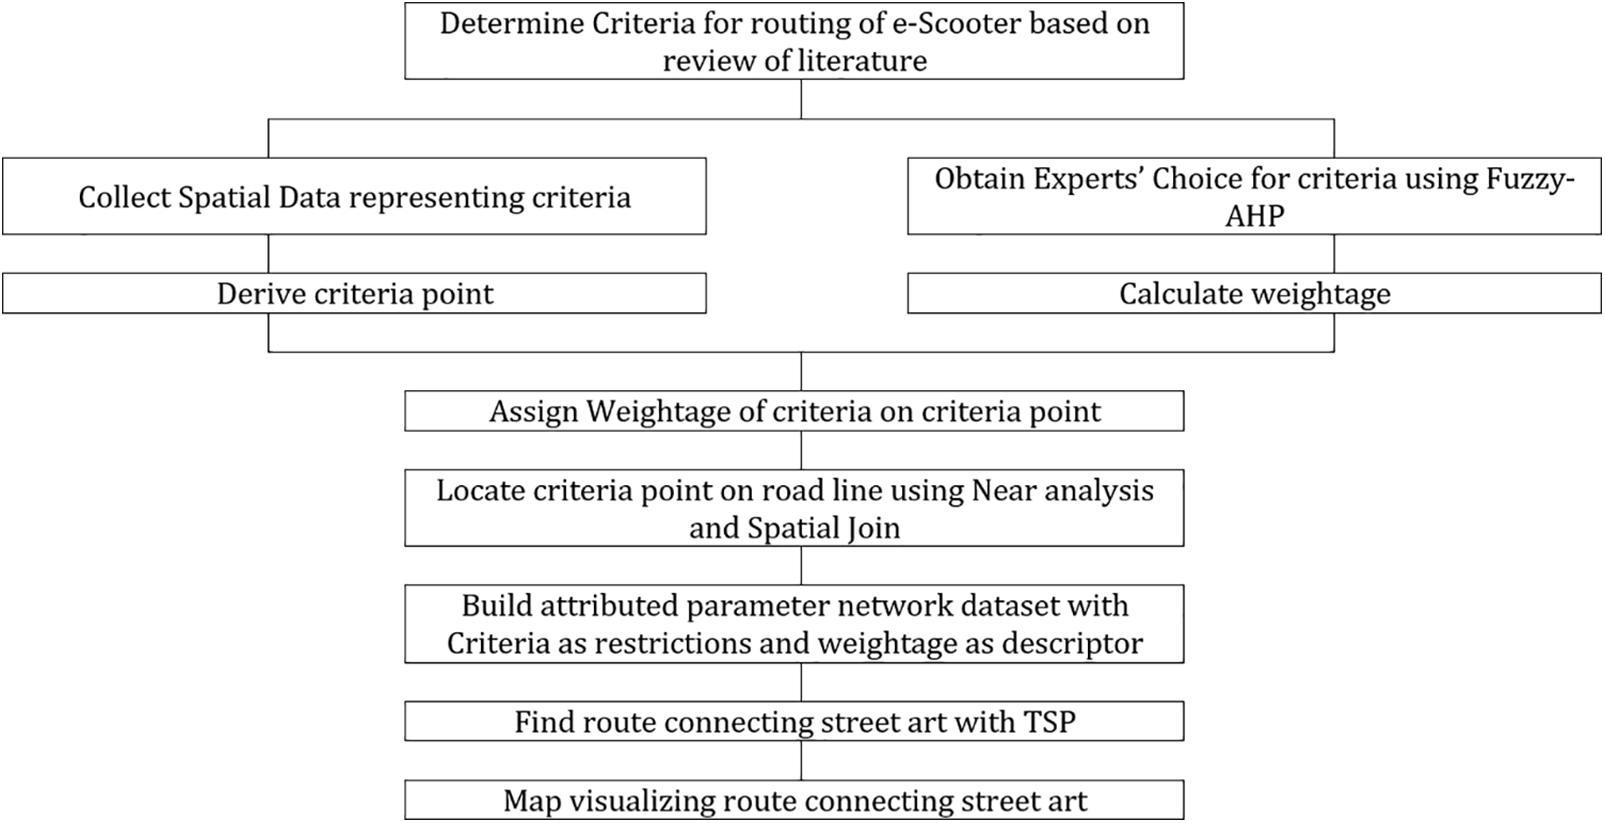
Figure 1: Methodology framework
The area that has been chosen for this study is Bukit Bintang, Kuala Lumpur. This is because the use of e-scooters here is very widespread compared to other cities, especially in using private or shared e-scooters like Beam. In addition, this place is also filled with interesting tourist spots such as street art, cafes, and malls. This makes this study area suitable and in line with the research title, which is about the street art trail in Bukit Bintang.
2.1 AHP Hierarchical Structure
Table 2 shows the best criteria to create an optimal path that were selected based on the readings from previous journals as discussed in Section 1.1. The selection aimed to ensure that users of micro-mobility vehicles like e-scooters could ride safely and prevent any accidents involving other road users. The purpose of this analysis was to determine road criteria that could be applied, making it easier for network analysis to select the best route to a given location by taking the list of criteria into account. The selection was also based on the importance of the criteria, determined by the frequency of mentions in previous studies explained in Section 1.1 and summarized in Table 1. Therefore, based on discussion in Section 1.1, the criteria to be used in this study were selected on the basis that if a criterion was mentioned frequently, it indicated its importance, whereas less mentioned criteria were deemed necessary to be included in this study. The frequency is summarized in Fig. 2.
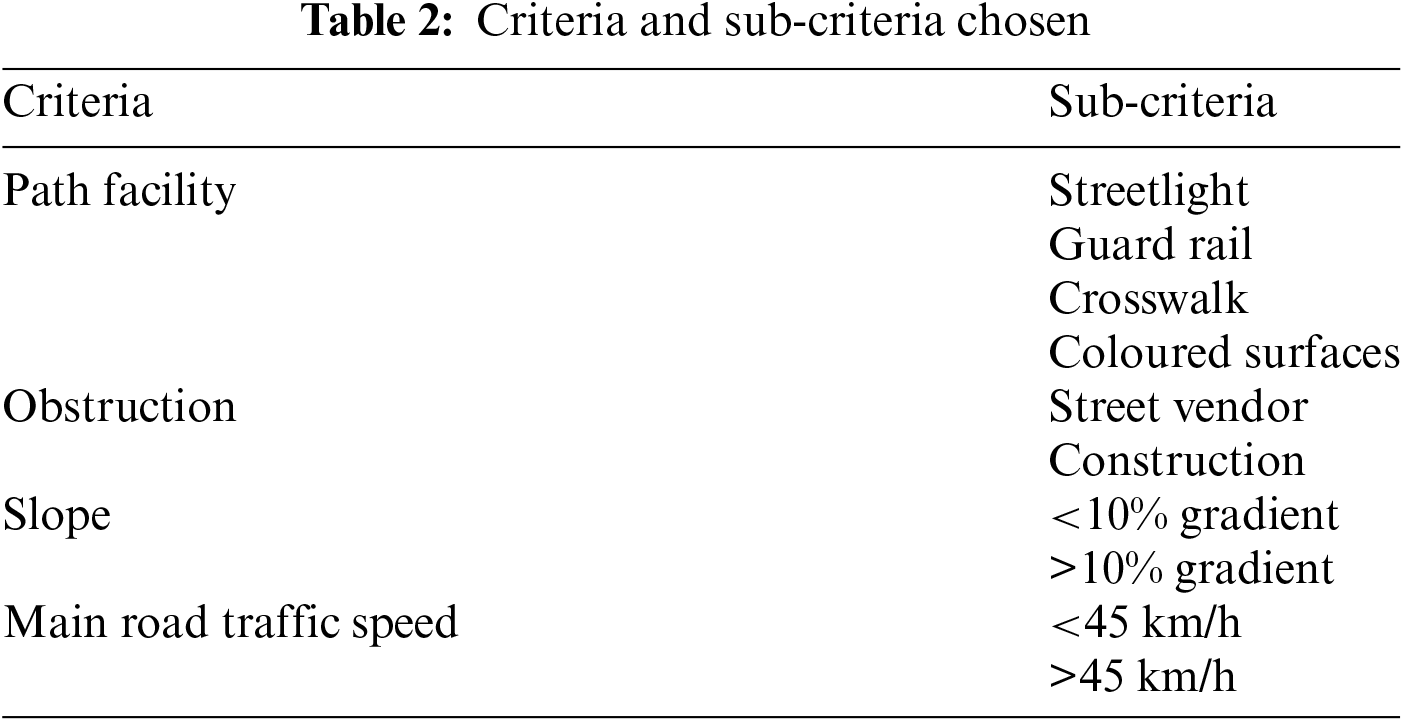

Figure 2: Frequency of occurrences of criteria in ous studies
The criteria for the optimal e-scooter trail were modeled into a hierarchical structure consisting of three levels: goal, criteria, and sub-criteria. Since the alternatives would be analyzed after the TSP process for the network model, the hierarchical structure did not include alternatives. The top level, which is the goal, represented the objective of this study. The middle level, which is criteria, represented the factors that would help accomplish the goal. The bottom level, which is sub-criteria, represented the specific criteria that would be applied and present in the network model to achieve the objective. Fig. 3 depicts the hierarchical structure of this study.

Figure 3: Hierarchical structure
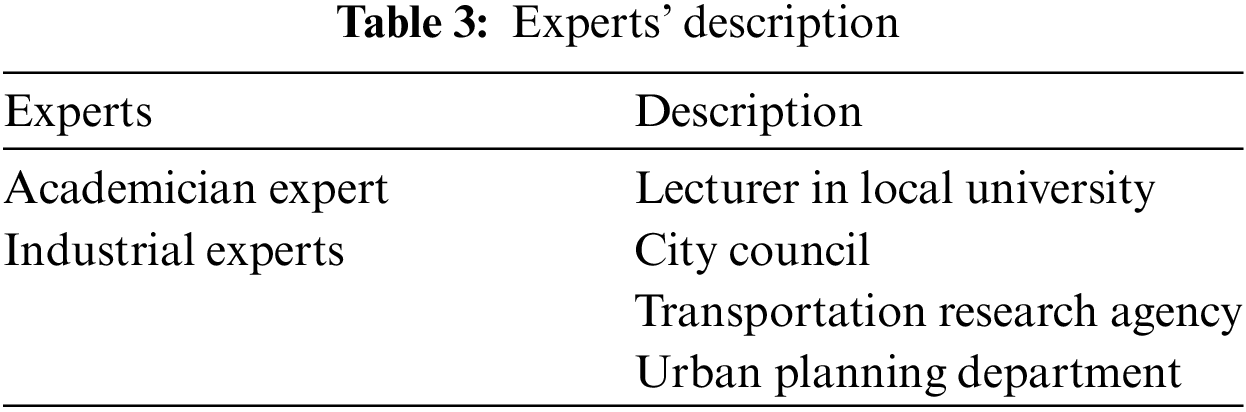
Experts are individuals with a deep understanding of a process, its fundamentals, and its application to decision-making. Typically, these experts possess experience in the relevant field or topic of the study. Consequently, a total of four (4) experts, serving as decision-makers, were utilized to provide their judgments. Although the number of experts may seem to be small, this is normal practice in AHP studies as the method relies on experts’ judgement in assisting the decision-making process. Having a large number of experts to give judgement would affect the consistency. Table 3 shows experts’ description that comprised one (1) academician and three (3) industrial experts.
2.3 Deriving Weightage Using Fuzzy-AHP
The process of Fuzzy AHP for weightage computation consists of several steps that produce the final weightage as shown in Fig. 4.

Figure 4: Process of weightage calculation using Fuzzy-AHP
The fuzzy pairwise comparison matrix was created using the scale of relative importance (Table 4). The comparison was made by comparing the row criteria with the column criteria. In this study, the weightage computation was made for the main criteria first, followed by the weightage of the sub-criteria, ensuring the concept of hierarchy and fair distribution of weightage. The value of each pairwise comparison matrix could be derived to show how important the criteria were compared to other criteria using Eq. (1).

The fuzzy number value was presented in a pairwise comparison matrix as shown in Table 5. The row element was divided by the column element to derive the fuzzy value. Rows and columns with the same criteria had equal linguistic terms, which used the number of fuzzy scales (1, 1, 1).

where X = Matrix number
The fuzzy geometric mean (

where l = Lower number
m = Middle number
u = Upper number
where n = number of criteria
The calculation of weightage will involve the fuzzy geometric mean for each criterion, the total geometric mean value, and the reciprocal of the total geometric mean value, or multiplicative inverse. From this combination of calculations, the fuzzy weight of each criterion can be derived. The total of the geometric mean and its reciprocal value were calculated using the formula in Eqs. (4) and (5).
where
The fuzzy weight was derived after the multiplication between the geometric mean for each criterion with the reciprocal of the total geometric mean as described in Table 7. The formula for fuzzy weight was shown in Eq. (6).

where
Next is defuzzification using Eq. (7), where in fuzzy logic, it is the process of transforming fuzzy sets or fuzzy values into crisp values or quantities that are simple to comprehend or apply to decision-making. After all the criteria had been defuzzified, the sum of weightage was computed to ensure that it was below one (1), which indicated that it was normalized using Eq. (8). If it exceeded one (1), it needed to continue to the computation of weight normalization.
where
l = Lower number
m = Middle number
u = Upper number
where
The last stage is weight normalization using Eq. (9) that enhances the consistency and meaningful interpretation of the priority or weight values assigned to various criteria. Each criterion weightage was divided by the sum of the weightage to normalize the weightage. The sum of the new weightage value of each criterion should be one (1), as it was normalized.
where
2.4 Spatial Data Collection for Criteria
The spatial data collection for this study was conducted with both primary and secondary data collection methods. The data that could be obtained from any secondary data sources were collected, whether they were open-source data or needed to be obtained officially from agencies. Meanwhile, for the data that were not available in any secondary data sources, primary data collection was conducted through field data collection.
Convenience pathways for e-scooters aimed to improve accessibility, safety, and efficiency of the trip. Two types of criteria played an important role in maintaining convenience: path facility and obstruction. Three (3) types of path facilities were highlighted: streetlights to ensure well-lighted paths, guardrails to separate the main road and the e-scooter path, crosswalks to ease rider crossing, and colored surfaces to distinguish the main road and the path more clearly. The source of these path facilities was field data collection, utilizing mobile GIS data collectors. Additionally, obstructions along the pathway, such as street vendors and construction areas, were identified through field data collection to avoid collisions.
The comfort path for e-scooters aimed to enhance the user experience, making trips more enjoyable and allowing riders to travel longer distances without getting tired. The criteria affecting rider comfort were slope and traffic conditions. The allowable percentage for slope was a maximum of 10% gradient to avoid high speed and braking issues. Based on the National Association of City Transportation Officials (NACTO) specifications for bicycle safety, the maximum suitable speed on bicycle boulevards was 45 km/h, which was applied to find the optimal path for e-scooters. Slope data were obtained from the United States Geological Survey (USGS) or Sentinel imagery, while traffic condition data were obtained from Google or TomTom traffic data.
A network model was a graphic representation of the relationships and connections between geographical features in a network dataset. It is an important component of GIS that facilitated spatial analysis and route computation by modeling the transportation network. The network model was used to specify the relationships between features and how they relate to one another in terms of cost, traversability, and other attributes. Fig. 5 shows the process of building the network model used in this study.

Figure 5: Process of building the network dataset
First, the proximity analysis (Near Tool) was used to determine the proximity and distance between the input features and the nearest feature in a different layer or feature class. These analyses assisted in determining which features were closest to one another, figuring out distances, and carrying out relevant spatial analyses. The use of this process ensured all the criteria points were placed on the road, making the analysis more accurate.
Next, Spatial Join was used to combine the data based on spatial relationships between two spatial datasets. These tools were useful for establishing connections between attributes in various layers according to spatial containment or proximity. In this study, the spatial data of the road was combined with the criteria chosen for the network analysis.
Then, network attributes were parameterized as shown in Fig. 6 to allow the change of network attribute values during network analysis by predetermined parameters or circumstances. In this study, the weightage of the criterion was applied to the parameters on restriction attributes. The restriction attribute that was created automatically added the parameters of the study and could specify whether it was prohibited, avoided, or preferred travel based on the study’s needs. Distance was used as the cost of travelling in this study instead of time. This travel time could be different though the travel distance is the same at different times due to traffic conditions.

Figure 6: Network attributes parameterized
TSP, which will find the shortest route between two or more points and keep a minimum value for the travel cost even if the user stops at every spot. Distance between two or more points is the default cost value, but in multiple-criteria analysis, the cost is calculated using several criteria and weights [7]. The TSP network analysis was applied to determine the best path to take to minimize the overall distance or cost while visiting a set of locations exactly once and returning to the starting point [16].
TSP works by a set of points, and the distance between the points is also included, as indicated in the example in Fig. 7. It shows the points and distance between them. By using TSP, the salesman needs to choose the shortest path to travel all the points from 1 to 7 and back to 7. It is important to note that the path should be the minimum distance, and the salesman does not have to revisit the same point before stopping at the first point.

Figure 7: Traveling salesman problem [17]. Adapted with permission from Reference [17]. Copyright ©2021, International Journal for Research in Applied Science & Engineering Technology (IJRASET)
In this study, TSP was used to find optimal routes for e-scooter. The nodes or destinations in the routes would be the street arts location. With this, a trail connecting all locations was determined. The route will pass through all locations. Several criteria that could enhance a better travelling experience were used in the analysis. As a result, a trail for e-scooter that was comfortable and convenient for people to use to visit the street arts was generated.
The network attributes were parameterized derived in the previous section to allow the change of network attribute values during network analysis by predetermined parameters or circumstances. The set-up parameters for the network attributes used the Attribute Parameter Manager. It configured parameters using conditions, expressions, or other criteria. In this study, the weightage of the criterion was applied to the parameters on restriction attributes. The restriction attribute that was created automatically added the parameters of the study and could specify whether it was prohibited, avoided, or preferred travel based on the study’s needs.
The degree values were assigned to the restriction usage based on default values used by ArcGIS. Based on the restriction usage values that were set on ArcGIS, the weightage of the criterion was changed according to the parameters that were set. For example, in ArcGIS, the value “highly preferred” approached zero (0), while the “lowest preferred” approached 1. Prefer restriction usage was selected for the study; the change of weightage value to restriction usage value had to be made to ensure that the weightage of each criteria value was between 0 and 1 (0 ≤ Prefer ≤ 1).
The TSP network analysis was applied to determine the best path to take to minimize the overall distance or cost while visiting a set of locations exactly once and returning to the starting point. In this study, after the network dataset had been built, TSP was conducted to find the optimal routes connecting all street art locations in the study area. The best order for visiting the stop locations could be generated by the route solver, where the TSP solver first created an origin-destination cost matrix connecting each stop that needed to be sequenced and then employed an algorithm based on tabu search to determine the optimal order in which to visit the stops. In the route layer properties, the “Reorder Stops to Find Optimal Route” settings were ticked for use in analysis, which changed the route analysis into a TSP from a shortest-path problem.
2.7 Site Verification and Expert’s Verification
To validate the derived optimal routes, two techniques were used, which are site verification and expert’s verification. This step was crucial to analyze how the criteria and weightage derived using Fuzzy-AHP influenced the final route selection. Furthermore, confirmation from specialists and experts was carried out to guarantee that the trail discovered could be implemented, which was checked by the local agency since they were experts with practical experience and expertise in strategic planning.
Based on the hierarchal structure that has been made in Fig. 3, based on the level of priorities, the main criteria weightage will be computed using FAHP first because it sets the foundation for allocating weights to the sub criteria. The weights assigned to the main criteria reflect their relative importance in achieving the decision objective. These weights served as reference points for distributing weights to the sub-criteria consistently and logically. By accurately determining the weights of the main criteria, decision-makers can ensure that the overall decision reflects their preferences and priorities. Table 8 shows the bar chart for the main criteria weightage.

The analysis of expert-weighted criteria for optimizing e-scooter pathways highlights the importance of path facility, which accounts for nearly half of the total weightage. This underscores the critical role of well-designed pathways in enhancing mobility, safety, and trip effectiveness. Meanwhile, obstruction criteria are weighted least due to their temporary nature, contrasting with factors like slope and traffic speed, which have more persistent impacts on pathway usability. Slope and traffic speed are prioritized due to their substantial influence on creating optimal pathway conditions, directly impacting navigation ease, safety, and accessibility. Consequently, careful consideration of these factors is essential in the design and creation of e-scooter pathways to ensure both safety and efficiency for riders.
After obtaining the weightage of the main criteria using FAHP computation, the next step was to calculate the weightage of the sub-criteria. This process involved using the weights of the main criteria as a reference to determine the relative importance of the sub-criteria within each main criterion. The result of the process was important because it helped to break down the decision problem into smaller parts, enabling a thorough evaluation of the different factors that influenced each main criterion.
Based on the findings, the most influential criteria for e-scooters trail is path facility (0.495), indicating that a good design and quality of the trail are crucial in enhancing mobility and safety as well as the effectiveness of the trail itself. This finding is supported by several studies [18,19]. On the other hand, the least influential criteria is obstruction, with a weightage of 0.132. This is perhaps due to its temporary nature, as it only causes short-term disruptions to the functionality of the trail. The other two criteria, slope and traffic speed, are more significant with a weightage of 0.194 and 0.172, as they could affect the seamless navigation while riding e-scooters. If the ground is steep, it could challenge stability, while roads with high traffic speed limits could increase accident risks, as till now, e-scooters in Malaysia need to co-share the road with motor vehicles.
The TSP network analysis was applied to determine the best path to take to minimize the overall distance or cost while visiting a set of locations exactly once and returning to the starting point, which is the location of the e-scooter shared station, which is located at the rail transit station as depicted in Fig. 8. In this study, after the network dataset had been built according to the weightage that had been computed using FAHP, TSP was conducted to find the optimal routes connecting all street art locations in the study area. The best order for visiting the stop locations could be generated by the route solver, where the TSP solver first created an origin-destination cost matrix connecting each stop that needed to be sequenced and then employed an algorithm based on tabu search to determine the optimal order in which to visit the stops.

Figure 8: Map of e-scooter trail for bukit bintang street arts
TSP is used to determine the most efficient route that visits a set of given locations exactly once and returns to the starting point. Fig. 6 illustrates the application of TSP within ArcGIS to find the optimal pathway for e-scooters visiting various street art locations in Bukit Bintang. By inputting these locations as points and assigning attribute parameters, ArcGIS algorithms identify the most efficient route, ensuring each site is visited exactly once. The Bukit Bintang Monorail Station serves as the start and end point, enhancing accessibility and promoting integration with the wider transportation network. Symbols on the map denote train stations, e-scooter parking spots, shopping malls, eateries, and attractions, enriching the user experience by guiding riders to various amenities and points of interest. This optimal route not only reduces travel time and distance but also enhances the overall efficiency and enjoyment of exploring Bukit Bintang’s vibrant street art scene using an e-scooter.
The on-site verification was conducted by personally traversing the road using an e-scooter to ensure an authentic user experience. Throughout the verification process, several aspects needed identification, including the precise location of street art, confirming its existence, and assessing the safety and facilities of the path. This comprehensive approach aimed to replicate real-world conditions and address any potential issues that could affect e-scooter users’ experience and safety. Important aspects like the precise location of street art, its existence, and the safety of the path were checked. This helped address any issues that could affect e-scooter users’ safety and enjoyment. The result was also verified by expert.
The FAHP methodology was utilized to determine the criteria defining optimal pathway conditions for e-scooter travel, with expert judgement providing weightages for each criterion via the Fuzzy-AHP process. After spatially joining roads with criteria, weightages were assigned and summed to derive cumulative weightages, highlighting optimal routes. The TSP within GIS network analysis was then applied to generate a potential trail connecting e-scooter routes to street art locations, optimizing the route based on the weighted criteria. The combined FAHP and GIS methodology proved effective in deriving suitable paths for e-scooters, offering practical insights for enhancing road infrastructure and commercial potential for navigation tools, which can be integrated into e-scooter applications or placed at transportation hubs to guide riders exploring Bukit Bintang’s street art.
This study contributed to a novel framework of integrating Fuzzy-AHP in GIS network analysis to find a suitable route for an e-scooter that includes experts’ opinions in the decision-making. As there is yet a designated route for e-scooters to visit street art in the area, the produced map could be used by visitors to experience the city. However, the method could be improved by adding more criteria. Based on this study, it is recommended to expand the data used for the research, which will be included as the parameters in determining the best path for e-scooters to visit all the points of interest. The data that could be added are the type of road surface, and the type or material of pavement that plays an important role in guaranteeing safety and providing optimal comfort to users of micromobility vehicles. The main factors that are considered in the selection of type pavement are slip resistance, texture depth, and water flow quality. The pavement for the micromobility vehicle route must be safe, easily maintained, and durable like asphalt and concrete.
Acknowledgement: The authors would like to thank all experts involved in this study and data providers.
Funding Statement: The authors received no specific funding for this study.
Author Contributions: The authors confirm contribution to the paper as follows: study conception and design: Muhammad Salahuddin Mohamad Shahrul Annuar, Nur Aina Adiela Azmi, Nabilah Naharudin; data collection: Muhammad Salahuddin Mohamad Shahrul Annuar; analysis and interpretation of results: Muhammad Salahuddin Mohamad Shahrul Annuar, Nabilah Naharudin, Nafisah Khalid; draft manuscript preparation: Muhammad Salahuddin Mohamad Shahrul Annuar, Nabilah Naharudin. All authors reviewed the results and approved the final version of the manuscript.
Availability of Data and Materials: The data is confidential as it is obtained only for the purpose of this study and cannot be disclosed.
Ethics Approval: Not applicable.
Conflicts of Interest: The authors declare no conflicts of interest to report regarding the present study.
References
1. Ma Q, Yang H, Mayhue A, Sun Y, Huang Z, Ma Y. E-Scooter safety: the riding risk analysis based on mobile sensing data. Accid Anal Prev. 2021;151(1):105954. doi:10.1016/j.aap.2020.105954. [Google Scholar] [PubMed] [CrossRef]
2. Zhang W, Buehler R, Broaddus A, Sweeney T. What type of infrastructures do e-scooter riders prefer? A route choice model. Transp Res Part D: Transp Environ. 2021;94:102761. doi:10.1016/j.trd.2021.102761. [Google Scholar] [CrossRef]
3. Malczewski J, Rinner C. Multicriteria decision analysis in geographic information science. New York: Springer; 2015. [Google Scholar]
4. Litman T, Blair R. Pedestrian and bicycle planning: a guide to best practices; 2022. Available from: www.vtpi.org. [Accessed 2024]. [Google Scholar]
5. Hull A, O’Holleran C. Bicycle infrastructure: can good design encourage cycling? Urban Plan Transp Res. 2014;2(1):369–406. doi:10.1080/21650020.2014.955210. [Google Scholar] [CrossRef]
6. Đerek J, Sikora M. Bicycle route planning using multiple criteria gis analysis; bicycle route planning using multiple criteria GIS analysis. In: 2019 International Conference on Software, Telecommunications and Computer Networks (SoftCOM), 2019; Split, Croatia. [Google Scholar]
7. Roslan A, Zulkiffli NSM, Jamil HM, Harun NZ, Jamaluddin N, Hamidun R, et al. Evaluating the on-street bicycle lane and bicyclist safety in Malaysia. J Society Automot Eng Malaysia. 2021;5(4):2–11. [Google Scholar]
8. Mohamad N, Hawa K, Jamil M, Tajul S, Syed M, Arif T, et al. Development and improvement of the bicycle path in Putrajaya design criteria for the proposed bicycle path in Putrajaya. Malaysia Institute of Road Safety Research (MIROS); 2014. [Google Scholar]
9. Saplıoğlu M, Aydın MM. Choosing safe and suitable bicycle routes to integrate cycling and public transport systems. J Transp Health. 2018;10:236–52. doi:10.1016/j.jth.2018.05.011. [Google Scholar] [CrossRef]
10. Lu W, Scott DM, Dalumpines R. Understanding bike share cyclist route choice using GPS data: comparing dominant routes and shortest paths. J Transp Geogr. 2018;71:172–81. doi:10.1016/j.jtrangeo.2018.07.012. [Google Scholar] [CrossRef]
11. Liu H, Szeto WY, Long J. Bike network design problem with a path-size logit-based equilibrium constraint: formulation, global optimization, and matheuristic. Transp Res Part E: Logist Transp Review. 2019;127:284–307. doi:10.1016/j.tre.2019.05.010. [Google Scholar] [CrossRef]
12. Klobucar M, Fricker J. Feasibility study for bicycle safety: data assessment and network evaluation. West Lafayette, Indiana: Publication FHWA/IN/JTRP-2006/19; 2006. doi:10.5703/1288284313372. [Google Scholar] [CrossRef]
13. Broach J, Dill J, Gliebe J. Where do cyclists ride? A route choice model developed with revealed preference GPS data. Transp Res Part A: Policy Pract. 2012;46(10):1730–40. doi:10.1016/j.tra.2012.07.005. [Google Scholar] [CrossRef]
14. Kim C, Kim Y, Yi H. Fuzzy analytic hierarchy process-based mobile robot path planning. Electronics. 2020;9(2):290. doi:10.3390/electronics9020290. [Google Scholar] [CrossRef]
15. Nurdiawan O, Pratama FA, Kurnia DA, Rahaningsih N. Optimization of traveling salesman problem on scheduling tour packages using genetic algorithms. J Phys: Conf Ser. 2020;1477(9):052037. doi:10.1088/1742-6596/1477/5/052037. [Google Scholar] [CrossRef]
16. Santos JL, Oliveira A. Traveling salesman problem in a geographic information management system. In: Progress in industrial mathematics: Success stories: the industry and the academia points of view. Springer International Publishing; 2021. [Google Scholar]
17. Sekhar TG, Sathvik GBS. An efficient approach for solving travelling sales man problem. Int J Res Appl Sci Eng Technol. 2021;9(8):2793–8. doi:10.22214/ijraset.2021.37838. [Google Scholar] [CrossRef]
18. Anke J, Ringhand M, Petzoldt T, Gehlert T. Micro-mobility and road safety: why do e-scooter riders use the sidewalk? Eur Transp Res Rev. 2023;15(1):29. doi:10.1186/s12544-023-00607-z. [Google Scholar] [CrossRef]
19. Şengül B, Mostofi H. Impacts of e-micromobility on the sustainability of urban transportation—a systematic review. Appl Sci. 2021;11(13):5851. doi:10.3390/app11135851. [Google Scholar] [CrossRef]
Cite This Article
 Copyright © 2025 The Author(s). Published by Tech Science Press.
This work is licensed under a Creative Commons Attribution 4.0 International License , which permits unrestricted use, distribution, and reproduction in any medium, provided the original work is properly cited.
 Downloads
 Citation Tools