
 Submit a Paper
 Propose a Special lssue
 Open Access
ARTICLE
Road Infrastructure Assessment and Traffic Dynamics Using GIS: A Case Study in the Philippines
1 Civil Engineering Department, College of Engineering and Technology, Romblon State University, Odiongan, Romblon, 5505, Philippines
2 Disaster Prevention Research Institute, Kyoto University, Gokasho, Uji, Kyoto, 611-0011, Japan
3 Department of Civil Engineering, Institute of Technology, Far Eastern University, Sampaloc, Manila, 1015, Philippines
* Corresponding Author: Jerome Gacu. Email:
Revue Internationale de Géomatique 2025, 34, 187-207. https://doi.org/10.32604/rig.2025.063247
Received 09 January 2025; Accepted 13 March 2025; Issue published 09 April 2025
 View Full Text
 Download PDF
Abstract
Road condition assessment involves evaluating the physical state of roadways to determine necessary maintenance and rehabilitation, while traffic assessment focuses on analyzing vehicle flow patterns to improve traffic management. This study employs Geographic Information Systems (GIS) to assess and evaluate road conditions and traffic dynamics in the rural municipality of Odiongan, Romblon, Philippines. GIS mapping enabled a spatially detailed classification of road conditions, identifying areas categorized as excellent, good, fair, or poor, and highlighted sections requiring maintenance or rehabilitation. These assessments are crucial for enhancing the transportation framework amid escalating developmental and demographic demands. Concurrently, GIS was used to visualize and analyze traffic composition and flow, with the study measuring the Level of Service (LOS) for traffic, emphasizing vehicle composition during peak and off-peak periods. Findings revealed a mix of good to fair road conditions across most of Odiongan, with twelve (12) barangays suffering from poor conditions necessitating rehabilitation. Traffic composition was dominated by motorcycles and tricycles, experiencing a significant uptick in volume during peak hours. The GIS-based evaluation pointed out an unsatisfactory LOS (ranging from C to F) at all stations, underscoring the need for enhanced signalization and intersection upgrades. By leveraging GIS to provide a comprehensive understanding of road and traffic conditions, this study lays the groundwork for an integrated transportation management plan to bolster the efficiency and safety of the municipality’s transportation network amidst ongoing rural development.Keywords
Abbreviations
| GIS | Geographic Information Systems |
| LOS | Level of Service |
| PASER | Pavement Surface Evaluation and Rating |
| PCI | Pavement Condition Index |
| PCU | Passenger Car Unit |
| PCEF | Passenger Car Equivalent Factor |
| HPM-DPWH | Highway Planning Manual-Department of Public Works and Highways |
| VCR | Volume-Capacity Ratio |
Roads, a critical element of the transportation system, facilitate significant contributions to a country’s development, particularly in connecting rural areas to economic centers [1,2]. They are categorized into paved and unpaved, with their performance largely dependent on the subsurface layer’s material, which varies between gravel, aggregate, concrete, or asphalt for paved roads and natural materials like gravel and soil for unpaved roads [3,4]. Maintenance, essential to preserve road conditions and ensure quality service, can be monitored through dynamic and static methods, requiring human resources and automatic devices. Proactive maintenance treatments are crucial for economic and environmental sustainability [5].
The use of inferior materials and inadequate maintenance significantly compromises road integrity, leading to accelerated deterioration and the potential for severe damage. Overloading exacerbates these issues, with vehicles exceeding their capacity, contributing to rapid wear and structural failures [6,7]. Environmental factors, alongside mechanical stresses, induce a variety of pavement distresses like potholes, cracks, and alligator cracking, with the study of Sulistyaningrum et al. [8] employing the Multiclass Support Vector Machine method to classify these defects, highlighting the pivotal role of traffic loads, temperature fluctuations, water exposure, and material quality in road degradation [9]. Furthermore, cracks and surface defects emerge as the most prevalent types of road damage, significantly influenced by the neglect of sewage systems. Using a severity rating system, the quantitative analysis of roads visible to slow-moving landslides underscores the necessity for strategic maintenance and infrastructure resilience [10,11]. Regin et al. [12] further corroborate the detrimental effects of vehicular stress on road longevity, emphasizing the critical need for comprehensive maintenance and material quality standards to ensure road safety and durability.
Accurate and timely evaluation of road pavement conditions is essential for effective maintenance strategies, highlighting the importance of monitoring systems as a preliminary step in the maintenance process [4]. The ability to precisely assess road conditions aids decision-makers in determining the necessary maintenance for specific pavement segments, with methods like the Bump Integrator and the International Roughness Index (IRI) offering valuable insights into road performance [13,14]. Visual inspection, recognized for its convenience and cost-effectiveness, especially in rural networks, relies on direct observation to identify and quantify pavement distresses, thereby guiding maintenance decisions [13].
Several methodologies have been developed to standardize the assessment process, such as the Pavement Condition Index (PCI) or the Pavement Surface Evaluation and Rating (PASER) method. The PCI offers an objective evaluation from 0 to 100, facilitating a nuanced understanding of pavement conditions through distress density analysis [15]. Conversely, PASER provides a swift assessment tool, assigning condition ratings based on observed distress severity and extent, tailored to appraise pavement integrity [16] quickly.
The significance of early damage detection in road pavements cannot be overstated, as it allows for immediate repair actions, extending the road network’s lifespan and enhancing its performance [16,17]. Efficient road management plans, informed by thorough condition assessments, are crucial in maintaining road quality, particularly in rural areas where resources are often limited [18]. The adoption of comprehensive condition management and strategic planning models, such as the Modified Swiss Index (MSI) and the methodology employed in Great Britain, underscores the global commitment to sustainable road infrastructure through targeted rehabilitation and preventive maintenance [19,20].
In this context, the development of an optimization model for Pavement Management Systems (PMS), utilizing PASER ratings to inform the Capital Improvement Plan (CIP), exemplifies the integration of assessment tools in optimizing pavement conditions within budgetary constraints [21]. This approach, tested in Fort Wayne, Indiana, demonstrates the practical application of condition assessment methodologies in real-world settings, underscoring the pivotal role of systematic evaluations in maintaining and managing road infrastructures.
Traffic flow analysis and congestion evaluation are critical components of transportation system planning, aiding in creating efficient management plans, assessing current and future conditions, and facilitating road network improvements. Understanding traffic volume and congestion patterns is essential for informed road network planning and analysis decision-making. Traffic volume studies are instrumental in identifying the movements and flow within specific areas, with increasing vehicular traffic volume attributed to population growth and the enhanced mobility of goods and people [22].
Traffic congestion, a growing crisis in developing areas, adversely affects residents and the environment, with urbanization and increased vehicle use exacerbating the issue [23,24]. Analyzing traffic flow is fundamental to devising effective traffic management strategies [25]. For instance, Tufajjal Hossain et al. (2019) [26] measured the concentration of traffic congestion in Pabna by analyzing traffic flow, density, and capacity, identifying critical problems across different road sections.
Similarly, studies like those by Streets et al. (2015) [27] in Aquino et al. (2022) [28] at the intersection of Molino Road and Daang Hari Road employ traffic flow analysis, pedestrian and parking considerations, and manual traffic counts to evaluate congestion levels and develop management recommendations based on the Level of Service (LOS). These assessments provide valuable insights into traffic performance, particularly during peak hours, and underscore the importance of comprehensive traffic surveys, which can be conducted manually or using automatic counters [29].
Such studies highlight the necessity of continuous monitoring and analyzing traffic behavior to support the design and implementation of effective transportation plans, ensuring efficient traffic flow and addressing future challenges within the road network system [13,30]. Awareness of traffic conditions facilitates the formulation of transportation plans and designs that cater to current and future needs, underscoring the significance of traffic surveys in urban planning and infrastructure development.
Determining the Level of Service (LOS) is crucial for assessing and enhancing the functioning of roadways, with methodologies varying from essential traffic flow characteristics to sophisticated analyses involving volume-to-capacity ratios, average vehicle speeds, and percentage speed reductions [31,32]. Babit (2016) [33] identified differing LOS in urban areas compared to rural settings by examining load factor, peak hour factor, and volume-to-capacity ratio under free flow conditions. In a study focused on Kolkata’s metropolitan city, Biswas et al. (2016) [32] utilized videography techniques to analyze traffic flow, concluding that the area studied exhibited a LOS of F, signaling an urgent need for improvement. Gireesh Kumar et al. (2020) [34] advocated using the volume-to-capacity ratio as a straightforward method for determining LOS, highlighting its efficacy among various approaches to analyzing road service levels. These studies collectively emphasize the importance of accurately determining LOS to manage and improve roadway facilities effectively.
In the evolving transportation and civil engineering field, Geographic Information Systems (GIS) have emerged as a pivotal tool for enhancing road network planning, management, and analysis [35–37]. GIS’s flexibility and efficiency in maintaining comprehensive road databases have been emphasized as crucial for effectively managing and improving road sectors [38]. The application of GIS extends to road safety management, where it has been utilized to collect, analyze, and visually present accident data, thereby highlighting potential risks through GIS-based mapping [26]. This capability of GIS to model and analyze road networks was demonstrated by Ahmadzai et al. (2019) [39] through their development of an “Integrated Graph of Natural Road Network (IGNRN)” for Kandahar City and by Beto (2021) [40], who applied GIS to map road distress and determine appropriate maintenance strategies.
Furthermore, GIS has proven instrumental in assessing road conditions and developing management systems that provide essential accident information, including data visualization such as locations, nearest hospitals, and optimal routes [41]. Studies like those by Praditya et al. (2022) [42] in Palembang, Indonesia, and Cruz et al. [43] in the Philippines have utilized GIS for mapping road condition data and evaluating road roughness, respectively, enhancing the understanding and management of road quality. The integration of GIS in these studies showcases its capability in spatial analysis [44] and network overlays in generating accurate traffic statistics and effectively presenting the relationship between various variables related to road safety and condition [45,46]. The application of GIS across different studies underscores its value in improving road network planning, management, and safety, highlighting its significance in civil and transportation engineering.
The introduction highlights the significant role of transportation in economic development and societal progress, particularly in the Municipality of Odiongan, Romblon, where population growth and economic activity have led to increased transportation demands and traffic congestion, particularly in the central Poblacion area. Recognizing the importance of efficient road management, the study aims to conduct a comprehensive road condition and traffic assessment using GIS-based solutions. By evaluating road conditions and traffic flow at key intersections, the study seeks to provide valuable insights for improving traffic management strategies, identifying areas for maintenance, and enhancing overall transportation infrastructure. The study’s outcomes are expected to benefit local government units (LGUs) and institutions in prioritizing infrastructure improvements and ensuring public safety while also serving as a reference for future research endeavors to address community transportation challenges and enhance road network efficiency. Unlike urban traffic studies that assess signalized intersections, this study evaluates traffic dynamics in a rural setting where traffic lights are not yet installed. The findings serve as a baseline for future traffic management improvements, justifying the need for appropriate interventions.
The research methodology begins with identifying the problems and conducting a comprehensive literature review on road conditions and traffic assessment to inform the study’s approach. Data gathering commences by visually inspecting both paved and unpaved roads in Odiongan, focusing on surface defects, deformation, and drainage conditions. Concurrently, manual traffic counts are conducted at selected intersections in the Población area to assess traffic flow. Following data collection, analysis is divided into two phases: road condition assessment and traffic assessment. Severity levels are quantified in the former, and specific maintenance actions are recommended based on the PASER system. Road condition data are then inputted into GIS software for mapping. Traffic flow data are tabulated for traffic assessment, and the LOS for each direction is determined to reflect traffic flow conditions. This information is visualized on a map using GIS software, providing a comprehensive overview of road conditions and traffic flow in Odiongan (Fig. 1).
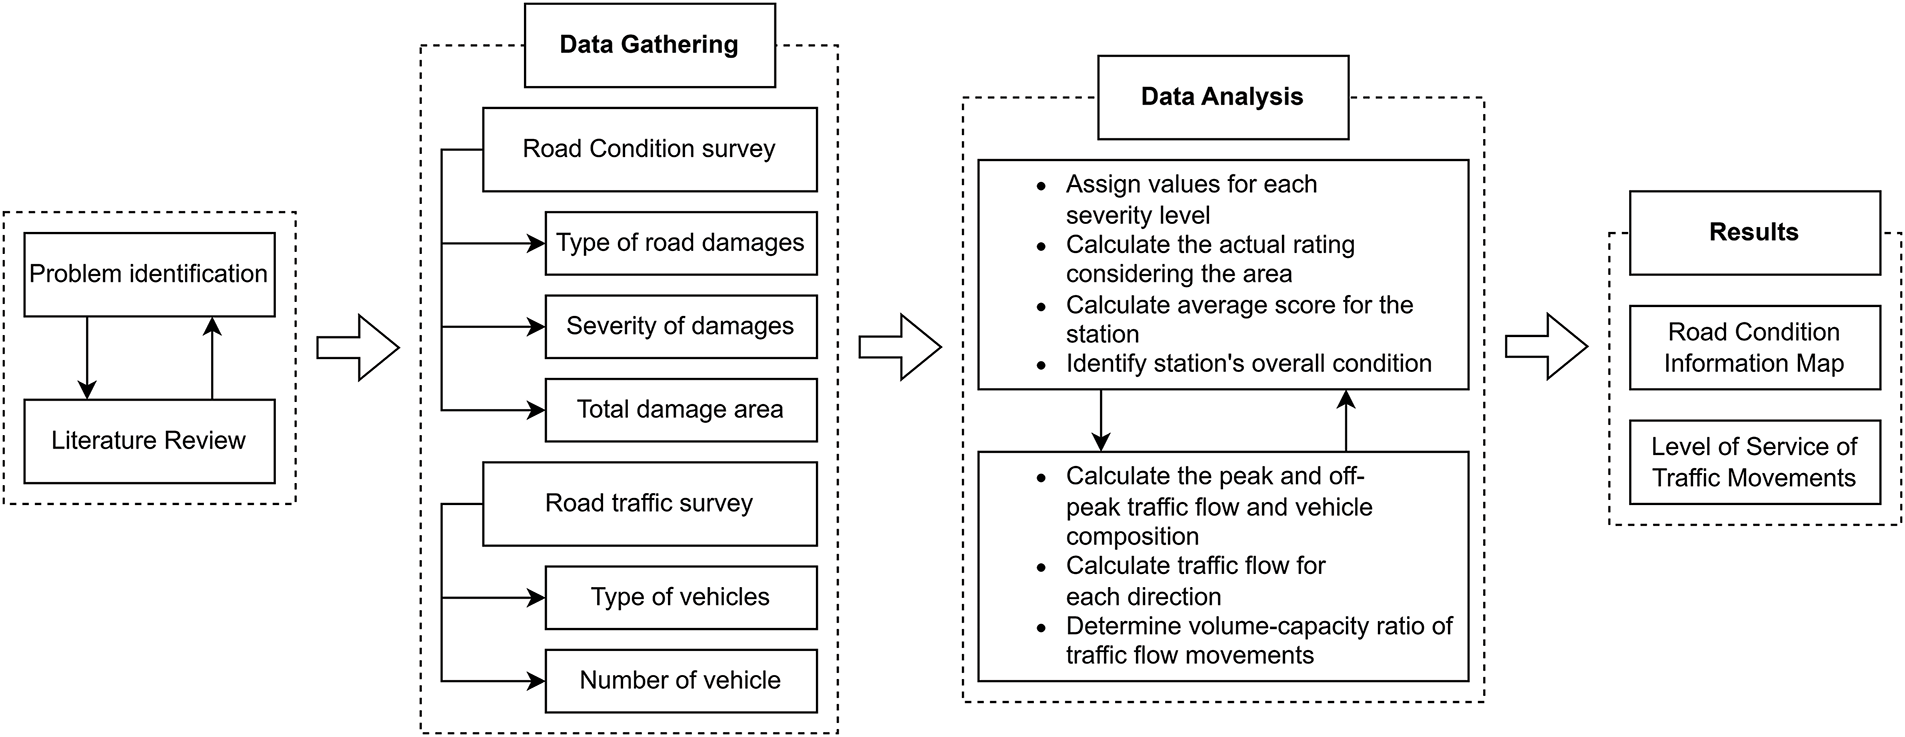
Figure 1: Conceptual framework of the study
This study evaluated the road conditions and traffic dynamics in Odiongan, Romblon, a municipality in the central-western region of Tablas Island in the Philippines. Positioned at approximately 22°04′ East Longitude and 12°19′ North Latitude within the archipelago [47], Odiongan is a vital hub [48] for transportation and commerce in the area. With its strategic location, the municipality plays a significant role in connecting various communities and facilitating movement across the island. This study aims to provide valuable insights for enhancing transportation infrastructure and management strategies in Odiongan by conducting a comprehensive assessment of road conditions and traffic flow (Fig. 2).
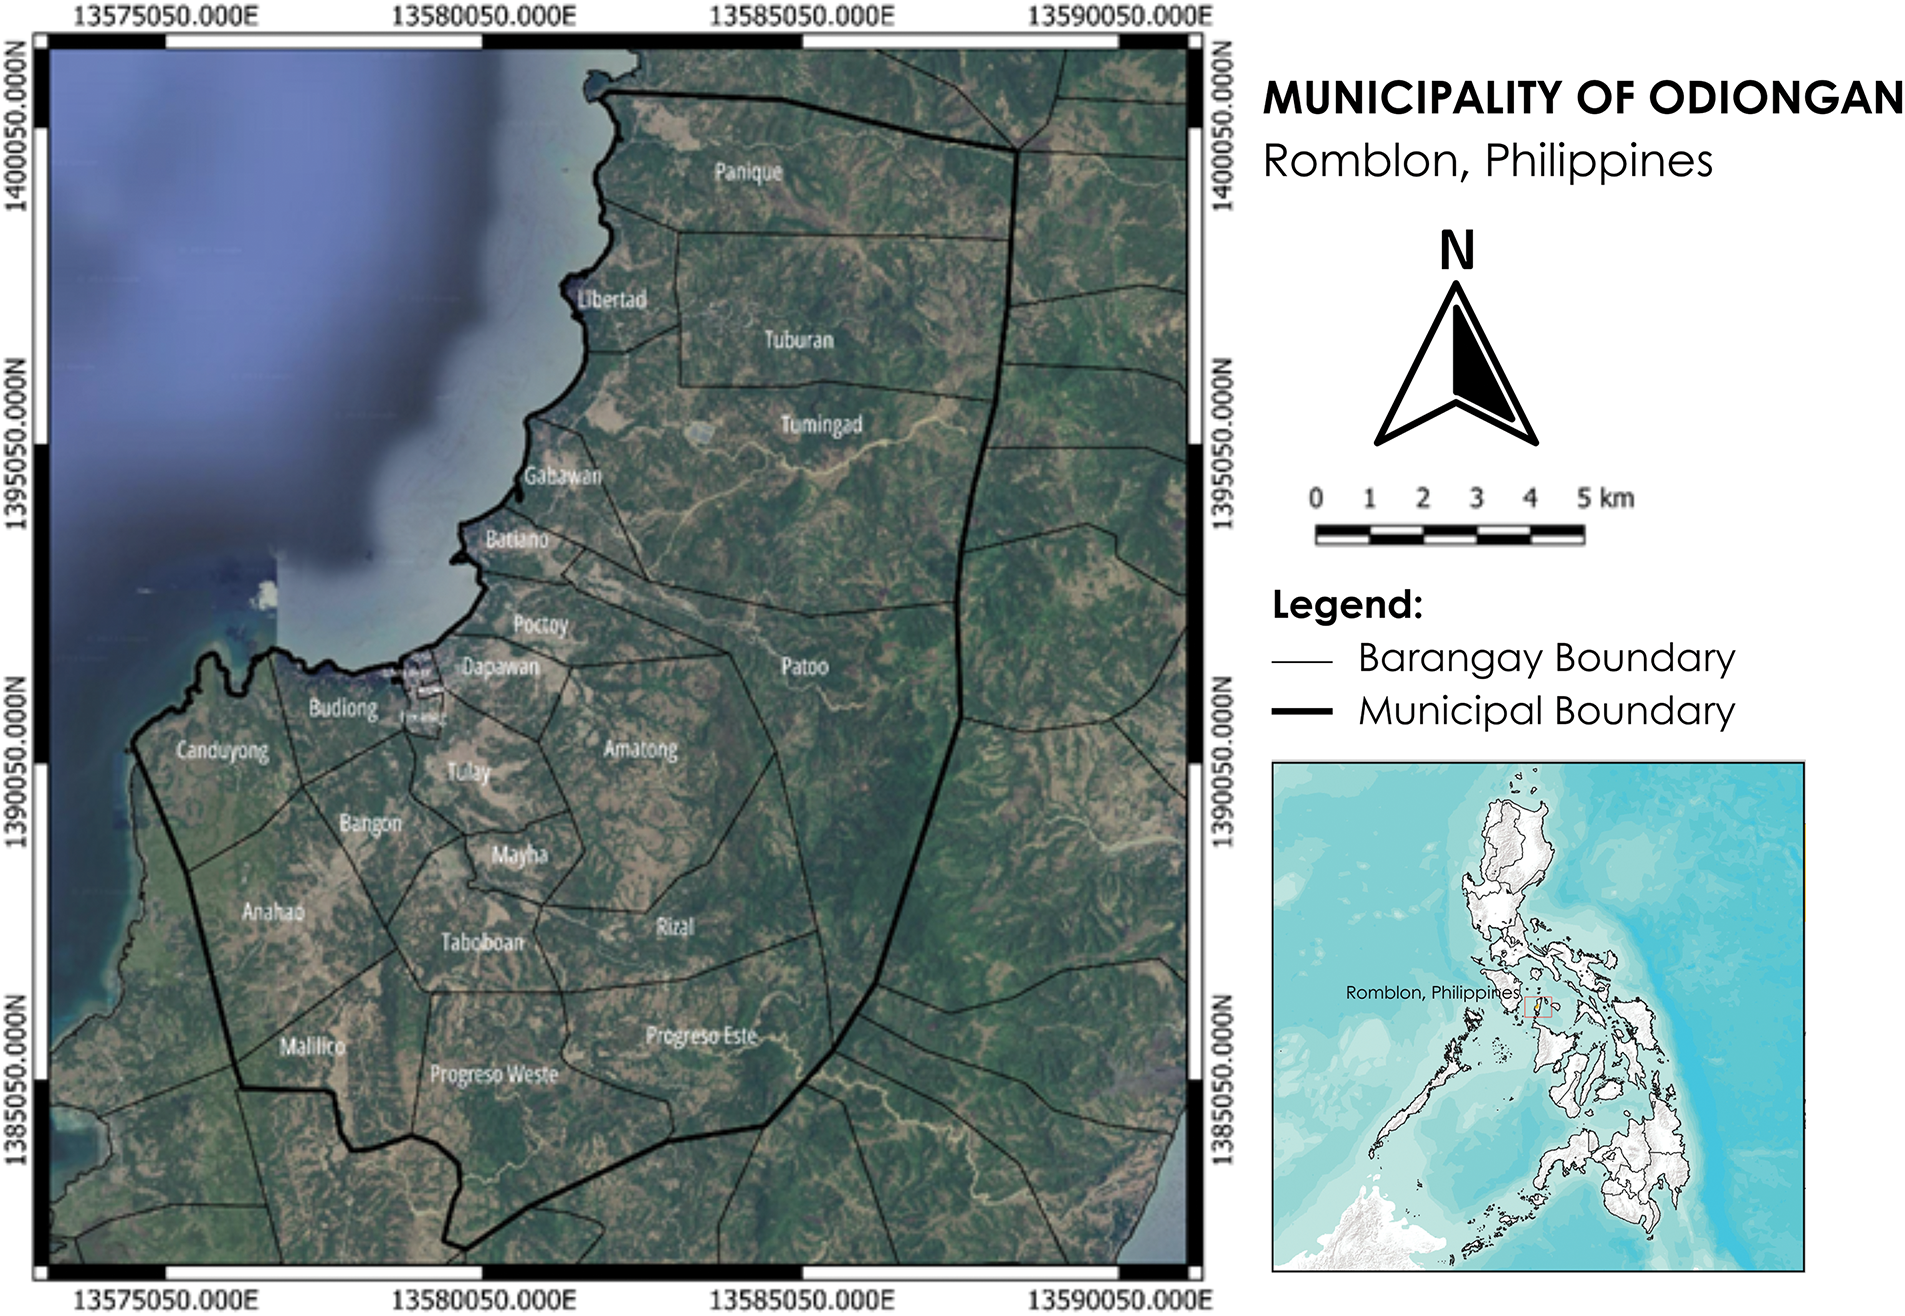
Figure 2: Area focused on road and traffic assessment study
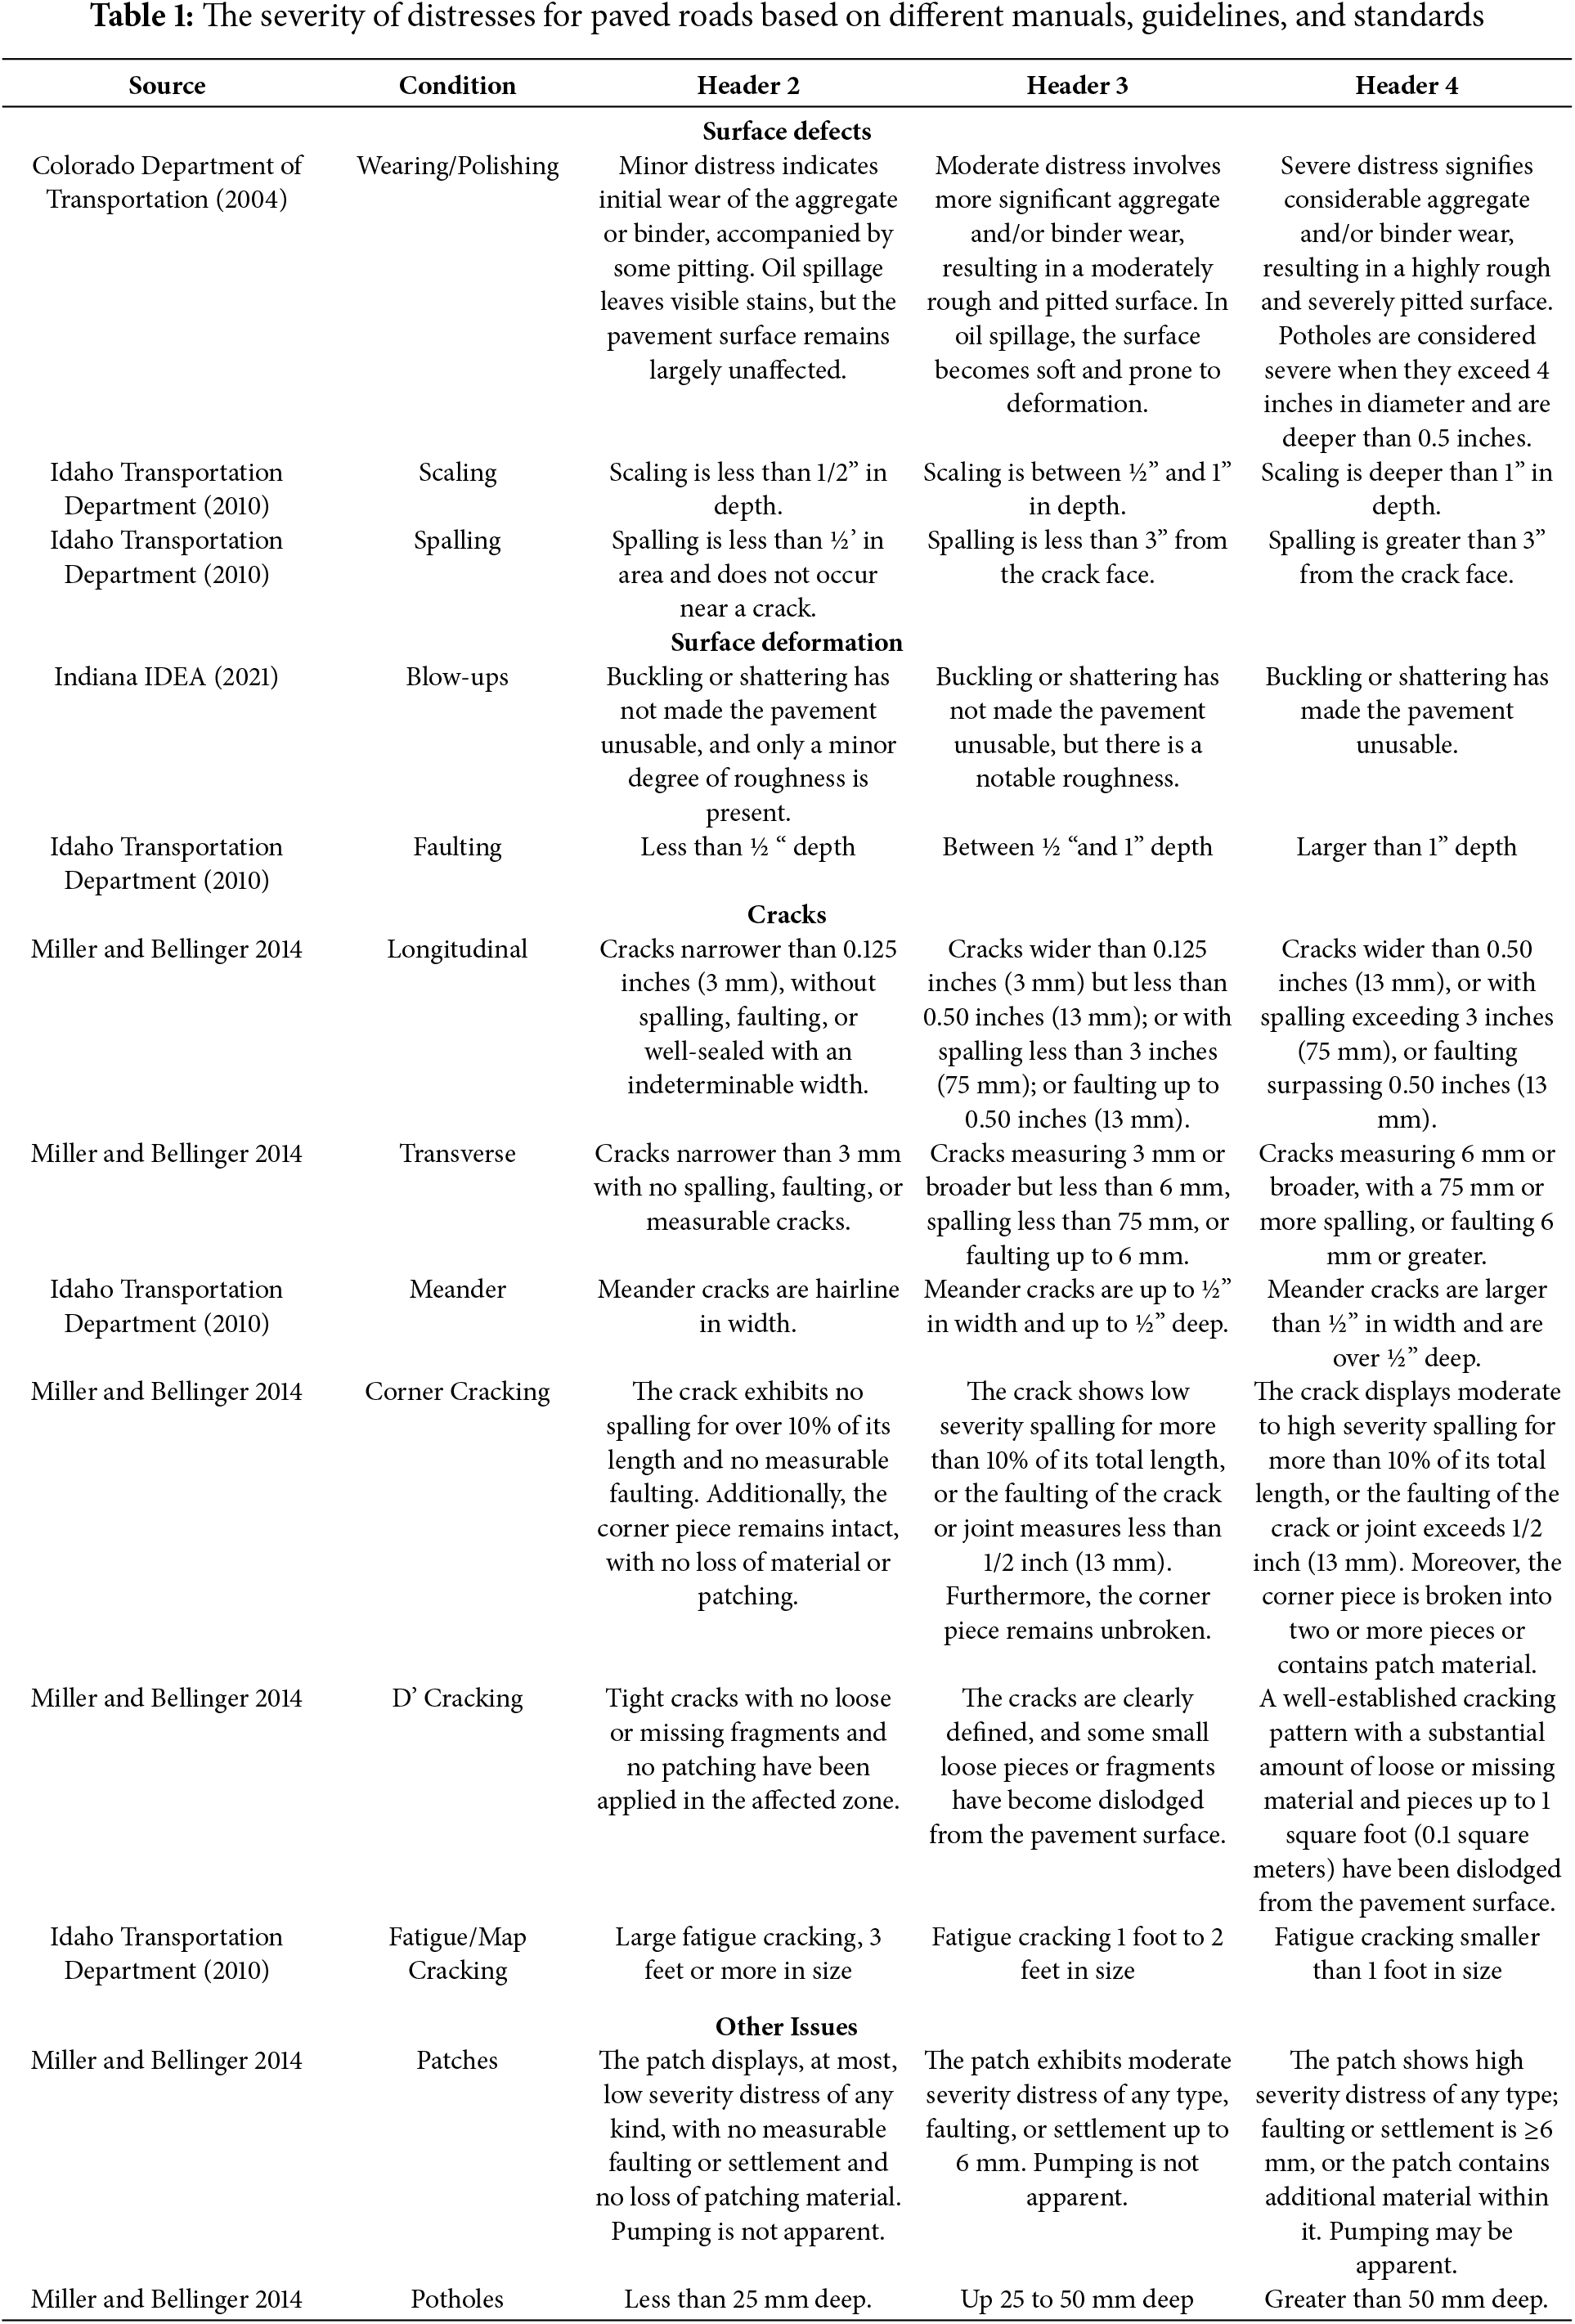
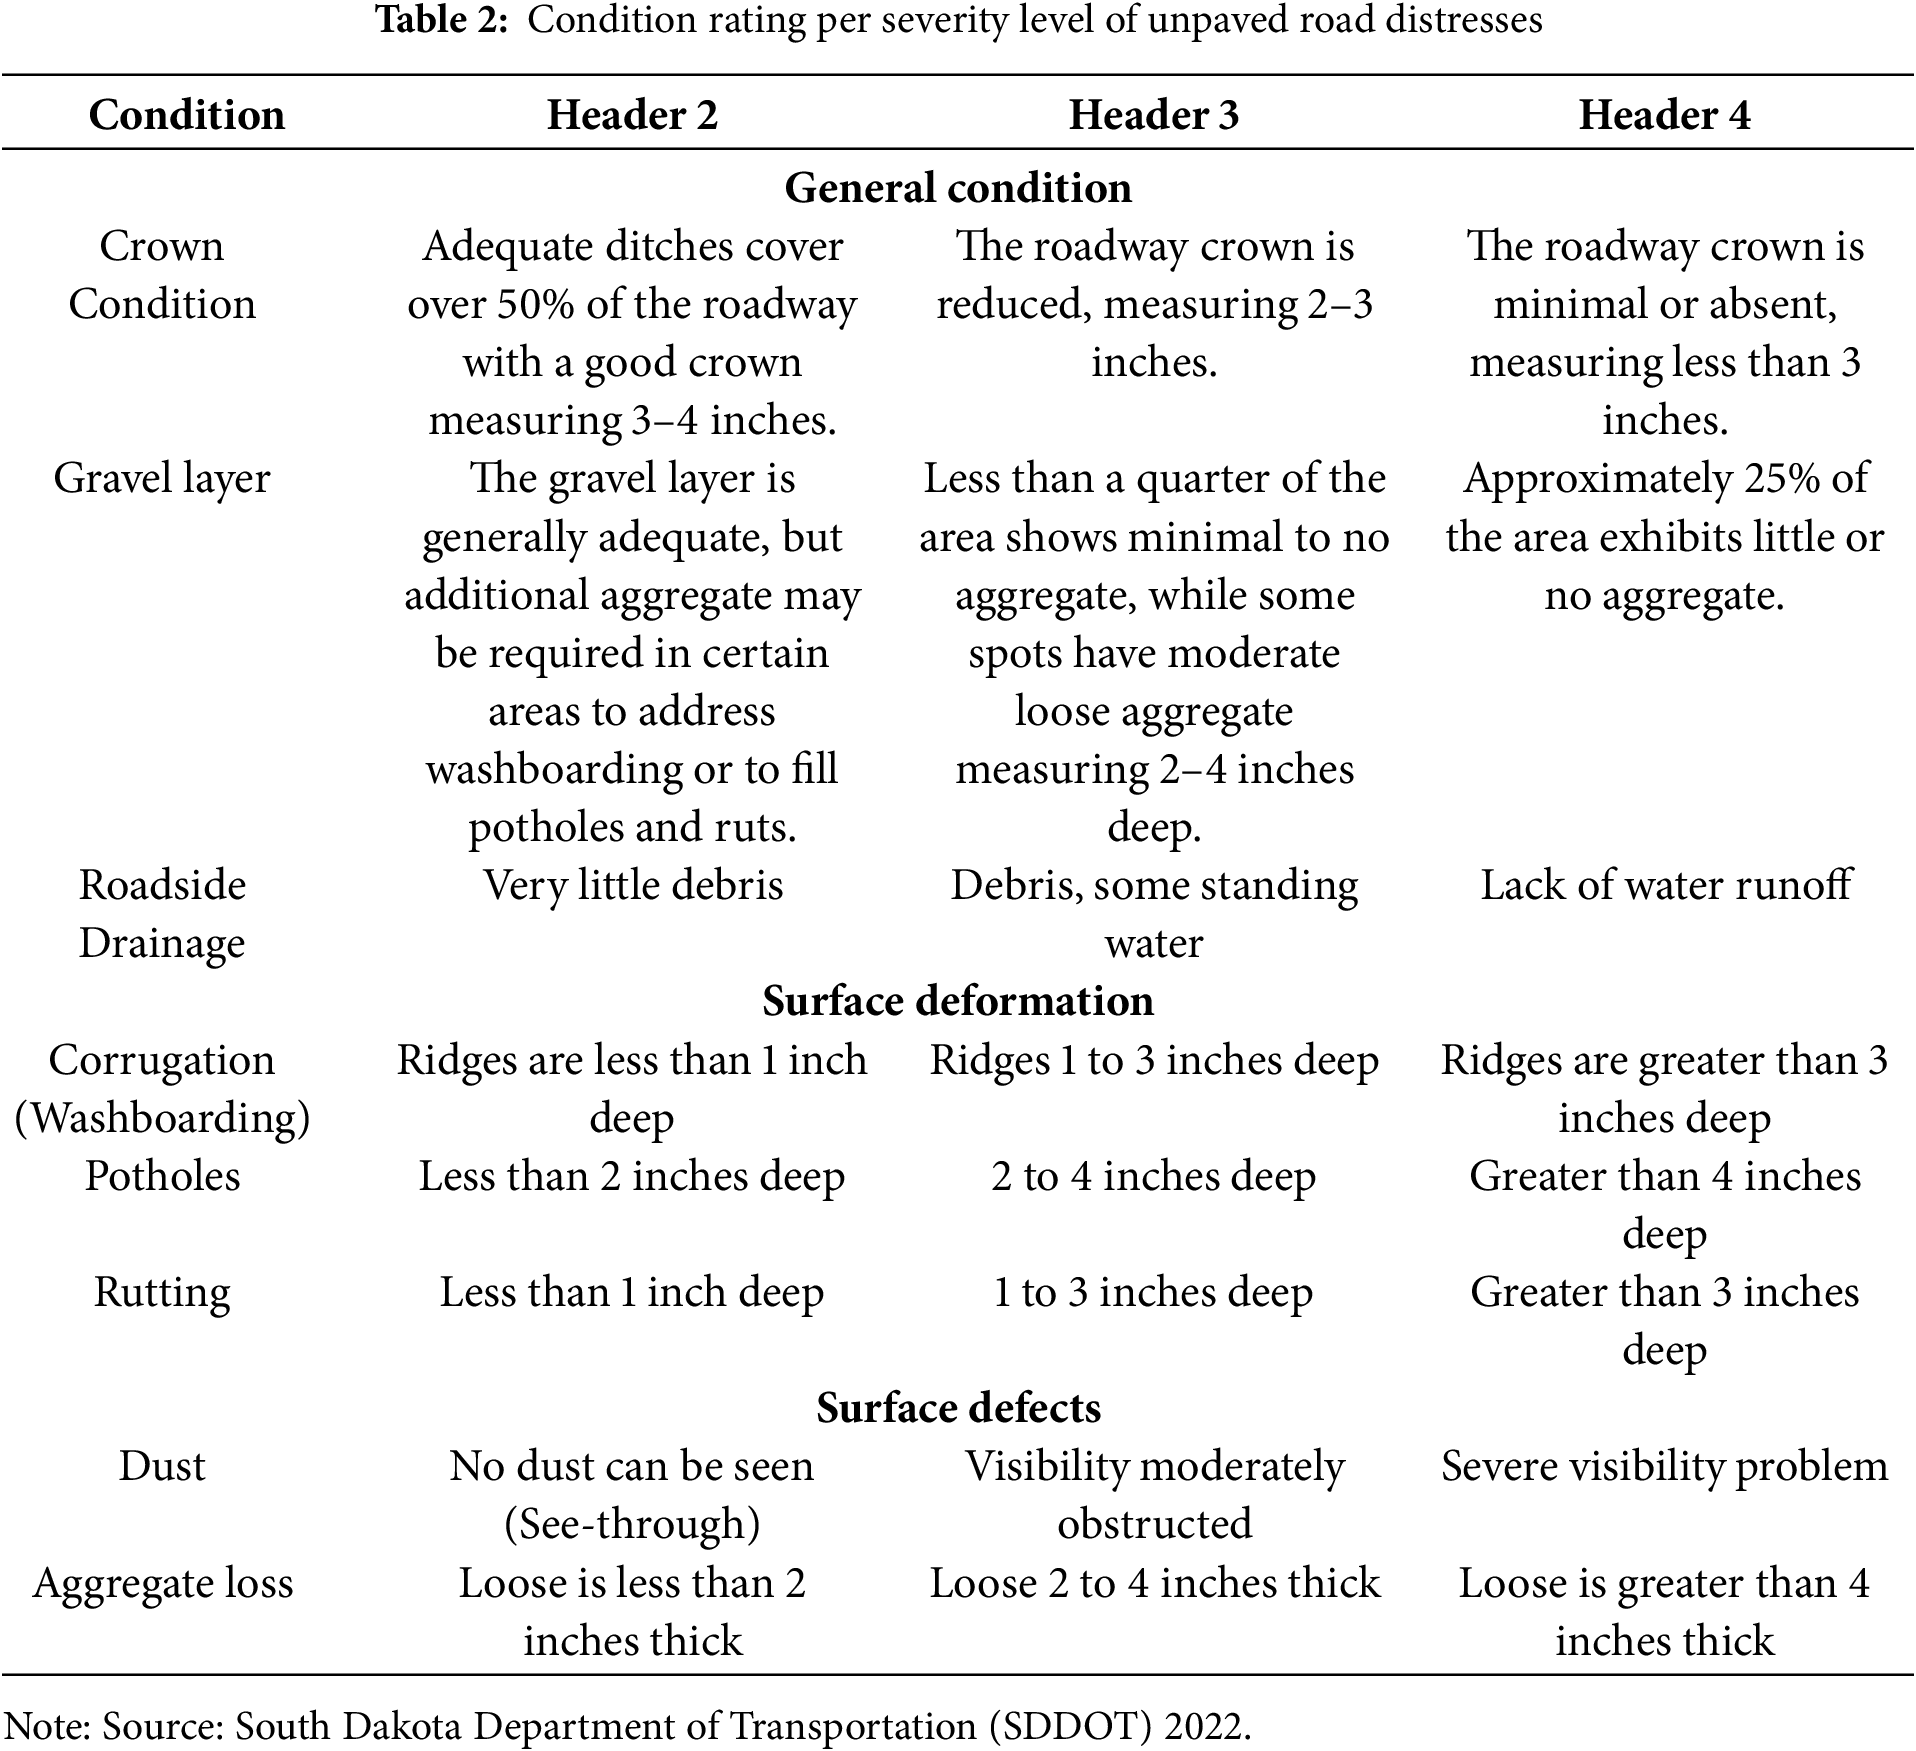
Road condition data were collected through direct observation of road damages using a manual method. Parameters for assessing pavement condition were based on the PASER manual, including surface defects, surface deformation, cracks, patches, potholes, and drainage for paved surfaces, and crown condition, drainage, gravel layer, surface deformation, and surface defects for unpaved surfaces. Distresses were categorized into minor, moderate, and severe levels, with specific descriptions outlined in Tables 1 and 2. The road condition survey was conducted across the 25 barangays.
The PASER method, initially ranging from 10 to 1, was adapted in this study to classify individual distress by severity levels: minor, moderate, and severe. Ratings were assigned based on the percentage of the road section covered by distresses using the formula below.
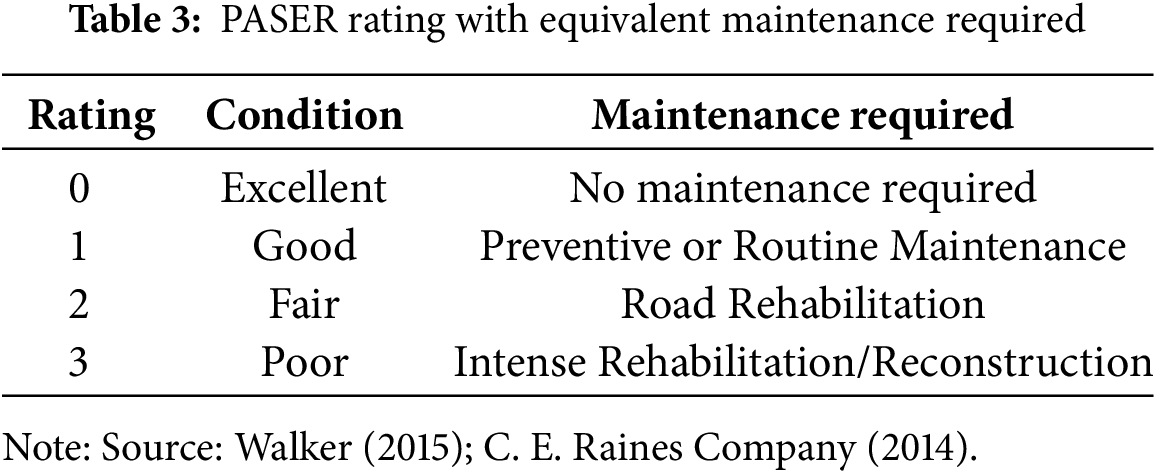
For paved roads, overall ratings for each station were summarized and grouped into four categories: excellent, good, fair, and poor, based on similarities in maintenance needs, as shown in Table 3.
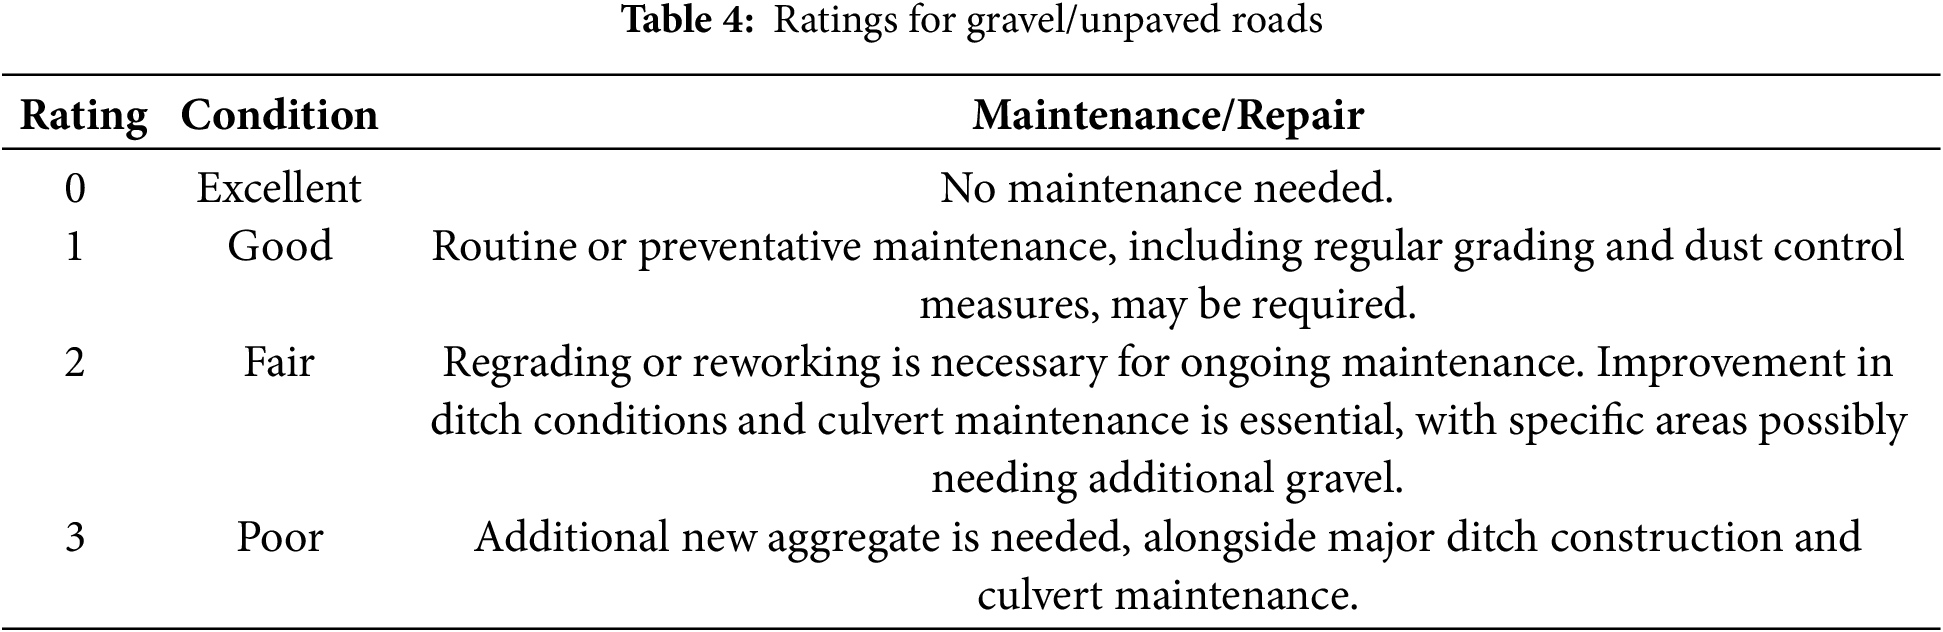
Gravel or unpaved road ratings ranged from 1 to 5, with varying degrees of condition encompassing poor, fair, good, and excellent, and were summarized similarly for overall evaluation (Table 4). Averaging was performed to determine the final road condition rating for each station.
The manual traffic counting method was employed to assess traffic volume and characteristics at selected stations in the central part of Odiongan. This approach, although labor-intensive, allowed for the collection of detailed data on traffic flow, vehicle types, and directional movement. By conducting counts over three days, researchers could capture traffic pattern variations during peak and off-peak hours, providing a comprehensive understanding of the area’s traffic dynamics. The selection of seven (7) specific stations was strategic, focusing on intersections and areas prone to congestion, thus ensuring that the assessment targeted critical points in the road network.
The manual traffic observation was conducted by a trained team of research assistants and civil engineering students with prior experience in traffic data collection. Observers were stationed at seven key intersections identified as high-traffic areas based on preliminary site assessments, with selection criteria based on road network importance, traffic density, and accessibility. Traffic counting was performed during morning peak (6:30–9:00 AM), afternoon off-peak (12:00–2:00 PM), and evening peak hours (4:30–7:00 PM) to capture variations in vehicle flow patterns. Each observer was assigned a specific intersection and equipped with traffic counting sheets, stopwatches, and a standardized classification guide for recording vehicle types, including motorcycles, tricycles, passenger cars, and trucks. To ensure accuracy, observers rotated shifts every two hours to minimize fatigue, and two independent observers conducted simultaneous counts at randomly selected locations for validation. Discrepancies beyond a 5% variation were resolved by cross-referencing with video recordings taken at the same locations. The collected data were then aggregated and converted to Passenger Car Units (PCU) using standard equivalency factors. This approach ensured data consistency and reliability while allowing for direct observations of road user behaviour, vehicle types, and traffic congestion levels in a rural, unsignalized setting.
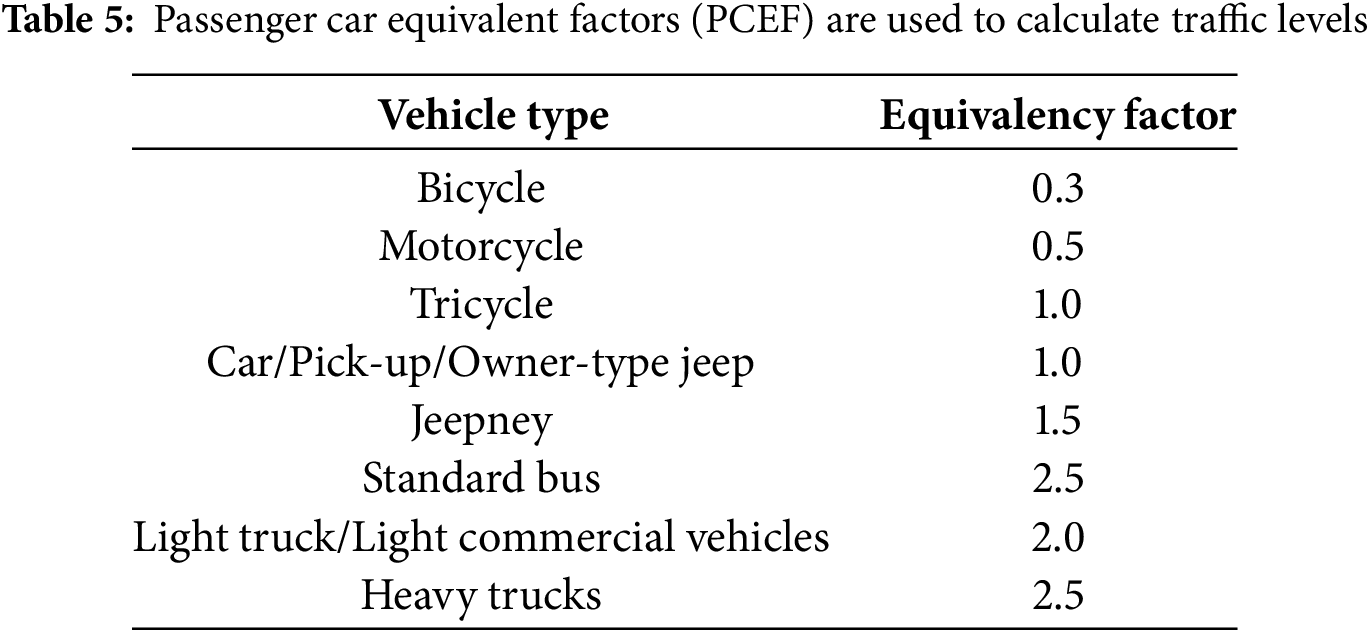
Analysis of the collected data involved calculating the average traffic volume for peak and off-peak hours at each selected station. By identifying the vehicle composition at each station, researchers gained insights into the types of vehicles traversing the area, which is crucial for understanding the road’s capacity and traffic composition. Utilizing GIS tools facilitated the visualization of traffic volume across the study area, allowing for a spatial representation of traffic flow patterns. Converting vehicle volumes to Passenger Car Units (PCU) enabled a standardized assessment of traffic levels, considering the varying impacts of different vehicle types on road capacity. Passenger Car Equivalent Factors (PCEF) for every kind of vehicle is necessary for PCU calculation. The Highway Planning Manual of the Department of Public Works and Highways (HPM-DPWH) recommends the equivalency factors in Table 5 for calculations of traffic levels for standard two-lane roads.
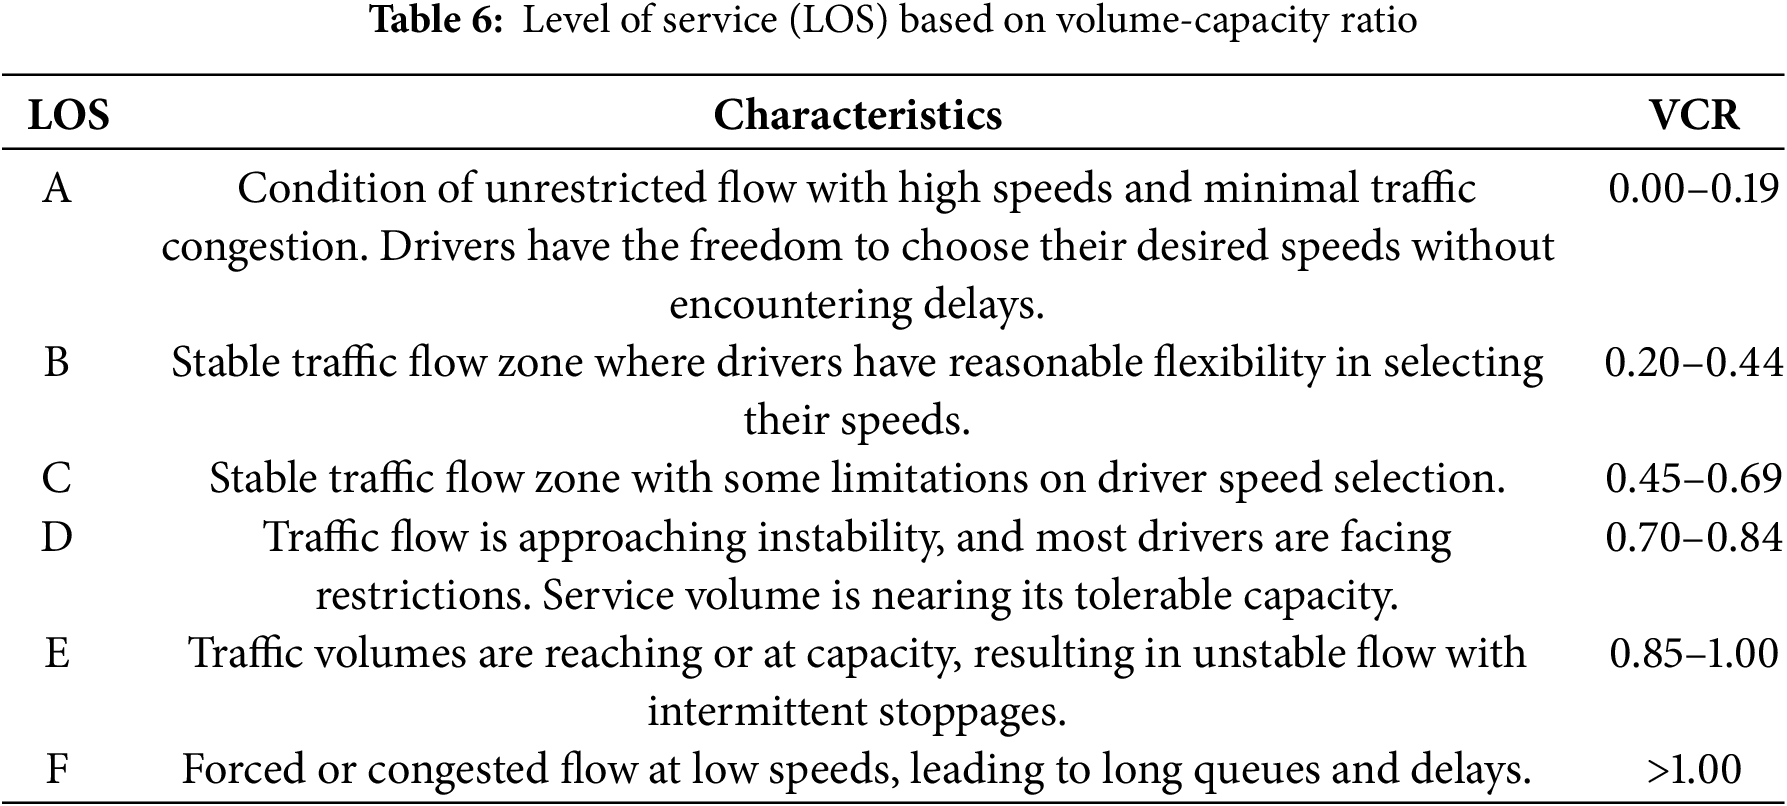
The computation of the volume-capacity ratio (VCR) shown in Table 6 and determining the LOS provided insights into the road network’s performance. By comparing observed traffic volumes to the road’s capacity, researchers could identify sections experiencing congestion or operating below capacity. Applying DPWH Highway Planning Manual (2007) guidelines ensured a standardized approach to evaluating LOS, considering factors such as road width and shoulder width adjustments. This systematic assessment facilitated the identification of areas requiring intervention to improve traffic flow and enhance overall road network efficiency.
When identifying the VCR, the capacity value depends on the carriageway width. The equivalent capacity for each road width is computed. For a shoulder of 2 m or less, the capacity is reduced by 10%. Given the absence of signalized intersections in Odiongan, the study adopted LOS evaluation methods based on unsignalized intersection criteria. Volume-to-capacity ratios were computed to assess congestion, as delay-based LOS measures are more applicable to urban areas with existing traffic signals.
3.1 Road Condition Assessment for Paved and Unpaved
The road condition assessment revealed varying deterioration and maintenance needs across different barangays in Odiongan. Roads were rated based on severity levels and area coverage of distresses, with ratings ranging from 3 (poor condition) to 0 (excellent condition). The assessment covered paved and unpaved roads requiring specific maintenance or repair actions. Notably, drainage conditions were also considered when determining overall road conditions. Fig. 3 illustrates the comprehensive road condition map of Odiongan, with colored lines indicating the condition per station of the 25 barangays.
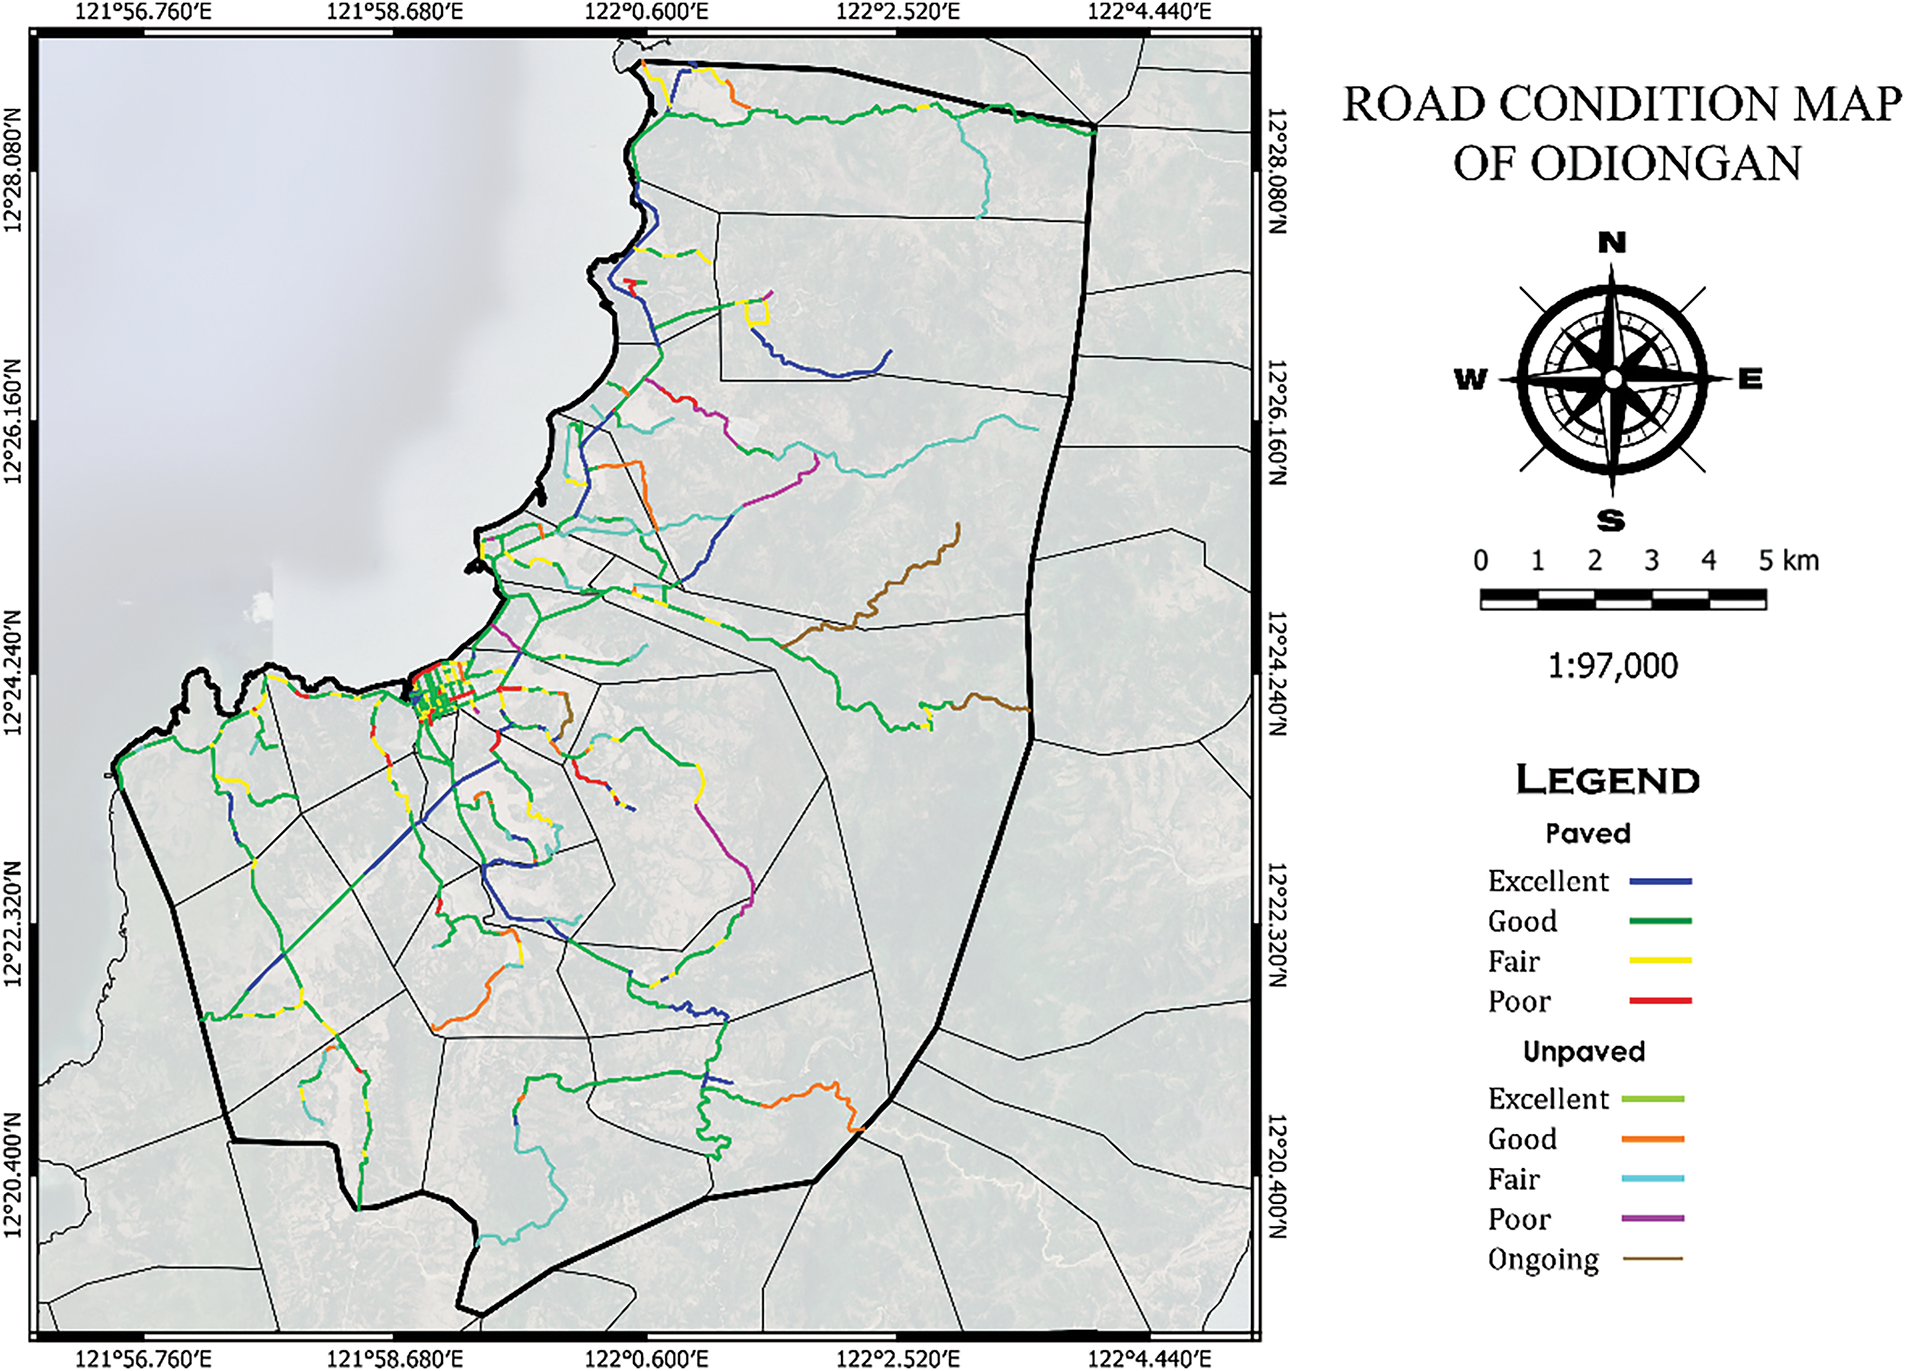
Figure 3: A GIS-based map showing the road conditions in Odiongan, categorized as excellent, good, fair, poor, and ongoing for both paved and unpaved roads
The assessment of paved roads highlighted significant variations in road conditions among barangays. For instance, most roads were rated as good or fair in the Ligaya, Liwayway, Liwanag, Tabing-dagat, Dapawan, and Poctoy groups, indicating the need for preventive maintenance or rehabilitation. However, segments in some barangays, such as Liwayway, Dapawan, and Ligaya, exhibited poor road conditions, necessitating intense rehabilitation or reconstruction. Conversely, in Tulay, Amatong, Mayha, Rizal, Taboboan, Progreso Este, and Progreso Weste, most paved roads were in good or fair condition, with some requiring routine maintenance or minor repairs. However, poor road conditions were observed in specific segments, warranting reconstruction or intense rehabilitation efforts.
The assessment of unpaved roads also revealed varying conditions across barangays. In Tulay, Taboboan, and Mayha, fair unpaved roads were predominant, requiring regrading or reworking to maintain usability. However, poor unpaved roads were observed in Amatong, indicating the need for major reconstruction or rehabilitation. Additionally, projects were identified in specific areas, highlighting ongoing efforts to improve road conditions.
The observed variations in road conditions underscore the importance of targeted maintenance and rehabilitation efforts to ensure safe and efficient transportation networks. The assessment provides valuable insights for local authorities to prioritize infrastructure investments and allocate resources effectively. By addressing maintenance needs promptly, authorities can enhance road safety, minimize travel disruptions, and support regional economic development. Ongoing projects indicate a commitment to infrastructure improvement, but sustained efforts are needed to address existing deficiencies comprehensively. Moreover, the assessment highlights the importance of integrating drainage considerations into road maintenance plans to mitigate the impact of adverse weather conditions on road integrity.
3.2 Traffic Condition Assessment
Understanding traffic patterns and composition is crucial for effective urban transportation planning and infrastructure development. In this phase, the method analyzes the traffic composition and flow at various stations in Odiongan during peak and off-peak hours, as shown in Fig. 4.
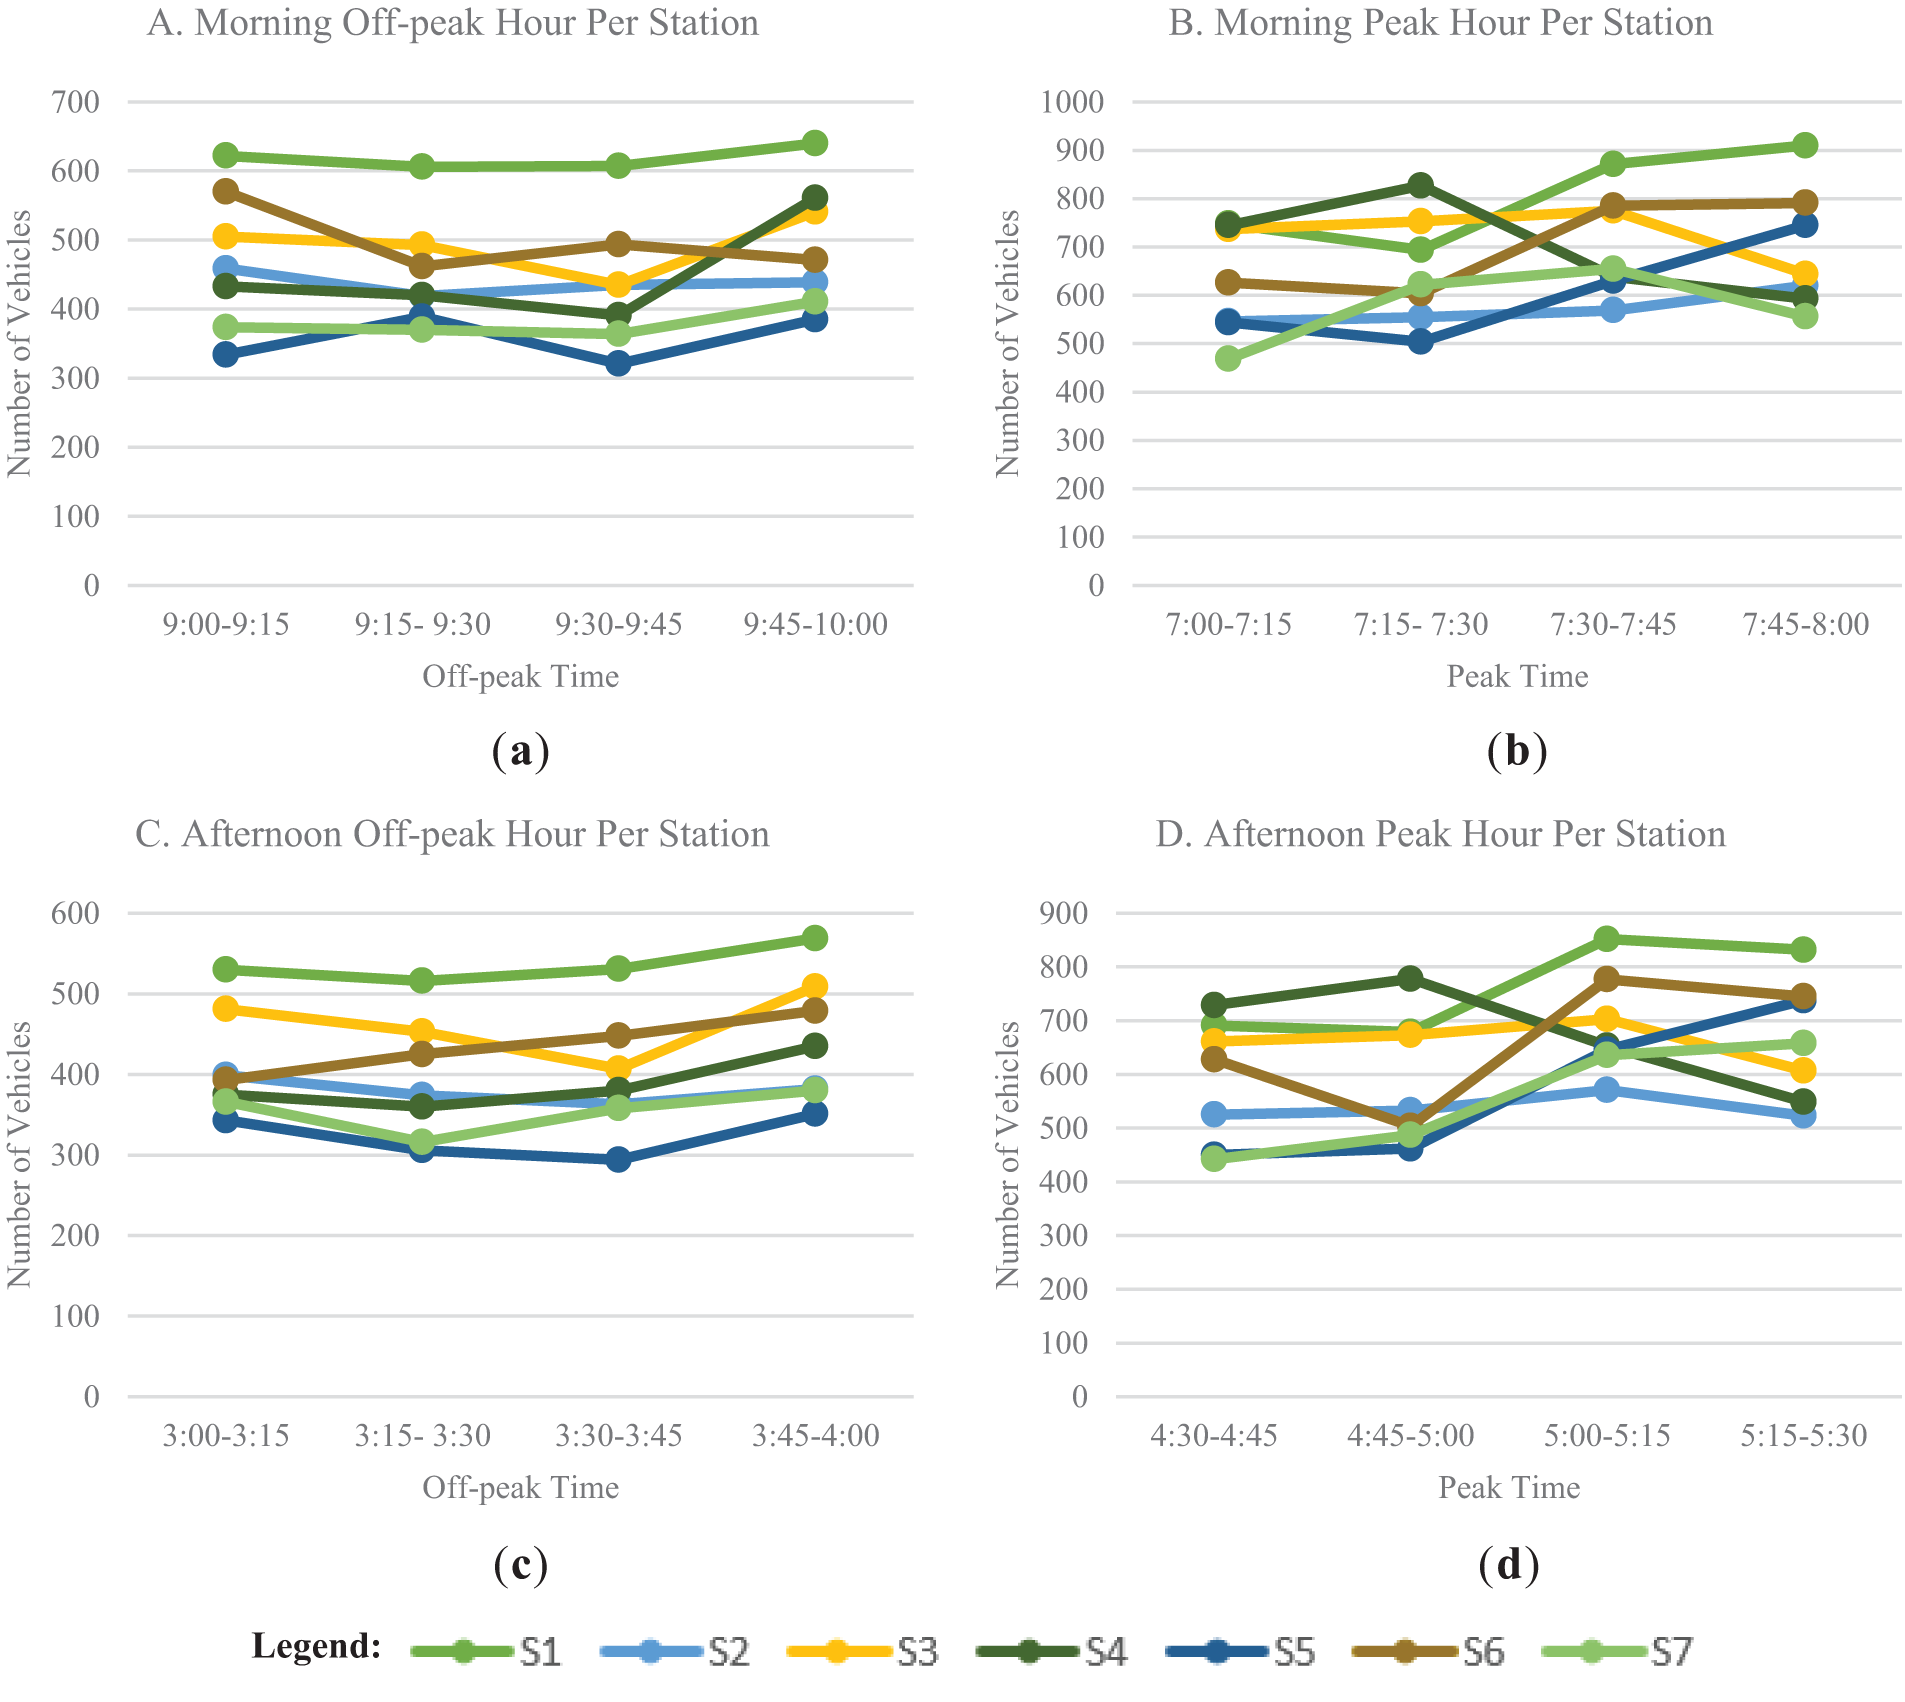
Figure 4: Morning off-peak (a) and peak (b), as well as afternoon off-peak (c) and peak (d) hour data from the seven (7) identified critical stations
During both morning and afternoon off-peak hours, motorcycles dominated the traffic composition at Station 1, comprising 68.04% and 75.25% of the total volume, respectively. Tricycles followed, representing 26.30% in the morning and 24.32% in the afternoon. Peak-hour traffic saw similar trends, with motorcycles comprising the majority of passing vehicles. A notable increase in vehicle flow was observed during the last 15 min of the afternoon off-peak hour, indicating increased activity in the area. Motorcycles also dominated the traffic composition at Station 2 during morning and afternoon off-peak hours, representing 66.15% and 68.45% of the total volume, respectively. Tricycles followed closely, with 26.83% and 25.69% during the respective periods. Peak-hour traffic saw motorcycles comprising 69.74% in the morning and 72.44% in the afternoon. The highest flow of vehicles during off-peak hours occurred from 9:00 to 9:15, while peak hours saw significant increases in flow between 7:45 to 8:00 in the morning and 5:00 to 5:15 in the afternoon. Similar trends were observed at Station 3, with motorcycles dominating both morning and afternoon off-peak hours, comprising 67.68% and 72.31% of the total volume, respectively. Tricycles followed behind, with 25.95% and 22.24% during the respective periods. Peak-hour traffic also saw motorcycles as the predominant mode of transportation. Significant increases in flow were observed from 7:30 to 7:45 in the morning and 5:00 to 5:15 in the afternoon.
At Station 4, motorcycles represented the majority of traffic during both morning and afternoon off-peak hours, comprising 64.43% and 67.87% of the total volume, respectively. Tricycles followed, with 27.64% and 26.37% during the respective periods. Peak-hour traffic saw motorcycles comprising 66.88% in the morning and 73.24% in the afternoon. Significant increases in flow were observed during 9:45 to 10:00 in the morning off-peak hour and 4:30 to 4:45 in the afternoon peak hour. Motorcycles also dominated the traffic composition at Station 5 during morning and afternoon off-peak hours, representing 66.06% and 68.55% of the total volume, respectively. Tricycles followed, with 26.83% and 25.69% during the respective periods. Peak-hour traffic saw motorcycles comprising the majority of passing vehicles. The highest flow of vehicles during off-peak hours occurred from 3:45 to 4:00, while peak hours saw significant increases in flow between 5:15 to 5:30. At Station 6, motorcycles represented the majority of traffic during both morning and afternoon off-peak hours, comprising 66.92% and 72.41% of the total volume, respectively. Tricycles followed, with 26.31% and 22.39% during the respective periods. Peak-hour traffic also saw motorcycles as the predominant mode of transportation. Significant increases in flow were observed at 7:45 to 8:00 in the morning and 5:00 to 5:15 in the afternoon. Motorcycles were the dominant traffic mode at Station 7 during morning and afternoon off-peak hours, comprising 76.76% and 76.97% of the total volume, respectively. Tricycles followed, with 20.51% and 19.64% during the respective periods. Peak-hour traffic also saw motorcycles as the predominant mode of transportation. Significant increases in flow were observed at 7:30 to 7:45 in the morning and 5:15 to 5:30 in the afternoon.
Across all stations, motorcycles were consistently the most prevalent mode of transportation during peak and off-peak hours. Tricycles also significantly impacted traffic composition, particularly during off-peak hours. The observed patterns provide valuable insights for traffic management and infrastructure planning to ensure efficient transportation flow and address congestion issues in Odiongan.
Fig. 5a illustrates the morning peak hour traffic volume in Odiongan, with Station 1 recording the highest volume at 3223 vehicles, followed by Station 3 with 2909 vehicles. Stations 2, 5, and 7 fall within the dark green range, while Stations 4 and 6 are in the lightest red category. In Fig. 5b, depicting the afternoon peak hour traffic volume, Station 1 again has the highest volume with 3054 vehicles, followed by Station 4 with 2709 vehicles. Stations 3 and 6 fall in the mid-range, while Stations 2, 5, and 7 are in the green category.
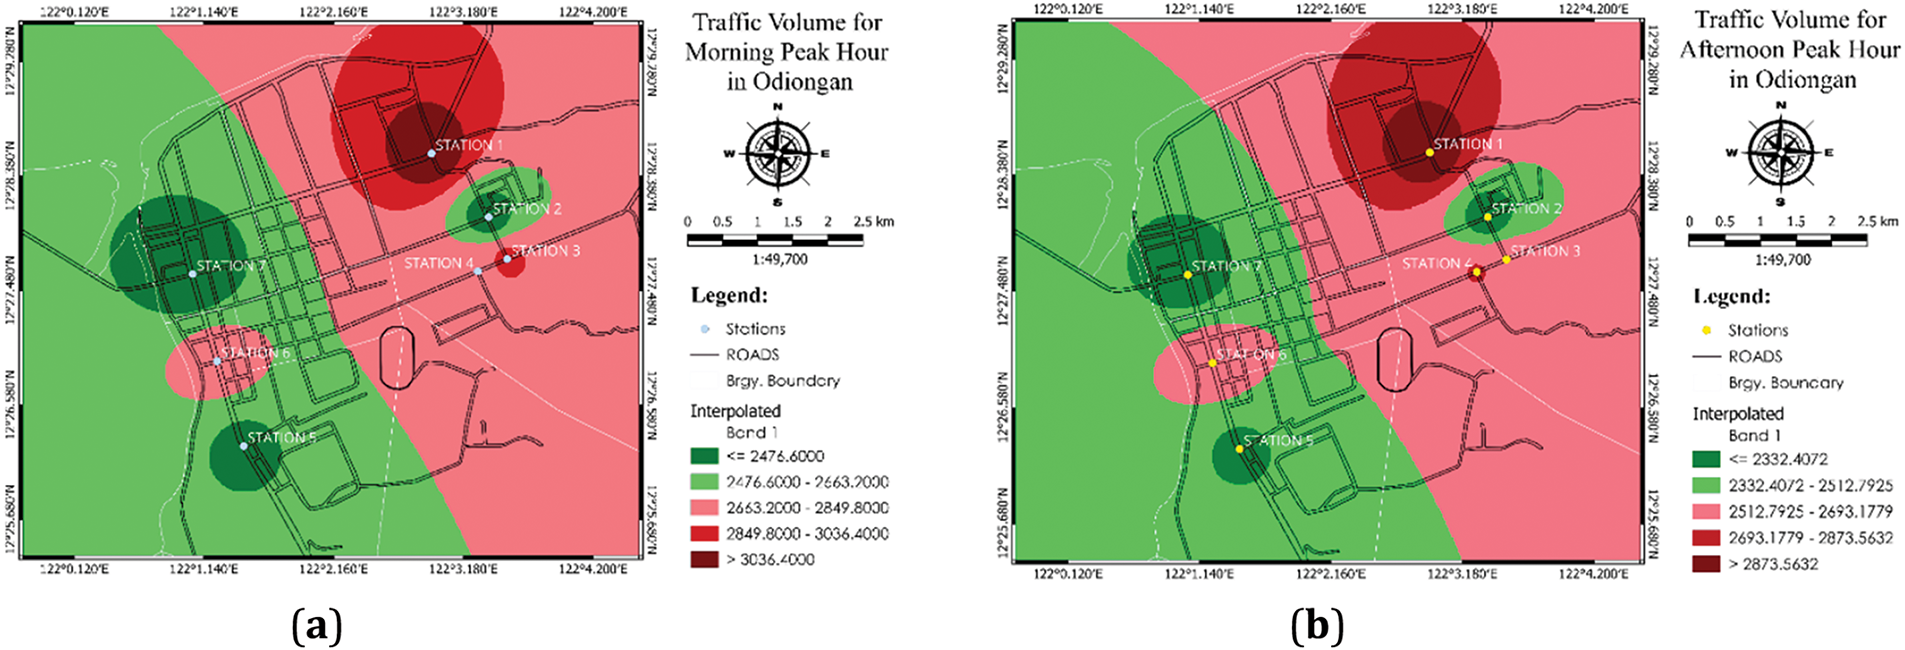
Figure 5: Interpolated maps of the morning (a) and afternoon (b) peak hour traffic volume
The LOS, a qualitative measure of traffic operational conditions, was evaluated across seven stations during morning and afternoon peak hours. Speed drops, and the delay and frequency of stops increase when a road carries traffic equal to its capacity. LOS in this study is determined based on the volume-capacity ratio, calculated by dividing the volume during peak hours in terms of PCU by the carriageway width. At Station 1, during the morning peak hour (Fig. 6a), analysis revealed Flow 2 and Flow 4 operating at LOS B, indicating a stable flow, while Flow 5 and Flow 6 maintained LOS C with speed restrictions. Conversely, Flow 1 and Flow 3 approached an unstable flow at LOS D. For the afternoon peak hour (Fig. 6b), Flow 3 exhibited the highest VCR and LOS D. Station 2 showed varied LOS patterns, with Flow 6 achieving LOS A during the morning peak hour (Fig. 6c), while Flow 3 approached instability at LOS D. In the afternoon (Fig. 6d), LOS A was observed in Flow 6, with Flow 3 at LOS D. Station 3 (Fig. 6e) demonstrated LOS C for multiple flows during both peak hours, with one flow reaching LOS A in the afternoon (Fig. 6f). At Station 4, morning peak hour analysis (Fig. 6g) indicated stable flows at LOS B, except for Flow 4 at LOS E and Flow 5 at LOS F. In the afternoon (Fig. 6h), Flow 4 and Flow 5 approached capacity at LOS E, while others remained stable. Station 5 (Fig. 6i,j) experienced mixed LOS conditions, with Flow 1 and Flow 4 at LOS A, Flow 2 near capacity at LOS E, and Flow 3 congested at LOS F during both peak hours. At Station 6, as shown in Fig. 6k,l, LOS ranged from stable (A, B, C) to unstable (D) across flows, with Flow 12 exhibiting instability. Finally, Station 7, shown in Fig. 6m,n, showcased predominantly LOS A during both peak hours, with Flow 1 and Flow 5 at LOS C. Figs. 1 to 6 provide detailed visual representations of the volume-capacity ratios and corresponding LOS for each station and peak hour. The results indicate that several intersections exhibit high congestion levels, with some locations reaching LOS E or F. While signalized intersection LOS criteria were not applied due to the current lack of traffic lights, the findings provide crucial data to justify future traffic signal installations or other traffic control measures.
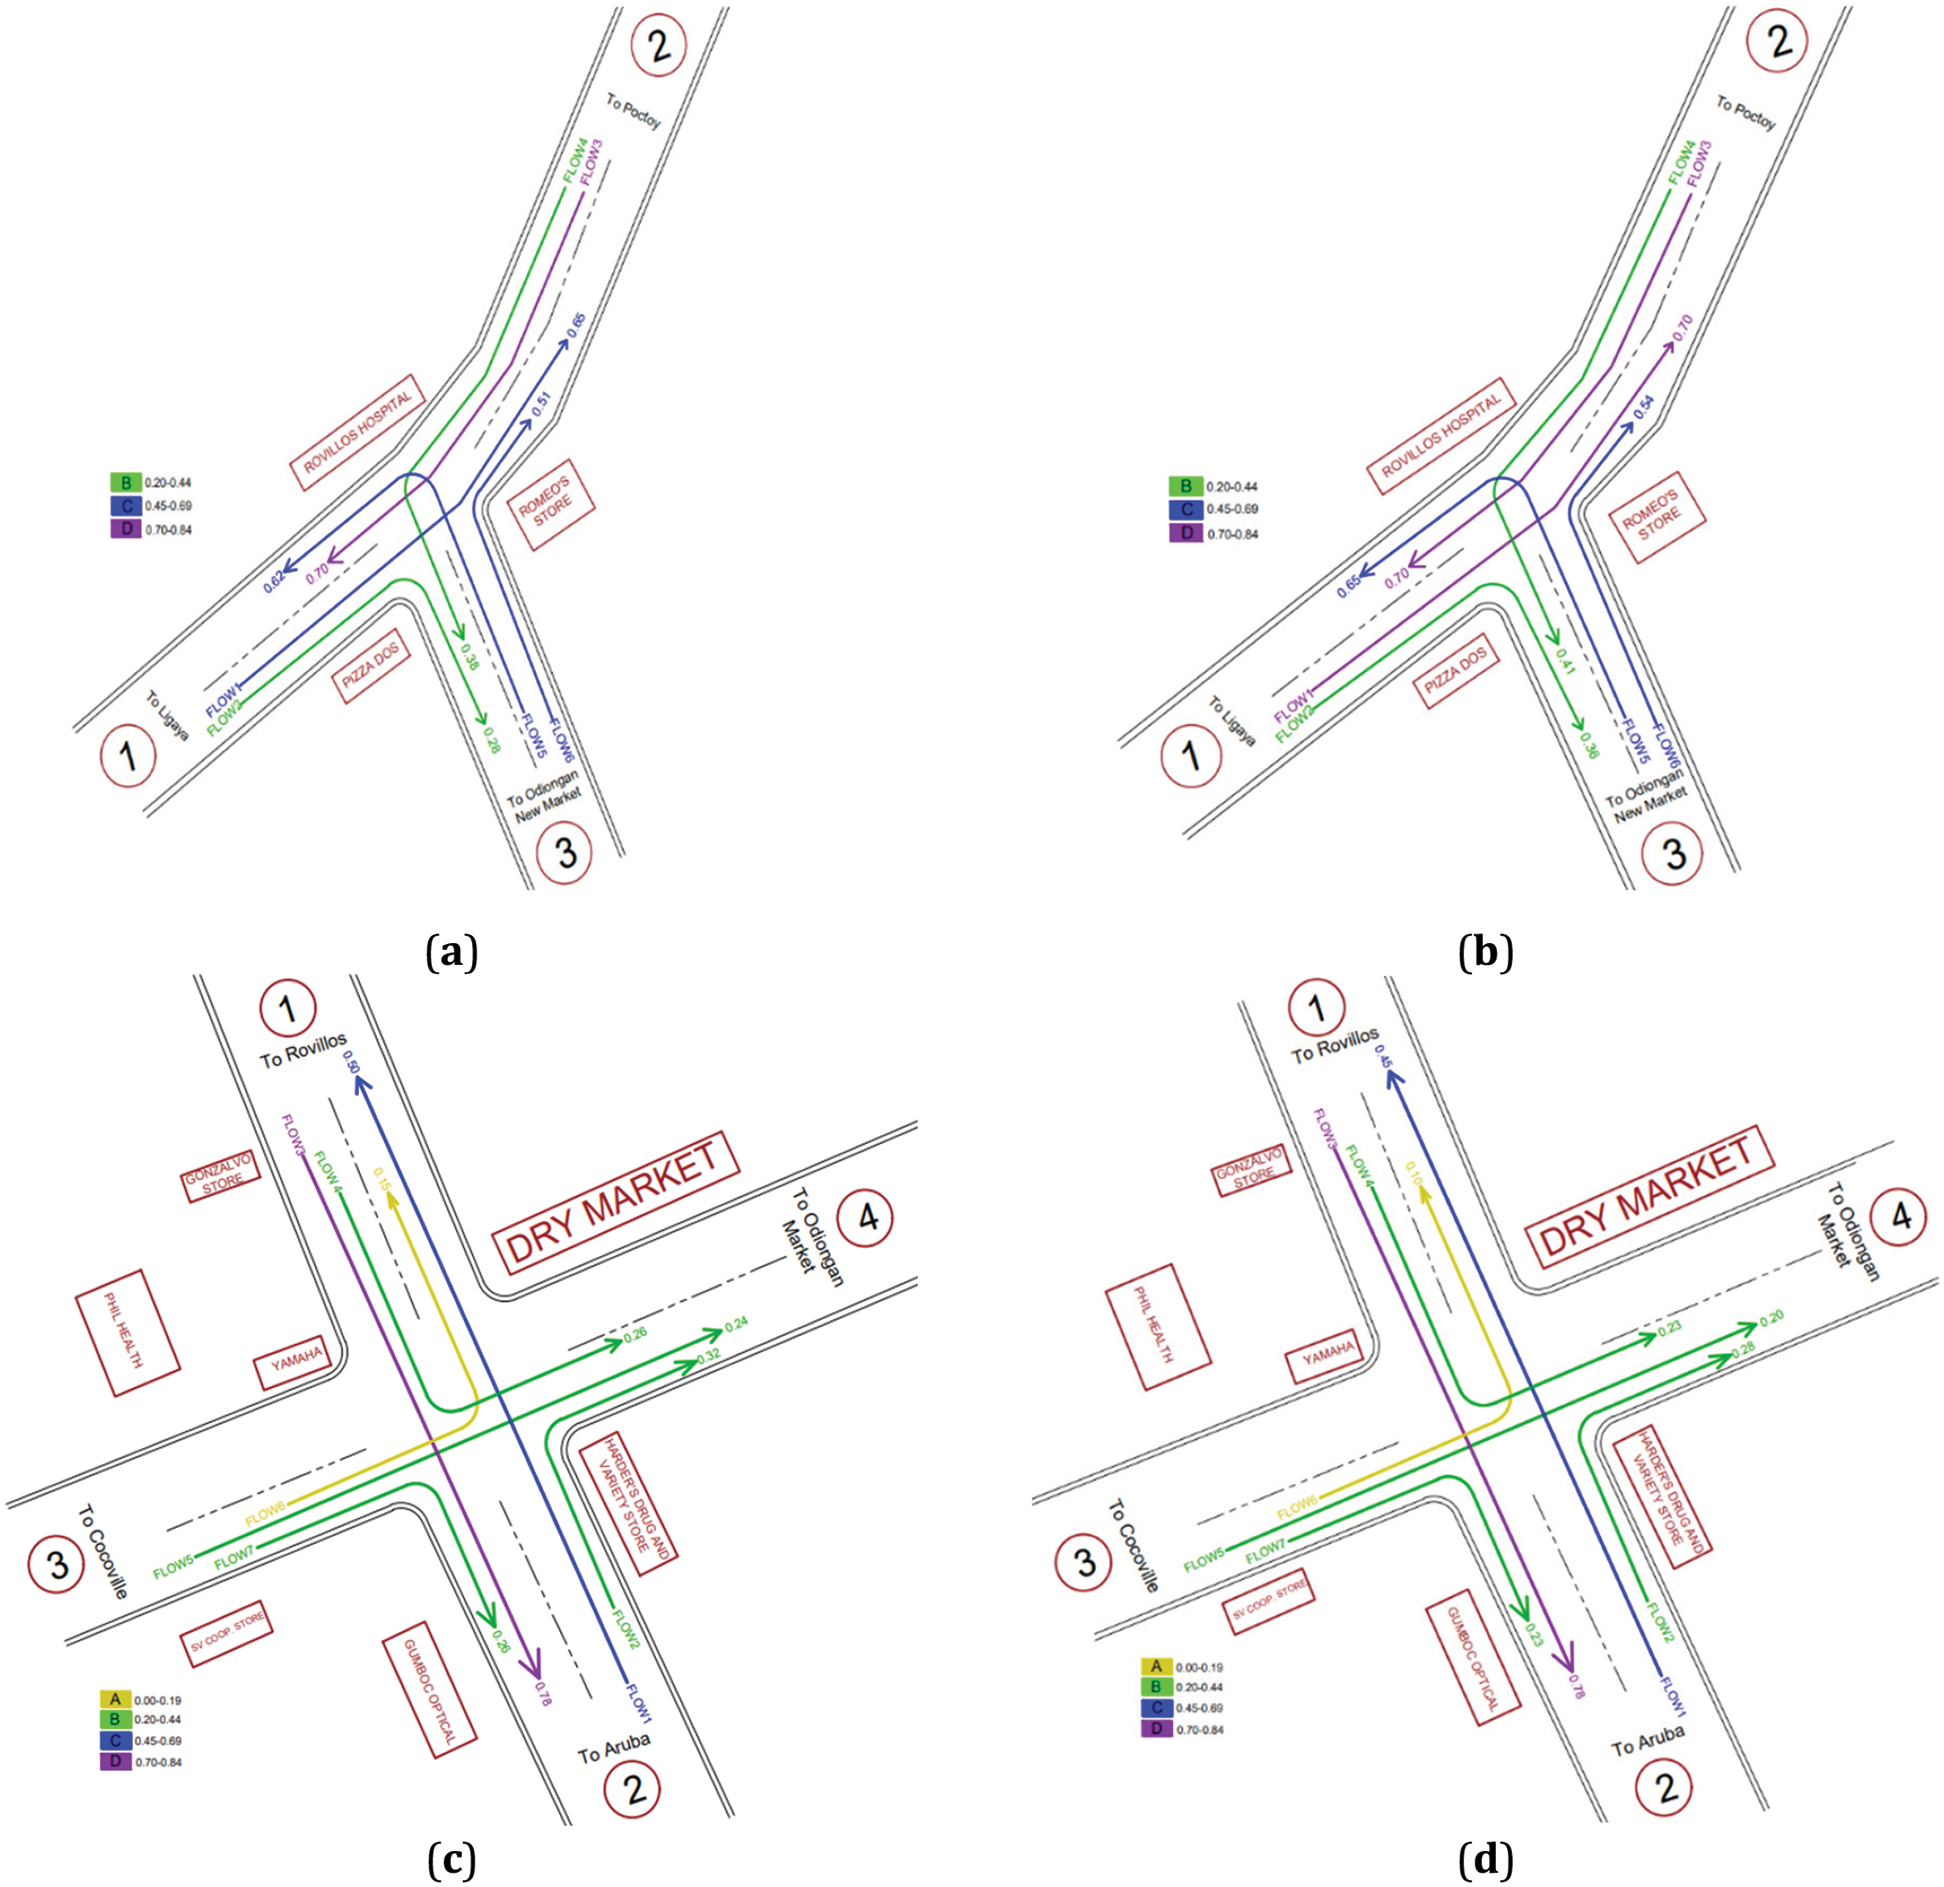
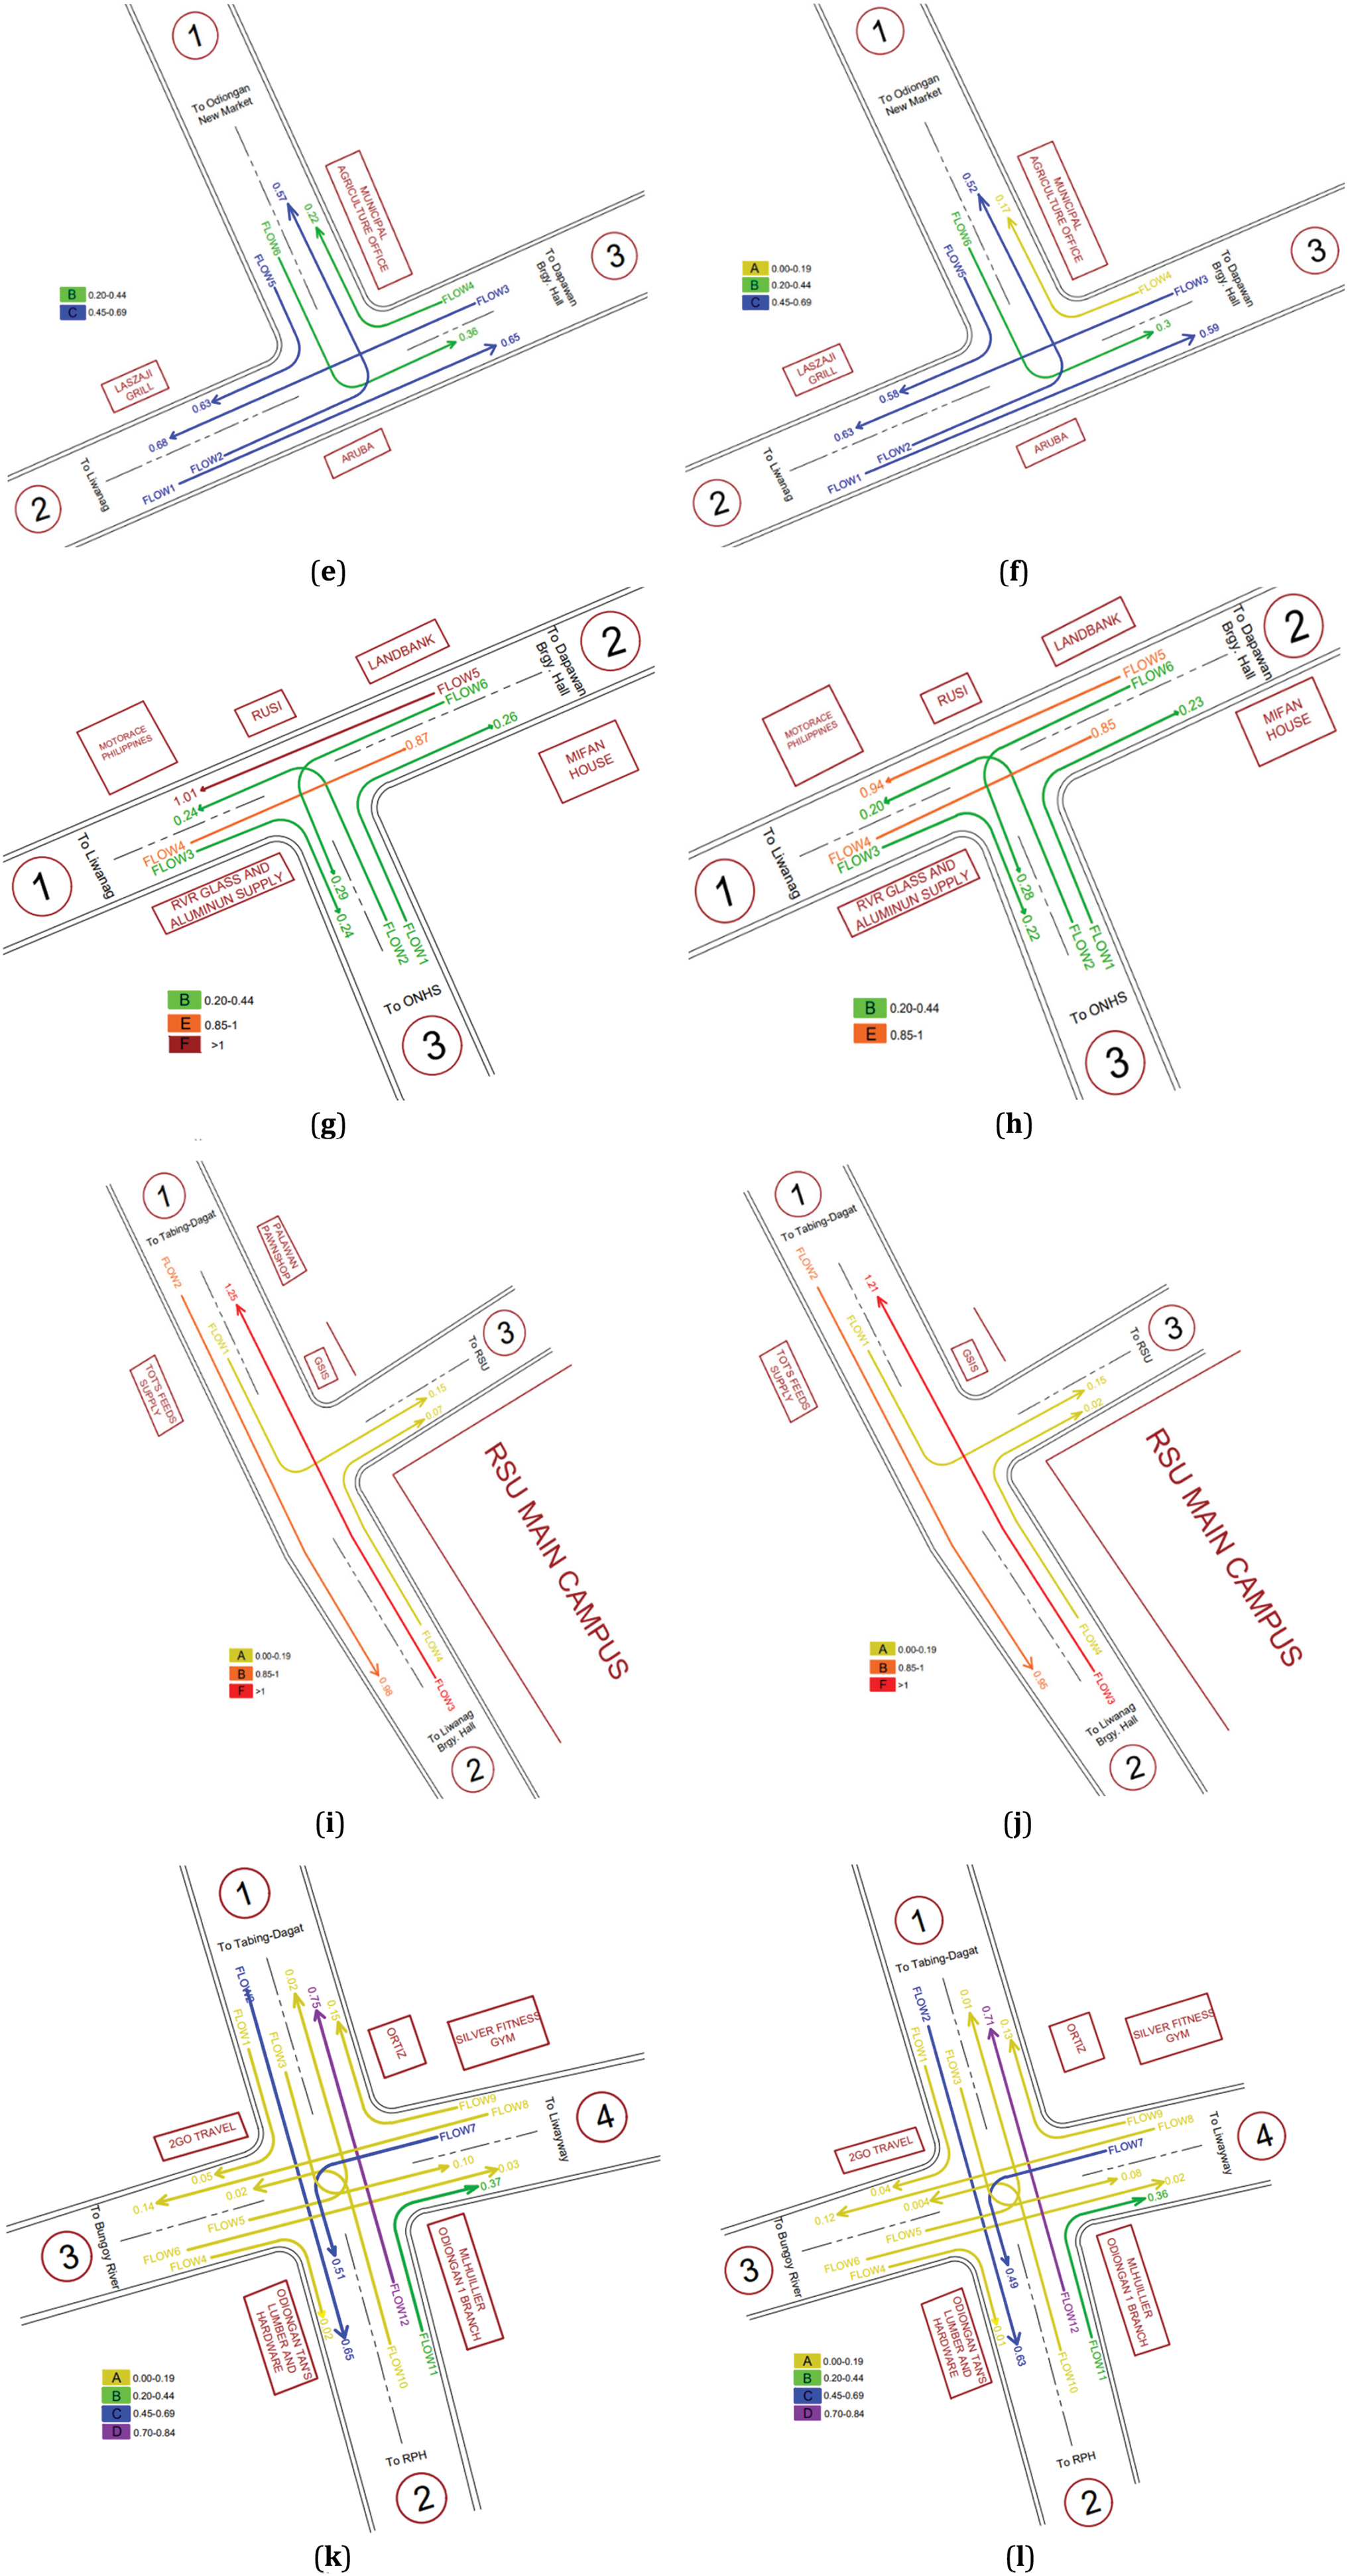
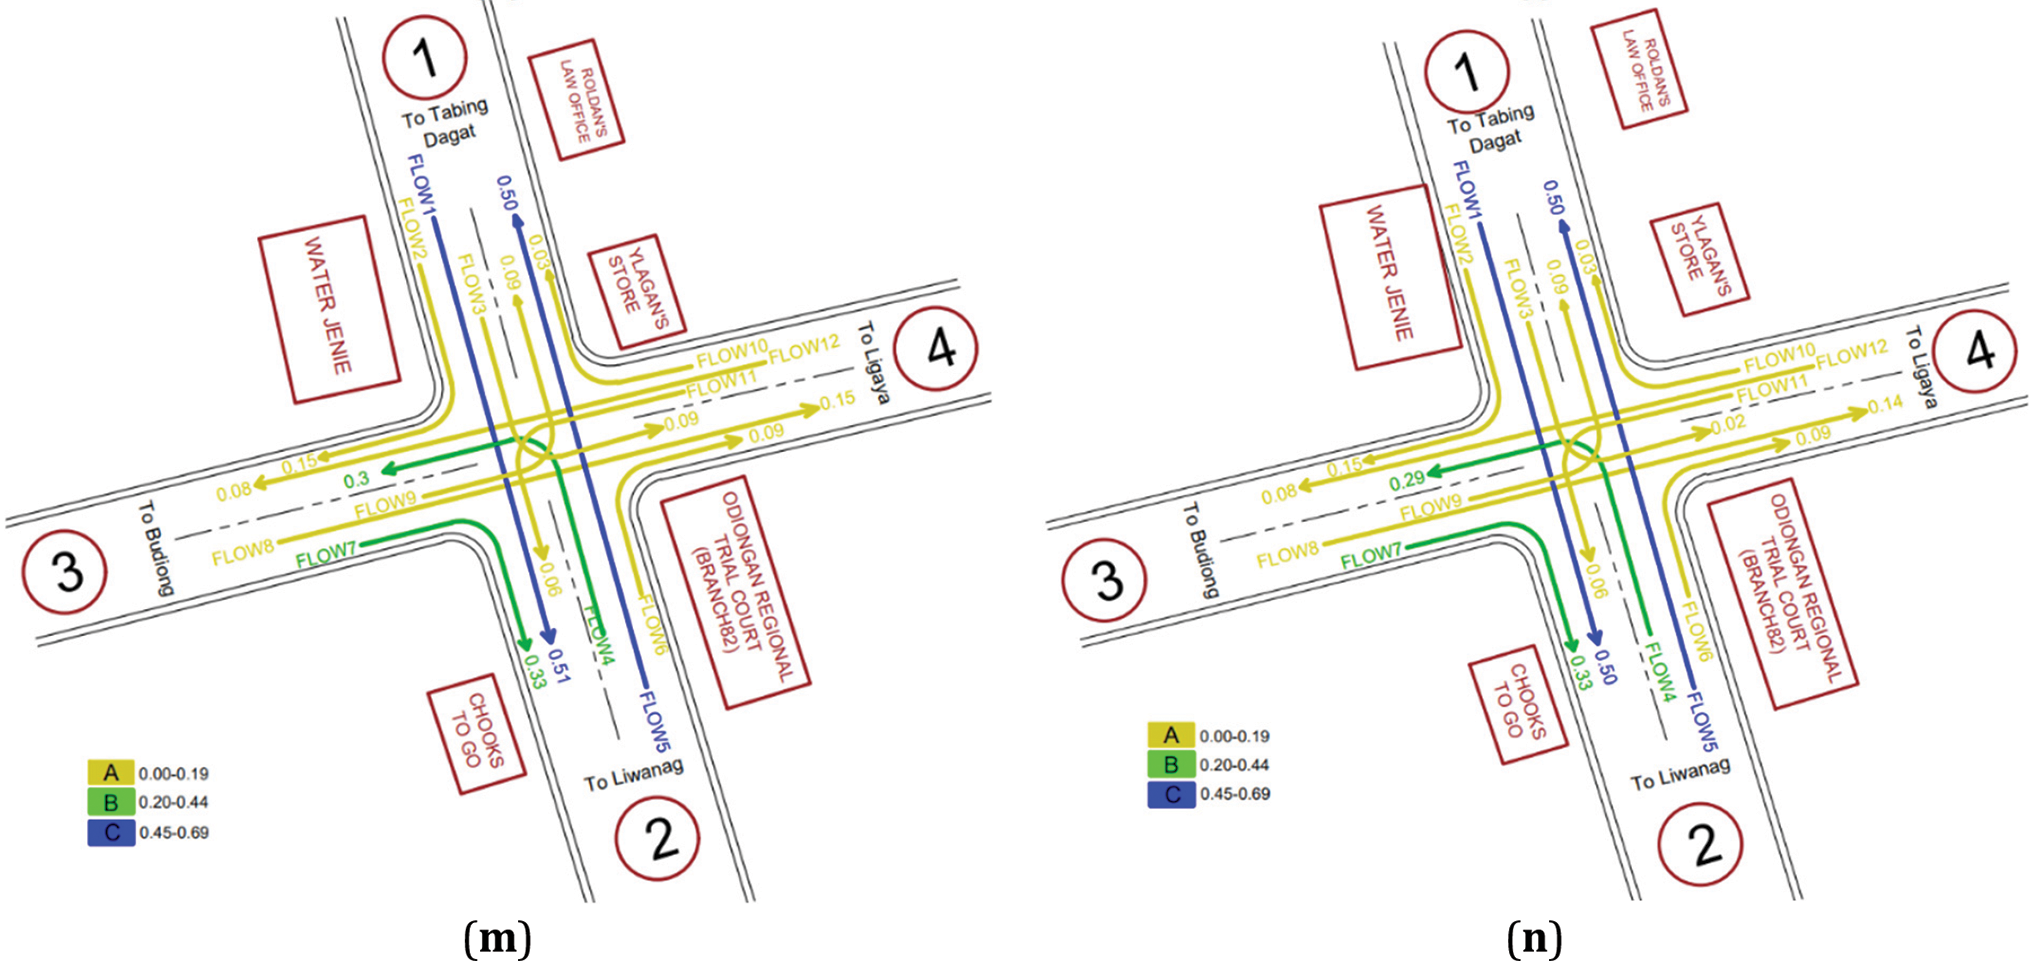
Figure 6: Level of service flow for the morning (a, c, e, g, i, k, and m) and afternoon (b, d, f, h, j, l, and n) peak hours for seven (7) identified station in the municipality
This study highlights the importance of a GIS-based approach in assessing road conditions and traffic dynamics in rural settings. While GIS has been widely used for urban transportation planning [39], its application in rural municipalities like Odiongan, Romblon, remains underexplored. Unlike urban areas, where traffic congestion is typically attributed to high vehicle density and signalized intersections [32], rural traffic is dominated by motorcycles and tricycles, which require different evaluation criteria. The study’s reliance on manual traffic surveys allowed for direct observations of traffic patterns but also introduced certain limitations that should be acknowledged in similar future assessments.
One of the key limitations of this study is data collection constraints, particularly in relation to manual traffic counting. Unlike automatic traffic data recorders used in large-scale urban studies [31], this study relied on human observations, which may introduce minor inaccuracies due to environmental factors such as poor lighting, inclement weather, and observer fatigue. Similar challenges have been documented in previous rural road assessments [9], where researchers have recommended using video-based traffic surveys to improve data accuracy.
Another challenge encountered was the classification of road conditions, particularly in unpaved areas. While the PASER system was effective in identifying surface degradation, the method has limitations in detecting subsurface weaknesses that could impact long-term road durability [4]. Future studies may consider integrating Ground Penetrating Radar (GPR) technology to supplement visual inspections, similar to the approach used in road maintenance planning in Europe [49]. While this study successfully assessed road quality and LOS using HCM-based unsignalized intersection criteria, additional factors such as seasonal weather variations, enforcement policies, and road maintenance efficiency could influence long-term traffic conditions. One critical missing element is the impact of heavy rainfall on road deterioration and traffic flow, which has been shown to exacerbate congestion and reduce road lifespan in similar studies [10]. The Philippines, being prone to typhoons and flooding, faces road degradation challenges that were not explicitly accounted for in this study. Future research should incorporate climate-related parameters to enhance the predictive accuracy of road deterioration models.
Additionally, governance and enforcement issues such as corruption in infrastructure projects and lack of standardized road maintenance policies are factors that could significantly affect road conditions over time [7]. In urban centers, effective traffic management systems can mitigate congestion [23], but in rural areas, the lack of institutional enforcement may lead to deterioration due to poor maintenance practices. To address this, future studies should integrate road maintenance governance metrics when evaluating long-term infrastructure resilience.
Compared to international studies in highly urbanized areas, this study’s focus on rural transportation challenges provides a novel contribution to the field of transportation planning in developing regions. Studies conducted in India [2] and Indonesia [42] have shown that rural road networks often suffer from low investment in maintenance and inadequate data collection methods, leading to inconsistent road quality assessments. This study aligns with similar GIS-based road monitoring efforts in Latin America and Africa, where remote sensing and spatial analytics have been used to prioritize rural road rehabilitation [20]. Additionally, most urban studies analyzing LOS and traffic congestion rely on signalized intersection analysis [28]. In contrast, this study focused on unsignalized intersections and volume-to-capacity ratios, which are more suitable for rural settings. A study by Tufajjal Hossain et al. (2019) [26] in Bangladesh emphasized the importance of assessing traffic congestion levels in developing countries, using methodologies similar to this study to analyze traffic flow and density at major intersections. However, unlike urban-focused studies, rural municipalities like Odiongan lack structured traffic management tools, requiring a different approach to assess road performance and congestion levels.
Furthermore, findings from European and Middle Eastern traffic studies [23,34,50] highlight the impact of urbanization on traffic congestion, showing that high vehicle density and road capacity expansion strategies significantly influence LOS. However, in rural areas, factors such as seasonal variations, enforcement policies, and poor road maintenance play a more critical role in traffic performance, necessitating an approach tailored to local conditions. The comparison with global studies underscores the importance of developing customized traffic assessment frameworks for rural areas, as applying urban-centric models may lead to misinterpretations of road capacity and congestion levels in non-urban environments.
This study lays the groundwork for future research by identifying key areas for improvement in rural road and traffic management. One of the most significant areas for advancement is the automation of data collection. The use of camera-based traffic monitoring, AI-powered object detection, and automated road distress recognition [16] can enhance the accuracy of road and traffic assessments in rural settings, reducing human error and improving efficiency. Additionally, given the impact of extreme weather events in the Philippines, integrating hydrological and meteorological data in road condition modeling will provide better long-term forecasts of road deterioration. Climate-responsive road assessment models can help in identifying vulnerabilities and implementing proactive measures to improve road resilience.
Beyond technical advancements, sociopolitical factors also play a crucial role in road management. Addressing issues such as local government maintenance inefficiencies and corruption in road construction projects is essential for ensuring sustainable road development [7]. Transparent governance, accountability measures, and proper allocation of resources are necessary to maintain road quality and efficiency over time. Furthermore, conducting comparative studies across rural and urban areas will help assess road management effectiveness in different settings. Cross-regional comparisons can provide valuable insights for policymakers to develop tailored traffic management solutions suited to the unique challenges of both urban and rural areas. By addressing these key areas, future research can contribute to more effective, data-driven, and sustainable transportation planning for rural communities
The comprehensive assessment of road conditions and traffic flow in the municipality of Odiongan provides valuable insights for transportation management and infrastructure planning. Using the PASER method, road condition mapping identified areas needing routine maintenance and rehabilitation, particularly in barangays such as Liwayway, Ligaya, Tabing-Dagat, Liwanag, and Dapawan. These findings emphasize the importance of proactive maintenance strategies to preserve road quality and prevent further deterioration. Additionally, traffic assessments revealed varying LOS across seven stations, with intersections in Stations 1, 4, and 5 showing poor LOS, indicative of congestion. To address this, recommendations include implementing signalized intersections, deploying traffic enforcers during peak hours, and exploring advanced methods for road conditions and traffic assessments in future research endeavors.
The integration of GIS provided a comprehensive and visual assessment of road conditions and traffic dynamics in the municipality of Odiongan. GIS mapping highlighted priority areas for maintenance and rehabilitation, ensuring efficient resource allocation. Traffic analysis revealed congestion challenges, particularly at key intersections, with LOS values indicating the need for traffic flow improvements. This study demonstrates the effectiveness of GIS as a tool for enhancing transportation planning and supports its continued application in developing sustainable infrastructure solutions for rural areas. This study highlights the need for enhanced traffic management strategies in Odiongan. While signalized intersections were not evaluated due to their absence, the results provide a critical basis for planning and implementing traffic control measures, ensuring sustainable and efficient road use in rural settings.
Efforts to improve transportation infrastructure and management are crucial for enhancing safety and efficiency in Odiongan. Local authorities can prioritize maintenance efforts and implement targeted traffic interventions by utilizing the study results for informed decision-making. This proactive approach will not only alleviate current congestion issues but also contribute to the long-term sustainability of the transportation network. Furthermore, incorporating advanced methodologies and forecasting techniques in future research endeavors will ensure that transportation planning remains responsive to evolving traffic patterns and infrastructure needs, ultimately fostering a safer and more accessible environment for residents and commuters.
Acknowledgement: The authors express their gratitude to the editors and reviewers for their valuable feedback and recommendations.
Funding Statement: The authors did not receive any specific funding for this study.
Author Contributions: The authors confirm contribution to the paper as follows: Conceptualization, Jerome Gacu and Raymond Jay Severo; methodology, Jerome Gacu, Raymond Jay Severo and Mary Joy Fruelda; software, Jerome Gacu, Mary Joy Fruelda and Shandra Lairene Fampulme; validation, Jerome Gacu, Raymond Jay Severo and Mary Joy Fruelda; formal analysis, Reymond Jay Severo, Jerome Gacu and Mary Joy Fruelda; investigation, Shandra Lairene Fampulme, Faith Fontamillas, Jemelene Lilang, Allan Fruelda III, Isagani Madla, Crisnel Love Factor and Kio Alyson Rogero; resources, Jerome Gacu, Raymond Jay Severo and Isagani Madla; data curation, Shandra Lairene Fampulme, Faith Fontamillas, Jemelene Lilang, Allan Fruelda III, Isagani Madla, Crisnel Love Factor and Kio Alyson Rogero; writing—original draft Jerome Gacu and Mary Joy Fruelda; writing—review and editing, Jerome Gacu; visualization, Jerome Gacu and Raymond Jay Severo; supervision, Jerome Gacu and Raymond Jay Severo; project administration, Jerome Gacu, Mary Joy Fruelda and Raymond Jay Severo; funding acquisition, Jerome Gacu and Raymond Jay Severo. All authors reviewed the results and approved the final version of the manuscript.
Availability of Data and Materials: The authors agreed to turn over the necessary data and study results in the Municipality of Odiongan, Romblon, Philippines.
Ethics Approval: Not applicable.
Conflicts of Interest: The authors declare no conflicts of interest to report regarding the present study.
References
1. Engström R. The roads’ role in the freight transport system. Transp Res Procedia. 2016;14(1):1443–52. doi:10.1016/j.trpro.2016.05.217. [Google Scholar] [CrossRef]
2. Lokesha MN, Mahesha M. Impact of road infrastructure on agricultural development and rural road infrastructure development programmes in India. Int J Humanit Soc Sci Invent. 2016;5:1–7. [Google Scholar]
3. Mansourmoghaddam M, Ghafarian Malamiri HR, Arabi Aliabad F, Fallah Tafti M, Haghani M, Shojaei S. The separation of the unpaved roads and prioritization of paving these roads using UAV images. Air Soil Water Res. 2022;15(2):438. doi:10.1177/11786221221086285. [Google Scholar] [CrossRef]
4. Shtayat A, Moridpour S, Best B, Shroff A, Raol D. A review of monitoring systems of pavement condition in paved and unpaved roads. J Traffic Transp Eng (English Ed). 2020;7(5):629–38. doi:10.1016/j.jtte.2020.03.004. [Google Scholar] [CrossRef]
5. Ding T, Sun L, Chen Z. Optimal strategy of pavement preventive maintenance considering life-cycle cost analysis. Procedia-Soc Behav Sci. 2013;96:1679–85. doi:10.1016/j.sbspro.2013.08.190. [Google Scholar] [CrossRef]
6. Tayabji S. Impact of construction quality on durability of concrete pavements. In: FIHP Conference; 2016; Puerto Iguazu, Argentina. doi:10.13140/RG.2.1.4424.6647. [Google Scholar] [CrossRef]
7. Hatmoko JUD, Setiadji BH, Wibowo MA. Investigating causal factors of road damage: a case study. MATEC Web Conf. 2019;258:02007. doi:10.1051/matecconf/201925802007. [Google Scholar] [CrossRef]
8. Sulistyaningrum DR, Putri SAM, Setiyono B, Ahyudanari E, Oranova D. Classification of damaged road types using multiclass support vector machine (SVM). J Phys Conf Ser. 2021;1821(1):012048. doi:10.1088/1742-6596/1821/1/012048. [Google Scholar] [CrossRef]
9. Stefanus S, Widodo S, Mukti ET, Erwan K, Azwansyah H. Analysis of road damage conditions on the surface layer using PCI (Pavement Condition Index) method (Case Study: Rasau Jaya Road, Kubu Raya Regency, West Kalimantan Province). J Tek Sipil. 2022;22(2):95. doi:10.26418/jtst.v22i2.59394. [Google Scholar] [CrossRef]
10. Ferlisi S, Marchese A, Peduto D. Quantitative analysis of the risk to road networks exposed to slow-moving landslides: a case study in the Campania region (southern Italy). Landslides. 2021;18(1):303–19. doi:10.1007/s10346-020-01482-8. [Google Scholar] [CrossRef]
11. Adzim F, Lubis Z, Damara B. The study on utilization waste tire seeds as amixture of AC-WC asphalt on road pavement. Civilla J Tek Sipil Univ Islam Lamongan. 2021;6(2):257. doi:10.30736/cvl.v6i2.717. [Google Scholar] [CrossRef]
12. Regin J, Regidor F, Damaso RA, Rose A, Bilugan V. Assessment of traffic inputs to pavement design and rehabilitation. Philipp Eng J Pej. 2005;26:1–12. [Google Scholar]
13. Singh RP, Tekwani H, Joshi B, Sudhakaran P, Singh J. Study of traffic volume and its safety measurement at dadabari circle, career point university. Kota Int J Curr Eng Technol. 2018;8(1):1–4. doi:10.14741/ijcet.v8i01.10892. [Google Scholar] [CrossRef]
14. Pinatt JM, Chicati ML, Ildefonso JS, Filetti CRGD arc. Evaluation of pavement condition index by different methods: case study of Maringá. Brazil Transp Res Interdiscip Perspect. 2020;4(1):100100. doi:10.1016/j.trip.2020.100100. [Google Scholar] [CrossRef]
15. Karim FMA, Rubasi KAH, Saleh AA. The road pavement condition index (PCI) evaluation and maintenance: a case study of yemen. Organ Technol Manag Constr an Int J. 2016;8(1):1446–55. doi:10.1515/otmcj-2016-0008. [Google Scholar] [CrossRef]
16. Cao MT, Tran QV, Nguyen NM, Chang KT. Survey on performance of deep learning models for detecting road damages using multiple dashcam image resources. Adv Eng Informatics. 2020;46:101182. doi:10.1016/j.aei.2020.101182. [Google Scholar] [CrossRef]
17. Li W, Burrow M, Li Z. Automatic road condition assessment by using point laser sensor. In: Proceedings of the IEEE Sensors; 2018; New Delhi, India. p. 1–4. doi:10.1109/ICSENS.2018.8589855. [Google Scholar] [CrossRef]
18. Vaitkus A, Čygas D, Motiejūnas A, Pakalnis A, Miškinis D. Improvement of road pavement maintenance models and technologies. Balt J Road Bridg Eng. 2016;11(3):242–9. doi:10.3846/bjrbe.2016.28. [Google Scholar] [CrossRef]
19. Sarmiento J-A. Pavement distress detection and segmentation using YOLOv4 and DeepLabv3 on pavements in the philippines. arXiv:2103.06467. 2021. [Google Scholar]
20. Espinet X, Wang W, Mehndiratta S. Low-budget techniques for road network mapping and road condition assessment that are accessible to transport agencies in developing countries. Transp Res Rec. 2017;2634(1):1–7. doi:10.3141/2634-01. [Google Scholar] [CrossRef]
21. Saha P, Nguyen T. Priority-based optimisation model for developing CIP using PASER for city roads: a case study. Int J Pavement Eng. 2022;23(8):2703–9. doi:10.1080/10298436.2020.1869238. [Google Scholar] [CrossRef]
22. Jaysawal D, Verma S, Nigam S. Traffic assessment of an intersection and its signal design using webster’s model: a case study of Ghatia Azam Khan Intersection in Agra city. Tech Int J Eng Res. 2022;9:52–62. [Google Scholar]
23. Su Y, Liu X, Li X, Oh K. Research on traffic congestion based on system dynamics: the case of chongqing. China Complexity. 2020;2020(11):1–13. doi:10.1155/2020/6123896. [Google Scholar] [CrossRef]
24. Kumar M, Kumar K, Das P. Study on road traffic congestion: a review. Recent Trends Commun Electron. 2021;230–40. doi:10.1201/9781003193838. [Google Scholar] [CrossRef]
25. Kulev AV, Kulev MV, Kuleva NS. Basic approaches to the choice of methods of passenger traffic flow analysis. IOP Conf Ser Mater Sci Eng. 2020;709(3):1–7. doi:10.1088/1757-899X/709/3/033071. [Google Scholar] [CrossRef]
26. Tufajjal Hossain M. Assessment of traffic congestion by traffic flow analysis in pabna town. Am J Traffic Transp Eng. 2019;4(3):75. doi:10.11648/j.ajtte.20190403.11. [Google Scholar] [CrossRef]
27. Streets JRB, De Oro C, Albert J, Añana U, Calma KA, Flores CM, et al. A traffic congestion study of unsignalized intersections along Yacapin-Capt. Vicente Roa, Yacapin-Osmena, J.R. Borja-Capt. Vicente Roa and J.R. Borja-Osmeña Streets in Cagayan de Oro City. J Eastern Asia Soc Transport Stud. 2015;11:1899–918. doi:10.11175/easts.11.1899. [Google Scholar] [CrossRef]
28. Aquino CJT, Magpayo RR, Ruiz KJO, Cruz JCL. Traffic congestion analysis of molino road and daang hari road intersection and application of continuous flow intersection (CFI). Antorcha. 2019;7:43–7. [Google Scholar]
29. Indhiradevi P, Saravanakumar P, Varsha R, Shahithya S, Naveen Prabhu S. A review on smart traffic management system. In: IOP Conference Series: Materials Science and Engineering, International Conference on Chemical, Mechanical and Environmental Sciences (ICCMES 2021); 2021 Mar 25–26;Coimbatore,India. doi:10.1088/1757-899X/1145/1/012090. [Google Scholar] [CrossRef]
30. Hao N, Feng Y, Zhang K, Tian G, Zhang L, Jia H. Evaluation of traffic congestion degree: an integrated approach. Int J Distrib Sens Netw. 2017;13(7):155014771772316. doi:10.1177/1550147717723163. [Google Scholar] [CrossRef]
31. Pandey A, Biswas S. Assessment of level of service on urban roads: a revisit to past studies. Adv Transp Stud. 2022;57:49–70. doi:10.53136/97912218000674. [Google Scholar] [CrossRef]
32. Biswas S, Singh B, Saha A. Assessment of level-of-service on urban arterials: a case study in kolkata metropolis. Int J Traffic Transp Eng. 2016;6(3):303–12. doi:10.7708/ijtte.2016.6(3).06. [Google Scholar] [CrossRef]
33. Babit R. Level of service concept in urban roads. Int J Eng Sci Invent Res Dev. 2016;III:44. [Google Scholar]
34. Gireesh Kumar P, Ranjan Samal S, Prasanthi L, Bhavitha V, Mounika Devi J. Level of service of urban and rural roads- a case study in bhimavaram. IOP Conf Ser Mater Sci Eng. 2020;1006(1):012018. doi:10.1088/1757-899X/1006/1/012018. [Google Scholar] [CrossRef]
35. Gacu JG, Garcia JD, Fetalvero EG, Catajay-Mani MP, Monjardin CEF, Power C. A comprehensive resource assessment for wind power generation on the rural island of sibuyan, philippines. Energies. 2024;17(9):1–21. doi:10.3390/en17092055. [Google Scholar] [CrossRef]
36. Garcia J, Gacu J, Lawrence M. Suitability analysis for solar PV farm installation using GIS and analytical hierarchy process (AHP) in Simara Island, Province of Romblon. Philippines E3S Web Conf. 2024;473(16):01013. doi:10.1051/e3sconf/202447301013. [Google Scholar] [CrossRef]
37. Gacu JG, Garcia JD, Fetalvero EG, Catajay-Mani MP, Monjardin CEF. Suitability analysis using GIS-based analytic hierarchy process (AHP) for solar power exploration. Energies. 2023;16(18):6724. doi:10.3390/en16186724. [Google Scholar] [CrossRef]
38. Obafemi AA, Eludoyin O, Richard Opara D. Road network assessment in trans-amadi. Port. 2011;8:257–64. [Google Scholar]
39. Ahmadzai F, Rao KML, Ulfat S. Assessment and modelling of urban road networks using Integrated Graph of Natural Road Network (a GIS-based approach). J Urban Manag. 2019;8(1):109–25. doi:10.1016/j.jum.2018.11.001. [Google Scholar] [CrossRef]
40. Beto MZ. Applying GIS to improve the efficiency of highway pavement maintenance management system-case study on hosanna-doyogena-durame mazoriya. Sci J Eng Technol. 2021;1:1–11. [Google Scholar]
41. Muthoni Njeru E, Imwati A. GPS & GIs in road accident mapping and emergency response management. IOSR J Environ Sci Toxicol Food Technol. 2016;10(10):75–86. doi:10.9790/2402-1010017586. [Google Scholar] [CrossRef]
42. Praditya N, Indrayani I, Herius A, Kosim K, Peryoga T, Anggoro M. Identification of road condition survey results on the making of map of palembang city road network based on GIS. In: Proceedings of the 5th FIRST T1 T2 2021 International Conference (FIRST-T1-T2 2021); 2022. p. 188–92. doi:10.2991/ahe.k.220205.032. [Google Scholar] [CrossRef]
43. Cruz JF, Castro JT. Developing a low-cost road roughness survey methodology using smartphones and geographic information system (GIS). In: Proceedings of the 22nd Annual Conference of the Transportation Science Society of the Philippines; 2014; Iloilo City, Philippines: Transportation Science Society of the Philippines. [cited 2025 Feb 10]. Available from: https://www.researchgate.net/publication/324586130. [Google Scholar]
44. Gacul L-A, Ferrancullo D, Gallano R, Fadriquela KJ, Mendez KJ, Morada JR, et al. GIS-based identification of flood risk zone in a rural municipality using fuzzy analytical hierarchy process (FAHP). Revue Internationale de Géomatique. 2024;33(1):295–320. doi:10.32604/rig.2024.055085. [Google Scholar] [CrossRef]
45. Booma S, Padmanabhan V. Analysis of traffic flow using Q-GIS (Case study at Vandalur Junction, Chennai). Int J Innov Res Sci Eng Technol. 2017; 5225–31. doi:10.15680/IJIRSET.2017.0604017. [Google Scholar] [CrossRef]
46. Budzyński M, Kustra W, Okraszewska R, Jamroz K, Pyrchla J. The use of GIS tools for road infrastructure safety management. E3S Web Conf. 2018;26(3):00009. doi:10.1051/e3sconf/20182600009. [Google Scholar] [CrossRef]
47. Gacu JG,Monjardin CEF, Senoro DB,Tan FJ. Flood risk assessment using GIS-based analytical hierarchy process in the municipality of Odiongan, Romblon, Philippines. Appl Sci. 2022;12(19):9456. doi:10.3390/app12199456. [Google Scholar] [CrossRef]
48. Gacu JG, Monjardin CEF, de Jesus KLM, Senoro DB. GIS-based risk assessment of structure attributes in flood zones of odiongan, romblon, Philippines. Buildings. 2023;13(2):506. doi:10.3390/buildings13020506. [Google Scholar] [CrossRef]
49. Solla M, Pérez-Gracia V, Fontul S. Review of GPR application on transport infrastructures: troubleshooting and best practices. Remote Sens. 2021;13(4):1–5. doi:10.3390/rs13040672. [Google Scholar] [CrossRef]
50. Garmei S, Kashi E. Calibration of Aimsun roundabout model: pedestrian and vehicles flow. Cogent Eng. 2019;6(1):09. doi:10.1080/23311916.2019.1686796. [Google Scholar] [CrossRef]
Cite This Article
 Copyright © 2025 The Author(s). Published by Tech Science Press.
This work is licensed under a Creative Commons Attribution 4.0 International License , which permits unrestricted use, distribution, and reproduction in any medium, provided the original work is properly cited.
 Downloads
 Citation Tools