
 Submit a Paper
 Propose a Special lssue
 Open Access
ARTICLE

Detection, Analysis, and Mapping of Potential Groundwater Areas in the Oued Lakhdar Watershed (Morocco): Using GIS and AHP Techniques
Landscape Dynamics, Risks and Heritage, University of Sultan of Moulay Slimane, Beni Mellal, 23000, Morocco
* Corresponding Author: Elhoucein Layati. Email:
(This article belongs to the Special Issue: Advancements in Geospatial Methods and Technologies for Sustainable Built Environment and Engineering)
Revue Internationale de Géomatique 2025, 34, 277-300. https://doi.org/10.32604/rig.2025.063846
Received 25 January 2025; Accepted 21 April 2025; Issue published 30 May 2025
 View Full Text
 Download PDF
Abstract
Awareness of the impact of climate change, urbanization, population growth, and anthropogenic pressure on surface waters has led to the need for specialized studies on groundwater potential. Groundwater is an important source of freshwater, particularly in regions where surface water is scarce. With climate change, the need to rely on these waters to cope with water shortages and rising demand is becoming increasingly apparent. Remote sensing, the Analytic Hierarchy Process (AHP), and the Geographic Information System (GIS) are advanced spatial tools used in this study to assess groundwater potential in the Oued Lakhdar watershed, which covers an area of 1638 km2. Seven explanatory factors were selected: rainfall, lithology, soil type, slope, land use, drainage density, and lineament density. The map obtained was validated based on the receiver operating characteristic (ROC) curve and area under the curve (AUC), giving an efficiency of 70.20%. Five classes were defined for the groundwater potential map in this basin: 12.28% of the basin area was classified as very favorable, 25.68% as favorable, 17.71% as average, 26.23% as low, and 18.09% as very low. The Regional Directorate of Agriculture in Azilal and the Oum El Rabia Water Basin Agency in Beni Mellal should use these findings to inform decision-making in land use planning and groundwater management in the Oued Lakhdar watershed.Keywords
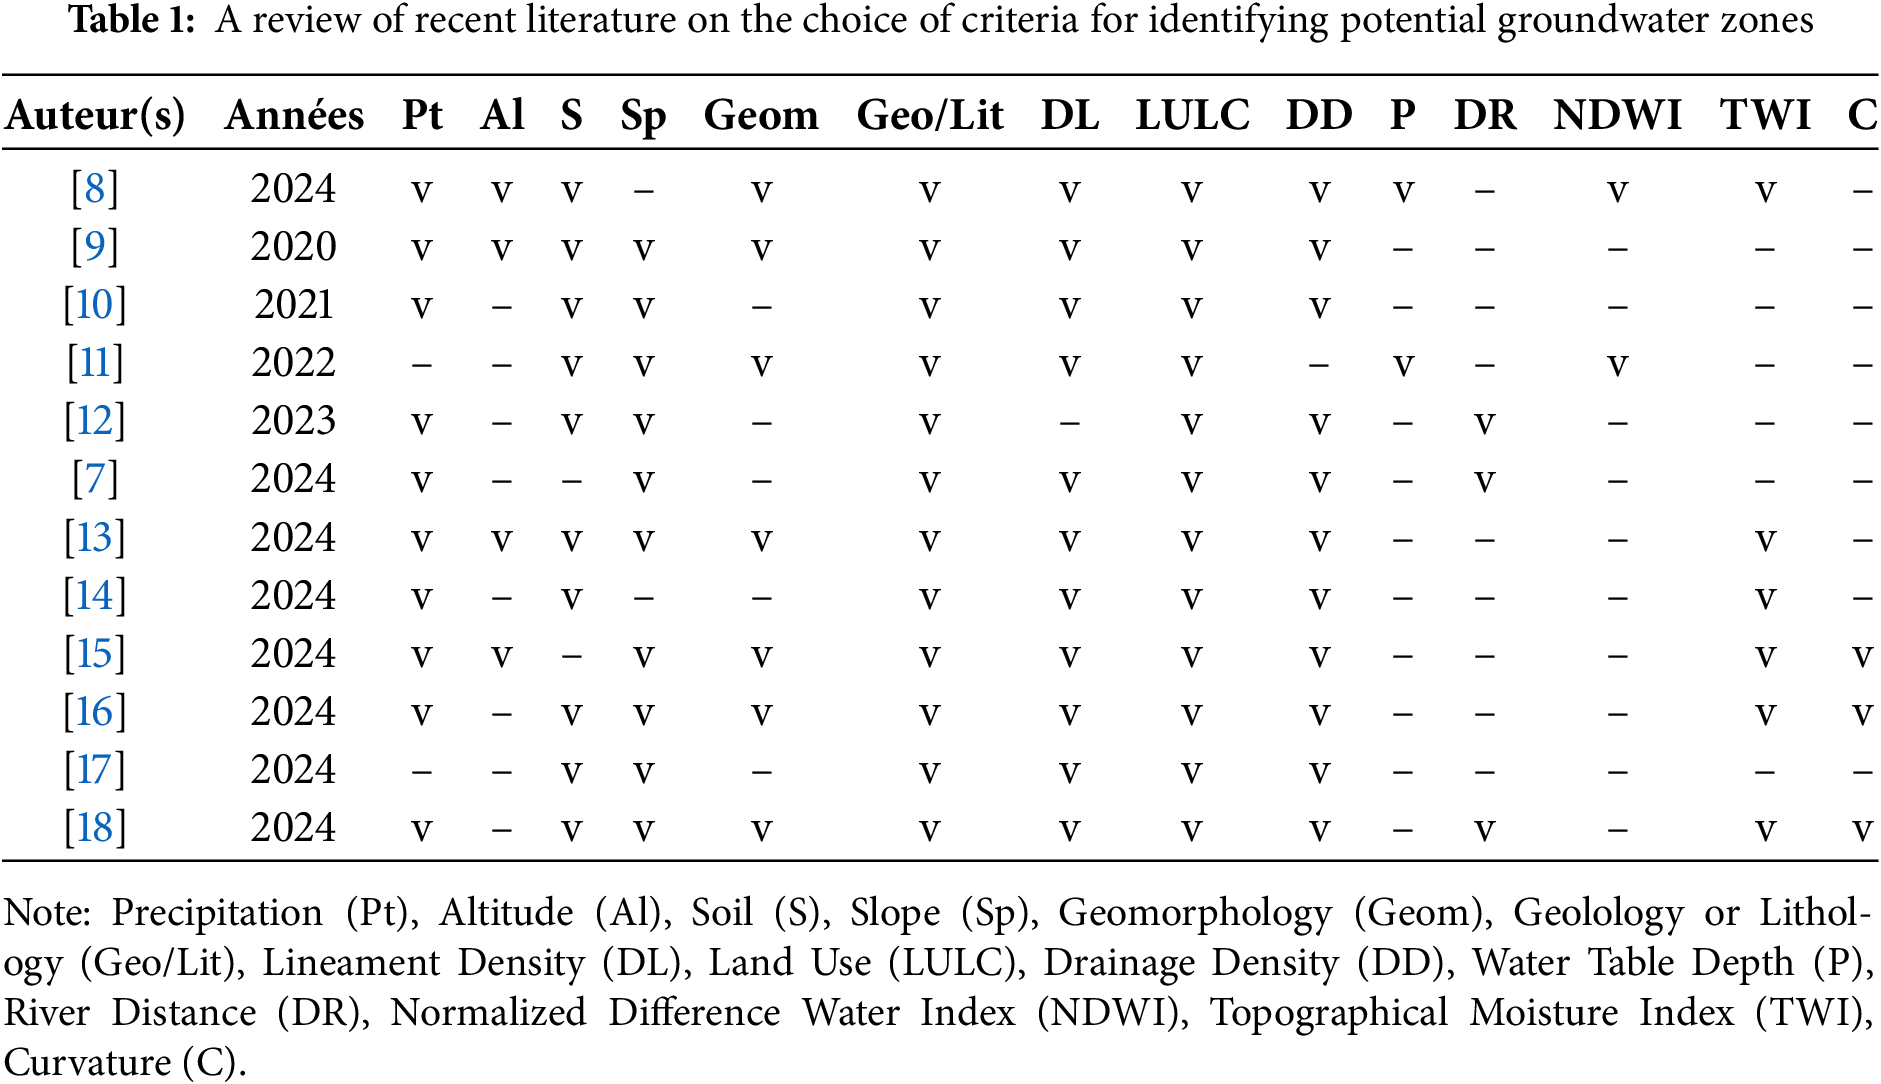
Around the world, particularly in arid and semi-arid regions, 70% of the water supply comes from groundwater [1]. Groundwater has become the only reliable source of water to support agriculture and a source of drinking water, mainly due to climate change, human pressure, and overexploitation [2,3]. Increasingly erratic rainfall patterns and overexploitation of surface water resources have increased the region’s dependence on groundwater as surface water becomes more erratic [4]. Human activities, including rapid population growth and changing consumption patterns worldwide, are also determining factors in the growing need for this resource. In addition, climate change has exacerbated these challenges by altering the parameters of the hydrological cycle and increasing groundwater depletion [1,5], making it all the more crucial to ensure the sustainable management of groundwater in these vulnerable areas. The Oued Lakhdar watershed is one of the basins that lack specialized groundwater studies, as it is threatened by the depletion of surface water resources due to agricultural activities. This region is known for its agricultural development and interest in farming and relies heavily on snowfall. However, in recent years, the region has experienced consecutive years of drought, forcing it to rely increasingly on groundwater resources. There are several methods for identifying potential groundwater zones, including conventional methods, which are costly, take time to obtain results, and rely on field studies using geophysical, geological, and hydrogeological tools [6,7]. On the other hand, geospatial technology, based on innovative tools such as geographic information systems (GIS), remote sensing, multi-criteria decision analysis (MCDA), and artificial intelligence, is proving to be effective, economical, and fast. These tools provide invaluable support for decision-making. Each author has selected criteria according to the availability of data and the specific objectives of their study. The table below summarises the factors used in the literature to identify areas with potential for groundwater resources (Table 1).
This study aims to analyse the methodology for detecting, analysing, and mapping areas with high groundwater potential using spatialized data processed by Geographic Information Systems (GIS) and remote sensing techniques. It is based on the Analytic Hierarchy Process (AHP) to assess the factors influencing groundwater resource availability in the Oued Lakhdar watershed.
2.1 Geographical Location, Morphometry, Hypsometry and Climate of the Oued Lakhdar Watershed
The Oued Lakhdar watershed is located in the central High Atlas of Morocco, covering an area of 1638 km2. Bordered upstream by the Hassan I dam, it lies between latitudes 31°57′20″ and 31°28′55″ north and longitudes 6°49′49″ and 6°08′18″ west. The main Oued is fed by Ain Lakhdar, and the basin is made up of two major Oueds, Bernat and Lakhdar (Fig. 1). The watershed’s climate is characterized by spatiotemporal variability in rainfall, with average annual precipitation ranging from 560 mm/year (Sgat station), 493 mm/year (Hassan I dam station), and 546.14 mm/year (Addamaghne station) [19]. With a surface area of 1638 km2. The area is characterized by a particularly rugged topography, classified according to the ORSOM relief typology. Altitudinal variations are significant, ranging from 918 m at the outlet of the Hassan I dam (minimum altitude) to 4006 m at the highest point. More precisely, higher altitudes are found to the east and south of the basin, while lower altitudes are located to the west [20] (Fig. 1). Agriculture and livestock breeding are among the most important economic activities in the Oued Lakhdar watershed. The irrigated area consists of small irrigation perimeters, located in the valleys, at the construction of irrigation canals (water abstraction) or around springs. This water potential has enabled agriculture in these areas to develop rapidly through the cultivation of relatively profitable crops (potatoes, apples, etc.).

Figure 1: Geographical location of Oued Lakhdar watershed
The methodology adopted (Fig. 2) to map groundwater potential in the Oued Lakhdar watershed is based on GIS, remote sensing, and the Analytical Hierarchy Process (AHP). It begins with the collection and preparation of geospatial data to generate thematic layers representing the factors influencing groundwater potential, such as precipitation, lithology, soil type, drainage density, lineament density, slope, land use, and so on. Next, a hierarchical ranking of the factors influencing groundwater potential is carried out, and a weight is assigned to each factor according to its relative importance, based on expert opinion and the literature. Combining these weights and data layers in a GIS generates an AHP-based groundwater potential map. Finally, the groundwater potential map produced by the AHP model is compared and validated against the actual distribution of wells in the study area to assess its accuracy.

Figure 2: Flow chart of the methodology adopted to identify potential groundwater zones in the Oued Lakhdar basin
The reliability of the results obtained will be checked using the ROC-AUC method, which is a tool for assessing the accuracy of the classification, carried out using AHP and GIS for groundwater potential mapping. This method measures the predictive power of a model by comparing the rate of correct detection with the rate of false positives, the AUC indicating how well the model can distinguish between different classes. The AUC value lies between 0 and 1, with a value close to 1 meaning that the model is capable of distinguishing between classes, while a value close to 0 means that the model is imprecise [10,16].
• Multi-Criteria Decision Analysis Using AHP Techniques:
AHP was chosen in this study because it provides a systematic and applicable method for analyzing multi-criteria decisions. Compared to other methods, AHP allows the impact of multiple and interrelated criteria to be assessed flexibly and accurately, making it best suited for our study that deals with a range of complex geographical and climatic factors. In addition, AHP provides a transparent framework for prioritization based on expert assessments, contributing to informed decision-making.
The AHP method is a multi-criteria decision analysis technique (MCDA) developed by Dr. Thomas Saaty in 1980 [21]. It is based on the evaluation of the relative importance of criteria or factors influencing groundwater potential. This method is the most widely used for determining groundwater exploration zones [22,23].
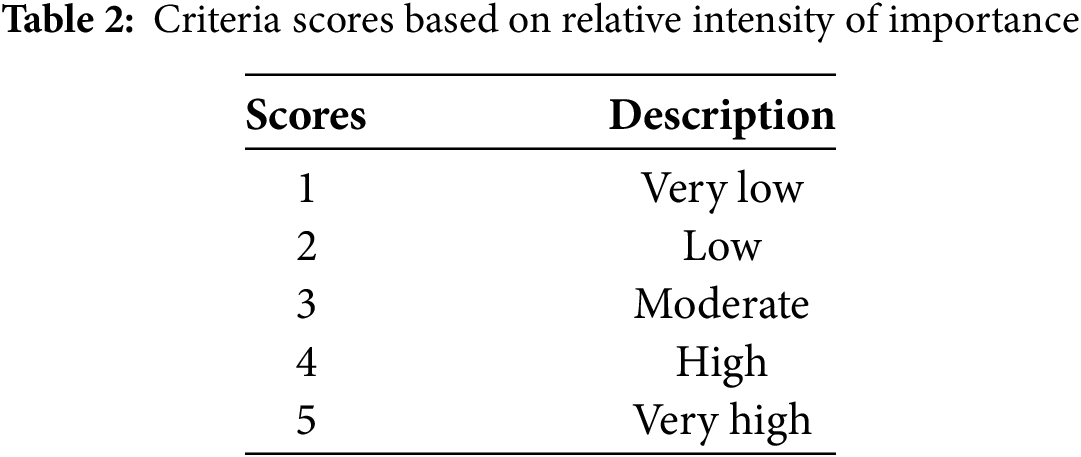
The factor matrix was determined in a Microsoft Excel spreadsheet by Klaus D. Goepel in 2018. These factors are weighted according to their relative impact. We used five scores for hypsometric, meteorological, topographical, geological, and pedological data, based on literature, previous studies, and expert knowledge [24]. Thus, each criterion is individually mapped using GIS tools for the study area before being reclassified on a scale of 1 to 5 (Fig. 3 and Table 2).

Figure 3: Scores of selected criteria according to previous studies and experts
In this study, weights were assigned to factors such as rainfall and lithology based on their prominent role in determining the distribution of groundwater in the region. As for rainfall, it is a key factor because the region is highly dependent on rainfall for groundwater recharge, especially given the climatic conditions in the region in terms of the amount of seasonal rainfall. As for lithology, the geological structure of the region directly affects the ability of rocks to store and transport groundwater, so the presence of porous or permeable rocks is a major influencing factor in determining where water collects. Therefore, these factors are considered more influential in the studied area due to its unique geographical and climatic characteristics that distinguish it from other regions.
• Coherence Ratio (CR):
The Coherence Ratio (CR) is the ratio between the matrix coherence index (CI) and the random coherence index of the factors used in the model (RI). To obtain reliable results, the CR must not exceed 10% (CR ≤ 10); in the case of CR > 10%, the matrix must be re-evaluated, i.e., the values are inconsistent. The CR calculation involves the following two Eqs. (1) and (2), as described above [7,11]:
where, CI corresponds to the coherence index obtained from Eq. (1). RI represents the random index.
CI can be calculated using Eq. (2):
where, λmax is the matrix’s principal eigenvalue, and n is the total number of thematic layers chosen (n = 7).
• The Random Index (RI):
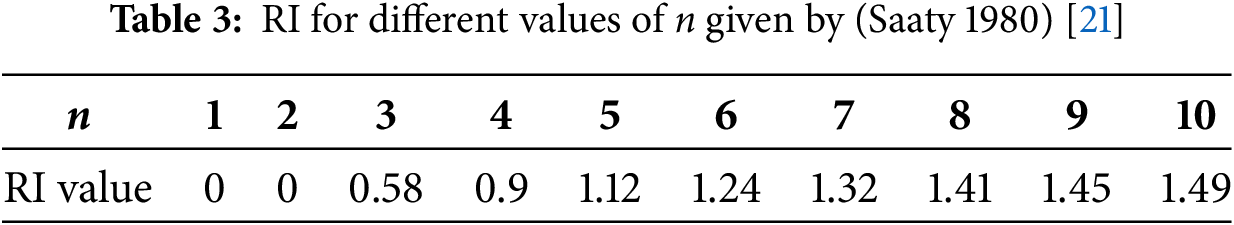
In 1980, author Saaty [21] determined RI values for each miscellaneous n, as shown in Table 3. In our case, RI = 1.32 because n = 7.
• Groundwater Potential Index (GPI):
This index can make the final map for the identification of potential groundwater zones where groundwater accumulates or is retained. We used ArcGIS 10.4.1’s Raster Calculator tool via Eq. (3) [25]. By determining weights and ranks for each thematic layer (precipitation, lithology, soil type, slope, land use, drainage density and lineament density). The seven thematic maps were then superimposed using Eq. (3).
where, R: rank of thematic layers. W: weight.
• Data Used:
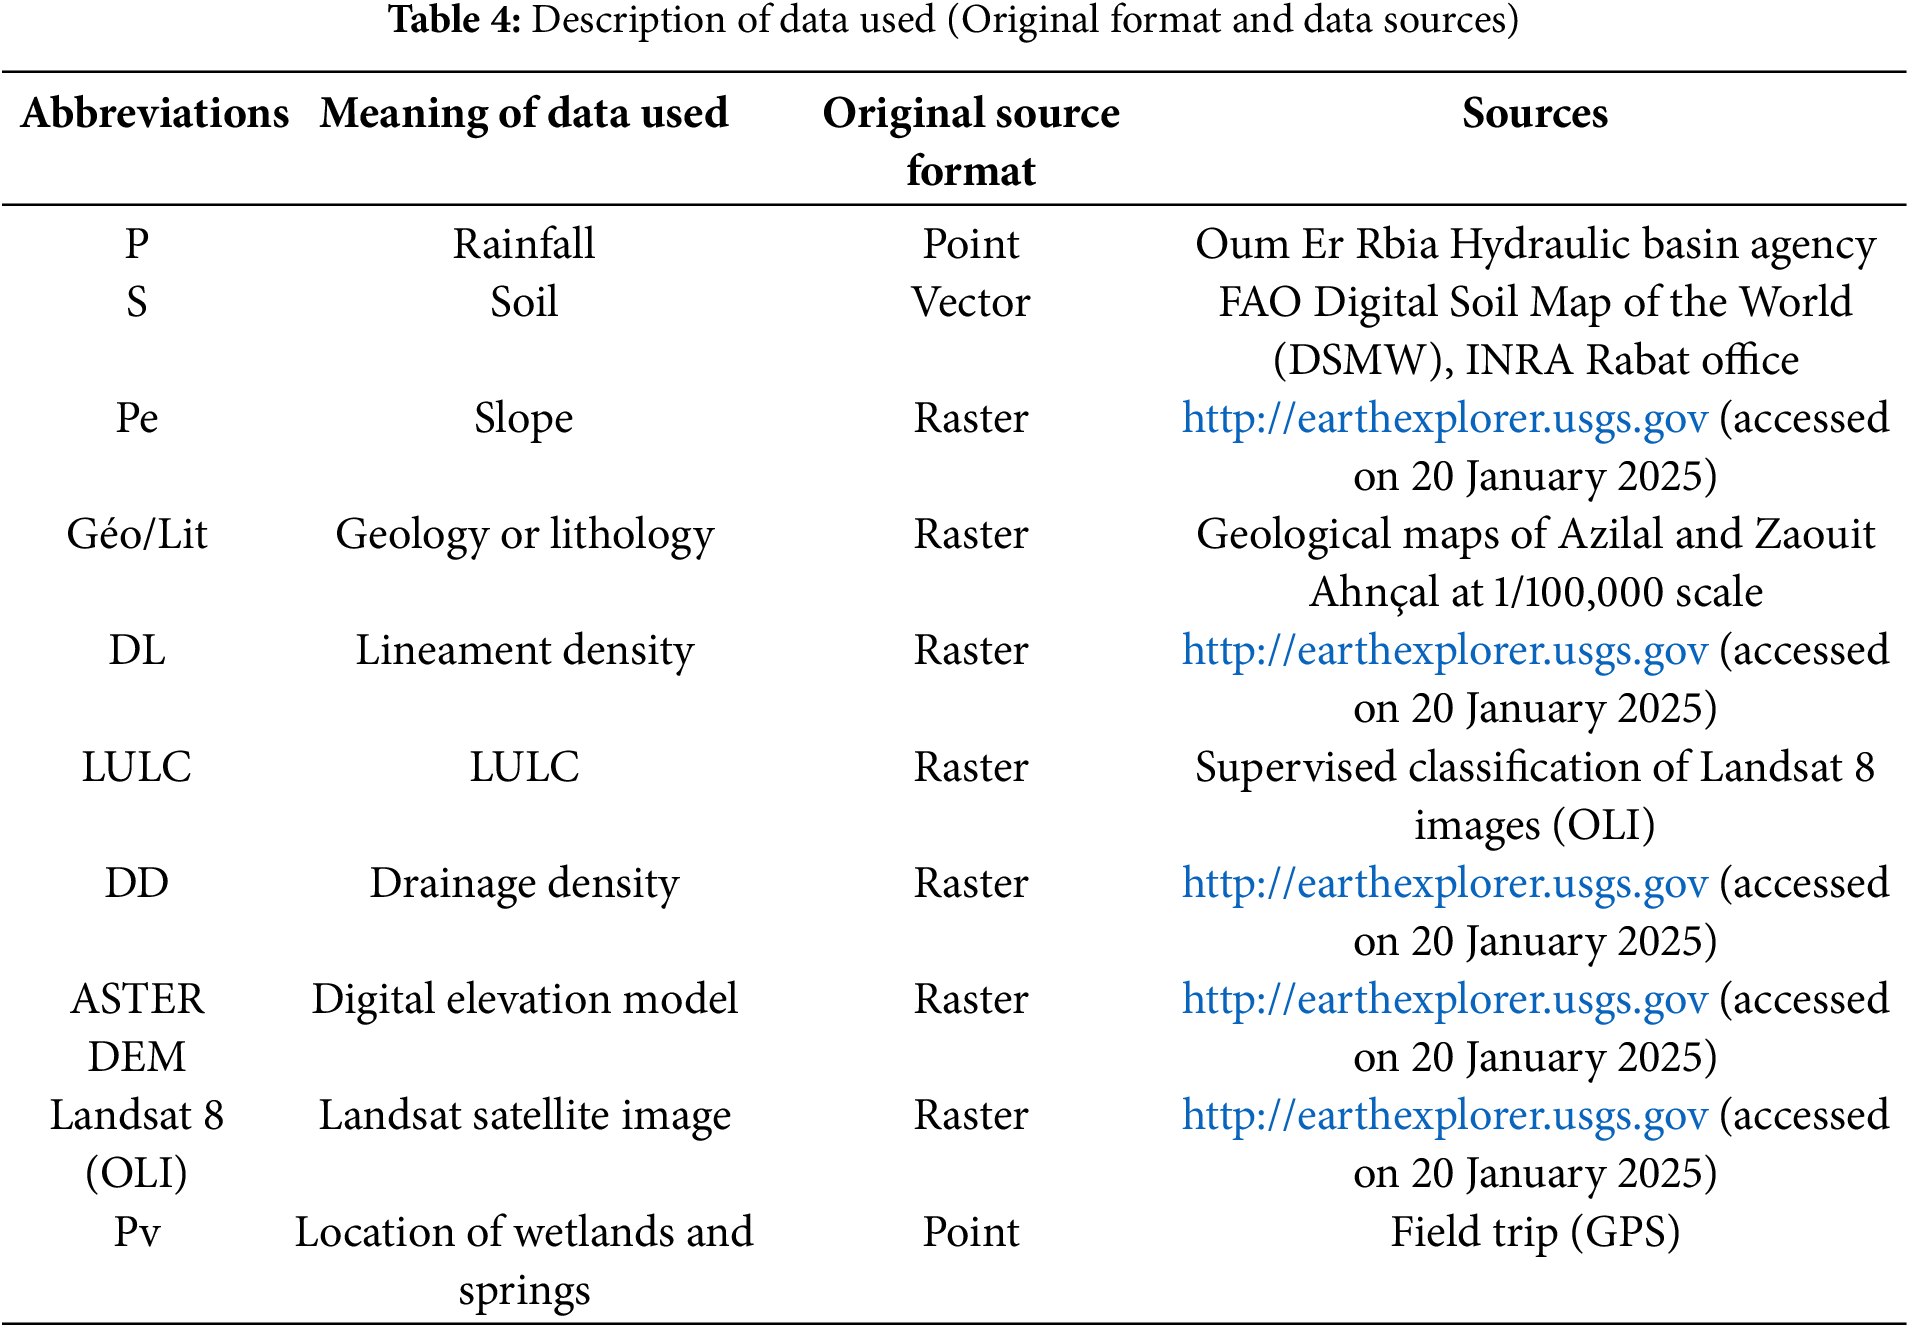
In this study, we collected a range of data in different formats and from various sources (Table 4). These were analyzed and processed in ArcGIS 10.4.1 software to produce various maps of the factors influencing groundwater availability in the Oued Lakhdar watershed. Rainfall data were obtained from the Agence du Bassin Hydraulique de l’Oum Er Rbia in Béni Mellal. 12 stations in the basin and its surroundings with a period between 1985–2021. Soil data provided by INRA Rabat (FAO Digital Soil Map of the World). Geological and lithological data were digitized from the Azilal and Zaouit Ahnçal geological maps at a 1:100,000 scale. The DEMs and Landsat 8 images were downloaded from the website http://earthexplorer.usgs.gov (accessed on 20 January 2025) free of charge. We carried out a field survey to collect the location of wetlands and water sources to validate the Groundwater Potential Index (GPI) map, as the input of the ROC-AUC extension considers these data as real results and then calculates the probability of correspondence of the results with reality.
Criteria for Regulating and Influencing Groundwater Recharge: Drawing up Thematic Maps
We used GISand remote sensing integrated with Multi-Criteria Decision Analysis using AHP techniques to produce the final map of groundwater availability, accessibility and management, which are influenced by the following seven criteria: rainfall, lithology, soil type, slope, land use, drainage density and lineament density in the Oued Lakhdar watershed. Interpretations of each thematic layer are described below:
• Criterion 1: Spatialization of Precipitation in the Oued Lakhdar Watershed:
Precipitation is the key driver of the hydrological cycle and one of the parameters used to detect groundwater availability [10,26,27]. While the spatialization and distribution of precipitation control the relationship between runoff and groundwater recharge [18], the spatial interpolation of the 12 rainfall stations was carried out by universal kriging using ArcGIS 10.4.1. According to the map, rainfall fluctuates between 410 and 561 mm per year, with an uneven distribution of precipitation across the watershed. The western part of the watershed receives particularly abundant precipitation, with an accumulation of around 500–561 mm; this could be attributed to the region’s weather patterns. Precipitation gradually decreases towards the east: the central areas receive moderate precipitation, from 470 to 500 mm, while the eastern part gets the least, between 410 and 470 mm/year. Five main groups have been identified: 410–440 mm/year (very low), 440–470 mm/year (low), 470–500 mm/year (moderate), 500–530 mm/year (high), and 530–561 mm/year (very high) (Fig. 4).

Figure 4: Spatialization of precipitation in the UK between 1985–2021
• Criterion 2: Slope in the Oued Lakhdar Watershed:
The slope represents the influence of gravity on water movement. In other words, slope controls surface runoff and infiltration [28]. A high slope results in progressively higher flow velocity, which increases surface runoff. On the other hand, with a low slope, flow velocity decreases, which favors water accumulation. In flat areas, more water accumulates, increasing infiltration into the soil [27,29]. Slopes in the Oued Lakhdar watershed ranged from 0 to 59.20°, with an average of 16°. Very low to low slopes (0 to 20°) were mainly located on the plain, while medium slopes (20 to 30°) and steep slopes (30 to 59°) were mainly concentrated in mountainous areas [20] (Fig. 5).

Figure 5: Slope in Oued Lakhdar watershed
• Criterion 3: Land Use in the Oued Lakhdar Watershed:
A land-use map is a useful tool for groundwater planning and management [30,31]. It controls the behavior of water runoff or infiltration [9]. Landsat 8-OLI_TIRS imagery was downloaded in July from the official website of the US Geological Survey (http://earthexplorer.usgs.gov, accessed on 20 July 2024), with a resolution of 30 m, and classified by exploiting the maximum likelihood supervised classification algorithm in ArcGIS 10.4.1 [32]. The results obtained were validated by the Kappa index, Google Earth, and field data. The classified image is made up of different land cover types (water bodies, bare soil and built-up area, irrigated crops, light vegetation, and dense vegetation) (Fig. 6). Priorities for land cover classes were given: water > forest > shrubland > cropland > grassland > bare soil [31,33].
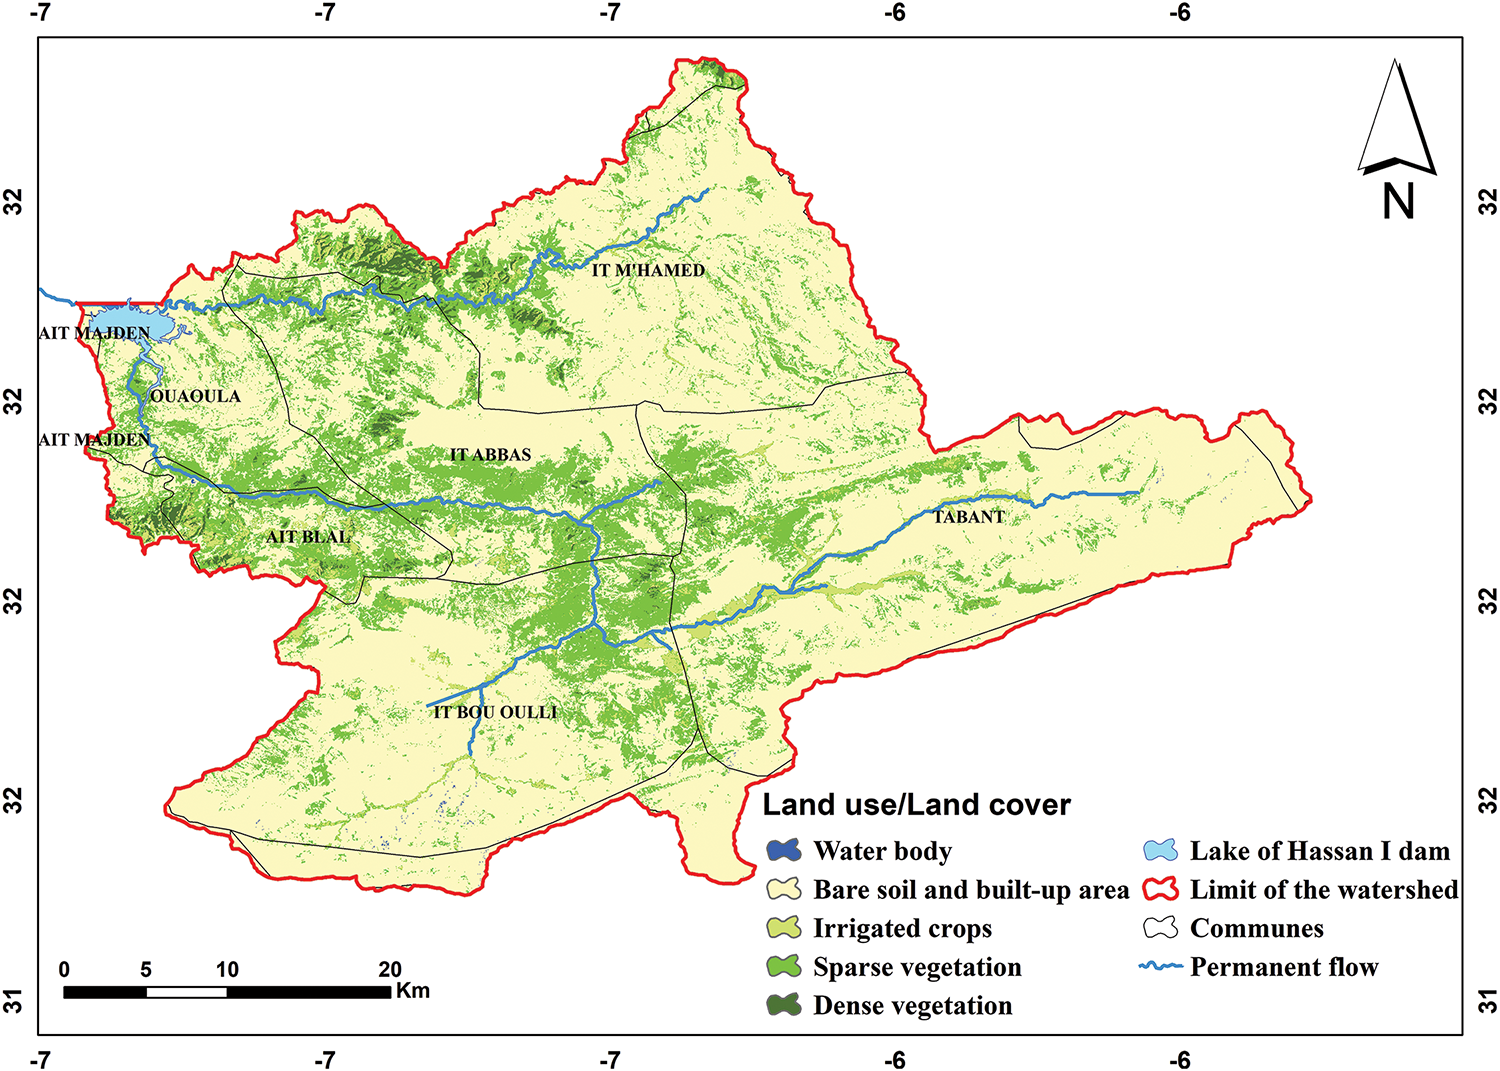
Figure 6: Land use map of Oued Lakhdar watershed [32]
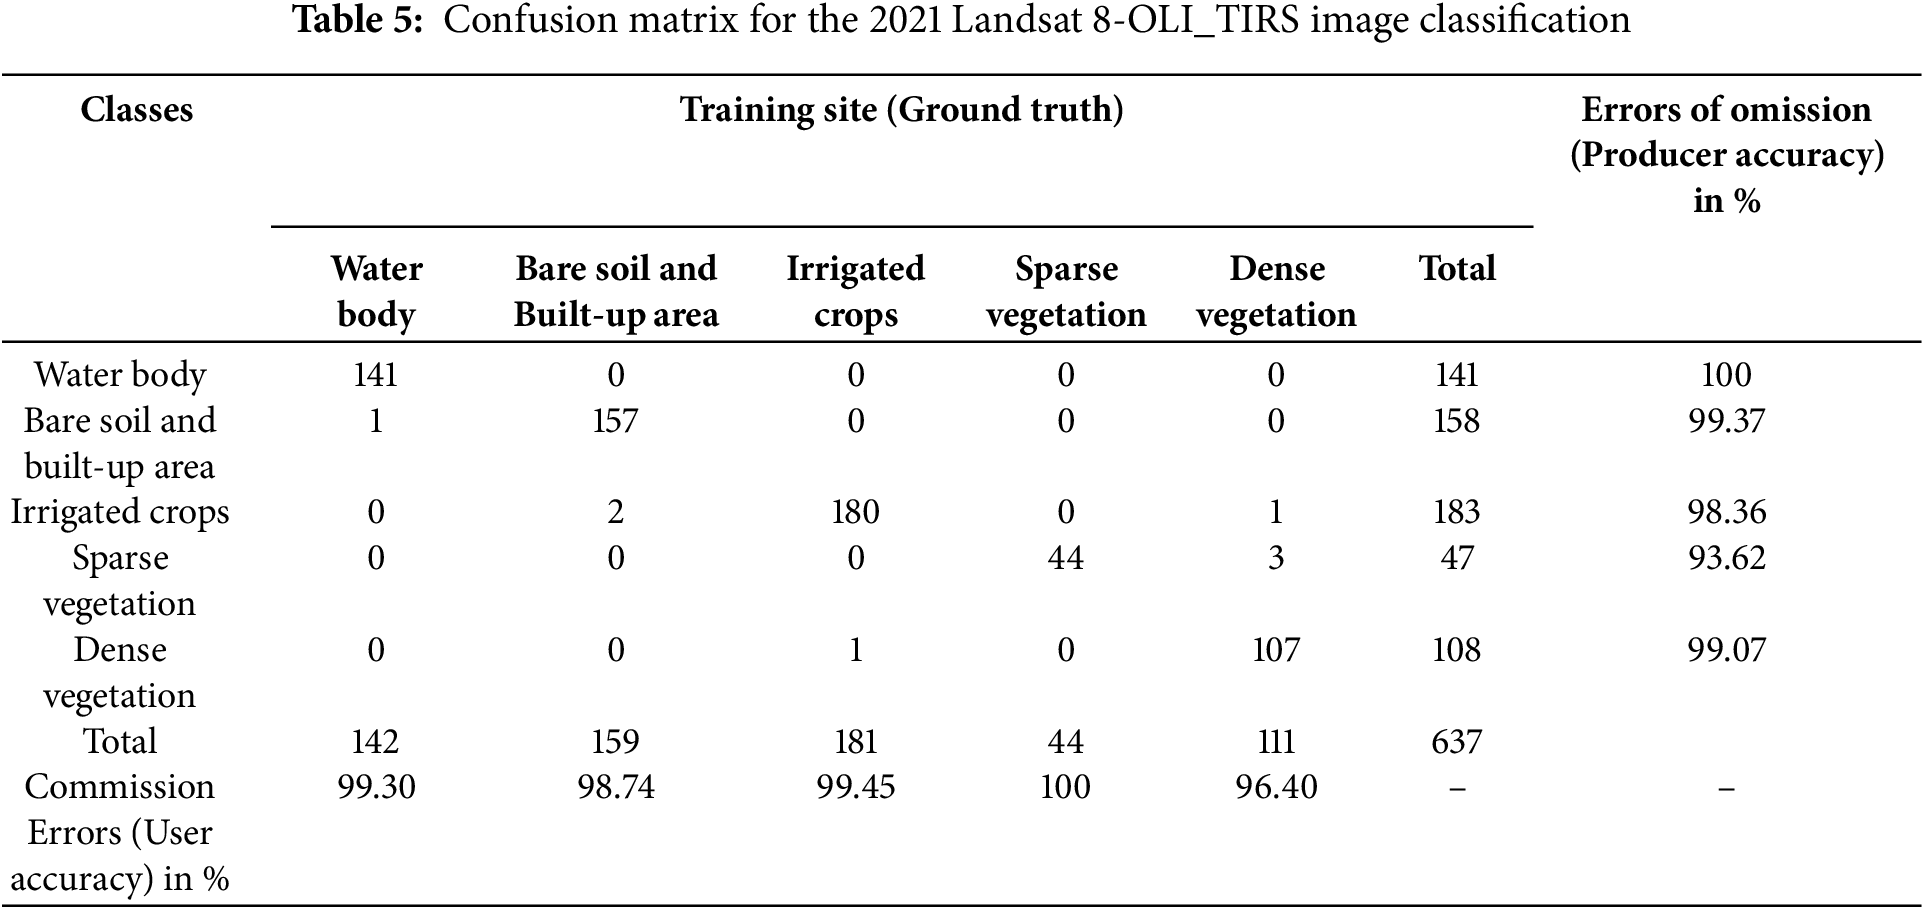
The total classification accuracy and Kappa index are 98.74% and 0.98%, respectively (Table 5). The classification result is an acceptable and good match between remote sensing data and reality [34]:
• Criterion 4: Lithology in the Oued Lakhdar Watershed:
Lithological categorization is an essential element for recharge and the identification of potential groundwater zones [24,35], as it will control percolation [36], i.e., water storage is conditioned by the porosity of the geological formation. The lithological map of the study area was produced by digitizing the two geological maps of Azilal and Zaouit Ahnçal at a scale of 1:100,000. The Oued Lakhdar watershed contains sedimentary and magmatic rocks of various ages ranging from Paleozoic to Cenozoic. In addition, the lithological map (Fig. 7 and Table 6) shows various geological formations that indicate a rather complicated geogenesis history of the Oued Lakhdar watershed.

Figure 7: Lithology in the Oued Lakhdar watershed

Quaternary formations, in the form of terraces, alluvial fans, and recent alluvium, are of vital importance for aquifer recharge. These soil layers have a free aquifer, which means they are highly permeable and can easily allow water to infiltrate the rock. Jurassic formations are characterized by a predominance of limestone and marl. Fissured limestone, particularly from the Middle and Upper Jurassic, is one of the most productive karstic aquifers. Karst zones, characterized by the predominance of sinkholes and karst erosion, allow water to circulate rapidly. On the other hand, the marlstones, being not very permeable to water, fix such terrain as an aquiclude. This limits the vertical circulation of water, creating deep reservoirs.
Ancient rocks, particularly those of the Ordovician and Carboniferous periods, consist mainly of shales and sandstones, which have relatively limited potential for groundwater resources. Shales, with their low permeability, hinder aquifer recharge, while sandstones can, under certain conditions, serve as aquifer reservoirs. However, their productivity is highly dependent on the degree of fracturing. Finally, magmatic and metamorphic rocks, although present over small areas, have only a minor impact on hydrogeological potential. These formations can, however, influence groundwater mineralization, often by increasing hardness or dissolved salt content.
• Criterion 5: Drainage Density in the Oued Lakhdar Watershed:
Most authors who have studied potential areas for groundwater storage base their calculations on drainage density and lineament density [8,37]. Drainage density was calculated by dividing the sum of the lengths of the watercourses in the watershed by the surface area [38]. It was extracted from the 30 m resolution DTM model in ArcGIS software, using a line density analysis tool (Spatial Analyst Tools: Density: Line Density). Areas with low drainage density are characterized by permeable soil, which favors infiltration and very low runoff, while high drainage density indicates the opposite [13,39]. The present density map was classified into five classes: very high, high, medium, low, and very low (Fig. 8).

Figure 8: Drainage density in the Oued Lakhdar watershed
• Criterion 6: Lineament Density in the Oued Lakhdar Watershed:
According to studies [18,31], lineament density is one of the measures used to determine the density of lines or fissures on the ground surface, and is one of the key elements in assessing groundwater potential. Areas with high fracture density are more likely to store and transport groundwater [40], while low lineament density indicates the opposite. We digitized the lineaments using SRTM DEM to produce the final map in ArcGIS software. The resulting lineament density map was grouped into five classes: very high, high, medium, low, and very low (Fig. 9).
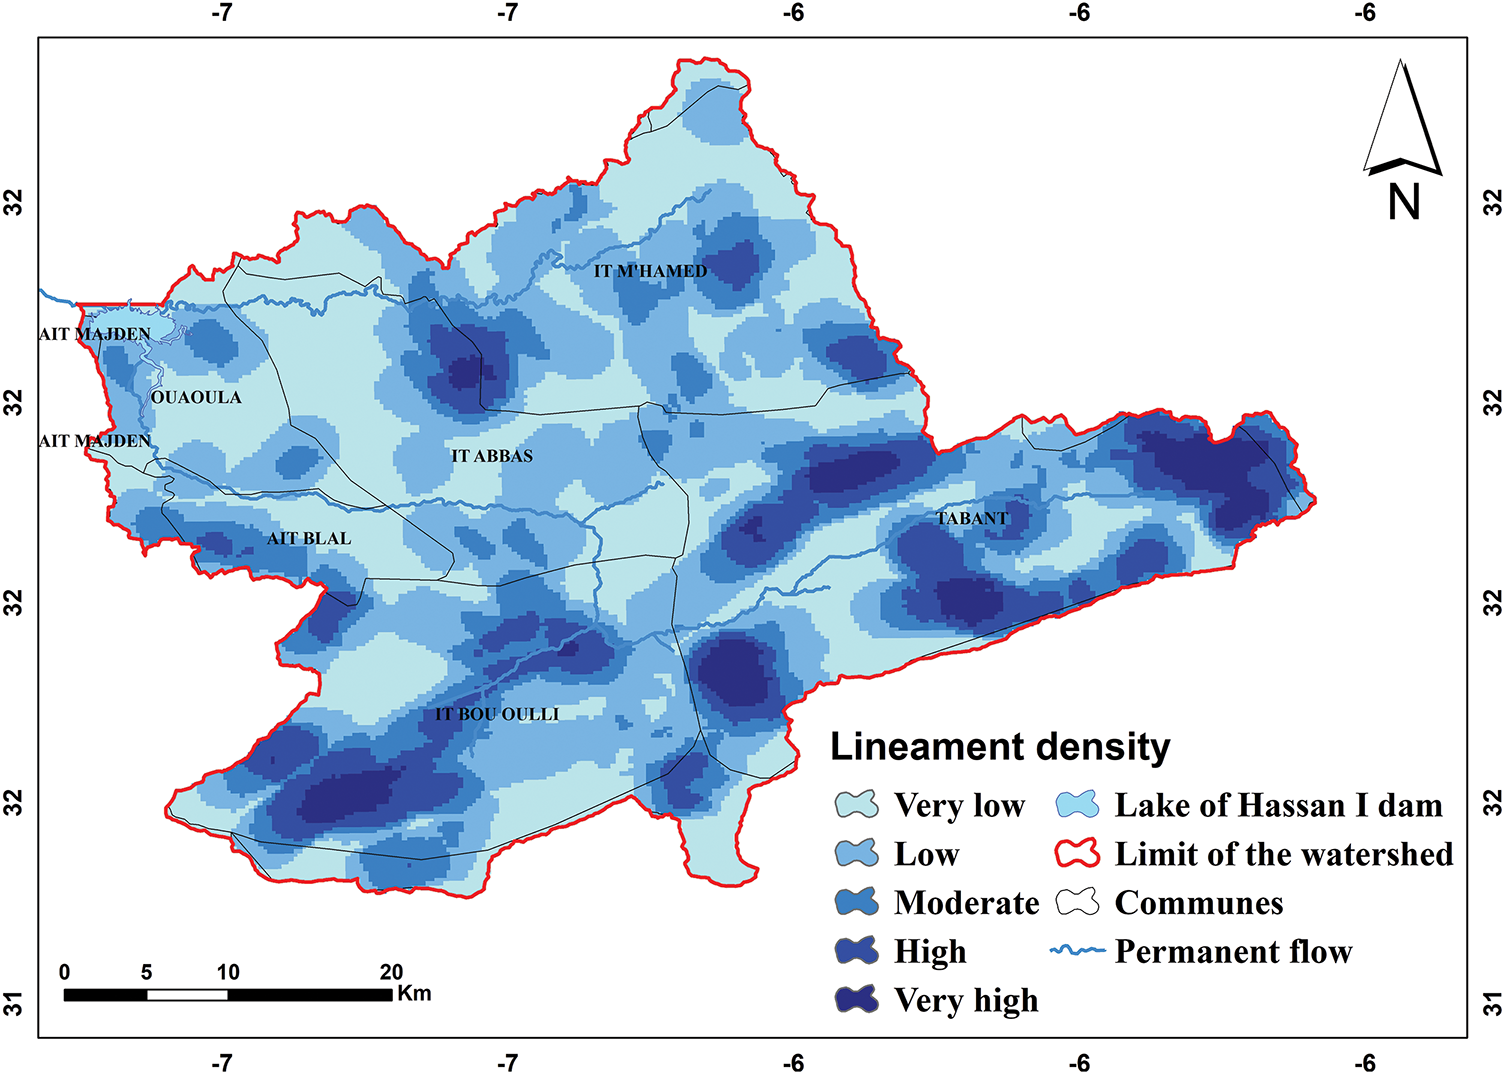
Figure 9: Lineament density in the Oued Lakhdar watershed
• Criterion 7: Pedology in the Oued Lakhdar Watershed:
Depending on soil texture, it is possible to determine whether it favors infiltration or runoff [13,41]. So, edaphic characteristics are therefore essential in controlling the determination of GPZs [16,42]. The soil map of the study area was based on the FAO Digital Soil Map of the World (DSMW), highlighting three main soil categories: Rendzines (E), Lithosols (I), and Calcareous Xerosols (Xk). Rendzines (humus-limestone) are distributed across the central, northern, and eastern parts of the watershed (Fig. 10). Rendzines cover some 1039 km2 or 63% of the total watershed area. These soils are generally shallow, with a high content of organic matter and fine particles. Their structure favors water retention and infiltration, making them highly favorable for groundwater recharge in areas with sufficient rainfall. Lithosols, which account for 27% (=436 km2), are dominated by surface runoff, while calcareous Xerosols, covering an area of 163 km2 (10%), have a moderate potential, depending on their structure and calcareous content.

Figure 10: Pedology in the Oued Lakhdar watershed
• Final Map of Groundwater Potential in the Oued Lakhdar Watershed:
Due to the occurrence of hydrological droughts and anthropogenic pressure on surface waters, the volume of groundwater recharge has also decreased in recent years [35]. This allows us to monitor groundwater potential and recharge by seven criteria in the Oued Lakhdar watershed: rainfall, lithology, soil type, slope, land use, drainage density and lineament density. Using GIS and remote sensing integrated with multi-criteria decision analysis using AHP techniques, five descriptions (1): very low, (2): low, (3): medium, (4): high and (5): very high were reclassified to manage and determine groundwater potential zones in this basin. The use of the AHP method was accepted, as the consistency ratio (CR) is 4.7% (Fig. 11), which is less than 100%. This weighting is therefore very acceptable and reliable [7,11]. So, the AHP analysis determined the influence of each factor on groundwater potential (Figs. 11 and 12): precipitation (37.3%), lithology (24.7%), slope (13.3%), drainage density (9%), land use (6.7%), lineament density (5%) and soil type (4%).

Figure 11: Pairwise comparison matrix using AHP
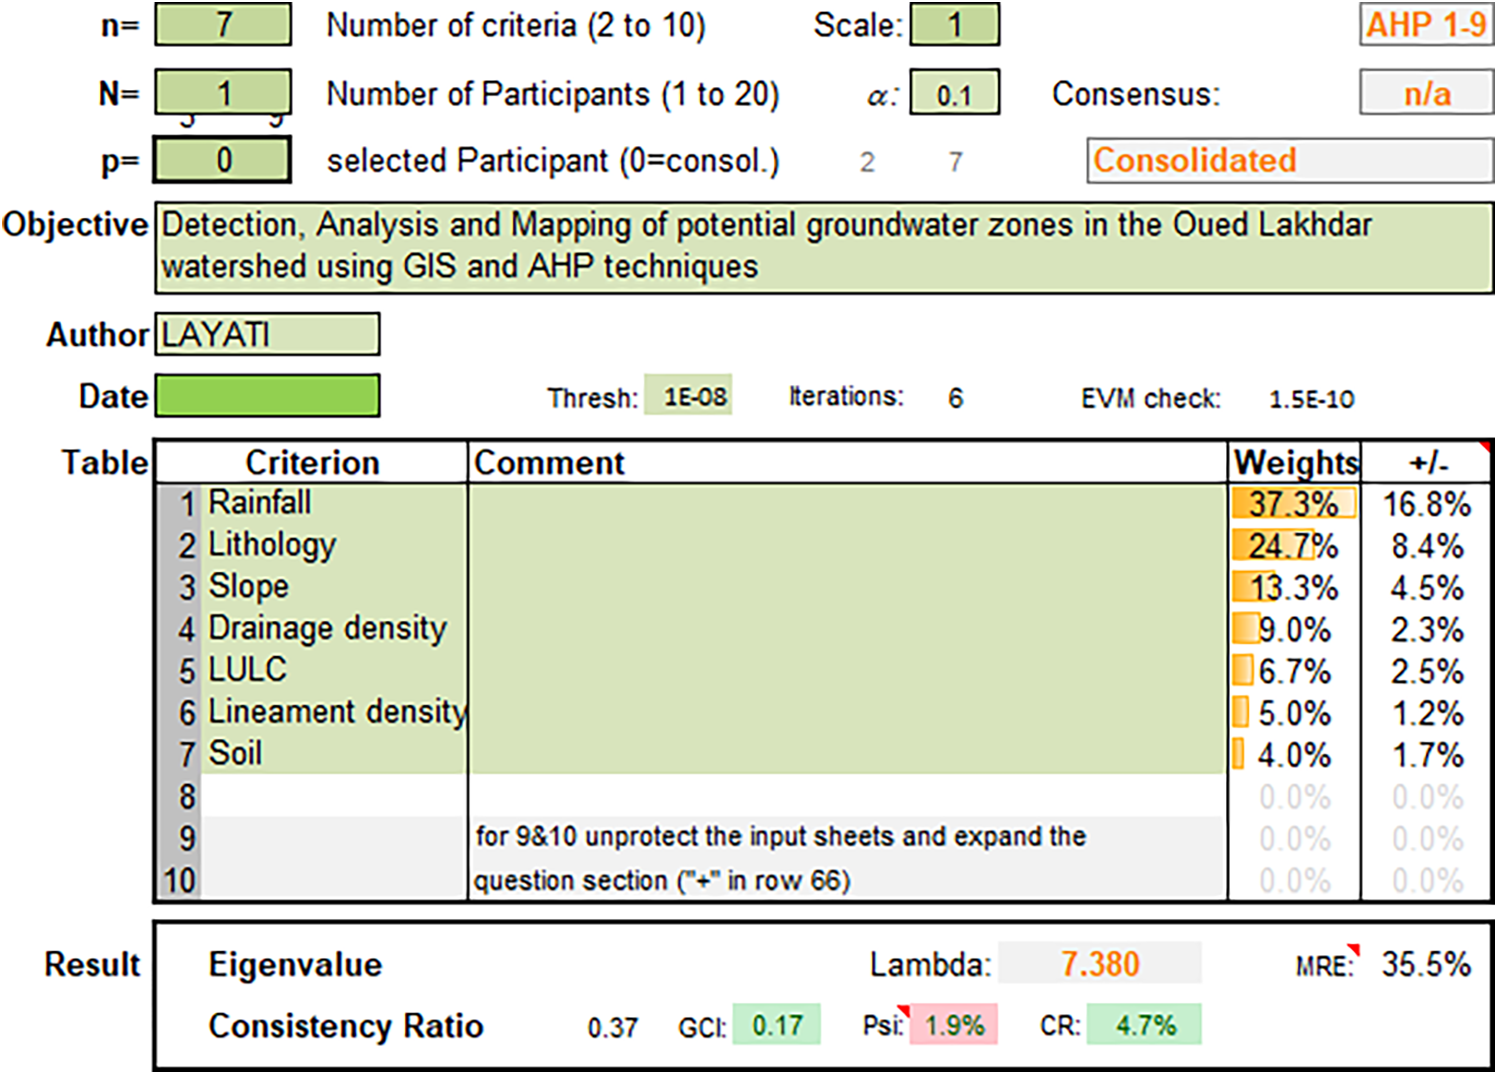
Figure 12: Percentage influence of factors on groundwater potential (%) and CR (%)
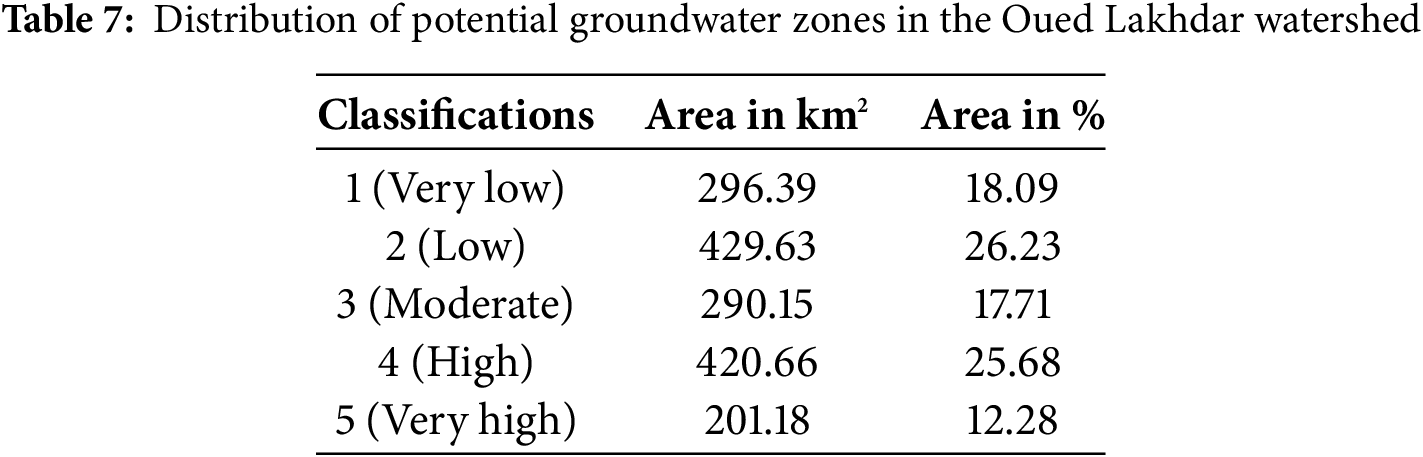
Quantification, analysis and overlay of seven geospatial layers in GIS show that the Oued Lakhdar watershed is characterized by various groundwater potential zones, which have been classified into five groups (Fig. 13 and Table 7): very low (18. 09%, i.e., 296,383 km2), low (26.23%, i.e., 429,637 km2), medium (17.71%, i.e., 290.145 km2), high (25.68%, i.e., 420.66 km2) and very high (12.28%, i.e., 201.175 km2). Areas with high and very high groundwater potential are characterized by good hydrogeological conditions and are located in the center and west of the watershed, i.e., they favor permeable geological and soil formations, medium to dense vegetation cover, low slope, low altitude, high infiltration capacity and high lineament density [7,17]. In addition, areas characterized by moderate groundwater potential have moderate permeability, altitude, slope, precipitation, and infiltration capacity. On the other hand, areas with low and very low potential are located upstream, to the east and the north of the basin, i.e., these areas have unfavorable conditions, with low lineament densities, high drainage density, impermeable lithology and high slope [18,43]. Table 8 shows the weighting of the various criteria and sub-criteria scores.

Figure 13: Map of groundwater potential zones in the Oued Lakhdar watershed

• Validation of the Resulting Map of Groundwater Potential in the Oued Lakhdar Watershed:
To assess the accuracy of the model used and validate the final map obtained of groundwater potential by GIS and AHP, we relied on the ROC-AUC curve that was prepared using reference points and truth in the Arc-SDM tool integrated into ArcGIS 10.4.1 software [44,45]. We collected data on wetlands and springs using GPS (coordinates) that were in the Oued Lakhdar watershed. Fig. 14 shows the ROC-AUC curves, with an accuracy of 0.702 (70.20%). According to classification Table 9, the model is reliable and acceptable, i.e., with good results.

Figure 14: ROC-AUC curves for AHP model validation

The AHP method has been selected, but there may be a potential bias in the assignment of weights by experts, or the results of the study may be affected by certain initial assumptions. In addition, the accuracy of the DEM may be relatively affected if we choose others, but with a very high resolution, which may affect the results of the groundwater recharge estimation, since these estimates are based on assumptions that may change in reality, and therefore affect the accuracy of the predictions.
Analytical Hierarchy Process (AHP) and Geographic Information Systems (GIS) methods and remote sensing have emerged as significant advances in groundwater potential mapping, particularly in the context of watershed management and climate change adaptation. This study highlights the effectiveness of this approach for assessing groundwater potential zones in the Oued Lakhdar watershed, upstream of the Hassan I dam. By superimposing various factors: rainfall, lithology, soil type, slope, land use, drainage density, and lineament density. The results of this research indicate that 25.68% of the watershed has a high (420.66 km2) to very high (12.28%) groundwater potential. In contrast, 26.23% of the surface area has a low (429.637 km2) to very low (18.09%) groundwater potential. This classification not only presents the spatial distribution of groundwater resources, but also constitutes an essential tool for decision-makers, planners and stakeholders responsible for water resource management and land use planning.
Practical strategies can be suggested, such as:
Focusing on high-potential groundwater areas: Water management in these areas can be improved through cumulative storage and protection of high-potential areas to ensure their sustainable use.
Continuous monitoring: Implementation strategies should include the use of remote sensing and GIS technologies to periodically monitor groundwater levels to identify emergency changes and identify areas in need of urgent intervention.
Controlling water consumption: This requires activating water conservation policies in areas with low groundwater potential, by optimizing irrigation techniques and using alternative water resources wherever possible.
Long-term planning: Developing strategic plans to manage groundwater in the face of climate change and population growth, by encouraging cooperation between governmental bodies and local communities to ensure sustainability.
Specific methods have been used to map groundwater potential, but in the future, the accuracy of the maps could be improved by incorporating additional techniques such as mathematical modeling and temporal data analysis to follow long-term groundwater changes. Advanced remote sensing techniques can be used with artificial intelligence to identify spatial patterns more precisely, or extend the studied data to larger areas using multispectral sensing. In addition, it may be useful to improve the use of GIS by incorporating additional data such as climate impacts and environmental changes to identify areas most vulnerable to depletion.
Acknowledgement: The authors would like to thank the creators of the USGS site for providing free Landsat satellite data via https://Earthexploitsrer.usgs.gov/. They also thank the management services of the Oum-er-Rbia Hydraulic Basin Agency for providing the hydro-climatic data used in this article.
Funding Statement: The authors received no specific funding for this study.
Author Contributions: We hereby declare that this article is the result of a collaborative work between the following authors: Study design, data collection and analysis, writing of the article: Elhoucein Layati; statistical analysis, critical revision of the article, and English language correction: Omaima Elkbichi and Bahija Choukri; draft manuscript preparation and substantial revision of the article: Mohamed El Ghachi. All authors reviewed the results and approved the final version of the manuscript.
Availability of Data and Materials: Available at http://asterweb.jpl.nasa.gov/gdem.asp and https://Earthexploitsrer.usgs.gov/ (accessed on 20 July 2024), and hydro-climatic data were obtained from the Oum Er-Rbia Hydraulic Basin Agency: 05234-82355.
Ethics Approval: Not applicable.
Conflicts of Interest: The authors declare no conflicts of interest to report regarding the present study.
References
1. Connor R, Miletto M. Rapport mondial des Nations Unies sur la mise en valeur des ressources en eau 2022: eaux souterraines, rendre visible l’invisible; résumé [Internet]. (In French). [cited 2025 Jan 20]. Available from: https://unesdoc.unesco.org/ark:/48223/pf0000380726_fre. [Google Scholar]
2. Lee S, Hyun Y, Lee S, Lee MJ. Groundwater potential mapping using remote sensing and GIS-based machine learning techniques. Remote Sens. 2020;12(7):1200. doi:10.3390/rs12071200. [Google Scholar] [CrossRef]
3. Amanambu AC, Obarein OA, Mossa J, Li L, Ayeni SS, Balogun O, et al. Groundwater system and climate change: present status and future considerations. J Hydrol. 2020;589:125163. doi:10.1016/j.jhydrol.2020.125163. [Google Scholar] [CrossRef]
4. Vecchio KD, Kuper M. La mise en visibilité des eaux souterraines au Maroc: un processus historiquement lié aux politiques de développement de l’irrigation. Développement Durable Et Territ. 2021;12(3):1–21. (In French). doi:10.4000/developpementdurable.19675. [Google Scholar] [CrossRef]
5. Kabeto J, Adeba D, Regasa MS, Leta MK. Groundwater potential assessment using GIS and remote sensing techniques: case study of west Arsi zone, Ethiopia. Water. 2022;14:1838. doi:10.3390/w14121838. [Google Scholar] [CrossRef]
6. Shinde SP, Barai VN, Gavit BK, Kadam AS, Atre AA, Pande CB, et al. Assessment of groundwater potential zone mapping for semi-arid environment areas using AHP and MIF techniques. Environ Sci Eur. 2024;36:87. doi:10.1186/s12302-024-00906-9. [Google Scholar] [CrossRef]
7. Hilal I, Qurtobi M, Saadi R, Aqnouy M, Bouizrou I, Bouadila A, et al. Integrating remote sensing, GIS-based, and AHP techniques to delineate groundwater potential zones in the Moulouya Basin, North-East Morocco. Appl Water Sci. 2024;14:122. doi:10.1007/s13201-024-02175-6. [Google Scholar] [CrossRef]
8. Atalla MA, Shebl A, Ðurin B, Kranjčić N, AlMetwaly WM. Assessment of groundwater potential zones in Kuwait’s semi-arid region: a hybrid approach of multi-criteria decision making, Google earth engine, and geospatial techniques. Sci Rep. 2024;14:29938. doi:10.1038/s41598-024-76989-4. [Google Scholar] [PubMed] [CrossRef]
9. Berhanu KG, Hatiye SD. Identification of groundwater potential zones using proxy data: case study of Megech watershed. Ethiopia J Hydrol Reg Stud. 2020;28:100676. doi:10.1016/j.ejrh.2020.100676. [Google Scholar] [CrossRef]
10. Ahmadi H, Kaya OA, Babadagi E, Savas T, Pekkan E. GIS-based groundwater potentiality mapping using AHP and FR models in central Antalya. Turkey Environ Sci Proc. 2021;5(1):11. doi:10.3390/IECG2020-08741. [Google Scholar] [CrossRef]
11. Chatterjee S, Dutta S. Assessment of groundwater potential zone for sustainable water resource management in south-western part of Birbhum District, West Bengal. Appl Water Sci. 2022;12:40. doi:10.1007/s13201-021-01549-4. [Google Scholar] [CrossRef]
12. Vaddiraju SC, Talari R. Assessment of groundwater potential zones in Saroor Nagar watershed, Telangana, India, using geospatial techniques and analytical hierarchy process. Environ Sci Pollut Res. 2023;30:79758–73. doi:10.1007/s11356-023-26185-0. [Google Scholar] [PubMed] [CrossRef]
13. Sharma R, Pandey RK, Singh AK. A multi-criterian approach to identify groundwater potential zones in the Subarnarekha River Basin using integrated analytical hierarchy process and geospatial technology. J Geogr Environ Earth Sci Int. 2024;28(10):78–100. doi:10.9734/jgeesi/2024/v28i10827. [Google Scholar] [CrossRef]
14. Niranjana T, James EJ, George C. Assessment of groundwater potential zones in Periyar River Basin using GIS and AHP techniques. Libr Prog Int. 2024;44(3):2473–80. [Google Scholar]
15. Zewdie MM, Kasie LA, Bogale S. Groundwater potential zones delineation using GIS and AHP techniques in upper parts of Chemoga watershed, Ethiopia. Appl Water Sci. 2024;14:85. doi:10.1007/s13201-024-02119-0. [Google Scholar] [CrossRef]
16. Midaoui A, El-Hamdouny M, Elaloui A, Karroum M, Boudhar A, Lahrach A. Groundwater potential assessment in the Upper Oum Er-Rbia Basin, Northern Morocco. Ecol Eng Environ Technol. 2024;25(6):27–42. doi:10.12912/27197050/186547. [Google Scholar] [CrossRef]
17. Agli S, Ahmed A, Abdellah A, Abdelouahed F, Moujane S, Salma K, et al. Delineation of groundwater storage and recharge potential zones using multi-influencing factors (MIF) method: application in synclinal coastal basin of Essaouira (Western High Atlas of Morocco). Geomat Environ Eng. 2024;18(4):117–45. doi:10.7494/geom.2024.18.4.117. [Google Scholar] [CrossRef]
18. Handique A, Dey P, Kumar P. Integration of geospatial techniques and analytical hierarchy process (AHP) ind demarcating groundwater potential zones in Lakhimpur district, Assam, India. Geogr Environ Sustain. 2024;17(3):109–25. doi:10.24057/2071-9388-2024-3208. [Google Scholar] [CrossRef]
19. Layati E, Lahlou N, Elkbichi O, El Ghachi M. Extraction et classification des crues de références journalières dans le bassin versant de l’Oued Lakhdar (Haut Atlas Central, Maroc) face à l’influence des conditions climatiques (1974–2021). Rev Int Sur L’eau Et Le Développement Durable. 2024;3:65–85. (In French). [Google Scholar]
20. Layati E, El Ghachi M. Quantitative analysis of the morphometric parameters of the Oued Lakhdar watershed (Moroccostatistical and GIS approaches, Sciendo, MAASI. In: Proceedings of the 1st International Conference on Water and Earth Sciences (ICWES’22); 2022 May 20–22; Istanbul, Turkey. doi:10.2478/9788367405270-007. [Google Scholar] [CrossRef]
21. Saaty TL. The analytic hierarchy process: planning, priority setting. New York, NY, USA: McGraw Hill; 1980. p. 97–8. [Google Scholar]
22. Phoemphon W, Terakulsatit B. Assessment of groundwater potential zones and mapping using GIS/RS techniques and analytic hierarchy process: a case study on saline soil area, Nakhon Ratchasima. Thailand AIMS Geosci. 2022;9(1):49–67. doi:10.3934/geosci.2023004. [Google Scholar] [CrossRef]
23. Anteneh ZL, Alemu MM, Bawoke GT, Kehali AT, Fenta MC, Desta MT. Appraising groundwater potential zones using geospatial and multi-criteria decision analysis (MCDA) techniques in Andasa-Tul watershed, Upper Blue Nile basin, Ethiopia. Environ Earth Sci. 2022;81:14. doi:10.1007/s12665-021-10083-0. [Google Scholar] [CrossRef]
24. Bulbula ST, Serur AB. Groundwater potential and recharge zone mapping using GIS and remote sensing techniques: the Melka Kunture Watershed in Ethiopia. Discov Sustain. 2024;5:328. doi:10.1007/s43621-024-00521-x. [Google Scholar] [CrossRef]
25. Zenande N, Adesola GO, Madi K, Gwavava O. Groundwater potential assessment in the Eastern Cape, South Africa, using analytical hierarchical process (AHP) technique. Sustain Water Resour Manag. 2024;10:188. doi:10.1007/s40899-024-01166-4. [Google Scholar] [CrossRef]
26. Thakuriah G. Geospatial and analytical hierarchical process approach for potential sites of water harvesting in lower Kulsi basin. India GeoScape. 2023;17(1):58–73. doi:10.2478/geosc-2023-0005. [Google Scholar] [CrossRef]
27. Mussa MM, Lohani TK, Eshete AA. Evaluation of groundwater potential zones using GIS-based machine learning ensemble models in the Gidabo Watershed, Ethiopia. Glob Chall. 2024;8(12):2400137. doi:10.1002/gch2.202400137. [Google Scholar] [PubMed] [CrossRef]
28. Kom KP, Gurugnanam B, Sunitha V. Delineation of groundwater potential zones using GIS and AHP techniques in Coimbatore district, South India. Int J Energy Water Resour. 2024;8(1):85–109. doi:10.1007/s42108-022-00188-y. [Google Scholar] [CrossRef]
29. Uc Castillo JL, Martínez Cruz DA, Ramos Leal JA, Tuxpan Vargas J, Rodríguez Tapia SA, Marín Celestino AE. Delineation of groundwater potential zones (GWPZs) in a semi-arid basin through remote sensing, GIS, and AHP approaches. Water. 2022;14(13):2138. doi:10.3390/w14132138. [Google Scholar] [CrossRef]
30. Siddik MS, Tulip SS, Rahman A, Islam MN, Haghighi AT, Mustafa SMT. The impact of land use and land cover changeon groundwater recharge in northwestern Bangladesh. J Environ Manage. 2022;315:115130. doi:10.1016/j.jenvman.2022.115130. [Google Scholar] [PubMed] [CrossRef]
31. Asrade TM. Groundwater potential mapping and its sustainable management using AHP and FR models in the Jedeb watershed, Upper Blue Nile Basin, Ethiopia. Water Supply. 2024;24(10):3617–38. doi:10.2166/ws.2024.226. [Google Scholar] [CrossRef]
32. Layati E, El Ghachi M. Oued Lakhdar watershed (Moroccomonitoring land use/cover changes: remote sensing and GIS approach. Geol Ecol Landsc. 2024;1959:1–13. doi:10.1080/24749508.2024.2395204. [Google Scholar] [CrossRef]
33. Fenta AA, Kifle A, Gebreyohannes T, Hailu G. Spatial analysis of groundwater potential using remote sensing and GIS-based multi-criteria evaluation in Raya Valley, northern Ethiopia. Hydrogeol J. 2015;23:195–206. doi:10.1007/s10040-014-1198-x. [Google Scholar] [CrossRef]
34. Layati E, Ouigmane A, de Carvalho AM, Bagyaraj M, Qadem A, El Ghachi M. Contribution of GIS and remote sensing to study and analyze the physiographic characteristics of the Oued El-Abid Watershed (Central High Atlas, Morocco). Pap Appl Geogr. 2022;8(2):146–62. doi:10.1080/23754931.2021.1973545. [Google Scholar] [CrossRef]
35. Hazem GA, Vishwakarma DK, Alsafadi K, Bindajam AA, Mallick J, Mallick SK, et al. GIS-based multi-criteria decision making for delineation of potential groundwater recharge zones for sustainable resource management in the Eastern Mediterranean: a case study. Appl Water Sci. 2024;14:160. doi:10.1007/s13201-024-02217-z. [Google Scholar] [CrossRef]
36. Taher M, Mourabit T, Etebaai I, Dekkaki HC, Amarjouf N, Amine A, et al. Identification of groundwater potential zones (GWPZ) using geospatial techniques and AHP method: a case study of the Boudinar Basin, Rif Belt (Morocco). Geomat Environ Eng. 2023;17(3):83–105. doi:10.7494/geom.2023.17.3.83. [Google Scholar] [CrossRef]
37. Chorley RJ. Introduction to physical hydrology. Abingdon, UK: Talylor Francis Group; 1969. 211 p. [Google Scholar]
38. Mazzourh A, Taher M, Ouhadi A, Dakak H, Dekkaki HC. Mapping groundwater-potential zones using geospatial and decision-making approaches: case study of Ghiss-Nekkour Watershed in Northeastern Morocco. Geomat Environ Eng. 2024;18(6):47–71. doi:10.7494/geom.2024.18.6.47. [Google Scholar] [CrossRef]
39. Agarwal R, Garg PK. Remote sensing and GIS based groundwater potential & recharge zones mapping using multi-criteria decision making technique. Water Resour Manage. 2016;30(1):243–60. doi:10.1007/s11269-015-1159-8. [Google Scholar] [CrossRef]
40. Tolche AD. Groundwater potential mapping using geospatial techniques: a case study of Dhungeta-Ramis sub-basin, Ethiopia. Geol Ecol Landsc. 2021;5(1):65–80. doi:10.1080/24749508. [Google Scholar] [CrossRef]
41. Das S, Mukherjee J, Bhattacharyya S, Patel PP, Banerjee A. Detection of groundwater potential zones using analytical hierarchical process (AHP) for a tropical river basin in the Western Ghats of India. Environ Earth Sci. 2022;81(16):416. doi:10.1007/s12665-022-10543-1. [Google Scholar] [CrossRef]
42. Morgan H, Madani A, Hussien HM, Nassar T. Using an ensemble machine learning model to delineate groundwater potential zones in desert fringes of East Esna-Idfu area, Nile valley, Upper Egypt. Geosci Lett. 2023;10(1):9. doi:10.1186/s40562-023-00261-2. [Google Scholar] [CrossRef]
43. Roy S, Hazra S, Chanda A, Das S. Assessment of groundwater potential zones using multi-criteria decision-making technique: a microlevel case study from red and lateritic zone (RLZ) of West Bengal, India. Sustain Water Resour Manage. 2020;6:1–14. doi:10.1007/s40899-020-00373-z. [Google Scholar] [CrossRef]
44. Hagos Y, Bedaso Z, Kebede M. Delineating groundwater potential zones using geospatial and analytical hierarchy process techniques in the upper omo-gibe basin, Ethiopia. Revue Internationale de Geomatique. 2024;33(1):399–425. doi:10.32604/rig.2024.053975. [Google Scholar] [CrossRef]
45. Arumugam M, Kulandaisamy P, Karthikeyan S, Thangaraj K, Senapathi V, Chung SY, et al. An assessment of geospatial analysis combined with AHP techniques to identify groundwater potential zones in the Pudukkottai District, Tamil Nadu, India. Water. 2023;15:1101. doi:10.3390/w15061101. [Google Scholar] [CrossRef]
Cite This Article
 Copyright © 2025 The Author(s). Published by Tech Science Press.
This work is licensed under a Creative Commons Attribution 4.0 International License , which permits unrestricted use, distribution, and reproduction in any medium, provided the original work is properly cited.
 Downloads
 Citation Tools