
 Submit a Paper
 Propose a Special lssue
 Open Access
ARTICLE

Assessing the Impact of Urban Green Spaces on Land Surface Temperature in Shah Alam and Putrajaya
1 School of Geomatics and Natural Resources, College of Built Environment, Universiti Teknologi MARA, Shah Alam, 40450, Selangor, Malaysia
2 Rosmin Talib Planning Consultant (RTPC), 21-2, Jalan Lengkuas B 16/B, Rimba Jaya, Shah Alam, 41300, Selangor, Malaysia
* Corresponding Author: Nafisah Khalid. Email:
(This article belongs to the Special Issue: Advancements in Geospatial Methods and Technologies for Sustainable Built Environment and Engineering)
Revue Internationale de Géomatique 2025, 34, 603-617. https://doi.org/10.32604/rig.2025.065369
Received 11 March 2025; Accepted 14 July 2025; Issue published 06 August 2025
 View Full Text
 Download PDF
Abstract
Urban green spaces (UGS) play a crucial role in promoting ecological, social, and environmental sustainability. UGS play a key role in reducing land surface temperature (LST) in rapidly urbanizing areas, thereby mitigating the urban heat island (UHI) effect. This paper conducts an extensive analysis of land use, Normalized Difference Vegetation Index (NDVI), and LST to examine the influence of the environmental landscapes of Shah Alam and Putrajaya from 2014 to 2023 on the variation of LST. In 2014, NDVI values in Shah Alam ranged from 0.35 to 0.50, fluctuating to 0.32 to 0.48 in 2023. Conversely, Putrajaya maintained a more stable NDVI range, from 0.40 to 0.52 in 2014 and 0.39 to 0.51 in 2023. Variations in LST reveal the thermal dynamics of both regions, with Shah Alam showing noticeable temperature increases. In 2014, Shah Alam’s LST ranged from 22°C to 32°C, rising to 25°C to 33°C in 2023. Highlighting the cooling effect of UGS, the study identified a moderate inverse correlation between NDVI and LST. Putrajaya’s planned urban greening initiatives outperformed Shah Alam’s scattered green spaces. The findings suggest that UGS does not solely drive increases in LST. However, integrating green spaces into urban development schemes remains a beneficial practice for improving city livability.Graphic Abstract
Keywords
Greenery, parks, gardens, and street trees define a sustainable and livable city. They provide several environmental, social, and financial benefits, including improved air quality, reduction of the UHI effect, habitats for wildlife, better quality of life for city residents, and economic development [1]. The rapid urbanization in Malaysia in recent years has made urban green spaces (UGS) increasingly significant. Malaysia has undergone rapid urbanization over the past few decades, with the percentage of people living in urban areas increasing from 28.4% in 1970 to 50.7% in 1991 and reaching 75.1% in 2020, as reported by the Selangor Journal on 20 March 2024. The rapid urbanization has transformed green spaces into highly populated cities, leading to a reduction in green areas and intensifying the UHI effect [2]. To manage and expand urban green spaces, the Malaysian government has introduced several policies and projects aimed at addressing these challenges. The National Landscape Policy, launched in 2011, is among the most notable initiatives, aiming to incorporate green spaces into urban development and design. Emphasizing the importance of prioritizing natural and cultural heritage, supporting sustainable development, and ensuring equitable access to green spaces for all citizens, the policy outlines the principles and guidelines for the creation and maintenance of urban green spaces in Malaysia.
Each UGS design aimed to improve the urban environment and support the well-being [3]. These green spaces are ideally positioned near cities, as their strategic proximity ensures easy access for urban residents [4]. This closeness encourages their frequent use, maximizing the benefits they offer. In terms of form and scale, Malaysian urban green spaces demonstrate a wide range. While some are large urban forests or extensive green areas providing greater ecological and recreational value, others are small pocket parks designed to fit into existing urban landscapes [5]. The diversity in shape and size enables green space designs within metropolitan areas to meet various needs and preferences. According to previous research, UGS have emerged as clear solutions for mitigating the UHI effect. Ref. [6] conducted studies emphasizing the crucial role these spaces play in lowering temperatures and mitigating the UHI effect. Their findings show that evaporative cooling and shade from trees and other plants significantly reduce ambient city temperatures [6,7]. Evapotranspiration cools the surrounding air and reduces local temperatures. Consequently, the UHI effect diminishes, enhancing thermal comfort for city inhabitants [8]. Ref. [9] further emphasised how green spaces influence the urban microclimate and help lessen the heat island effect. Their studies reveal that urban vegetation can alter the surface energy balance, lowering the Land Surface Temperature (LST). Green spaces absorb less heat compared to impervious surfaces such as concrete or asphalt, thus reducing the overall heat storage capacity in urban areas. This decreased surface temperature not only counteracts the UHI effect but also creates a more pleasant and balanced metropolitan environment.
LST has been extensively measured both globally and locally using remote sensing and Geographic Information Systems (GIS). These methods monitor surface earth radiance across multiple wavelengths, including the thermal infrared range, through satellite imagery. Algorithms that consider surface emissivity, atmospheric effects, and other factors convert the radiance data into temperature values [10]. Landsat’s thermal band, operated by the US Geological Survey (USGS) satellites for earth observation, is among the most frequently used sensors for LST monitoring. Additionally, the Advanced Spaceborne Thermal Emission and Reflection Radiometer (ASTER) and the Moderate Resolution Imaging Spectroradiometer (MODIS) have also been employed for monitoring and assessing LST [11,12]. These sensors enable local and international tracking of LST, providing a broader perspective on its spatial trends.
Ref. [13] has investigated how cumulative green spaces affect the LST. Their study shows that built-up areas have a greater influence on the LST than green ones. They conclude that although green spaces, especially highly vegetated areas, can help reduce high temperatures in metropolitan regions, built-up areas generally raise the LST. Ref. [14] also agreed with this and state that GIS techniques provide a robust means to evaluate LST at various levels, enabling research into the interaction between LST and many environmental elements, including urban green spaces.
Refs. [15,16] stated that LST does not have a direct impact from UGS alone, but also from many landscape factors. However, incorporating green spaces into development plans is a good practice for reducing the effects of UHI and enhancing livability [17]. Ref. [18] suggested that future research should explore seasonal variations in NDVI-LST relationships by integrating additional environmental variables such as soil moisture and precipitation.
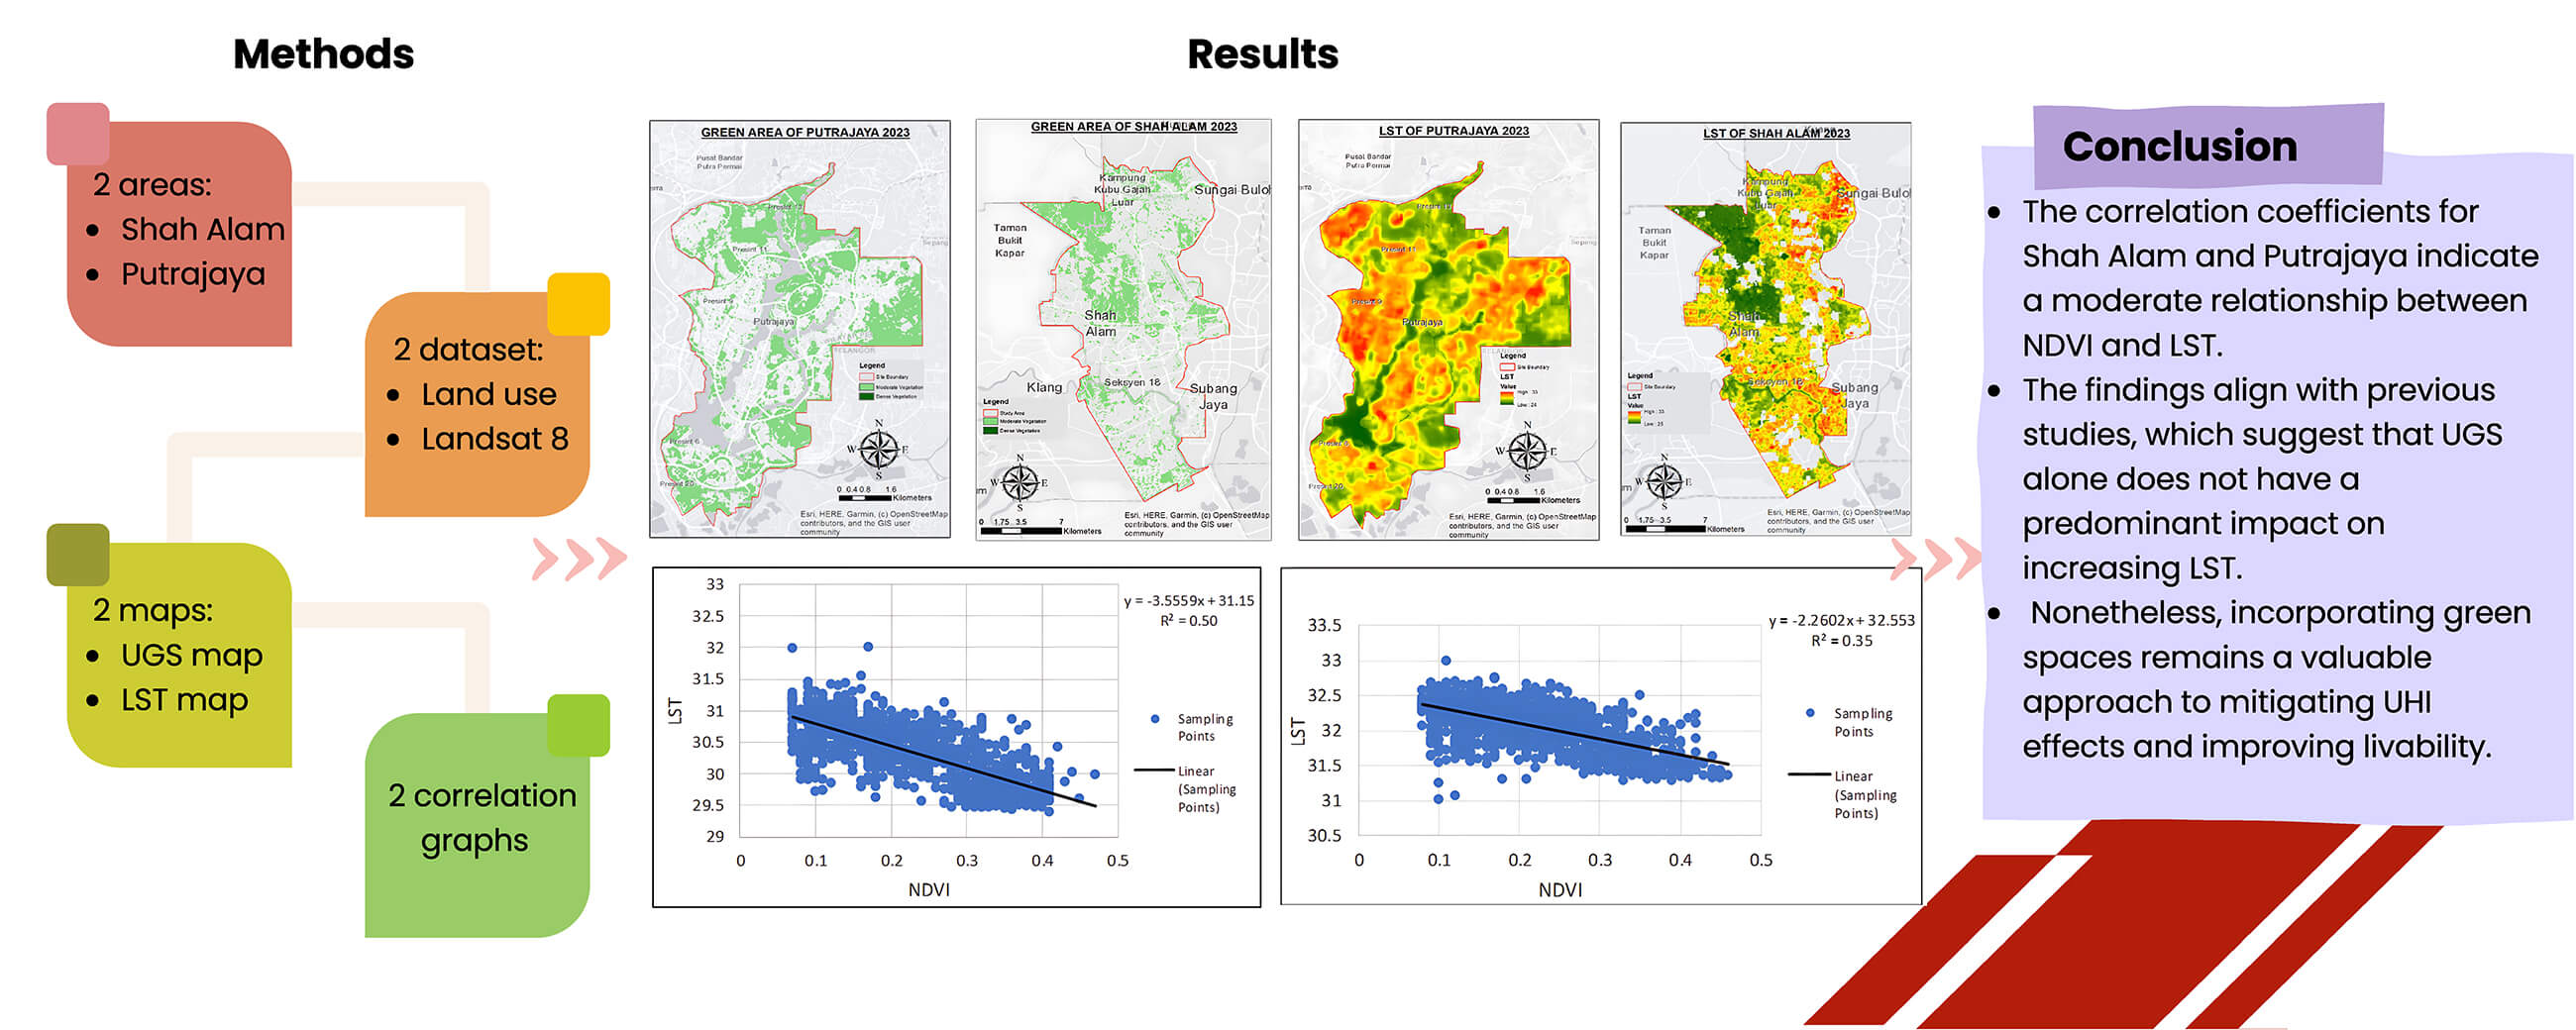
This study employs a quantitative approach to evaluate the impact of UGS on LST in Shah Alam and Putrajaya, Malaysia. The methodology involves several key steps, including data collection, data processing, and analysis, as shown in Fig. 1.

Figure 1: Research workflow
This study covers two regions: Shah Alam and Putrajaya, as shown in Fig. 2. Both areas have subtle differences in the design of urban green spaces.

Figure 2: Study area
Shah Alam is the capital of Selangor State in Malaysia and is currently the third most populous city in the country. Shah Alam City was initially planned and developed in 1978. The 2035 Local Plan states that the city limits cover 30,310.72 hectares at 3°4′20″ N, 101°31′ E.
Putrajaya was initially designed as a planned city in 1995 and has developed into a major center of government operations and infrastructure, covering a total area of 49.5 km2. Putrajaya’s master plan states that a visually appealing urban environment is created by a lively and sustainable city that combines the environment with technology. As a result, there has been a noticeable reduction in green spaces in the town in recent years, emphasizing the need for comprehensive research and conservation efforts to protect and enhance its urban vegetation.
Two (2) datasets were used in this study, which are land use data from PLANMalaysia and Landsat 8 satellite images for 2014 and 2023. Landsat 8 images were captured in March 2023 and April 2014, covering the geographic areas of Shah Alam and Putrajaya. These specific dates were chosen to facilitate a detailed investigation of variations in land cover and vegetation throughout the study.
Landsat 8 imagery was pre-processed to ensure data integrity and facilitate accurate environmental analysis. The initial step involved aggregating Bands 1 through 7 into a single composite layer in ArcGIS, followed by raster data clipping to focus on the Shah Alam and Putrajaya study areas. This pre-processing supported the analysis of key environmental indicators, including the NDVI, Fractional Vegetation Cover (FVC), and LST. For land cover classification, Bands 4 (red) and 5 (near-infrared) were utilized, and the Maximum Likelihood classification algorithm was employed for its robustness in differentiating land cover types based on spectral characteristics. Validation was performed using the K-means clustering method with a random sampling of 50 points, achieving a classification accuracy of 85%.
2.2.2 Extracting Green Spaces from Land Use Data
The “Select by Attribute” tool was used to select open spaces, recreational areas, and forest areas from land-use statistics. Highlighting the distribution of open spaces and forested areas within the dataset, the resulting layer is shown by blue polygons as shown in Fig. 3.

Figure 3: Green spaces selection from land use data
2.2.3 Normalized Difference Vegetation Index (NDVI) Fractional Vegetation Cover (FVC) Calculation
In remote sensing, NDVI is a commonly used index that provides valuable insights into vegetation density and health by analyzing changes in the near-infrared and red spectral bands, as shown in Eq. (1). This formula utilizes the contrast between the near-infrared and red bands to generate a normalized index that is particularly sensitive to the greenness and health of vegetation.
FVC was calculated to enhance the assessment of soil and vegetation variations. As shown in Eq. (2), the differences in NDVI values for soil and vegetation were calculated to acquire the FVC value.
Integrating these indices enhances the description of vegetation cover, health, and distribution patterns within the research area. NDVI and FVC together offer a multi-dimensional perspective of the vegetative landscape, fostering a more nuanced understanding of the environmental dynamics under study.
2.2.4 Land Surface Temperature (LST)
LST provides insight into the surface temperature of the Earth and its fluctuations within the study region. This study calculates LST using the Split-windows algorithm (SWA) approach with FVC, where this method estimates LST from thermal infrared (TIR) value [19]. The procedure consists of the following main stages:
i. Conversion to Top of Atmosphere (TOA) Radiance:
The first stage involves converting the digital numbers from the thermal infrared band into TOA radiance as shown in Eq. (3). When converting raw digital numbers to TOA radiance, the Multiplicative Level (ML) functions as the gain factor, the Calibrated Digital Number (Qcal) represents the adjusted digital value, and the Additive Level (AL) serves as the offset constant to ensure accuracy.
ii. Conversion to TOA Brightness Temperature (BT):
Then convert TOA radiance to TOA BT. Using Eq. (4), this step is crucial for removing atmospheric effects and obtaining temperature values closer to the Earth’s surface.
iii. Land Surface Emissivity (LSE):
The LSE explains the efficiency of Earth’s surface in radiating thermal energy. This is important because various surfaces display different emissivity properties. Using Eq. (5), emissivity is incorporated into the calculation to enhance the accuracy of temperature estimation.
iv. Final LST Calculation:
The final stage involves the LST computation using Eq. (6). Applying the modified emissivity to the TOA brightness temperature helps to fully depict the surface temperature of the Earth over the study area.
These sequential steps collectively facilitate the precise estimation of LST, enabling a clearer understanding of temperature fluctuations and their relationship with factors such as vegetation cover within the studied region.
3.1 Green Spaces Extracted from Land Use Data
Fig. 4 shows the distribution of green spaces extracted from land use data obtained from PLANMalaysia for the year 2023, with (a) illustrating the green spaces distribution of Shah Alam and (b) displaying the green area distribution for Putrajaya.

Figure 4: Green area extracted from land use data for (a) Shah Alam, (b) Putrajaya
In Shah Alam, the forest category stands out as the largest green area, particularly within the reserve forest adjacent to Botanic Park Shah Alam, covering 3414.32 ha or 11.16% of the total area. Conversely, agriculture represents the lowest land use, accounting for 795.86 ha or 2.60%. The total green area, including forests, agriculture, open spaces, and recreational areas, amounts to 5560.53 ha, which is 18.18% of the total land area.
In Putrajaya, the total area of green spaces, including open areas and recreational zones, covers 1311.09 ha, representing 26.58% of the overall land area. The largest green spaces are located in Taman Botani and Taman Putra Perdana, highlighting the city’s dedication to conserving substantial green spaces amid various development activities.
3.2 Green Spaces Derived from NDVI
NDVI has been classified into two (2) categories. The basis for the breakpoints is established on traditional methods of vegetation classification as defined by [20]. An NDVI value of more than 0.5 indicates a healthy, dense forest area, while a value between 0.3 and 0.5 represents moderate vegetation, such as parks and grasslands. This classification provides a clear separation between moderately vegetated and densely vegetated surfaces, enabling a more precise interpretation of green cover. Fig. 5 illustrates that the total green area in Shah Alam in 2014 was 28.47%, which decreased to 26.08% in 2023, with fragmentation observable in the top-right section of the 2023 map.
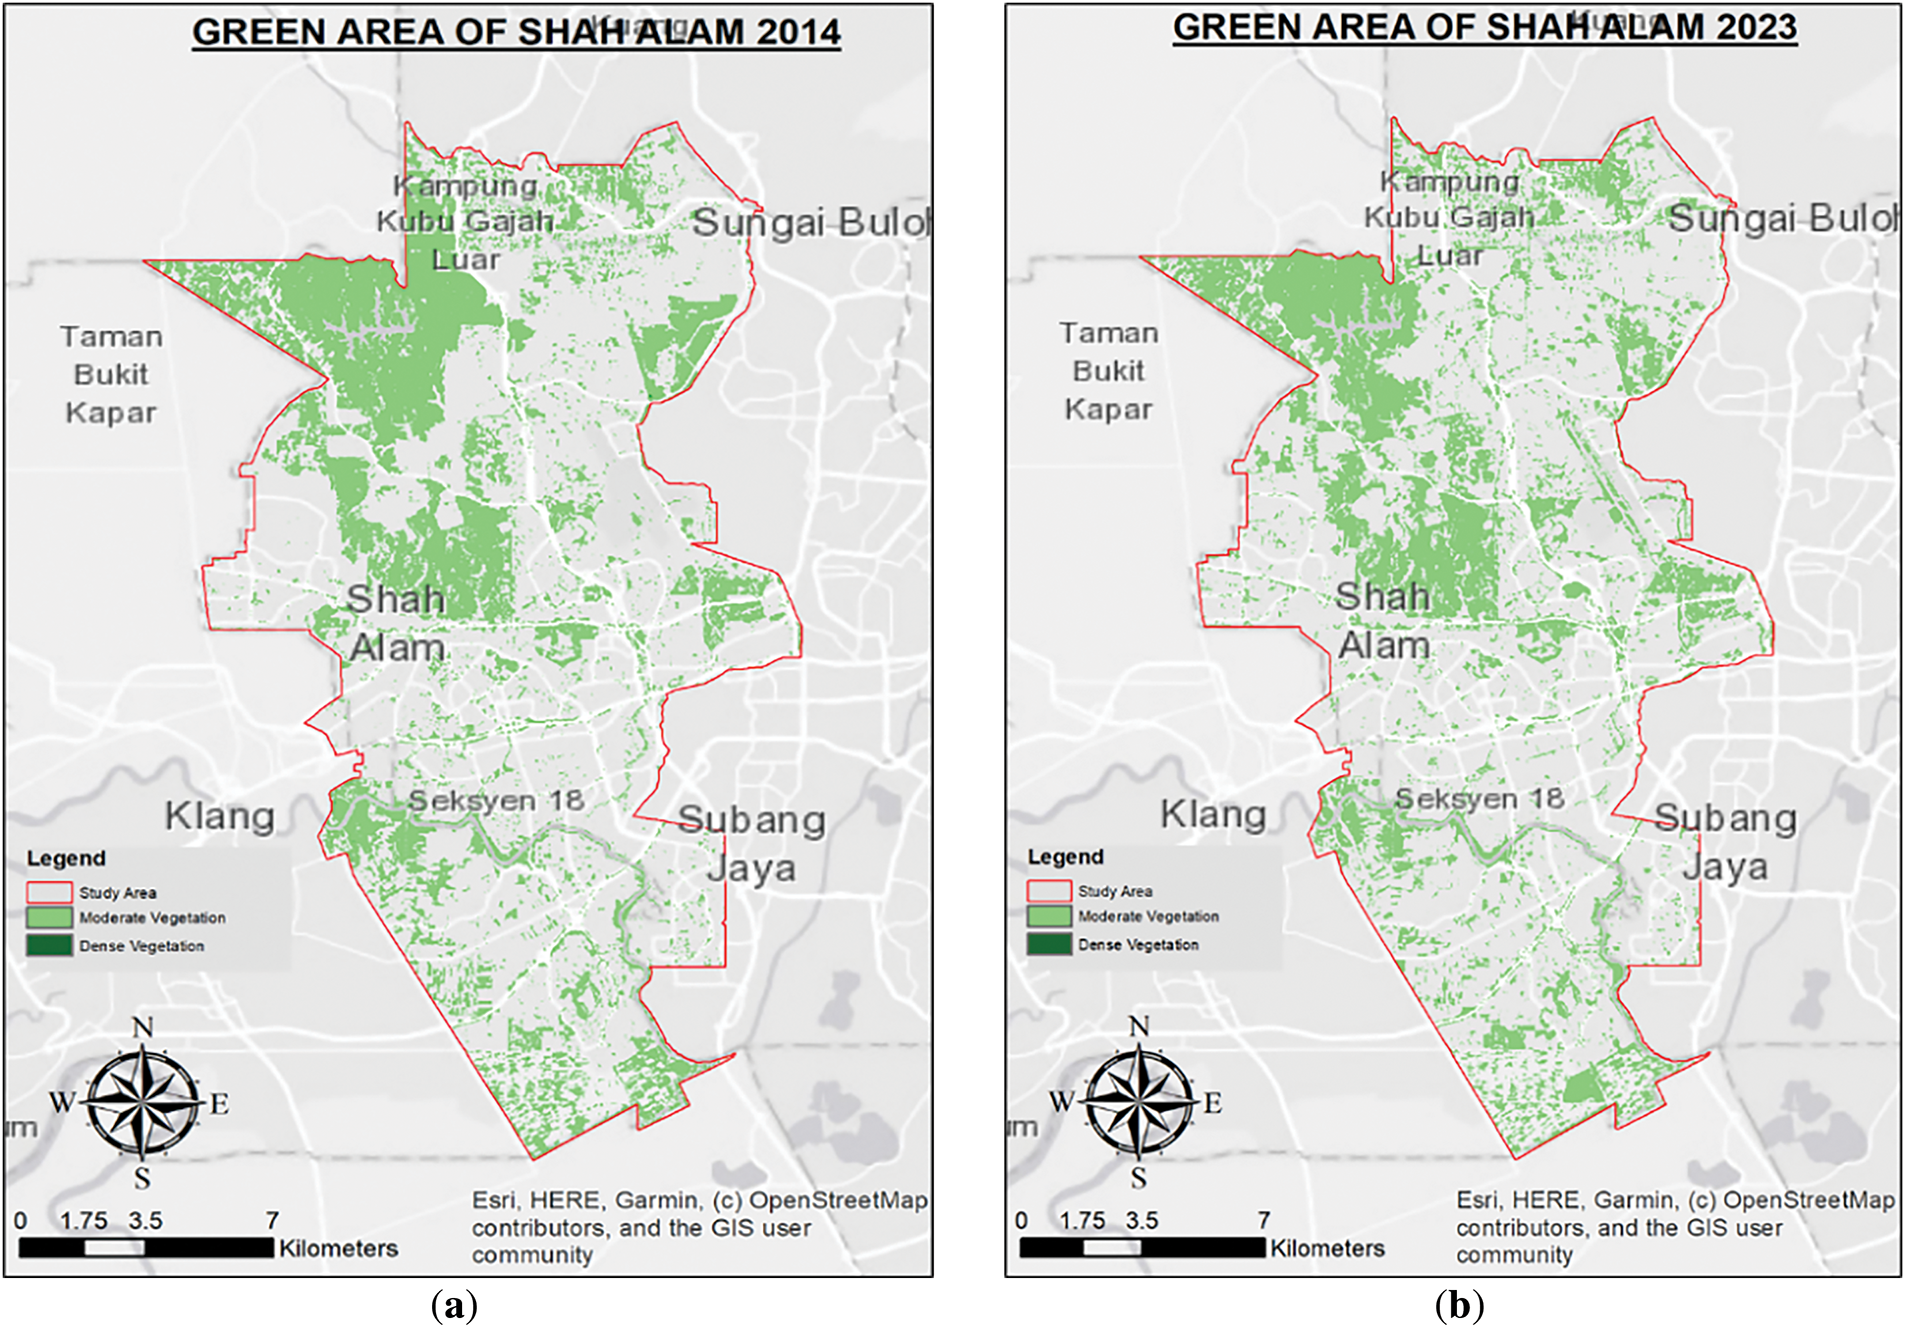
Figure 5: Green area of Shah Alam derived from NDVI for (a) Year 2014, (b) Year 2023
As illustrated in Fig. 6, this study reveals that the total green area in Putrajaya in 2014 constituted 21.57% of the region. Moving to 2023, the focus shifts to Putrajaya’s green spaces using a comprehensive dataset derived from Landsat 8 satellite imagery. It’s essential to note that the initial assessment for 2023 revealed an increase in the total coverage of green areas to 36.36%. The results also showed that dense vegetation with an NDVI value of more than 0.5 was mapped in Putrajaya in 2014, but the NDVI value decreased to less than 0.5 by 2023.

Figure 6: Green area of Putrajaya derived from NDVI for (a) Year 2014, (b) Year 2023
3.3 Land Surface Temperature Map
LST maps for Shah Alam in 2014 and 2023 are shown in Fig. 7a. The findings revealed that the lowest temperature recorded was 22°C, and the highest temperature in 2014 was 32°C. This temperature range helps to understand the thermal fluctuations Shah Alam experienced in 2014. In 2023, the recorded minimum temperature was 25°C, and the peak temperature reached 33°C. These temperature readings illustrate the range of temperatures Shah Alam experienced in that year, providing insight into the thermal environment there.

Figure 7: Land surface temperature of Shah Alam for (a) Year 2014, (b) Year 2023
The LST maps for Putrajaya in 2014 and 2023 are shown in Fig. 8a,b, respectively. The recorded temperatures ranged from a minimum of 24°C to a maximum of 33°C in both years. These temperature data offer an overview of the thermal conditions in Putrajaya during the respective years, highlighting the range of temperatures observed in the area.

Figure 8: Land surface temperature of Putrajaya for (a) Year 2014, (b) Year 2023
Comparatively, between Shah Alam and Putrajaya from 2014 to 2023, LST reveals distinct temperature patterns in both regions. In Shah Alam, the LST ranged from 22°C to 32°C in 2014, while in 2023, it slightly changed to between 25°C and 33°C. Conversely, Putrajaya exhibited a larger temperature range in 2014, ranging from 24°C to 33°C, and maintained this range in 2023. These findings imply different temperature dynamics between the two sites, with Shah Alam experiencing a wider temperature variation over the years. Influenced by urbanization, land use, and environmental changes, the recorded temperatures reflect the climatic conditions of each region. Understanding these temperature variations can aid in implementing sensible urban design and environmental management strategies in Shah Alam and Putrajaya.
In Fig. 9, the correlation between NDVI and LST in Shah Alam, as determined by linear regression, reveals an inverse relationship. The scatter plot indicates a moderate relationship between NDVI and LST, with an R2 value of 0.50. The data suggests that as NDVI values, which represent vegetation density, increase, temperatures decrease. For example, when the NDVI value is 0.1, the temperature is approximately 32°C, whereas a higher NDVI value of 0.4 corresponds to a lower temperature of 22°C. This correlation implies a cooling effect associated with increased vegetation density in Shah Alam.

Figure 9: Correlation between NDVI and LST in Shah Alam
The R2 value of 0.50 indicates that approximately 50% of the variation in LST can be attributed to the variation in NDVI. Additionally, the standard deviations of 0.11 for NDVI and 0.50 for LST provide insight into the variation of the respective datasets. Overall, these results emphasize the impact of green areas on local temperatures in Shah Alam.
In Fig. 10, the correlation between NDVI and LST in Putrajaya is presented. The data suggests that as NDVI values increase, signifying a higher presence of green spaces, there is a corresponding decrease in temperatures. For example, at an NDVI value of 0.1, the temperature is recorded at 33°C, while a slightly lower temperature of 24°C is associated with an NDVI value of 0.4. This correlation highlights the relationship between increased vegetation density, represented by higher NDVI values, and reduced temperatures, emphasizing the cooling effect of green spaces in Putrajaya.

Figure 10: Correlation between NDVI and LST in Putrajaya
The statistical parameters obtained from the analysis offer further insights into this correlation. The R2 value of 0.35 suggests that around 35% of the variability in LST can be attributed to the variability in NDVI, indicating a moderate correlation comparable to that observed in the Shah Alam region. Overall, these findings shed light on the complex relationship between vegetation density and temperature dynamics in Putrajaya, thereby enhancing our understanding of the local environmental conditions and the role of UGS in influencing the LST.
3.4 Comparison of Green Spaces Derived from Land Use and Landsat 8 Imagery
Green spaces in Shah Alam and Putrajaya, extracted from land use data obtained from PLANMalaysia and NDVI derived from Landsat 8, are notably shown in Table 1.
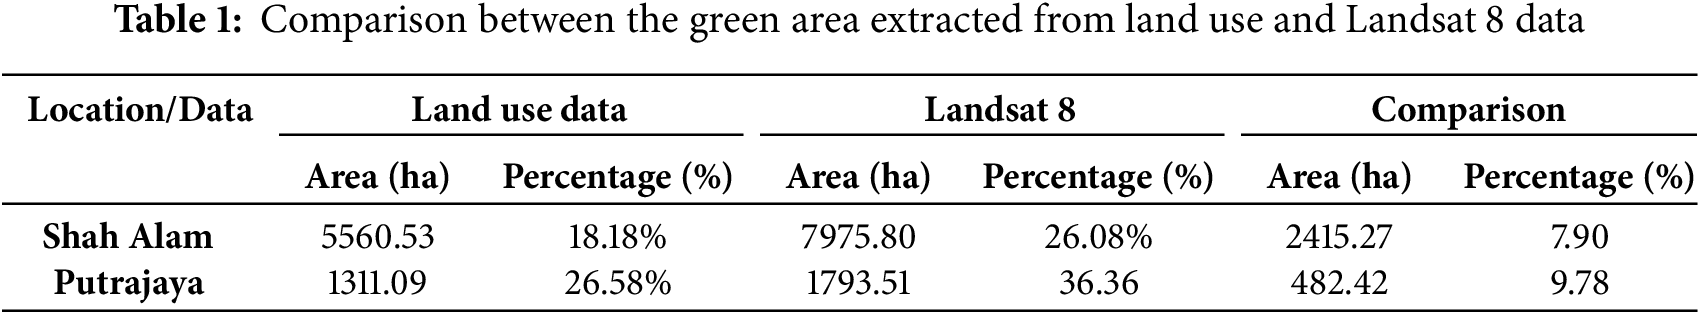
In Shah Alam, extracted green spaces from land use data account for an area of 5560.53 ha, constituting 18.18% of the total area. In comparison, green spaces extracted from Landsat 8 imagery indicate a larger green coverage of 7975.80 ha, accounting for 26.08%. This difference in area amounts to 2415.27 ha, representing a percentage discrepancy of 7.90%. Similarly, in Putrajaya, green spaces extracted from land use data report a total of 1311.09 ha (26.58%), whereas green spaces from Landsat 8 imagery depict a more extensive green cover of 1793.51 ha (36.36%). The area variance in Putrajaya is 482.42 ha, corresponding to a percentage discrepancy of 9.78%. The dissimilarity in data arises from the different methodologies used for data collection and classification. Land use data obtained from PLANMalaysia derives from land titles, providing detailed insights into land use, while Landsat 8 imagery offers a broader perspective on land cover based on spectral analysis.
The findings of this study reveal subtle shifts in land use and land cover in Shah Alam and Putrajaya over the examined period, offering a comprehensive understanding of the changing landscapes. The NDVI analyses show variations in vegetation health and distribution, emphasizing the need for ongoing monitoring to maintain ecological resilience. Specifically, the NDVI values for Shah Alam ranged from 0.35 to 0.50 in 2014 and slightly declined to 0.32 to 0.48 in 2023, indicating changes in vegetation density. Conversely, Putrajaya exhibited a more stable NDVI range, fluctuating from 0.40 to 0.52 in 2014 to 0.39 to 0.51 in 2023.
The LST analysis reveals significant temperature variations, with Shah Alam experiencing an apparent increase over the years. In 2014, the LST ranged from 22°C to 32°C, rising to 25°C to 33°C in 2023. Conversely, Putrajaya exhibited a relatively stable LST, fluctuating between 24°C and 33°C in both 2014 and 2023. The correlation analysis between NDVI and LST highlights the influential role of vegetation in reducing urban temperature fluctuations. The correlation coefficients for Shah Alam and Putrajaya indicate a moderate relationship between NDVI and LST. The findings align with previous studies, which suggest that UGS alone does not have a predominant impact on increasing LST. Instead, the increase in LST is also affected by various landscape factors such as built-up areas. Nonetheless, incorporating green spaces remains a valuable approach to mitigating UHI effects and improving livability.
The effect of urban green spaces on LST in Shah Alam and Putrajaya has been thoroughly examined in this study. It offers new insights into the spatial dynamics of green spaces and their cooling effects on urban temperatures through the integration of remote sensing and GIS. The results provide a comprehensive view of the changes in the surroundings, revealing minor alterations in land cover and land use in Shah Alam and Putrajaya over the period studied. The NDVI analyses highlight changes in vegetation condition and distribution, emphasizing the need for ongoing observation to ensure ecological resilience. Specifically, for Shah Alam, the NDVI values suggest a slight decline in vegetation density, while Putrajaya exhibited more stable NDVI levels.
The relationship between NDVI and LST illustrates how greener surroundings help mitigate urban temperature variations. The numerical results highlight the dynamic environmental changes, supporting the need for adaptive strategies to address the various issues caused by urbanization in Shah Alam and Putrajaya. Higher spatial resolution data and ground-based measurements will enable future studies to reflect the benefits of green spaces accurately. This work contributes to the broader discussion on sustainable urban development and climate resilience by enhancing the understanding of the interaction between urban green spaces and land surface temperature.
Acknowledgement: The authors would like to acknowledge the College of Built Environment, Universiti Teknologi MARA and PLANMalaysia for their support and contribution throughout this study.
Funding Statement: The authors received no specific funding for this study.
Author Contributions: Aqeel Shah Abdul Halim Shah carried out the data collection and data processing. Nafisah Khalid provided the idea, revised the article and supervised the research progress. Abdul Rauf Abdul Rasam provided support in analyzing the LST and its relationship with green spaces. All authors reviewed the results and approved the final version of the manuscript.
Availability of Data and Materials: Landsat 8 imagery can be obtained from the USGS website.
Ethics Approval: Not applicable.
Conflicts of Interest: The authors declare no conflicts of interest to report regarding the present study.
References
1. Croce S, Vettorato D. Urban surface uses for climate resilient and sustainable cities: a catalogue of solutions. Sustain Cities Soc. 2021;75(2):103313. doi:10.1016/j.scs.2021.103313. [Google Scholar] [CrossRef]
2. Muhamad Nor AN, Abdul Aziz H, Nawawi SA, Muhammad Jamil R, Abas MA, Hambali KA, et al. Evolution of green space under rapid urban expansion in Southeast Asian cities. Sustainability. 2021;13(21):12024. doi:10.3390/su132112024. [Google Scholar] [CrossRef]
3. Nath TK, Zhe Han SS, Lechner AM. Urban green space and well-being in Kuala Lumpur. Malaysia Urban Urban Green. 2018;36(3):34–41. doi:10.1016/j.ufug.2018.09.013. [Google Scholar] [CrossRef]
4. Aziz NAA, van den Bosch K, Nillson K. Recreational use of urban green space in Malaysian cities. Int J Bus Soc. 2018;19(S1):1–16. [Google Scholar]
5. Balai Kerishnan P, Maruthaveeran S, Maulan S. Investigating the usability pattern and constraints of pocket parks in Kuala Lumpur, Malaysia. Urban Urban Green. 2020;50(3):126647. doi:10.1016/j.ufug.2020.126647. [Google Scholar] [CrossRef]
6. Yang C, He X, Wang R, Yan F, Yu L, Bu K, et al. The effect of urban green spaces on the urban thermal environment and its seasonal variations. Forests. 2017;8(5):153. doi:10.3390/f8050153. [Google Scholar] [CrossRef]
7. Zhou W, Yu W, Zhang Z, Cao W, Wu T. How can urban green spaces be planned to mitigate urban heat island effect under different climatic backgrounds? A threshold-based perspective. Sci Total Environ. 2023;890(5864):164422. doi:10.1016/j.scitotenv.2023.164422. [Google Scholar] [PubMed] [CrossRef]
8. Ren J, Shi K, Li Z, Kong X, Zhou H. A review on the impacts of urban heat islands on outdoor thermal comfort. Buildings. 2023;13(6):1368. doi:10.3390/buildings13061368. [Google Scholar] [CrossRef]
9. Li L, Zha Y, Wang R. Relationship of surface urban heat island with air temperature and precipitation in global large cities. Ecol Indic. 2020;117:106683. doi:10.1016/j.ecolind.2020.106683. [Google Scholar] [CrossRef]
10. Hulley GC, Ghent D, Göttsche FM, Guillevic PC, Mildrexler DJ, Coll C. Land surface temperature. In: Taking the temperature of the earth. Amsterdam, The Netherlands: Elsevier; 2019. p. 57–127. doi:10.1016/b978-0-12-814458-9.00003-4. [Google Scholar] [CrossRef]
11. Hurduc A, Ermida SL, DaCamara CC. On the suitability of different satellite land surface temperature products to study surface urban heat islands. Remote Sens. 2024;16(20):3765. doi:10.3390/rs16203765. [Google Scholar] [CrossRef]
12. Zhao R, Yu W, Deng X, Huang Y, Yang W, Zhou W. Analysis of land surface performance differences and uncertainty in multiple versions of MODIS LST products. Remote Sens. 2024;16(22):4255. doi:10.3390/rs16224255. [Google Scholar] [CrossRef]
13. Isa NA, Wan Mohd WMN, Salleh SA. The effects of built-up and green areas on the land surface temperature of the Kuala Lumpur city. Int Arch Photogramm Remote Sens Spat Inf Sci. 2017;W5:107–12. doi:10.5194/isprs-archives-xlii-4-w5-107-2017. [Google Scholar] [CrossRef]
14. Buyadi SNA, Mohd WMNW, Misni A. Impact of land use changes on the surface temperature distribution of area surrounding the National Botanic Garden, Shah Alam. Procedia-Soc Behav Sci. 2013;101:516–25. doi:10.1016/j.sbspro.2013.07.225. [Google Scholar] [CrossRef]
15. An H, Cai H, Xu X, Qiao Z, Han D. Impacts of urban green space on land surface temperature from urban block perspectives. Remote Sens. 2022;14(18):4580. doi:10.3390/rs14184580. [Google Scholar] [CrossRef]
16. Delgado-Capel MJ, Egea-Cariñanos P, Cariñanos P. Assessing the relationship between land surface temperature and composition elements of urban green spaces during heat waves episodes in Mediterranean Cities. Forests. 2024;15(3):463. doi:10.3390/f15030463. [Google Scholar] [CrossRef]
17. Rahman MM, Hasan J. Evaluating the impact of green spaces on urban heat reduction in Rajshahi, Bangladesh using the invest model. Land. 2024;13(8):1284. doi:10.3390/land13081284. [Google Scholar] [CrossRef]
18. Rahimi E, Dong P, Jung C. Global NDVI-LST correlation: temporal and spatial patterns from 2000 to 2024. Environments. 2025;12(2):67. doi:10.3390/environments12020067. [Google Scholar] [CrossRef]
19. Junaidi SN, Khalid N, Othman AN, Hamid JRA, Saad NM. Analysis of the relationship between forest fire and land surface temperature using Landsat 8 OLI/TIRS imagery. IOP Conf Ser Earth Environ Sci. 2021;767(1):012005. doi:10.1088/1755-1315/767/1/012005. [Google Scholar] [CrossRef]
20. Londhe DS, Katpatal YB, Singh CK, Bokde ND. Assessment of vegetation variation and its response to ENSO and IOD in the semi-arid ecosystem of Western India. J Water Clim Change. 2023;14(8):2642–62. doi:10.2166/wcc.2023.010. [Google Scholar] [CrossRef]
Cite This Article
 Copyright © 2025 The Author(s). Published by Tech Science Press.
This work is licensed under a Creative Commons Attribution 4.0 International License , which permits unrestricted use, distribution, and reproduction in any medium, provided the original work is properly cited.
 Downloads
 Citation Tools