
 Submit a Paper
 Propose a Special lssue
 Open Access
ARTICLE

Evaluating Shannon Entropy-Weighted Bivariate Models and Logistic Regression for Landslide Susceptibility Mapping in Jelapang, Perak, Malaysia
1 Projek Lebuhraya Usahasama Berhad (PLUS), Petaling Jaya, 47301, Malaysia
2 Faculty of Built Environment, Universiti Teknologi MARA, Shah Alam, 40450, Malaysia
* Corresponding Author: Eran S. S. Md Sadek. Email:
(This article belongs to the Special Issue: Advancements in Geospatial Methods and Technologies for Sustainable Built Environment and Engineering)
Revue Internationale de Géomatique 2025, 34, 619-637. https://doi.org/10.32604/rig.2025.065667
Received 19 March 2025; Accepted 15 July 2025; Issue published 06 August 2025
 View Full Text
 Download PDF
Abstract
Landslides are a frequent geomorphological hazard in tropical regions, particularly where steep terrain and high precipitation coincide. This study evaluates landslide susceptibility in the Jelapang area of Perak, Malaysia, using Shannon Entropy-weighted bivariate models (i.e., Frequency Ratio, Information Value, and Weight of Evidence), in comparison with Logistic Regression. Seven conditioning factors were selected based on their geomorphological relevance and tested for multicollinearity: slope gradient, slope aspect, curvature, vegetation cover, lineament density, terrain ruggedness index, and flow accumulation. Each model generated susceptibility maps, which were validated using Receiver Operating Characteristic curves and Area Under the Curve metrics. Logistic Regression yielded the highest predictive accuracy, reflecting its strength in capturing interactions among variables. Among the bivariate models, Frequency Ratio performed best, slightly outperforming the other two methods. Zones of high susceptibility were consistently located along steep slopes, high lineament density areas, and near built environments. The study demonstrates that incorporating Shannon Entropy improves the performance of conventional bivariate methods and provides a useful framework for spatial susceptibility modeling in data-constrained environments. The comparison with Logistic Regression highlights the advantages of multivariate modeling in capturing complex spatial relationships. Limitations of the study include the use of secondary spatial data and the exclusion of dynamic parameters such as rainfall intensity. Future research should incorporate temporal datasets and investigate machine learning techniques to enhance model generalizability and predictive capability.Keywords
Landslide phenomenon occurs when the stability condition of a slope is disturbed either by the increase of stress imposed on the slope and/or by the decrease in strength of the earth material building up the slope. Landslides rank among the most hazardous natural disasters worldwide, posing significant threats to communities and resulting in substantial losses of lives, economic resources, and infrastructure [1].
Landslide susceptibility mapping (LSM) identifies areas prone to landslides by analyzing geological, topographical, hydrological, and environmental factors. These maps serve as essential tools for urban planning, infrastructure development, and disaster preparedness [2]. Since landslides can result in severe damage to infrastructure and loss of life, identifying the key causative or conditioning factors in a given area is essential for mapping landslide-prone zones [3]. Accurate and reliable susceptibility maps enable policymakers to prioritize mitigation strategies and minimize landslide likelihood, ensuring the safety of communities and critical infrastructure [4].
The study area in Jelapang, specifically between KM 260 and KM 266 of the North-South Expressway (NSE), is highly susceptible to landslides due to its steep terrain, intense rainfall, and the presence of critical infrastructure such as the Meru-Menora Tunnel. Located within the Kinta Valley, part of the Western Belt of Peninsular Malaysia, the region is underlain by metasedimentary and granitic bedrock. Geomorphologically, it is characterized by fault-bounded ridges, rugged terrain, and steep slopes. The area experiences a humid tropical climate, receiving over 2500 mm of annual rainfall, which contributes significantly to landslide activity [5,6].
Historically, the Jelapang segment has experienced multiple landslide events, particularly near the Meru-Menora Tunnel, with notable incidents in 2014 and 2017 that caused traffic disruptions and infrastructure damage. These events have positioned this section as a high-priority zone for LSM [5]. The study area spans approximately 840 hectares and is situated along the Titiwangsa mountain range in western Peninsular Malaysia (coordinates: 4.679° N, 101.086° E). Fig. 1 presents the study area’s location and aerial view.

Figure 1: Aerial view of the study area along KM 260–KM 266, North-South Expressway (NSE), Malaysia
Given the NSE’s strategic importance as a major transportation corridor in Malaysia, addressing slope instability in this segment is crucial to ensuring operational safety and reliability. While previous studies have employed heuristic and probabilistic models, limited research has compared statistical methods for LSM within this corridor [5–7].
Despite significant advancements in LSM, no single method has been universally recognized as the definitive approach [8]. Recent studies, such as those by Liu et al. (2022), Khabiri et al. (2023) and Moghimi et al. (2024) have employed deep learning, Bayesian networks and ensemble models to LSM, emphasizing the growing relevance of artificial intelligence (AI) in geohazard assessment [3,4,9]. However, the performance of LSM techniques often varies depending on the study area, data availability, and modeling assumptions.
While machine learning offers substantial potential, traditional statistical approaches remain widely used due to their interpretability, computational efficiency, and adaptability to data-scarce environments. In Malaysia, however, limited studies have rigorously compared bivariate methods optimized through Shannon Entropy with multivariate models such as Logistic Regression, particularly in the context of highway infrastructure [5,7,10–13].
This study intends to address this gap by conducting a comparative analysis of bivariate methods, including Friction Ratio (FR), Information Value (IV) and Weight of Evidence (WoE), against a multivariate method, Logistic Regression. The bivariate models are further enhanced using Shannon Entropy to optimize factor weighting, aiming to improve predictive reliability [14,15]. Model performance is evaluated using Receiver Operating Characteristic (ROC) curves and Area Under the Curve (AUC) metrics.
While methods such as FR, IV, and WoE are well-established, their integration with Shannon Entropy introduces a novel recalibration framework that has been underexplored in Malaysian LSM studies [16,17]. Moreover, the comparative analysis with Logistic Regression further highlights the trade-offs between model complexity, interpretability, and accuracy [18,19]. The selected methods were chosen for their transparency, suitability for limited landslide inventory data, and compatibility with entropy-based optimization. Logistic Regression, in particular, was employed for its ability to capture interactions among variables and generate probabilistic outputs such as features valuable in infrastructure planning and slope hazard assessments.
Although machine learning techniques are gaining popularity in LSM due to their predictive power, they often require large, high-quality datasets and are less transparent, posing challenges in practical engineering applications [20,21]. In contrast, the models used in this study emphasize operational simplicity, computational efficiency, and explainability, which are qualities essential for practitioners and decision-makers responsible for managing critical infrastructure, such as expressways.
In addition to statistical and machine learning approaches, another class of methods gaining prominence for landslide susceptibility mapping along linear infrastructures is physically-based modeling. These models, often grid-based and process-driven, simulate hydrological and geotechnical parameters to estimate landslide initiation. Their advantage lies in providing high-resolution susceptibility predictions for specific slope types and conditions, which can be crucial when assessing risks to road networks. Unlike statistical models that produce smoother outputs, physically-based models can highlight instability at specific points on infrastructure. Applications of such models have been demonstrated in large-scale studies such as Pokharel et al. (2023), showing their effectiveness for scenario-based assessment along extensive transportation corridors [22].
Therefore, this study aims to evaluate the performance of Shannon Entropy-weighted bivariate methods and Logistic Regression in generating accurate and reliable landslide susceptibility maps for the Jelapang region, Perak. The objectives include identifying the conditioning factors influencing landslide susceptibility in the region, deriving landslide susceptibility maps using Shannon Entropy-weighted bivariate methods and Logistic Regression as a multivariate method, and analyzing the performance of the methods used using ROC-AUC as the evaluation metric.
The methodological workflow for this study is illustrated in Fig. 2. It comprises the following key steps: (i) data collection and preprocessing, (ii) selection of landslide conditioning factors, (iii) application of Shannon Entropy-weighted bivariate models and Logistic Regression, (iv) model validation and performance assessment, and (v) interpretation of the results.

Figure 2: Flowchart of methodology
2.1 Data Collection and Preprocessing
Data acquisition involved the collection of various spatial datasets, including a high-resolution Digital Elevation Model (DEM), orthophotos, and a detailed landslide inventory. These datasets were provided by the highway operator, Projek Lebuhraya Usahasama Berhad (PLUS). The DEM was used to derive several topographic indices, including slope gradient, slope aspect, curvature, elevation, terrain ruggedness index (TRI), and flow accumulation. Orthophotos were used to extract land cover information, while lineament density was generated through remote sensing techniques and GIS-based interpretation.
The landslide inventory, provided by PLUS, as shown in Fig. 3, served as the dependent variable for model training and validation. consists of accurately mapped historical landslide events recorded between 2010 and 2023 along KM 260 to KM 266 of the NSE. The inventory was digitized from official PLUS highway incident reports and includes GPS-verified locations of landslide occurrences. Each event was classified into three categories, i.e., recent, reactivated, and dormant, based on site inspection records and chronological evidence. This classification enabled a robust binary encoding of landslide presence vs. absence, which is essential for the construction and validation of susceptibility models.

Figure 3: Landslide inventory map of the study area
Due to the limited spatial extent of the study area (approximately 6 km), site geology and lithology showed minimal variation, being uniformly underlain by granitic bedrock. Geological homogeneity was verified through geological maps and field reports. To prevent model redundancy and collinearity, lithology was excluded from the set of conditioning factors. However, its inclusion is recommended for future regional-scale studies with more heterogeneous geologic settings.
2.2 Selection of Conditioning Factors
Seven (7) conditioning factors were finalized for the analysis based on their geomorphological relevance and data availability: slope gradient, slope aspect, curvature, vegetation cover, lineament density, TRI, and flow accumulation. Initially, over 12 potential factors were considered, but only those meeting multicollinearity criteria and supported by high-resolution data were retained.
Multicollinearity Analysis
A multicollinearity check, using Tolerance (TOL) and Variance Inflation Factor (VIF), is performed to refine the factors by eliminating redundancy [23]. Multicollinearity can negatively impact landslide susceptibility models by inflating standard errors and reducing the significance of regression coefficients, ultimately affecting model accuracy. Eliminating factors with high collinearity is crucial for maintaining consistency in predictive models [24]. Thresholds for concern include a VIF > 10 and a TOL < 0.1, indicating a factor is sensitive to multicollinearity [25,26]. TOL and VIF are computed as per Eqs. (1) and (2).
While more than 12 potential factors were initially considered including soil type, distance to roads, lithology, and land use, the final selection of seven (7) factors was based on three criteria: (i) data availability at high spatial resolution, (ii) geomorphological relevance in the context of Malaysian highway slopes, and (iii) statistical independence as determined by multicollinearity analysis. Due to the spatial constraints of the study area (6 km segment) and the limited availability of high-quality, high-resolution thematic layers, only variables that met the above criteria were retained. Future research shall incorporate a broader range of factors and apply advanced feature selection methods to further optimize model performance and generalizability.
2.3 Application of Shannon Entropy-Weighted Bivariate Methods
The finalized conditioning factors are used to calculate index weights for bivariate methods, including FR, IV and WoE. Landslide occurrence polygons from the inventory are intersected with raster layers of each conditioning factor in a GIS environment. The frequency of landslides within each class is calculated, and statistical weights are derived accordingly.
To standardize the contribution of each index and allow consistent entropy weighting across factors, all FR, IV, and WoE values are normalized to a 0–1 scale using min–max normalization [27,28]. This prevents dominance by any individual factor during the map overlay process and ensures comparability of layers.
FR defines the ratio of landslide occurrence percentage in a factor class to the total area percentage of that class [26].
where
–
–
–
–
–
–
The landslide susceptibility index using FR can be calculated as:
IV ratio provides the natural logarithm of the ratio of landslide density in a factor class to the total landslide density [25].
The cumulative IV index is expressed as:
2.3.3 Weight of Evidence (WoE)
WoE is a Bayesian probabilistic method that quantifies the contribution of each factor class to landslide occurrence [14,17]. It consists of two components, W+ and W−, representing landslide presence and absence, respectively:
where
and
The cumulative susceptibility index using WoE is calculated as:
2.3.4 Shannon Entropy Weighting
Bivariate models such as FR, IV, and WoE often assume equal importance of conditioning factors, which may not reflect their true influence. Shannon Entropy addresses this by computing information diversity among factor classes, resulting in data-driven, non-subjective weights. The entropy-based weighting adjusts the contribution of each factor based on its information content, reducing bias introduced by uniform or dominant classes. This enhances the interpretive value of the models, especially in areas with heterogeneous terrain [29]. In the following equations, the Shannon Entropy is represented by H, the normalized entropy is E and the derived weight for each factor is
where
–
–
–
In this study, the Shannon Entropy-weighted bivariate methods, including FR, IV and WoE, were used to model landslide susceptibility. Additionally, normalized values for FR, IV, and WoE were used to ensure consistency and comparability across all factors, preventing any single factor from disproportionately influencing the model. Shannon Entropy was employed to optimize the weighting of factor classes in the bivariate models [30]. This method measures the degree of uncertainty and information content within each factor class, thereby enabling more accurate and data-driven weight assignment compared to traditional equal-weighting approaches [14,29]. The entropy-based approach allows the models to better reflect the spatial variability of landslide-contributing factors, enhancing prediction performance.
2.4 Application of Logistic Regression
Logistic Regression was selected as the multivariate modeling approach due to its ability to integrate multiple predictor variables while accounting for potential interactions between them [19]. Unlike bivariate models which evaluate each factor independently, Logistic Regression captures complex interdependencies and outputs a probabilistic measure of susceptibility, making it particularly suitable for landslide risk assessments in infrastructure-sensitive areas [31].
To implement the model, random sample points were generated across the study area, representing both landslide and non-landslide locations. These points were spatially linked with the explanatory variables (i.e., conditioning factors) and used as input to compute regression coefficients. These coefficients quantify the combined influence of the conditioning factors on landslide susceptibility and serve as the basis for generating the logistic regression-based susceptibility map.
The logistic regression model follows the equation:
where
–
–
–
2.5 Model Validation and Performance Assessment
Following model development, landslide susceptibility maps were generated using both Shannon Entropy-weighted bivariate methods (FR, IV, WoE) and Logistic Regression. In this study, the model performance was evaluated using the ROC Curve, which assesses the model’s capacity to distinguish between landslide-prone and non-prone areas [27,28]. The ROC curve is plotted with the True Positive Rate (TPR) on the Y-axis and the False Positive Rate (FPR) on the X-axis, computed as:
where
– TP: True Positives (correctly predicted landslide areas)
– FN: False Negatives (missed landslide areas)
– FP: False Positives (non-landslide areas incorrectly predicted as landslides)
– TN: True Negatives (correctly predicted non-landslide areas)
The AUC quantifies a model’s ability to differentiate between landslide-prone and non-prone areas, with values ranging from 0.5, indicating random prediction, to 1.0, signifying perfect predictive performance. A higher AUC value reflects greater accuracy and reliability of the model. Where
Finally, the results are visualized through thematic maps and susceptibility maps. Thematic data layers are created for each conditioning factor, in which the layers are derived from the processed spatial data and represent the spatial variability of factors influencing landslide susceptibility across the study area. Each thematic map is symbolized appropriately to highlight variations, such as classifying slope gradient into low, moderate, and high categories or visualizing vegetation cover by density or type.
Using the weights calculated from FR, IV and WoE, Shannon Entropy-based methods, and coefficients from Logistic Regression, landslide susceptibility maps are generated. These maps represent the probability of landslide occurrence, categorized into susceptibility zones such as low, moderate, high, and very high. The maps are normalized for consistency and clarity, ensuring that they are interpretable by a wide range of stakeholders.
3.1 Landslide Conditioning Factors
The conditioning factors influencing landslide susceptibility were selected based on their relevance to slope stability, availability of reliable data, and suitability for the study area in Jelapang, Perak. These factors include slope gradient, slope aspect, curvature, lineament density, vegetation cover, TRI, and flow accumulation. Each factor plays a significant role in determining the stability of slopes and is widely recognized in landslide susceptibility studies. The spatial distribution of each factor was visualized using thematic maps generated in GIS. Through thematic maps as presented in Fig. 4, slope gradient and aspect maps are color-coded to highlight ranges of steepness and orientations, while curvature maps show convex and concave areas. Lineament density maps identify regions with concentrated geological features, and flow accumulation maps in Fig. 5 illustrate flow paths and potential water accumulation zones. These maps provide a clear understanding of the factors influencing landslide susceptibility across the study area, serving as essential inputs for subsequent analysis.


Figure 4: Thematic maps of landslide conditional factors. (a) slope gradient; (b) slope aspect; (c) slope curvature; (d) vegetation cover; and (e) lineament density

Figure 5: Thematic maps of landslide conditional factors. (a) terrain ruggedness index (TRI) and (b) flow accumulation. Note: the distribution of TRI and flow accumulation factors across the study area is nearly uniform, indicating limited contribution to spatial variability in susceptibility. Hence, minimal class variation is observed in the map
3.2 Multicollinearity Check for Landslide Conditioning Factors
To ensure the statistical reliability of the selected conditioning factors, a multicollinearity analysis was conducted using TOL and VIF metrics. Multicollinearity arises when two or more factors are highly correlated, leading to redundancy and potential instability in predictive models. Tolerance values below 0.1 and VIF values above 10 are indicators of problematic multicollinearity [26,33]. The result of the multicollinearity analysis conducted on all of the seven (7) explanatory variables are as presented in Table 1.

The results of the multicollinearity analysis confirmed that all seven factors had acceptable Tolerance and VIF values, indicating no significant correlation issues among them. This is because none of the conditioning factors showing Tolerance result of less than 0.1, and VIF results of more than 10. This validation step ensures that each factor contributes unique and meaningful information to the landslide susceptibility model without overlapping effects.
3.3 Landslide Susceptibility Maps
The LSM process involves computation of factor weights and model coefficients, followed by the generation of susceptibility maps for each Shannon Entropy-weighted bivariate models and Logistic Regression. The maps generated from each method are presented in Figs. 6–9.
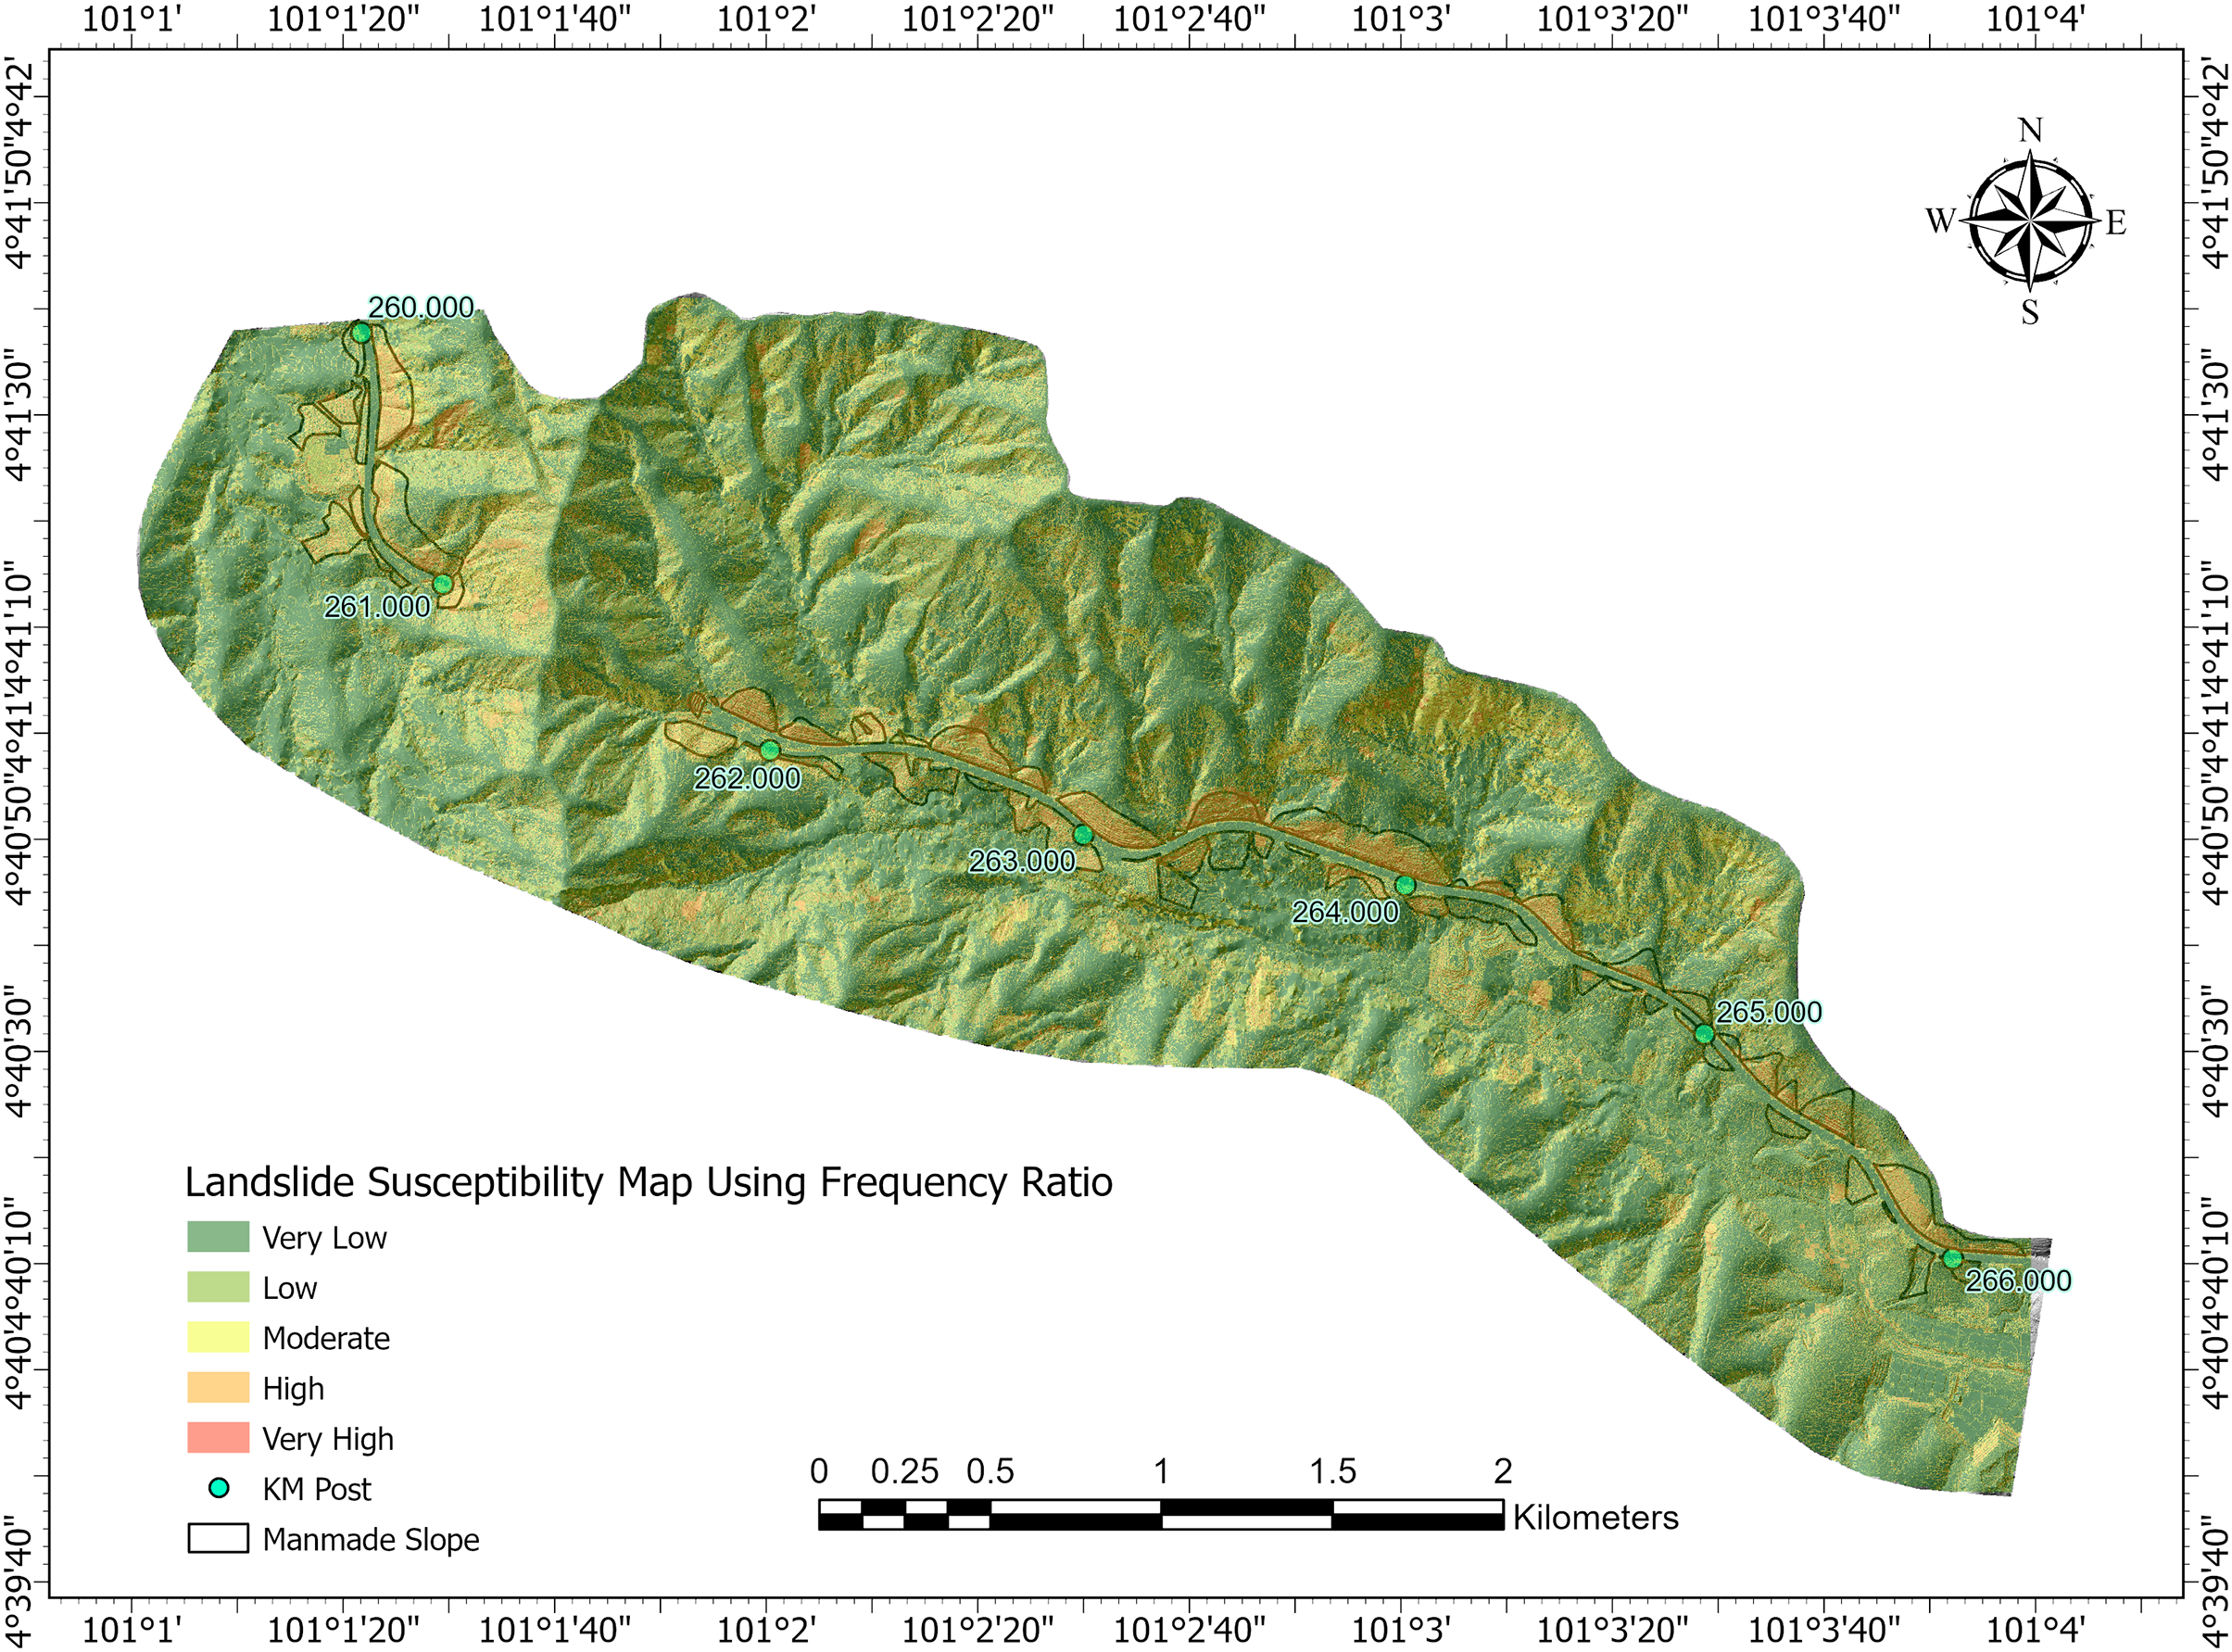
Figure 6: Landslide susceptibility map using shannon-entropy weighted frequency ratio (FR) model

Figure 7: Landslide susceptibility map using shannon-entropy weighted information value (IV) model
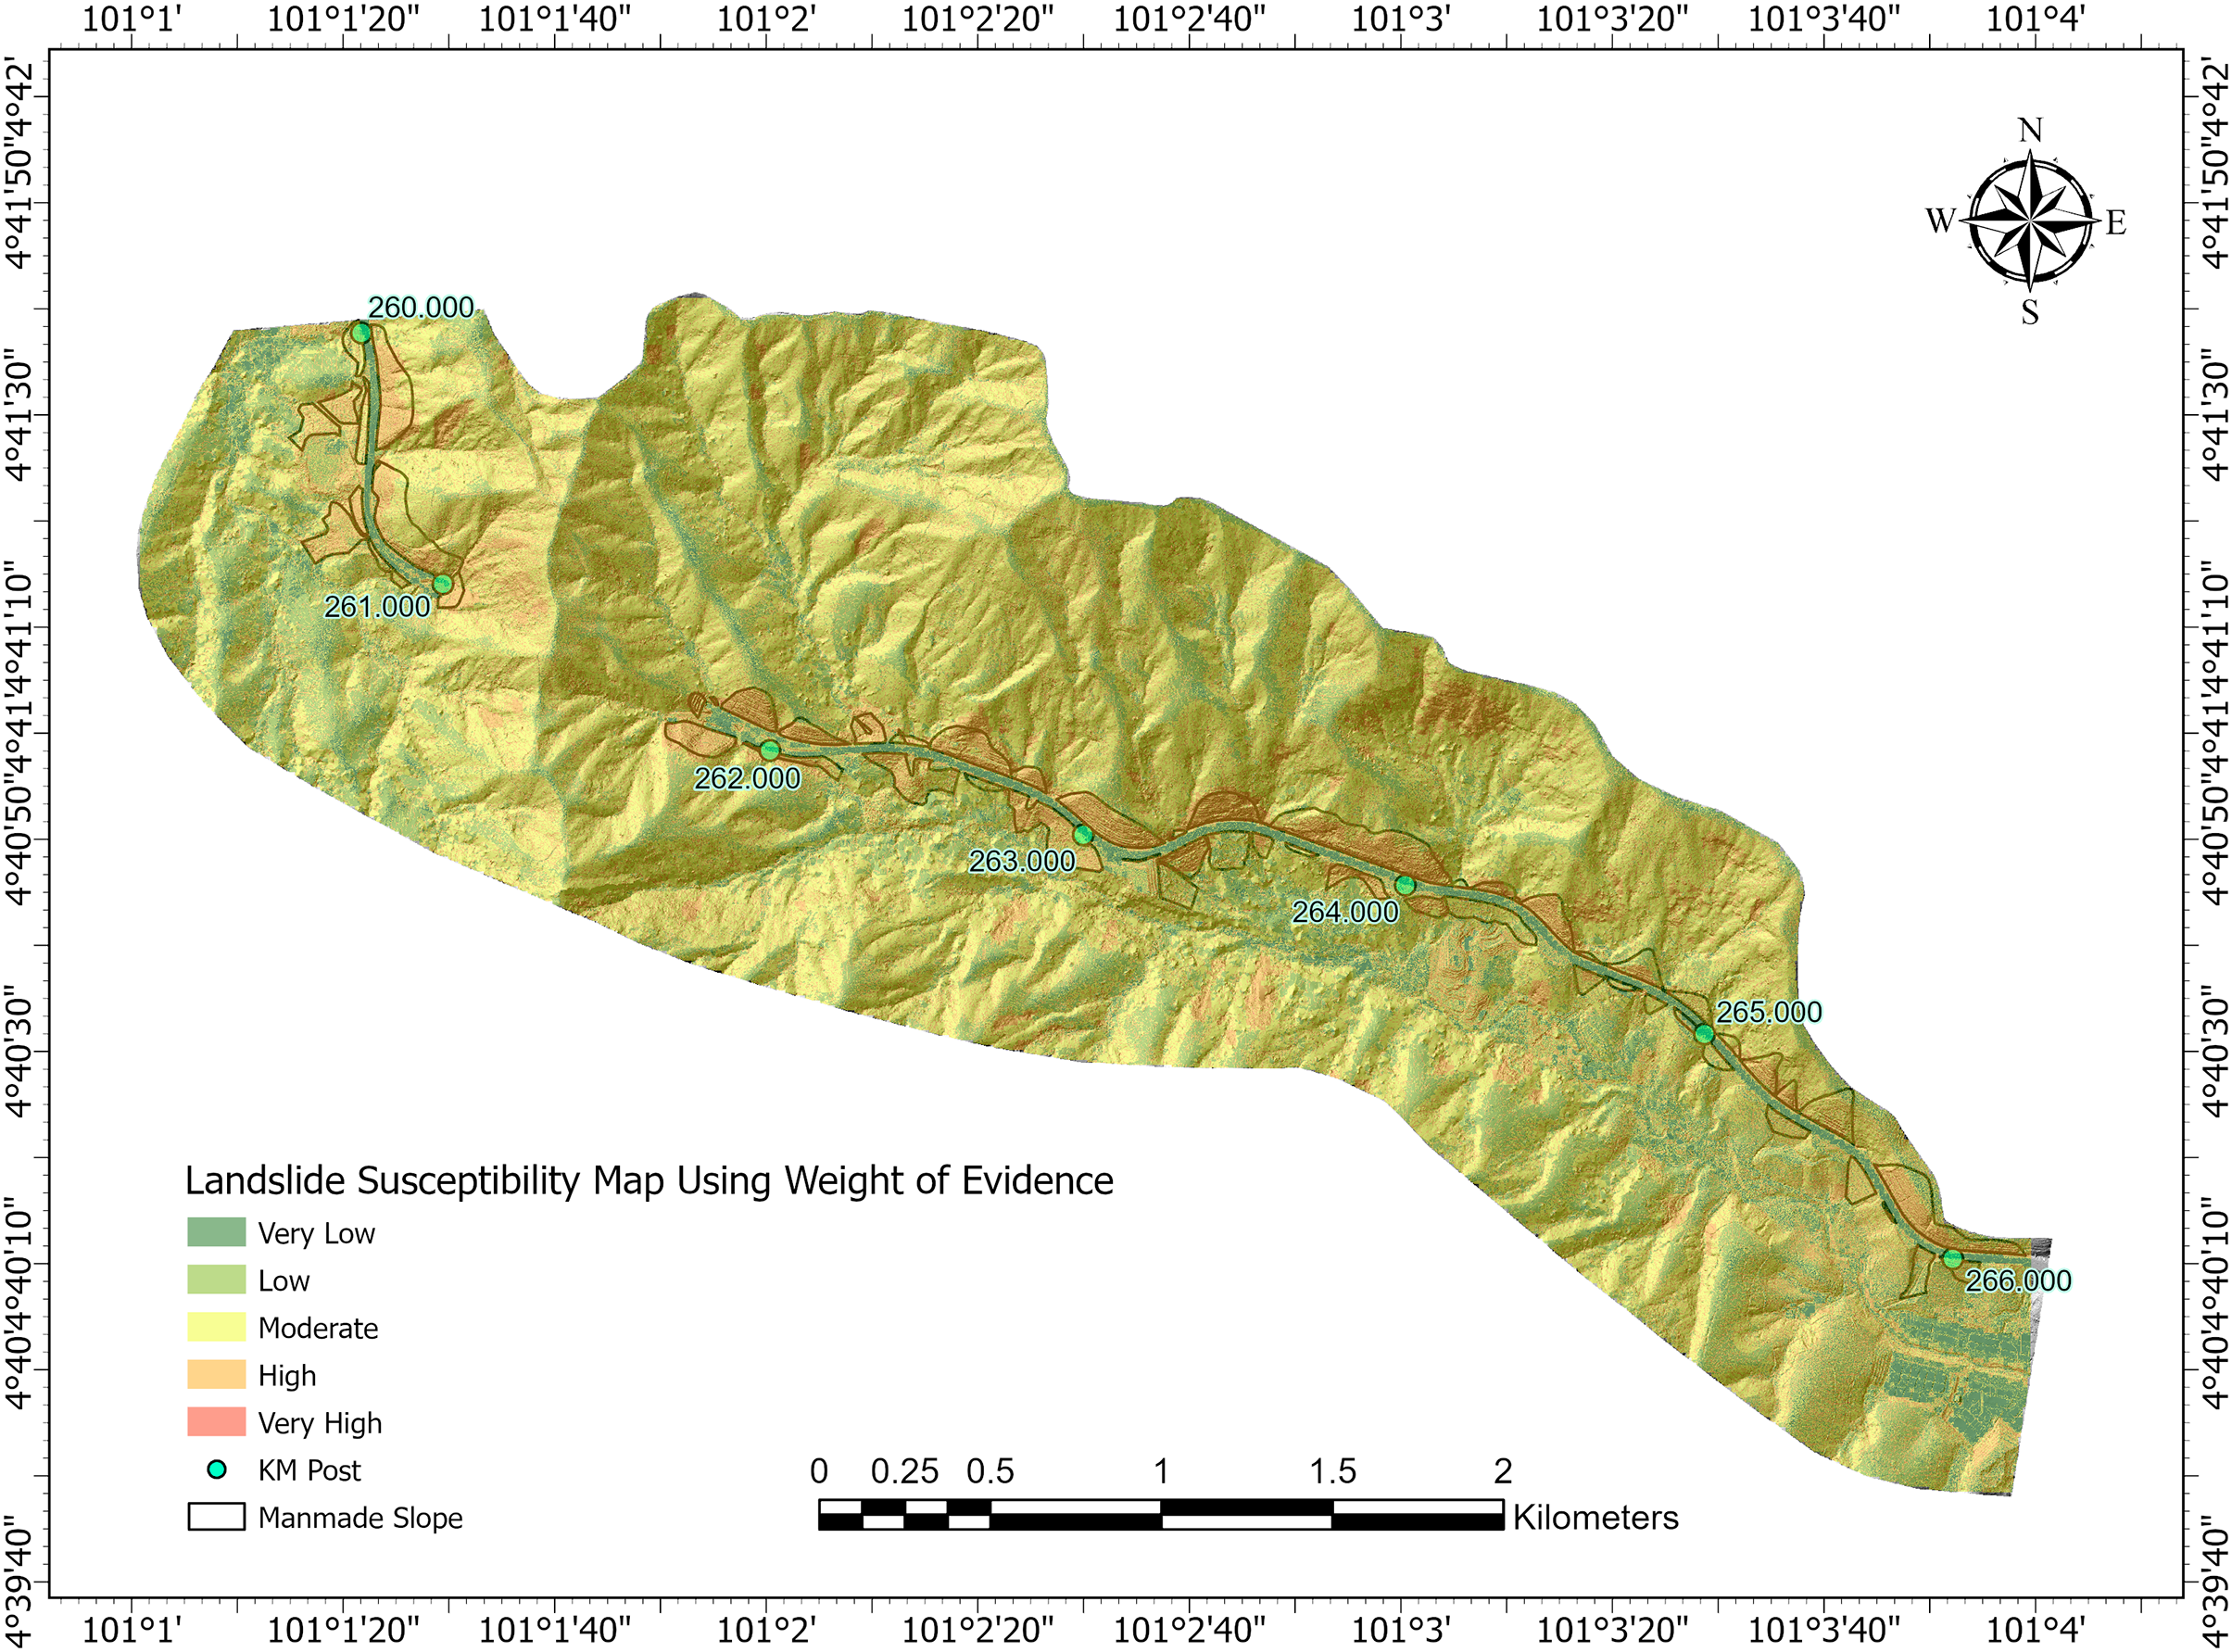
Figure 8: Landslide susceptibility map using shannon-entropy weighted weight of evidence (WoE) model
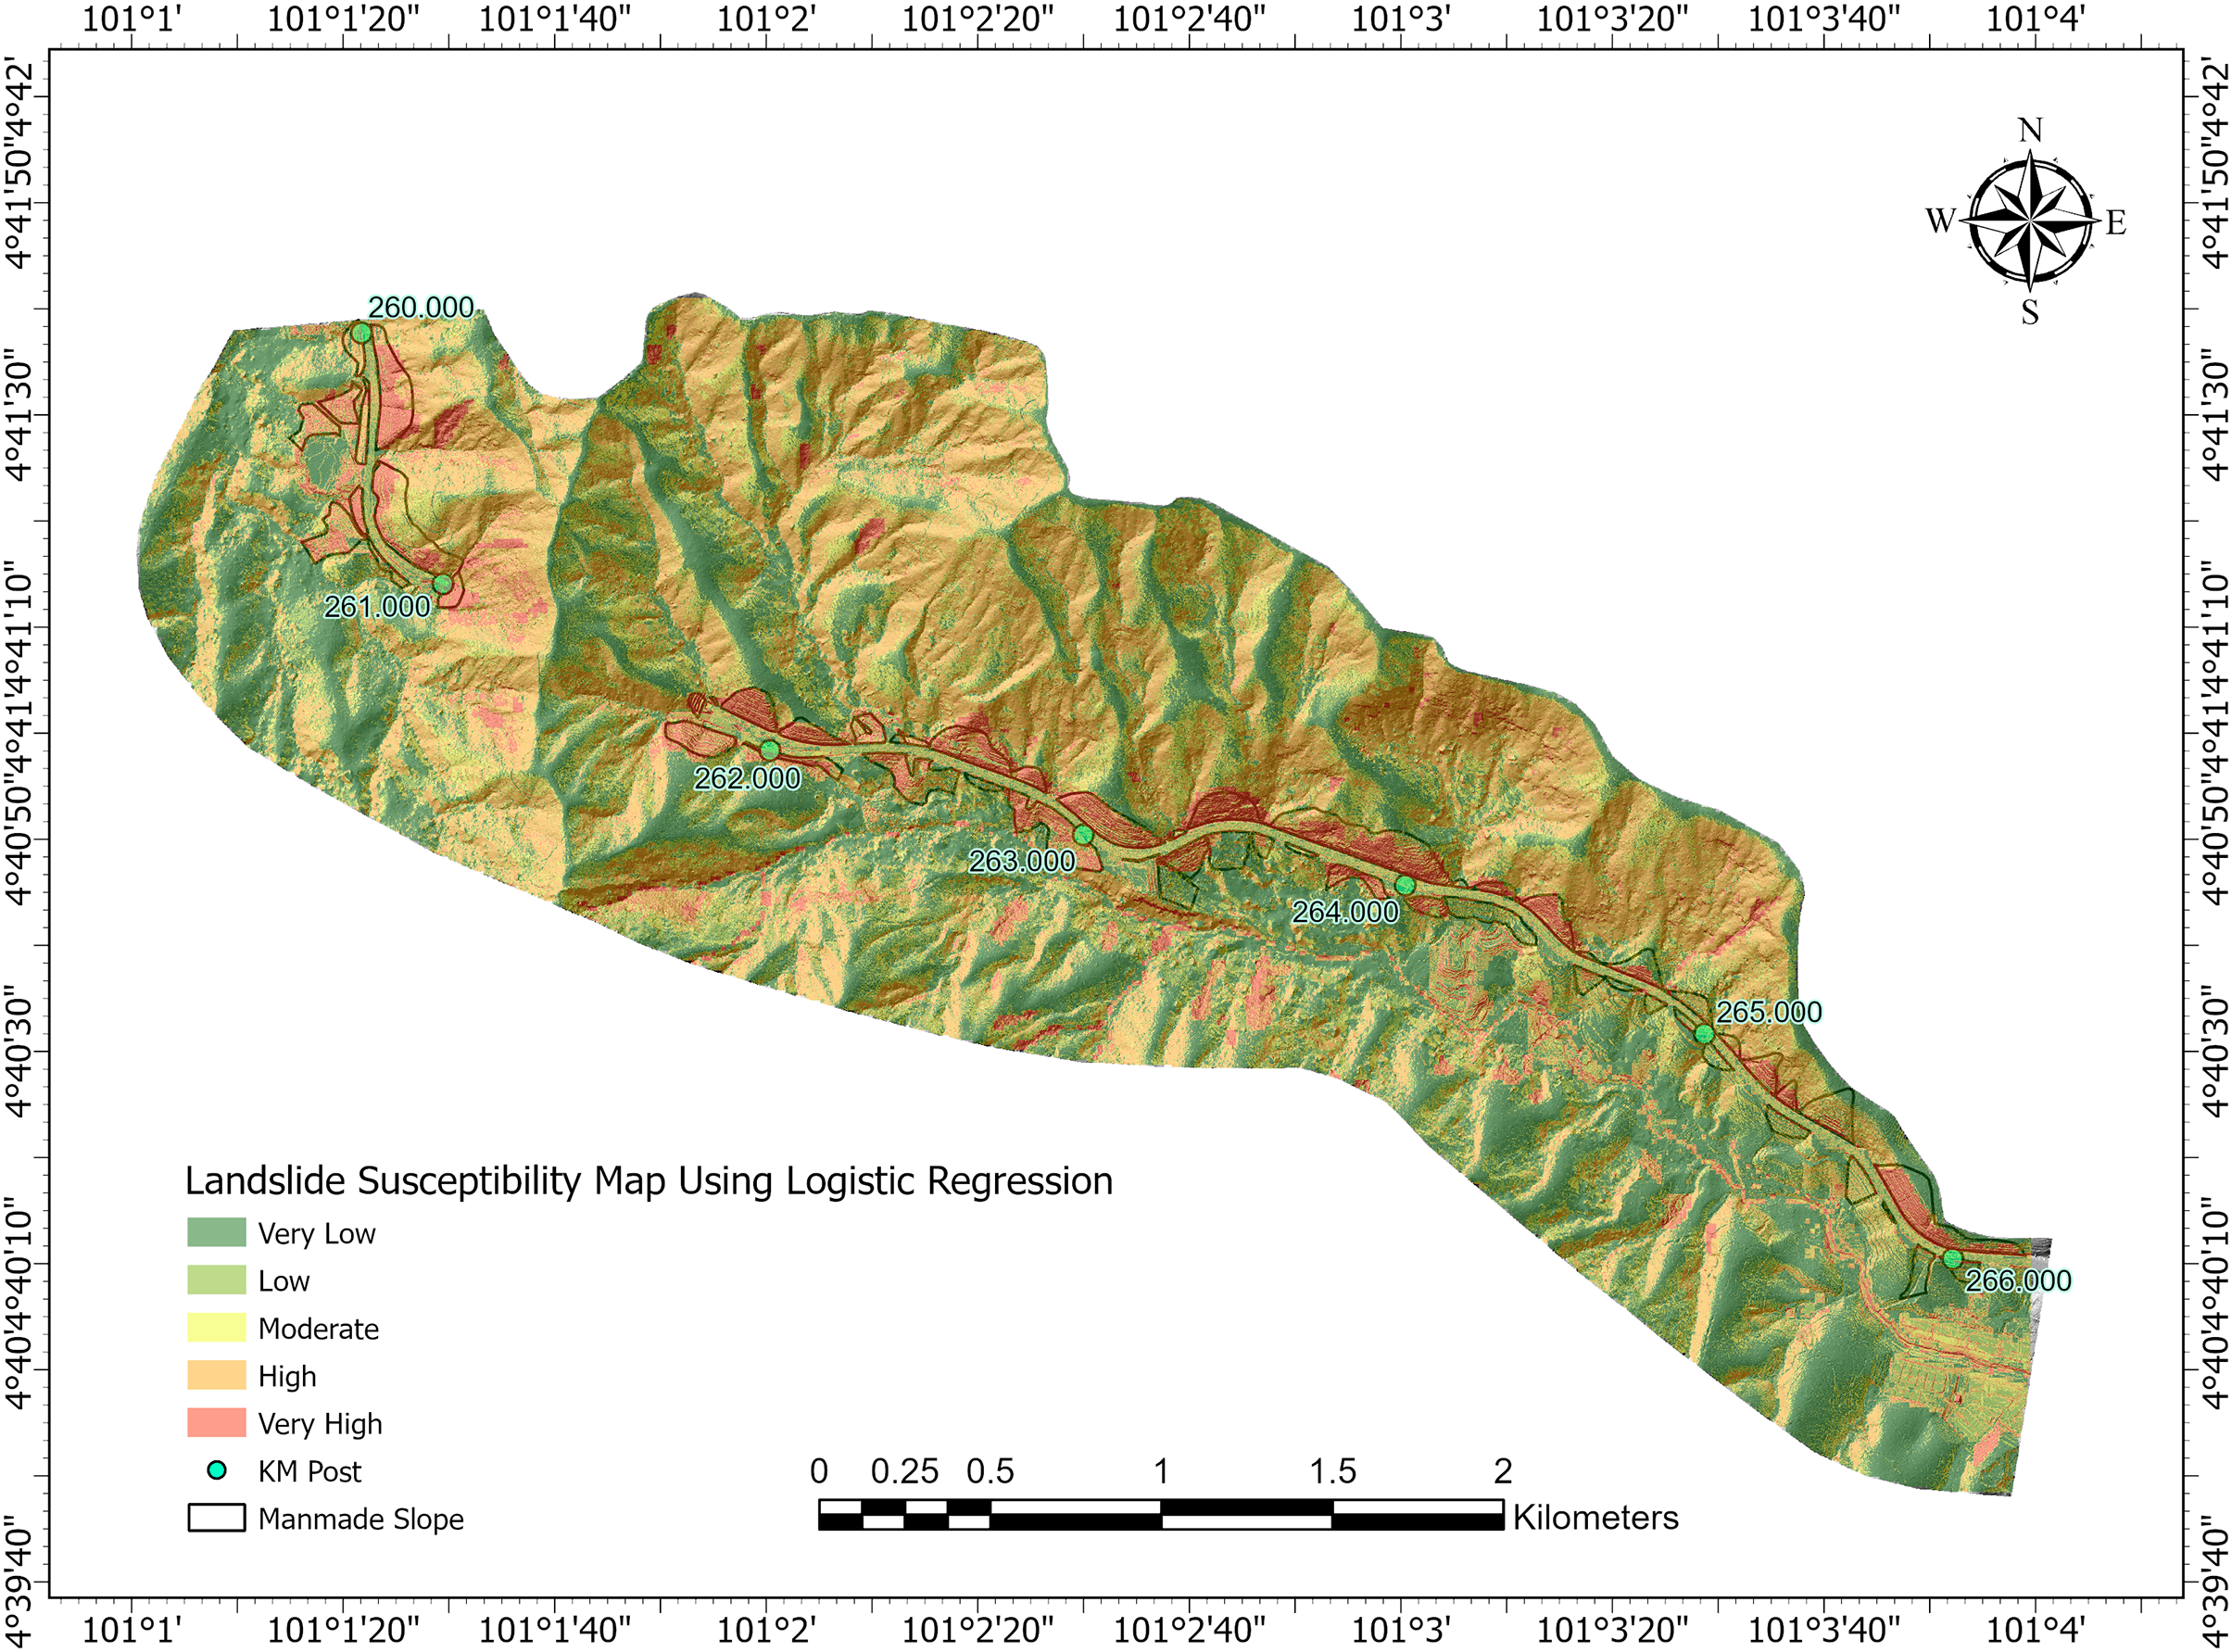
Figure 9: Landslide susceptibility map using logistic regression model
Fig. 6 shows the landslide susceptibility map generated by the Shannon Entropy-Weighted FR model. Green areas dominate the map, indicating regions with low or very low susceptibility. These zones are generally flat or have stable vegetation cover, minimizing the susceptibility of slope failure. Moderate to high susceptibility zones (yellow and orange) occur in transitional areas with moderate slope gradients or vegetation cover. Very high susceptibility zones (red) are primarily concentrated along steep natural slopes and engineered slopes, such as those near roads and highways. These red zones align with areas that likely have high weights in the FR model, such as steep slope gradients, high lineament density, and moderate to high flow accumulation.
Fig. 7 shows the landslide susceptibility map generated by the Shannon Entropy-weighted IV model. Based on the map, it can be deduced that the areas classified as very high susceptibility are concentrated along steep slopes and near manmade slopes, such as highways and infrastructure, consistent with regions where slope gradients, flow accumulation, and lineament density are likely high. Orange and yellow areas, which classified as moderate to high susceptibility, cover transitional zones with moderate slopes, medium vegetation cover, or relatively lower lineament density. These regions are susceptible to landslides under specific triggering conditions, such as heavy rainfall or human activities. Meanwhile, green zones dominate areas with gentle slopes, dense vegetation, and stable geological conditions. These regions are less prone to landslides due to favorable environmental and topographical conditions.
On the other hand, Fig. 8 which shows the landslide susceptibility generated using Shannon Entropy weighted WoE model, demonstrates susceptibility distribution pattern closely resembling the IV-based map. This similarity reflects the bivariate statistical foundation shared by both models. However, due to its Bayesian probabilistic approach, the WoE model provides a slightly more refined delineation of localized high-susceptibility zones. The integration of Shannon Entropy enhances this refinement by balancing the influence of factor class distributions, resulting in a more nuanced susceptibility assessment.
The Logistic Regression-based susceptibility map as in Fig. 9 exhibits a more heterogeneous spatial pattern. High-susceptibility zones are primarily located in the southern and central regions of the study area, with noticeably fewer such zones in the northern part. This pattern is strongly influenced by a combination of topographic, geological, and hydrological conditions. Notably, high-susceptibility areas often align with road networks and infrastructure, indicating the impact of anthropogenic activities such as slope cutting and drainage modifications. These findings emphasize the importance of monitoring manmade slopes and integrating engineering countermeasures in high-risk zones.
The comparison of landslide susceptibility maps generated using the Shannon Entropy-weighted bivariate models (FR, IV, and WoE) and the Logistic Regression model reveals both convergences and divergences in their predictive capabilities. All models consistently identify high-susceptibility zones along steep slopes, areas with high lineament density, and regions adjacent to manmade slopes, such as roads and infrastructure. This consistency underscores the significant influence of topographical and anthropogenic factors on slope instability [28,34]
Among the bivariate methods, the FR and IV models tend to delineate broader zones of high susceptibility due to their independent, class-based evaluation of conditioning factors [25]. In contrast, the WoE model, rooted in Bayesian probability, provides more localized susceptibility zones due to its probabilistic handling of presence and absence data [14,35]. The Logistic Regression model, a multivariate approach, offers a more refined and probabilistic representation of landslide susceptibility by integrating the combined and interacting effects of multiple factors [19,31], making it suitable for complex terrains where interdependencies exist among geofactors and anthropogenic pressures.
Model performance was evaluated using ROC curves, as illustrated in Fig. 10. The curves demonstrates the ability of each model to distinguish between landslide-prone and non-prone areas. The Logistic Regression model demonstrates a steeper and more consistent curve, reflecting its higher predictive power compared to the more gradual curves of the bivariate methods [18,36]. The AUC values, which range from 0.5 (random prediction) to 1.0 (perfect prediction), were calculated to quantify the predictive performance of each model.

Figure 10: ROC curves
Among the bivariate methods, the Shannon Entropy-weighted FR model slightly outperforms the others. The similar AUC values for IV and WoE reflect their reliance on statistical relationships, but WoE’s Bayesian probability approach provided slightly better localization of high-susceptibility areas. As for the multivariate method, The Logistic Regression model achieved the highest AUC value (0.8279), reflecting superior performance compared to the bivariate methods. Its ability to account for the combined and interacting effects of multiple conditioning factors likely contributed to its higher accuracy [27,31,36].
A sensitivity analysis was not conducted in this study, which limits our understanding of model robustness to variable selection and weight perturbations. Additionally, the Logistic Regression model may be prone to overfitting, especially when trained on limited or biased landslide inventories. While multicollinearity was tested and ruled out, regularization methods (e.g., L1 or L2 penalties) could further safeguard against overfitting and should be considered in future work [18,19,36].
Overall, while all models identify steep slopes and high lineament density areas as key drivers of landslide risk, the Logistic Regression model demonstrates superior spatial precision and reduced false positives by accounting for cross-factor interactions. The WoE model offers a close alternative in terms of probabilistic coherence, but FR and IV models show limitations in spatial accuracy and interpretability due to their assumption of factor independence.
3.4 Susceptibility along Road Corridor
To provide a localized understanding of model predictions, landslide susceptibility values were extracted from slope areas adjacent to the road segment between KM 260 and KM 266 of the NSE. The expressway was divided into six 1-km sub-segments, each buffered by 200 m to capture nearby terrain where slope instability is more likely to occur. For each segment, random points were generated, and susceptibility values from the four models were extracted and averaged.
Table 2 presents the mean landslide susceptibility scores per 1 km segment. The results reveal that the sub-segments between KM 261–263 consistently exhibit higher susceptibility values across all models, correlating with field-observed cut slopes and historical landslide occurrences. Notably, among the models, the Shannon Entropy-weighted FR and Logistic Regression models showed clearer contrast between high and low susceptibility zones, allowing better differentiation across segments. In contrast, the IV and WoE models produced more uniform and generalized susceptibility estimates, suggesting lower spatial sensitivity. This localized analysis complements the overall ROC-based performance evaluation by highlighting how each model behaves in specific, infrastructure-critical zones.

The study successfully identified seven critical conditioning factors that significantly influence landslide susceptibility. The conditioning factors are Slope Gradient, Slope Aspect, Curvature, Vegetation Cover, Lineament Density, TRI, and Flow Accumulation. All factors were tested for multicollinearity and found to be statistically valid, with TOL > 0.1 and VIF < 10. Weightage derived from the Shannon Entropy-weighted bivariate methods, which are FR, IV and WoE, as well as the coefficients from the Logistic Regression model, highlighted the importance of these factors.
Slope gradient consistently emerged as the most influential factor, with the highest weightage in bivariate methods and the largest positive coefficient in Logistic Regression. This indicates its strong impact on landslide susceptibility due to increased gravitational forces on steeper slopes. Similarly, lineament density and flow accumulation showed high weights and coefficients, signifying their critical roles in landslide occurrence, as areas with high geological discontinuities and water accumulation are prone to instability. Vegetation cover, with a negative coefficient, demonstrated its stabilizing effect, reducing landslide susceptibility in well-vegetated areas.
These results underscore the alignment of key factors with model outputs and their strong influence on the performance of LSM. Logistic Regression achieved the highest accuracy with ROC-AUC = 0.8279, reflecting its ability to capture interactions between factors. Among the bivariate methods, Shannon Entropy-weighted FR with ROC-AUC = 0.8007 performed best, demonstrating its reliability for straightforward regional assessments. These findings highlight the importance of factor selection and weighting in improving model performance and mapping accuracy.
However, each modeling approach carries inherent risks and limitations. Bivariate models evaluate each conditioning factor independently, which may lead to an overgeneralization of susceptibility zones and overlook interactions between variables. This could result in susceptibility overestimation in areas where multiple moderate-risk factors coexist. While the Weight of Evidence model attempts to address this through a Bayesian approach, it still lacks the ability to fully capture complex variable relationships.
Logistic Regression, although more robust in modeling variable interactions, is not without risks. It assumes a linear relationship between the log-odds of landslide occurrence and the predictor variables, which may not fully represent real-world nonlinear processes. Additionally, its performance heavily depends on the quality and representativeness of the input data. If the dataset is imbalanced or biased, such as through underrepresentation of recent landslide events, there is a risk of skewed predictions or overfitting. The model’s reliance on historical landslide inventories also means it may fail to capture emerging patterns caused by new infrastructure developments, climate change, or land-use modifications.
To build on the findings of this study, future research should incorporate additional conditioning factors such as soil type, rainfall intensity, and soil properties to develop a more comprehensive understanding of landslide susceptibility. Mapping the susceptibility impact of each individual conditioning factor is also recommended to better understand their localized influence and improve interpretability. Moreover, future research could explore the integration of deep learning methods, such as Convolutional Neural Networks (CNNs) and Long Short-Term Memory (LSTM) networks, or hybrid ensembles combining Random Forests with Support Vector Machines (RF–SVM), to capture nonlinear and spatial-temporal relationships more effectively. These approaches may offer superior predictive capabilities, particularly in larger or more geologically diverse terrains.
In summary, while all models successfully delineated susceptibility zones, Logistic Regression stands out for its superior predictive power and ability to capture interactions among factors. The bivariate models, especially the Shannon Entropy-weighted FR, remain practical options due to their interpretability and computational efficiency. However, the limitations and risks associated with both bivariate and multivariate models must be acknowledged. Future advancements in data availability, computational resources, and model complexity will be critical in refining landslide susceptibility mapping for more accurate and actionable hazard assessments.
Acknowledgement: The authors would like to express their sincere gratitude to PLUS for their cooperation and for providing essential data and guidance throughout this study.
Funding Statement: The authors received no specific funding for this study.
Author Contributions: Nurul A. Asram: Conceptualization, Methodology, Formal Analysis, Writing. Eran S. S. Md Sadek: Supervision, Validation. All authors reviewed the results and approved the final version of the manuscript.
Availability of Data and Materials: Due to commercial restrictions, the primary datasets used in this study are not publicly available. The data were provided by PLUS Berhad under a confidentiality agreement and cannot be shared. Derived results and methodological details are available from the corresponding author upon reasonable request.
Ethics Approval: Not applicable.
Conflicts of Interest: The authors declare no conflicts of interest to report regarding the present study.
References
1. Lazzari M, Gioia D, Anzidei B. Landslide inventory of the Basilicata region (Southern Italy). J Maps. 2018;14(2):348–56. doi:10.1080/17445647.2018.1475309. [Google Scholar] [CrossRef]
2. Karim Z, Hadji R, Hamed Y. GIS-based approaches for the landslide susceptibility prediction in Setif region (NE Algeria). Geotech Geol Eng. 2019;37(1):359–74. doi:10.1007/s10706-018-0615-7. [Google Scholar] [CrossRef]
3. Liu R, Yang X, Xu C, Wei L, Zeng X. Comparative study of convolutional neural network and conventional machine learning methods for landslide susceptibility mapping. Remote Sens. 2022;14(2):321. doi:10.21203/rs.3.rs-190195/v1. [Google Scholar] [CrossRef]
4. Khabiri S, Crawford MM, Koch HJ, Haneberg WC, Zhu Y. An assessment of negative samples and model structures in landslide susceptibility characterization based on Bayesian network models. Remote Sens. 2023;15(12):3200. doi:10.3390/rs15123200. [Google Scholar] [CrossRef]
5. Yusof NM, Pradhan B, Shafri HZM, Jebur MN, Yusoff Z. Spatial landslide hazard assessment along the Jelapang Corridor of the North-South Expressway in Malaysia using high resolution airborne LiDAR data. Arab J Geosci. 2015;8(11):9789–800. doi:10.1007/s12517-015-1937-x. [Google Scholar] [CrossRef]
6. Ismail A, Rashid AS, Dehghanbanadaki A, Rasib AW, Saari R, Mustaffar M, et al. Enhancing slope stability prediction using a multidisciplinary approach and radial basis function neural network: a case study on the Jelapang rock slope in Perak. Phys Chem Earth Parts A B C. 2024;135(1):103673. doi:10.1016/j.pce.2024.103673. [Google Scholar] [CrossRef]
7. Yusof NM, Pradhan B. Landslide susceptibility mapping along PLUS expressways in Malaysia using probabilistic based model in GIS. IOP Conf Ser Earth Env Sci. 2014;20:012031. [Google Scholar]
8. Alvioli M, Loche M, Jacobs L, Grohmann CH, Abraham MT, Gupta K, et al. A benchmark dataset and workflow for landslide susceptibility zonation. Earth Sci Rev. 2024;258:104927. doi:10.1016/j.earscirev.2024.104927. [Google Scholar] [CrossRef]
9. Moghimi A, Singha C, Fathi M, Pirasteh S, Mohammadzadeh A, Varshosaz M, et al. Hybridizing genetic random forest and self-attention based CNN-LSTM algorithms for landslide susceptibility mapping in Darjiling and Kurseong. India Quat Sci Adv. 2024;14:100187. doi:10.1016/j.qsa.2024.100187. [Google Scholar] [CrossRef]
10. Shaharom S, Huat LT, Othman MA. Area based landslide hazard and risk assessment for Penang Island Malaysia. In: Landslide science for a safer geoenvironment. Cham, Switzerland: Springer International Publishing; 2014. p. 513–9 [Google Scholar]
11. Shahabi H, Hashim M. Landslide susceptibility mapping using GIS-based statistical models and remote sensing data in tropical environment. Sci Rep. 2015;5(1):9899. doi:10.1038/srep09899. [Google Scholar] [PubMed] [CrossRef]
12. Ul Mustafa M, Sholagberu A, Syazwan M, Yusof K, Hashim A, Abdurrasheed A. Land-use assessment and its influence on spatial distribution of rainfall erosivity: case study of Cameron Highlands Malaysia. J Ecol Eng. 2019;20(2):183–90. doi:10.12911/22998993/98937. [Google Scholar] [CrossRef]
13. Redzuan AA, Anuar AN, Zakaria R, Aminudin E, Yusof NM, Jamil AH. A method of identifying critical road segment: a case study of Peninsular Malaysia road network. IOP Conf Ser Earth Env Sci. 2020;479:012003. doi:10.1088/1755-1315/479/1/012003. [Google Scholar] [CrossRef]
14. Dam ND, Amiri M, Al-Ansari N, Prakash I, Le HV, Nguyen HBT, et al. Evaluation of Shannon entropy and weights of evidence models in landslide susceptibility mapping for the Pithoragarh District of Uttarakhand State. India Adv Civ Eng. 2022;2022(1):6645007. doi:10.1155/2022/6645007. [Google Scholar] [CrossRef]
15. Shadman Roodposhti M, Aryal J, Shahabi H, Safarrad T. Fuzzy Shannon entropy: a hybrid GIS-based landslide susceptibility mapping method. Entropy. 2016;18(10):343. doi:10.3390/e18100343. [Google Scholar] [CrossRef]
16. Kumar S, Gupta V. Evaluation of spatial probability of landslides using bivariate and multivariate approaches in the Goriganga valley, Kumaun Himalaya. India Nat Hazards. 2021;109(3):2461–88. doi:10.1007/s11069-021-04928-x. [Google Scholar] [CrossRef]
17. Qazi A, Singh K, Vishwakarma DK, Abdo HG. GIS based landslide susceptibility zonation mapping using frequency ratio, information value and weight of evidence: a case study in Kinnaur District HP India. Bull Eng Geol Environ. 2023;82(8):332. doi:10.1007/s10064-023-03344-8. [Google Scholar] [CrossRef]
18. Sujatha ER, Sridhar V. Landslide susceptibility analysis: a logistic regression model case study in Coonoor. India Hydrology. 2021;8(1):41. doi:10.3390/hydrology8010041. [Google Scholar] [CrossRef]
19. Sun X, Chen J, Bao Y, Han X, Zhan J, Peng W. Landslide susceptibility mapping using logistic regression analysis along the Jinsha River and its tributaries close to Derong and Deqin County, Southwestern China. ISPRS Int J Geoinf. 2018;7(11):438. doi:10.3390/ijgi7110438. [Google Scholar] [CrossRef]
20. Taalab K, Cheng T, Zhang Y. Mapping landslide susceptibility and types using random forest. Big Earth Data. 2018;2(2):159–78. doi:10.1080/20964471.2018.1472392. [Google Scholar] [CrossRef]
21. Huang Y, Zhao L. Review on landslide susceptibility mapping using support vector machines. Catena. 2018;165(1–2):520–9. doi:10.1016/j.catena.2018.03.003. [Google Scholar] [CrossRef]
22. Pokharel B, Lim S, Bhattarai TN, Alvioli M. Rockfall susceptibility along Pasang Lhamu and Galchhi-Rasuwagadhi highways, Rasuwa, Central Nepal. Bull Eng Geol Environ. 2023;82(5):183. doi:10.1007/s10064-023-03174-8. [Google Scholar] [CrossRef]
23. Chen W, Li W, Hou E, Zhao Z, Deng N, Bai H, et al. Landslide susceptibility mapping based on GIS and information value model for the Chencang District of Baoji. China Arab J Geosci. 2014;7(11):4499–511. doi:10.1007/s12517-014-1369-z. [Google Scholar] [CrossRef]
24. Liu L, Yang C, Huang F, Wang X. Landslide susceptibility mapping by attentional factorization machines considering feature interactions. Geomat Nat Hazards Risk. 2021;12(1):1837–61. doi:10.1080/19475705.2021.1950217. [Google Scholar] [CrossRef]
25. Mandal SP, Chakrabarty A, Maity P. Comparative evaluation of information value and frequency ratio in landslide susceptibility analysis along national highways of Sikkim Himalaya. Spat Inf Res. 2018;26(2):127–41. doi:10.1007/s41324-017-0160-0. [Google Scholar] [CrossRef]
26. Huangfu W, Qiu H, Wu W, Qin Y, Zhou X, Zhang Y, et al. Enhancing the performance of landslide susceptibility mapping with frequency ratio and gaussian mixture model. Land. 2024;13(7):1039. doi:10.3390/land13071039. [Google Scholar] [CrossRef]
27. Yilmaz I. Landslide susceptibility mapping using frequency ratio, logistic regression, artificial neural networks and their comparison: a case study from Kat landslides (Tokat-Turkey). Comput Geosci. 2009;35(6):1125–38. doi:10.1016/j.cageo.2008.08.007. [Google Scholar] [CrossRef]
28. Pradhan B. Landslide susceptibility mapping of a catchment area using frequency ratio, fuzzy logic and multivariate logistic regression approaches. J Indian Soc Remote Sens. 2010;38(2):301–20. doi:10.1007/s12524-010-0020-z. [Google Scholar] [CrossRef]
29. Nwazelibe VE, Egbueri JC, Unigwe CO, Agbasi JC, Ayejoto DA, Abba SI. GIS-based landslide susceptibility mapping of Western Rwanda: an integrated artificial neural network, frequency ratio, and Shannon entropy approach. Env Earth Sci. 2023;82(19):439. doi:10.1007/s12665-023-11134-4. [Google Scholar] [CrossRef]
30. Sharma LP, Patel N, Ghose MK, Debnath P. Influence of Shannon’s entropy on landslide-causing parameters for vulnerability study and zonation—a case study in Sikkim, India. Arab J Geosci. 2012;5(3):421–31. doi:10.1007/s12517-010-0205-3. [Google Scholar] [CrossRef]
31. Pourghasemi HR, Moradi HR, Fatemi Aghda SM. Landslide susceptibility mapping by binary logistic regression, analytical hierarchy process, and statistical index models and assessment of their performances. Nat Hazards. 2013;69(1):749–79. doi:10.1007/s11069-013-0728-5. [Google Scholar] [CrossRef]
32. Razavi-Termeh SV, Hatamiafkoueieh J, Sadeghi-Niaraki A, Choi SM, Al-Kindi KM. A GIS-based multi-objective evolutionary algorithm for landslide susceptibility mapping. Stoch Environ Res Risk Assess. 2023;11(5):1–26. doi:10.1007/s00477-023-02562-6. [Google Scholar] [CrossRef]
33. Mandal S, Mondal S. Statistical approaches for landslide susceptibility assessment and prediction. Cham, Switzerland: Springer International Publishing; 2019. [Google Scholar]
34. Lee S, Pradhan B. Probabilistic landslide hazards and risk mapping on Penang Island. Malaysia J Earth Syst Sci. 2006;115(6):661–72. doi:10.1007/s12040-006-0004-0. [Google Scholar] [CrossRef]
35. Islam F, Iqbal MF, Mahmood I, Shahzad MI, Shah SU. Application of frequency ratio, information value, and weights-of-evidence models and their comparison in landslide susceptibility mapping in Murree region, Sub-Himalayas. Forthcoming. 2022;35(3):125. doi:10.21203/rs.3.rs-2218881/v1. [Google Scholar] [CrossRef]
36. El-Fengour M, El Motaki H, El Bouzidi A. Landslides susceptibility modelling using multivariate logistic regression model in the Sahla Watershed in Northern Morocco. Soc Nat. 2021;33:e59124. doi:10.14393/sn-v33-2021-59124. [Google Scholar] [CrossRef]
Cite This Article
 Copyright © 2025 The Author(s). Published by Tech Science Press.
This work is licensed under a Creative Commons Attribution 4.0 International License , which permits unrestricted use, distribution, and reproduction in any medium, provided the original work is properly cited.
 Downloads
 Citation Tools