
 Submit a Paper
 Propose a Special lssue
 Open Access
ARTICLE

Retrieval of Surface Soil Moisture Using Landsat 8 TIRS Data: A Case Study of Faisalabad
1 National Centre of GIS and Space Applications (NCGSA)-Agricultural Remote Sensing Lab (ARSL), University of Agriculture Faisalabad, Faisalabad, 38000, Punjab, Pakistan
2 Department of Irrigation and Drainage, University of Agriculture Faisalabad, Faisalabad, 38000, Punjab, Pakistan
3 Multan Development Authority, HUD & PHED, Multan, 54000, Punjab, Pakistan
* Corresponding Author: Muhammad Adnan Shahid. Email:
(This article belongs to the Special Issue: Applications of GNSS Remote Sensing)
Revue Internationale de Géomatique 2025, 34, 655-668. https://doi.org/10.32604/rig.2025.064279
Received 11 February 2025; Accepted 10 July 2025; Issue published 11 August 2025
 View Full Text
 Download PDF
Abstract
This study was conducted to devise an integrated methodology for retrieval of surface soil moisture (SSM) using Landsat 8 TIRS data. For this purpose, Landsat 8 images of 15 May 2021 (pre-monsoon) and 20 November 2021 (post-monsoon) were processed for retrieval of soil moisture index (SMI) based on land surface temperature (LST). Moreover, field-based SM in the laboratory was also determined and correlated with satellite-based SMI. A moderate correlation between field-based SM and satellite-based SMI with R2 = 0.60 was obtained. Based on this relationship, SSM maps of Tehsil Faisalabad Saddar for the pre-and post-monsoon seasons of 2021 were developed. Significant variations in the spatial distribution of SSM of Tehsil Faisalabad Saddar (total area of 1492.45 km2) for pre- and post-monsoon seasons were observed. In the pre-monsoon season, 68.1% of the area of Faisalabad Saddar showed SSM contents ranging from 10.37% to 15.40%. Only 8.7% of the total area of Faisalabad Saddar exhibited SSM in the range of 15.41%–22.82% in the pre-monsoon season. It was astonishing to notice that no area in Faisalabad Saddar was detected with SSM above 22.82% in the pre-monsoon season. However, in the post-monsoon season, only 0.11% of the total study area exhibited SSM in the range of 0.0% to 26.97%. The maximum area (52.29% of the total area) in post-monsoon season exhibited SSM ranging from 36.18% to 40.02%, followed by 32.02%–36.17% (34.3% of the total area). The study concluded that satellite-based retrieval of surface soil moisture realistically monitored the variations in soil moisture due to the onset of the monsoon season. The novel methodology developed in this study could be helpful for policy making regarding groundwater recharge and its sustainable use in an area, as well as for estimating surface soil moisture to provide irrigation scheduling and crop management guidelines.Keywords
Soil moisture (SM) refers to the amount of water stored in soil particles on a volumetric or gravimetric basis and is considered a key variable that links the soil-water-atmosphere-plant processes and plays an important role in precision agriculture and water cycles, especially in arid and semi-arid regions [1–3]. Soil moisture influences not only rainfall infiltration and evaporation rate but also affects the global climate and weather system. More importantly, soil moisture also influences agriculture crop production, where the growth and development of crops primarily depend on soil moisture retained through rainfall or irrigation practices [4,5]. Moreover, it has been reported that soil moisture affects surface runoff, landslide generation, and drought development and has several other hydrological, meteorological, and ecological applications [6–8]. Therefore, comprehensive information about the spatio-temporal variability of soil moisture is crucial for improved crop production through mitigation of detrimental environmental impacts of over-irrigation and conservation of water by need-based and precise irrigation applications [9–11].
Unfortunately, soil moisture exhibits extreme variability both temporally and spatially due to several factors, including soil properties, topography (elevation, slope, aspect), types of vegetation cover, climatic pattern, and depth of water table [12]. This spatio-temporal variability of soil moisture makes it difficult to measure on a larger scale. Various ground-based techniques have been conventionally used for the assessment of soil moisture [13,14]. Although, these ground-based techniques provide accurate information about soil moisture, but require intensive labor, and are time-consuming and economically costly [15]. Moreover, the key problem associated with ground-based techniques is their limitation to discrete assessments of soil moisture (having spatial variability) for a region, as well as to regular or continuous soil moisture assessments at a specific location [16]. So, ground-based techniques of soil moisture provide impractical solutions for spatial and temporal mapping and monitoring of soil moisture at regional levels [15].
In this scenario, remote sensing (RS) and GIS techniques provide promising alternatives for the assessment of spatio-temporal variability of soil moisture at local, regional, or global levels [17]. Previously, there has been limited use of satellite-based soil moisture estimations in agriculture and monitoring of any hydro meteorological disasters. However, several researchers have now developed remote sensing methods for the estimation of soil moisture using satellite data [18]. These methods exhibit considerable potential for mapping soil moisture at a larger scale by integrated use of surface temperature and vegetation indices for retrieval of surface soil moisture [19,20]. Several researchers have investigated the relationship between land surface temperature (LST) and normalized difference vegetation index (NDVI) derived using satellite imagery for the assessment of soil moisture [19,20]. Soil moisture index (SMI) is among the effective indices that combine LST and NDVI for the estimation of soil moisture [21].
Pakistan is a developing country characterized by high diversity in soil and climatic conditions due to variations in topography [22]. Under these conditions, soil moisture is distributed heterogeneously. Therefore, comprehensive knowledge of soil moisture is crucial for enhanced crop productivity. Traditional ground-based methods are considered impractical for mapping soil moisture over large areas. RS and GIS techniques offer reliable and promising tools for monitoring and mapping soil moisture over large areas by estimating SMI using high-resolution satellite images with thermal properties. Although retrieval of SMI through satellite imagery has attracted much attention, there is still a lack of use of well-established methodology for this purpose in Pakistan. The present study was carried out to devise an integrated methodology for the retrieval of surface soil moisture using satellite data. The methodology developed could be helpful for real-time monitoring of soil moisture for precisely scheduling irrigations to improve water productivity. Moreover, to identify dry and wet regions of Faisalabad, surface soil moisture maps for pre- and post-monsoon seasons during the year 2021 were developed in the study; such findings could be helpful for developing future water reallocation policies in a region.
2.1 Description of the Study Area
The study area, i.e., UAF Postgraduate Agricultural Research Station (UAF-PARS) (31.383700, 72.996934) lies in the district of Faisalabad, Punjab, Pakistan, and covers an area of 5.6 km2. UAF-PARS is situated on Jhang Road and is a part of the Tehsil Faisalabad Saddar. Geographically, district Faisalabad is surrounded on the North and West by Hafizabad, Jhang, and Toba Tek Singh districts, respectively. In the East, it touches Sheikhupura and in the South, it is bound by the river Ravi, across from which lies Sahiwal (Fig. 1). The climatic conditions in the district of Faisalabad are two extremes. The maximum temperature in summer reaches up to 50°C (122°F). In winter, it may, at times fall below freezing point. However, the mean maximum and minimum temperatures in summer season (April to October) are 39°C and 27°C, respectively, while 21°C and 6°C respectively in winter season (November to March). In the district of Faisalabad, May, June, and July are the hottest, and December, January, and February are the coldest months. The average annual rainfall recorded in district Faisalabad is about 300 mm. Most of the study area is comprised of agricultural land and is characterized by fertile soil. Major crops and fruits grown in the district of Faisalabad are wheat, sugarcane, rice, maize, citrus, guava, and mangoes.

Figure 1: Study area map
2.2 Field Measurement of Soil Moisture
A total of twenty soil samples (0–10 cm) were randomly collected from the study area as shown by yellow marks in Fig. 1. The location of each collected soil sample was recorded using a portable global positioning system (GPS) unit. All the soil samples were collected in plastic bags, labeled, and transported to the laboratory for measurement of actual soil moisture content. Briefly, the collected soil samples were oven dried for 24 h at 105°C, and soil moisture content (%) was measured by comparing the pre-and post-drying weights of soil samples using the equation given below.
The date of soil sample collection and acquisition of satellite imagery of the study area was the same to best establish the relationship between field measurement of SM (filed-based SM) and satellite-based SMI. Moreover, soil moisture measurements were vectorized as points, which served as a way of extracting pixel image values directly linked spatially and temporally to field measurements.
2.3 Remote Sensing-Based Soil Moisture Estimation
2.3.1 Satellite Image Acquisition
Landsat satellite images (Landsat 8 TIRS and OLI images, i.e., Band 10, Band 5, and Band 4 along metadata file with 150 path/038 rows of two different dates, i.e., 15 May 2021 (pre-monsoon season) and 20 November 2021 (post-monsoon season) of the study area were obtained using USGS earth explorer website. The satellite images were rectified to WGS-1984-UTM-Zone_43N and processed using ArcMap 10.5 for retrieval of SMI by following different steps as summarized in a flowchart (Fig. 2).

Figure 2: Flowchart for retrieval of soil moisture index (SMI) using Landsat 8 data
2.3.2 Pre-Processing of Satellite Images to Estimate TOA Radiance and BT
The obtained satellite images were subjected to preprocessing including radiometric and atmospheric correction for preparing them to be used for retrieval of land surface temperature (LST) and soil moisture index (SMI). Radiometric correction improved the interpretability and quality of Landsat 8 images and reduced the errors in the Digital Numbers (DN) of the images. This step involved the conversion of Digital Number (DN) to the Top of Atmospheric (TOA) or at-satellite radiance (Lλ) using the information given in the metadata file (.MLT). The value of TOA represents the amount of energy that reaches the satellite sensor and is determined by multiplying the multiplicative rescaling factor (0.000342) of TIR bands with its corresponding TIR band and adding the additive rescaling factor (0.10000) in it using Eq. (1).
where,
Lλ: Top of Atmospheric or Spectral Radiance in Watts/(m2·srad·µm);
ML: Band-specific multiplicative rescaling factor Radiance Multi-Band (Band 10);
Qcal: Quantized and calibrated standard product pixel values (DN) Band 10 for Landsat 8;
AL: Band-specific additive rescaling factor Radiance Add Band (Band 10).
The second step involved the conversion of TOA or spectral radiance (Lλ) to effective or brightness at-satellite temperature (BT) using Eq. (2). For this purpose, the information given in the file with an extension “.MLT” was used as shown in Table 1. BT represents the microwave radiation radiance traveling upward from the top of Earth’s atmosphere and necessarily requiring TOA to calculate BT using the formula given in the equation.
where,
K1 and K2: Band-Specific Thermal Conversion Constant, Lλ: Top of Atmospheric Spectral Radiance.

Similarly, atmospheric correction was also performed to eradicate atmospheric effects and produce surface reflectance values. Atmospheric correction also improved the interpretability and usage of Landsat 8 data.
2.3.3 Determination of Normalized Difference Vegetation Index (NDVI)
Normalized Difference Vegetation Index (NDVI) is a standard vegetation index that is determined by using infra-red (Band 5) and Red (Band 4) bands of Landsat 8 images using the formula given in Eq. (3).
where,
Red (Band 4): DN value from the RED band (Band 4);
NIR (Band 5): DN values from NIR band (Band 5).
2.3.4 Determination of Land Surface Emissivity (LSE)
Before finding Land Surface Emissivity (LSE), it is necessary to determine the Proportion of Vegetation (PV) which is calculated using the formula given in Eq. (4).
where,
NDVI: DN values from NDVI image, NDVImin: Minimum DN values from NDVI image, NDVImax: Maximum DN values from NDVI image.
However, LSE was calculated using the formula given in Eq. (5).
2.3.5 Determination of Land Surface Temperature (LST)
Land surface Temperature (LST) of the study area was determined based on its brightness temperature (BT) and land surface emissivity (LSE)using the formula given in Eq. (6).
where,
P = h·c/s = 1.438 × 10⁻² m K = 1438 µm·K;
• h is Planck’s constant = 6.626 × 10⁻³⁴ J·s;
• c is velocity of light = 2.998 × 10⁸ m/s;
• s is Boltzmann constant = 1.38 × 10⁻²³ J/K.
λ value for Landsat 8 (Band 10): 10.895;
E: Land Surface Emissivity;
BT: Brightness temperature.
2.3.6 Retrieval of Soil Moisture Index (SMI)
In the final step, retrieval of SMI was carried out using the formula given in Eq. (7).
where,
LSTmax: Maximum value of LST and LSTmin: Minimum value of LST
In this study, retrieval of the soil moisture index (SMI) of the study area located in Faisalabad, i.e., UAF-PARS before and after the monsoon season in 2021 was carried out through geospatial techniques. For this purpose, Landsat 8 imagery (B10, B4, B5) of pre-monsoon (15 May 2021) and post-monsoon season (20 November 2021) were downloaded and processed in ArcGIS. After the initial atmospheric and radiometric correction of satellite images, Band 4 and Band 5 were used to determine NDVI. However, Band 10 was used to determine land surface temperature (LST) which was further used for measuring the soil moisture index of the study area. Previously, several researchers have adopted this methodology involving Landsat 8 imagery for determining the soil moisture index of a particular area of interest based on NDVI and LST [3,17,23–26]. In this study, soil samples (0–15 cm) were also collected from twenty (20) different locations in the study area and analyzed to determine soil moisture content in laboratory conditions through the gravimetric method. The accuracy of the adopted methodology was determined by comparison between the estimated SMI based on Landsat 8 imagery and the observed soil moisture (%) of field locations measured in laboratory conditions. While ground samples reported soil moisture in % or m3/m3 and satellites often use unit less indices, the two terms are comparable and the difference in their units is not a problem for comparative analysis. This is because the SMI like all other differential band ratios is a unit-less term having value varying from −1 to +1, while the field soil moisture is always in some positive percent value. By applying the correlation and scaling techniques, the correction factor (correlation equation) between two datasets was developed for further use to enhance spatial and temporal analysis of satellite-based soil moisture dynamics.
Therefore, in this study, the spatial distribution of soil moisture was monitored through retrieval of SMI of the study area in pre- and post-monsoon season. Results regarding the SMI of the study area in pre- and post-monsoon season have been presented in Fig. 3. According to the results, significant variations in the SMI of the study area before and after monsoon season were recorded. In the pre-monsoon season, the Soil Moisture Index (SMI) of the study area ranged from 0.2 to 0.38, with the maximum area exhibiting lower SMI values. In the post-monsoon season, an increase in the soil moisture index (SMI) of the study area was observed, with the highest SMI recorded at 0.47 and the lowest at 0.22. Moreover, it was noticed that the maximum area exhibited higher SMI in the post-monsoon season. These results resemble the findings of Pandey et al. [3], who also reported lower soil moisture contents (ranging from 0.0157 to 0.173) in Hoshangabad district of Madhya Pradesh, India in the monsoon season. Moreover, increases in soil moisture (ranging from 0.551 to 0.753) after monsoon season have also been reported in this study. Higher values of SMI of the study area in post-monsoon season can be associated with the fact that in November, most of the land in the study area was occupied by wheat which was at the sowing stage. As at the sowing stage, the water contents of the soil are high, thus, the SMI of the study area in the post-monsoon season was high. However, lower SMI can be linked to the fact that in May, most of the crops in the study area are at the harvesting stage. As we know, at the harvesting stage, the water contents of the soil are low, therefore, the SMI of the study area in the pre-monsoon season was low. Differences in soil moisture index might also be due to variations in the LST of the study area in pre- and post-monsoon season. The literature suggested a strong negative correlation between SMI and LST which indicated that SMI decreases with an increase in LST [25,27].

Figure 3: Soil Moisture Index (SMI) of pre- and post-monsoon season of the study area
3.2 Relationship between Satellite-Based SMI and Field-Based Soil Moisture
The relationship of satellite-based SMI with field-based soil moisture was also studied. For this purpose, surface soil samples were collected from twenty (20) different locations in the study area. Each location is represented by a black dot as shown in Fig. 4. The soil moisture contents (%) of collected soil samples were determined through the gravimetric method in the laboratory. The results of field-based soil moisture contents of collected soil samples have been presented in Table 2. According to the results, the study area revealed significant variation in field-based soil moisture content ranging from 12% to 28.2%. However, to study the relationship between actual and remote sensing-based SM, a scatter plot between satellite-based SMI and field-based SM was also drawn (Fig. 4). Correlation analysis showed that as the satellite-based SMI increases, the field-based SM also increases and vice versa. It was observed that there was a moderate positive correlation (R2 = 0.60) between satellite-based SMI and field-based SM. Our results were in line with the findings of several previous studies that also found such a positive correlation between satellite-based SM and field-based SM [28–30] reported a positive correlation (R2 = 0.63) between predicted SM and in situ surface soil moisture. The correlation equation obtained is given below (Eq. (9)):
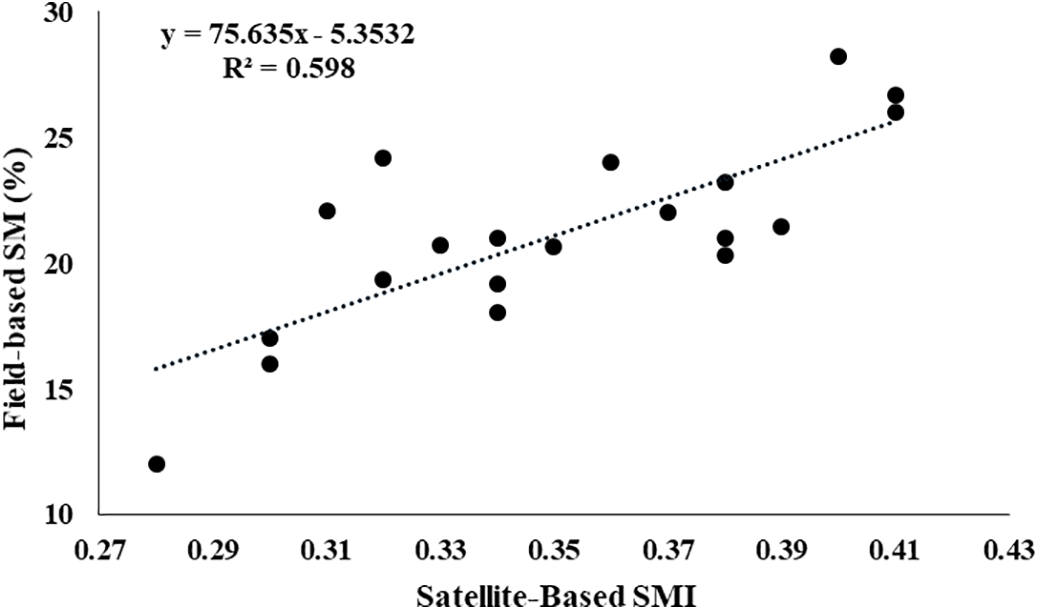
Figure 4: Correlation between field-based SM (%) and satellite-based SMI of the post-monsoon season of the study area during the year 2021.

3.3 Surface Soil Moisture Maps of Faisalabad
Based on the relationship between field-based SM and satellite-based SMI (Eq. (8)), surface soil moisture maps of tehsil Faisalabad Saddar for the pre- and post-monsoon season during the year 2021 were developed. Results demonstrated significant variations in the spatial distribution of surface soil moisture of tehsil Faisalabad Saddar (total area of 1492.45 km2) for pre- and post-monsoon seasons (Fig. 5). Lower values of surface soil moisture were recorded in pre-monsoon season, and higher values were recorded in post-monsoon maps of tehsil Faisalabad. In pre-monsoon season, surface soil moisture values ranged from 0.00%–22.82%, however, in the case of the post-monsoon season, surface soil moisture values ranged from 0.00%–70.26%. It was determined that in the pre-monsoon season, the maximum area of tehsil Faisalabad Saddar (1016.46 km2, 68.1% of total area) showed surface soil moisture contents ranging from 10.37% to 15.40%, followed by 0.00% to 10.36% (346.13 km2, 23.19% of total area). Only 8.7% of the total area (129.91 km2) exhibited surface soil moisture in the range of 15.41%–22.82% in the pre-monsoon season during the year 2021 (Table 3). It was astonishing to notice that no area in tehsil Faisalabad Saddar was detected with surface soil moisture above 22.82% in the pre-monsoon season during the year 2021. However, in the case of post-monsoon season, only 0.11% of the total study area (1.67 km2) exhibited surface soil moisture in the range of 0.00%–26.97%. The maximum area in post-monsoon season 2021 (780.46 km2, 52.29% of total area) exhibited surface soil moisture ranging from 36.18% to 40.02%, followed by 32.02%–36.17% (511.99 km2, 34.3% of total area). It was interesting to notice that the 122.68 km2 area (8.22% of the total area) showed surface soil moisture ranging from 40.03%–70.28% in the post-monsoon season during the year 2021 (Table 3). For statistical significance, Chi square test was performed and the null hypothesis was rejected, indicating that the soil moisture distribution differs significantly between the pre-monsoon and post-monsoon periods. These variations in surface soil moisture of tehsil Faisalabad Saddar in pre- and post-monsoon seasons can be associated with rainfall distribution during the year 2021, as high rainfall distribution is a direct contributor to higher SMI determined using Landsat 8 images [31]. Moreover, denser vegetation can also be a contributing factor towards higher surface soil moisture in the post-monsoon season. As previously reported by Zhang et al. [32], they recorded higher soil moisture values in the eastern and southeastern parts of the plateau where the altitude was lower and vegetation was denser.


Figure 5: Surface soil moisture (%) map of tehsil Faisalabad Saddar for pre- and post-monsoon season during the year 2021

Based on the results of the present study, a moderate positive correlation with R2 = 0.60 between field-based SM (%) and satellite-based SMI was recorded, which explains the reliability of the adopted methodology. Moreover, in this study, surface soil moisture maps of the Faisalabad Saddar area for pre- and post-monsoon seasons during the year 2021 were developed. Significant variations in surface soil moisture of the Faisalabad Saddar area were recorded, indicating that surface soil moisture of the Faisalabad Sadar area was higher in the post-monsoon season as compared to the pre-monsoon season.
It can be concluded that the retrieval of surface soil moisture using Landsat 8 TIRS data offers a promising alternative to avoid intensive fieldwork followed by laboratory analysis for mapping and monitoring the soil moisture content of a large area. Moreover, the novelty of this study lies in adopting this methodology for real-time estimation of surface soil moisture in agricultural fields to provide irrigation scheduling guidelines.
Although Landsat 8 TIRS data showed promising results for soil moisture retrieval with moderate correlation values, it was not high enough, which could be due to multiple factors like mixed pixel effects, temporal differences between field measurements and satellite overpasses, and less number of ground samples. The results could be further improved by avoiding sparse ground data and integrating multi-sensor fusion (UAV, SAR, etc.) and machine learning to enhance precision. Addressing these gaps can transform TIRS into a practical tool for sustainable agricultural water management.
Acknowledgement: The authors acknowledge the Agricultural Remote Sensing Lab ARSL, University of Agriculture Faisalabad for logistic support for this research.
Funding Statement: The authors received no specific funding for this study.
Author Contributions: Conceptualization, Zahid Maqbool and Muhammad Adnan Shahid; Introduction, Uzair Abbas and Saif Ullah Khan; Materials and methods, Uzair Abbas; Results and discussion, Uzair Abbas and Zahid Maqbool; Conclusions, Muhammad Adnan Shahid and Muhammad Safdar; Writing—original draft preparation, Uzair Abbas and Zahid Maqbool; Writing—review and editing, Muhammad Safdar and Muhammad Adnan Shahid. All authors reviewed the results and approved the final version of the manuscript.
Availability of Data and Materials: The data supporting the findings of this study are available from the corresponding author upon reasonable request.
Ethics Approval: Not applicable.
Conflicts of Interest: The authors declare no conflicts of interest to report regarding the present study.
References
1. Babaeian E, Sidike P, Newcomb MS, Maimaitijiang M, White SA, Demieville J, et al. A new optical remote sensing technique for high-resolution mapping of soil moisture. Front Big Data. 2019;2:37. doi:10.3389/fdata.2019.00037. [Google Scholar] [PubMed] [CrossRef]
2. Rasheed MW, Tang J, Sarwar A, Shah S, Saddique N, Khan MU, et al. Soil moisture measuring techniques and factors affecting the moisture dynamics: a comprehensive review. Sustainability. 2022;14(18):11538. doi:10.3390/su141811538. [Google Scholar] [CrossRef]
3. Pandey R, Goswami S, Sarup J, Matin S. The thermal–optical trapezoid model-based soil moisture estimation using Landsat-8 data. Model Earth Syst Environ. 2021;7(2):1029–37. doi:10.1007/s40808-020-00975-8. [Google Scholar] [CrossRef]
4. Ersahin S, Brohi AR. Spatial variation of soil water content in topsoil and subsoil of a typic ustifluvent. Agric Water Manage. 2006;83(1–2):79–86. doi:10.1016/j.agwat.2005.09.002. [Google Scholar] [CrossRef]
5. Shafian S, Maas S. Index of soil moisture using raw landsat image digital count data in Texas high plains. Remote Sens. 2015;7(3):2352–72. doi:10.3390/rs70302352. [Google Scholar] [CrossRef]
6. Sheffield J, Wood EF. Global trends and variability in soil moisture and drought characteristics, 1950–2000, from observation-driven simulations of the terrestrial hydrologic cycle. J Clim. 2008;21(3):432–58. doi:10.1175/2007jcli1822.1. [Google Scholar] [PubMed] [CrossRef]
7. Brocca L, Moramarco T, Melone F, Wagner W, Hasenauer S, Hahn S. Assimilation of surface- and root-zone ASCAT soil moisture products into rainfall–runoff modeling. IEEE Trans Geosci Remote Sens. 2012;50(7):2542–55. doi:10.1109/TGRS.2011.2177468. [Google Scholar] [CrossRef]
8. Hassaballa AA, Althuwaynee OF, Pradhan B. Extraction of soil moisture from RADARSAT-1 and its role in the formation of the 6 December 2008 landslide at Bukit Antarabangsa, Kuala Lumpur. Arab J Geosci. 2014;7(7):2831–40. doi:10.1007/s12517-013-0990-6. [Google Scholar] [CrossRef]
9. Yang N, Qin Q, Jin C, Yao Y. The comparison and application of the methods for monitoring farmland drought based on NIR-red spectral space. In: Proceedings of the IGARSS 2008—2008 IEEE International Geoscience and Remote Sensing Symposium; 2008 Jul 7–11; Boston, MA, USA. p. III-871–4. doi:10.1109/IGARSS.2008.4779488. [Google Scholar] [CrossRef]
10. Parida BR, Collado WB, Borah R, Hazarika MK, Samarakoon L. Detecting drought-prone areas of rice agriculture using a MODIS-derived soil moisture index. GISci Remote Sens. 2008;45(1):109–29. doi:10.2747/1548-1603.45.1.109. [Google Scholar] [CrossRef]
11. Tuller M, Babaeian E, Jones S, Montzka C, Sadeghi M, Vereecken H. The paramount societal impact of soil moisture [Internet]. [cited 2025 Jul 9]. Available from: https://eos.org/editors-vox/the-paramount-societal-impact-of-soilmoisture. [Google Scholar]
12. Korres W, Reichenau TG, Schneider K. Patterns and scaling properties of surface soil moisture in an agricultural landscape: an ecohydrological modeling study. J Hydrol. 2013;498:89–102. doi:10.1016/j.jhydrol.2013.05.050. [Google Scholar] [CrossRef]
13. Verstraeten WW, Veroustraete F, Feyen J. Assessment of evapotranspiration and soil moisture content across different scales of observation. Sensors. 2008;8(1):70–117. doi:10.3390/s8010070. [Google Scholar] [PubMed] [CrossRef]
14. Vereecken H, Huisman JA, Pachepsky Y, Montzka C, van der Kruk J, Bogena H, et al. On the spatio-temporal dynamics of soil moisture at the field scale. J Hydrol. 2014;516:76–96. doi:10.1016/j.jhydrol.2013.11.061. [Google Scholar] [CrossRef]
15. Rahimzadeh-Bajgiran P, Berg AA, Champagne C, Omasa K. Estimation of soil moisture using optical/thermal infrared remote sensing in the Canadian Prairies. ISPRS J Photogramm Remote Sens. 2013;83:94–103. doi:10.1016/j.isprsjprs.2013.06.004. [Google Scholar] [CrossRef]
16. Srivastava PK. Satellite soil moisture: review of theory and applications in water resources. Water Resour Manage. 2017;31(10):3161–76. doi:10.1007/s11269-017-1722-6. [Google Scholar] [CrossRef]
17. Mohamed ES, Ali A, El-Shirbeny M, Abutaleb K, Shaddad SM. Mapping soil moisture and their correlation with crop pattern using remotely sensed data in arid region. Egypt J Remote Sens Space Sci. 2020;23(3):347–53. doi:10.1016/j.ejrs.2019.04.003. [Google Scholar] [CrossRef]
18. Sadeghi M, Babaeian E, Tuller M, Jones SB. The optical trapezoid model: a novel approach to remote sensing of soil moisture applied to Sentinel-2 and Landsat-8 observations. Remote Sens Environ. 2017;198:52–68. doi:10.1016/j.rse.2017.05.041. [Google Scholar] [CrossRef]
19. Yang Y, Cao C, Pan X, Li X, Zhu X. Downscaling land surface temperature in an arid area by using multiple remote sensing indices with random forest regression. Remote Sens. 2017;9(8):789. doi:10.3390/rs9080789. [Google Scholar] [CrossRef]
20. Mao F, Han L. Retrieving soil moisture in Hebei by using temperature vegetation dryness index. J Geosci Environ Prot. 2017;5(8):10–6. doi:10.4236/gep.2017.58002. [Google Scholar] [CrossRef]
21. Sun H, Zhou B, Liu H. Spatial evaluation of soil moisture (SMland surface temperature (LSTand LST-derived SM indexes dynamics during SMAPVEX12. Sensors. 2019;19(5):1247. doi:10.3390/s19051247. [Google Scholar] [PubMed] [CrossRef]
22. Khan IA, Arsalan MH, Ghazal L, Siddiqui MF, Mehdi MR, Zia I, et al. Satellite based assessment of soil moisture and associated factors for vegetation cover: a case study of Pakistan and adjoining regions. Pak J Bot. 2018;50(2):699–709. [Google Scholar]
23. Saha A, Patil M, Goyal VC, Rathore DS. Assessment and impact of soil moisture index in agricultural drought estimation using remote sensing and GIS techniques. Proceedings. 2019;7(1):2. doi:10.3390/ecws-3-05802. [Google Scholar] [CrossRef]
24. Hassan AM, Belal AA, Hassan MA, Farag FM, Mohamed ES. Potential of thermal remote sensing techniques in monitoring waterlogged area based on surface soil moisture retrieval. J Afr Earth Sci. 2019;155:64–74. doi:10.1016/j.jafrearsci.2019.04.005. [Google Scholar] [CrossRef]
25. Sabah A, Afsar S. Assessing spatio-temporal changes of soil moisture: a case study at Karachi, Pakistan. Arab J Geosci. 2021;13(24):1302. doi:10.1007/s12517-020-06247-0. [Google Scholar] [CrossRef]
26. Taloor AK, Manhas DS, Chandra Kothyari G. Retrieval of land surface temperature, normalized difference moisture index, normalized difference water index of the Ravi basin using Landsat data. Appl Comput Geosci. 2021;9:100051. doi:10.1016/j.acags.2020.100051. [Google Scholar] [CrossRef]
27. Fan L, Al-Yaari A, Frappart F, Swenson JJ, Xiao Q, Wen J, et al. Mapping soil moisture at a high resolution over mountainous regions by integrating in situ measurements, topography data, and MODIS land surface temperatures. Remote Sens. 2019;11(6):656. doi:10.3390/rs11060656. [Google Scholar] [CrossRef]
28. Natsagdorj E, Renchin T, Kappas M, Tseveen B, Dari C, Tsend O, et al. An integrated methodology for soil moisture analysis using multispectral data in Mongolia. Geo Spat Inf Sci. 2017;20(1):46–55. doi:10.1080/10095020.2017.1307666. [Google Scholar] [CrossRef]
29. Khellouk R, Barakat A, El Jazouli A, Boudhar A, Lionboui H, Rais J, et al. An integrated methodology for surface soil moisture estimating using remote sensing data approach. Geocarto Int. 2021;36(13):1443–58. doi:10.1080/10106049.2019.1655797. [Google Scholar] [CrossRef]
30. Sutariya S, Hirapara A, Meherbanali M, Tiwari MK, Sıngh V, Kalubarme M. Soil moisture estimation using sentinel-1 SAR data and land surface temperature in panchmahal district, gujarat state. Int J Environ Geoinformatics. 2021;8(1):65–77. doi:10.30897/ijegeo.777434. [Google Scholar] [CrossRef]
31. Tajudin N, Ya’acob N, Mohd Ali D, Adnan NA. Soil moisture index estimation from landsat 8 images for prediction and monitoring landslide occurrences in Ulu Kelang, Selangor, Malaysia. Int J Electr Comput Eng IJECE. 2021;11(3):2101. doi:10.11591/ijece.v11i3.pp2101-2108. [Google Scholar] [CrossRef]
32. Zhang Y, Liang S, Zhu Z, Ma H, He T. Soil moisture content retrieval from Landsat 8 data using ensemble learning. ISPRS J Photogramm Remote Sens. 2022;185:32–47. doi:10.1016/j.isprsjprs.2022.01.005. [Google Scholar] [CrossRef]
Cite This Article
 Copyright © 2025 The Author(s). Published by Tech Science Press.
This work is licensed under a Creative Commons Attribution 4.0 International License , which permits unrestricted use, distribution, and reproduction in any medium, provided the original work is properly cited.
 Downloads
 Citation Tools