
 Submit a Paper
 Propose a Special lssue
 Open Access
ARTICLE

Spatial Equity in Urban Mobility: A PCA-Based Analysis of Multimodal Accessibility in Caen, France
Laboratoire Ville Mobilité Transport, Université Gustave Eiffel, 6-8 Av. Blaise Pascal, Champs-sur-Marne, 77420, France
* Corresponding Author: Kofi Bonsu. Email:
(This article belongs to the Special Issue: Advancements in Geospatial Methods and Technologies for Sustainable Built Environment and Engineering)
Revue Internationale de Géomatique 2025, 34, 639-654. https://doi.org/10.32604/rig.2025.067000
Received 23 April 2025; Accepted 17 July 2025; Issue published 11 August 2025
 View Full Text
 Download PDF
Abstract
This study analyzes the spatial accessibility of key services in Caen, France, focusing on how different transport modes (car, bicycle, and public transit) influence access to essential services across the urban and suburban landscape. Indeed, the introduction of traffic restrictions in towns with low emission zones encourages a detailed study, on a fine spatial scale, of the differences in accessibility between different modes of transport, for different services and for different journey times. Using spatial analysis techniques, we examine accessibility patterns in relation to services such as shops, healthcare, education, and tourism, highlighting significant disparities between transport modes. The findings reveal that car travel provides the highest accessibility across all service categories, particularly for healthcare and recreational services, while bicycle and public transit accessibility is more limited, especially in peripheral areas. A Principal Component Analysis (PCA) synthesizes the multimodal accessibility data, and hierarchical clustering identifies distinct patterns of accessibility using different transport modes across the city. The study further explores temporal trends in accessibility, showing how different modes perform over varying travel times. Based on these findings, we propose targeted policy interventions aimed at improving public transit, enhancing cycling infrastructure, decentralizing essential services, and promoting mixed-use urban development. Future research directions include examining socio-economic disparities, the impact of emerging mobility technologies, and the environmental implications of accessibility patterns. This research provides valuable insights for urban planners seeking to improve mobility equity and sustainability in urban areas.Keywords
In an increasingly urbanized world, access to essential services such as healthcare, education, and employment is not just a matter of convenience but a fundamental pillar of social equity and sustainable development. The concept of “accessibility” has evolved significantly, shaped by various disciplinary perspectives and technological advancements. Originally rooted in transportation planning, accessibility now plays a crucial role in urban geography, public health, and spatial economics, serving as a framework for addressing societal challenges [1–3]. Accessibility can be measured for any location, providing valuable insights into spatial dynamics. For instance, it can be calculated for populations represented in datasets such as the INSEE population grid. This information helps identify areas suitable for development—such as locations with high accessibility but low population density—and detect inequalities in access to essential services—such as high-population areas with poor accessibility.
The foundational work of Hansen [4] defined accessibility as the “potential for interaction,” emphasizing both spatial and functional dimensions. Later, Dalvi and Martin [5] expanded on this by introducing a transportation-focused perspective, defining accessibility as “the ease with which any land use activity can be reached using a particular transport system.” These early definitions laid the foundation for decades of research on spatial connectivity and mobility. Over time, accessibility has become a key tool in policymaking, influencing urban planning and public health initiatives. Planners use accessibility metrics to design inclusive cities, while health officials assess healthcare equity through spatial analysis. However, accessibility is a multidimensional concept, making it difficult to interpret straightforwardly. Measuring accessibility across different services—such as education, healthcare, and employment—requires considering multiple transport modes and population characteristics. Combining these diverse factors in a single metric risks oversimplification, which is why researchers often use disaggregated approaches tailored to specific policy needs [6].
Despite its significance, accessibility measurement remains challenging due to methodological inconsistencies, varying definitions, and difficulties in capturing socio-economic disparities and multi-modal connectivity [7,8]. Recent advancements in Geographic Information Systems (GIS), accurate and collaborative description of the road networks with OpenStreetMap (OSM), and open source multimodal itinerary planners such as OpenTripPlanner (OTP) have improved accessibility analysis by providing more detailed and scalable assessments. However, a persistent challenge remains: while complex accessibility measures offer greater accuracy, they require significant computational resources and expertise, limiting their usability for policymakers. In contrast, simplified measures, though more practical, often overlook critical inequities and multimodal transportation factors [8,9]. A key methodological gap in current accessibility research is the difficulty of integrating multiple types of accessibility indicators in a meaningful way. Different services (e.g., healthcare, education, and tourism) and transport modes (e.g., car, bicycle, and public transit) each have distinct accessibility patterns that cannot simply be aggregated into a single metric without losing important nuances [8].
This research aims to bridge this methodological gap by evaluating accessibility to various facilities—including education, healthcare, individual services, sports, shops, transport, and tourism—across multiple transportation modes: car, bicycle, and public transit. By employing advanced GIS tools and OpenTripPlanner, the study generates multimodal isochrones and streamlines analysis through Python-based workflows. Principal Component Analysis (PCA) is applied to synthesize accessibility indicators, enabling geovisualization and correlation analysis to reveal patterns in multimodal connectivity and socio-spatial equity. This approach provides a clearer understanding of accessibility disparities and inefficiencies in urban transportation networks and facilitates the construction of synthetic maps. PCA is a dimension reduction technique which offers a robust solution by identifying dominant patterns across multiple accessibility indicators while preserving key relationships between variables [10]. Although PCA provides a powerful framework for variance decomposition, it represents just one approach among several alternatives—each with distinct advantages and limitations. For instance, Factor Analysis (FA) proves particularly valuable when researchers hypothesize latent constructs underlying observed variables [11]. In contrast, nonlinear techniques like t-SNE and UMAP excel at revealing spatial clusters that linear methods might miss, such as isolated neighborhoods with unique mobility constraints [12]. When dealing with high-dimensional, non-Euclidean data (e.g., pedestrian networks), Isomap demonstrates superior performance in preserving true travel distances compared to linear methods [13]. Meanwhile, autoencoders—a sophisticated deep learning approach—can capture complex, nonlinear interactions that PCA’s linear assumptions cannot adequately represent [14]. However, empirical comparisons of these PCA alternatives are beyond the scope of the current analysis. Nonetheless, this study employs PCA for three principal reasons that align with the research objectives:
1. Its computational efficiency enables analysis of large-scale accessibility datasets;
2. The orthogonality of principal components facilitates clear interpretation of dominant accessibility patterns; and
3. Its proven effectiveness in similar urban mobility studies [15].
As part of the fight against global warming and air pollution, cities across Europe are gradually introducing low emission zones (LEZ), which are zones reserved for the latest vehicles. This measure has the potential to affect the most modest households which are unable to replace their vehicles and are therefore forced to switch to other modes of transport, such as public transit or cycling. It is therefore important to carry out a detailed accessibility analysis to identify which areas of a city will have their overall accessibility reduced as a result of this measure. This assessment must be carried out for the access to essential services, and also for different travel times, so as to draw up a precise map of the social impact of the introduction of LEZs.
The study focuses on Caen (Fig. 1), a medium-sized French city. Cities of this scale—those with populations over 100,000—often experience road congestion and inequalities in access to public transport. Caen, located in the Normandy region, is particularly relevant due to its mix of historical landmarks, modern developments, and suburban areas [16]. The city has a multimodal transportation system, including buses, trams, cycling infrastructure, and road networks, making it an ideal setting to assess accessibility by different modes. Furthermore, Caen has been actively investing in sustainable urban mobility, such as expanding its tram network [17] and promoting cycling through dedicated lanes and bike-sharing programs [18]. Its compact urban structure and socio-economic diversity provide a compelling case for studying accessibility-related inequalities. Caen is concerned by the implementation of LEZs, as well as ten of its surrounding municipalities.
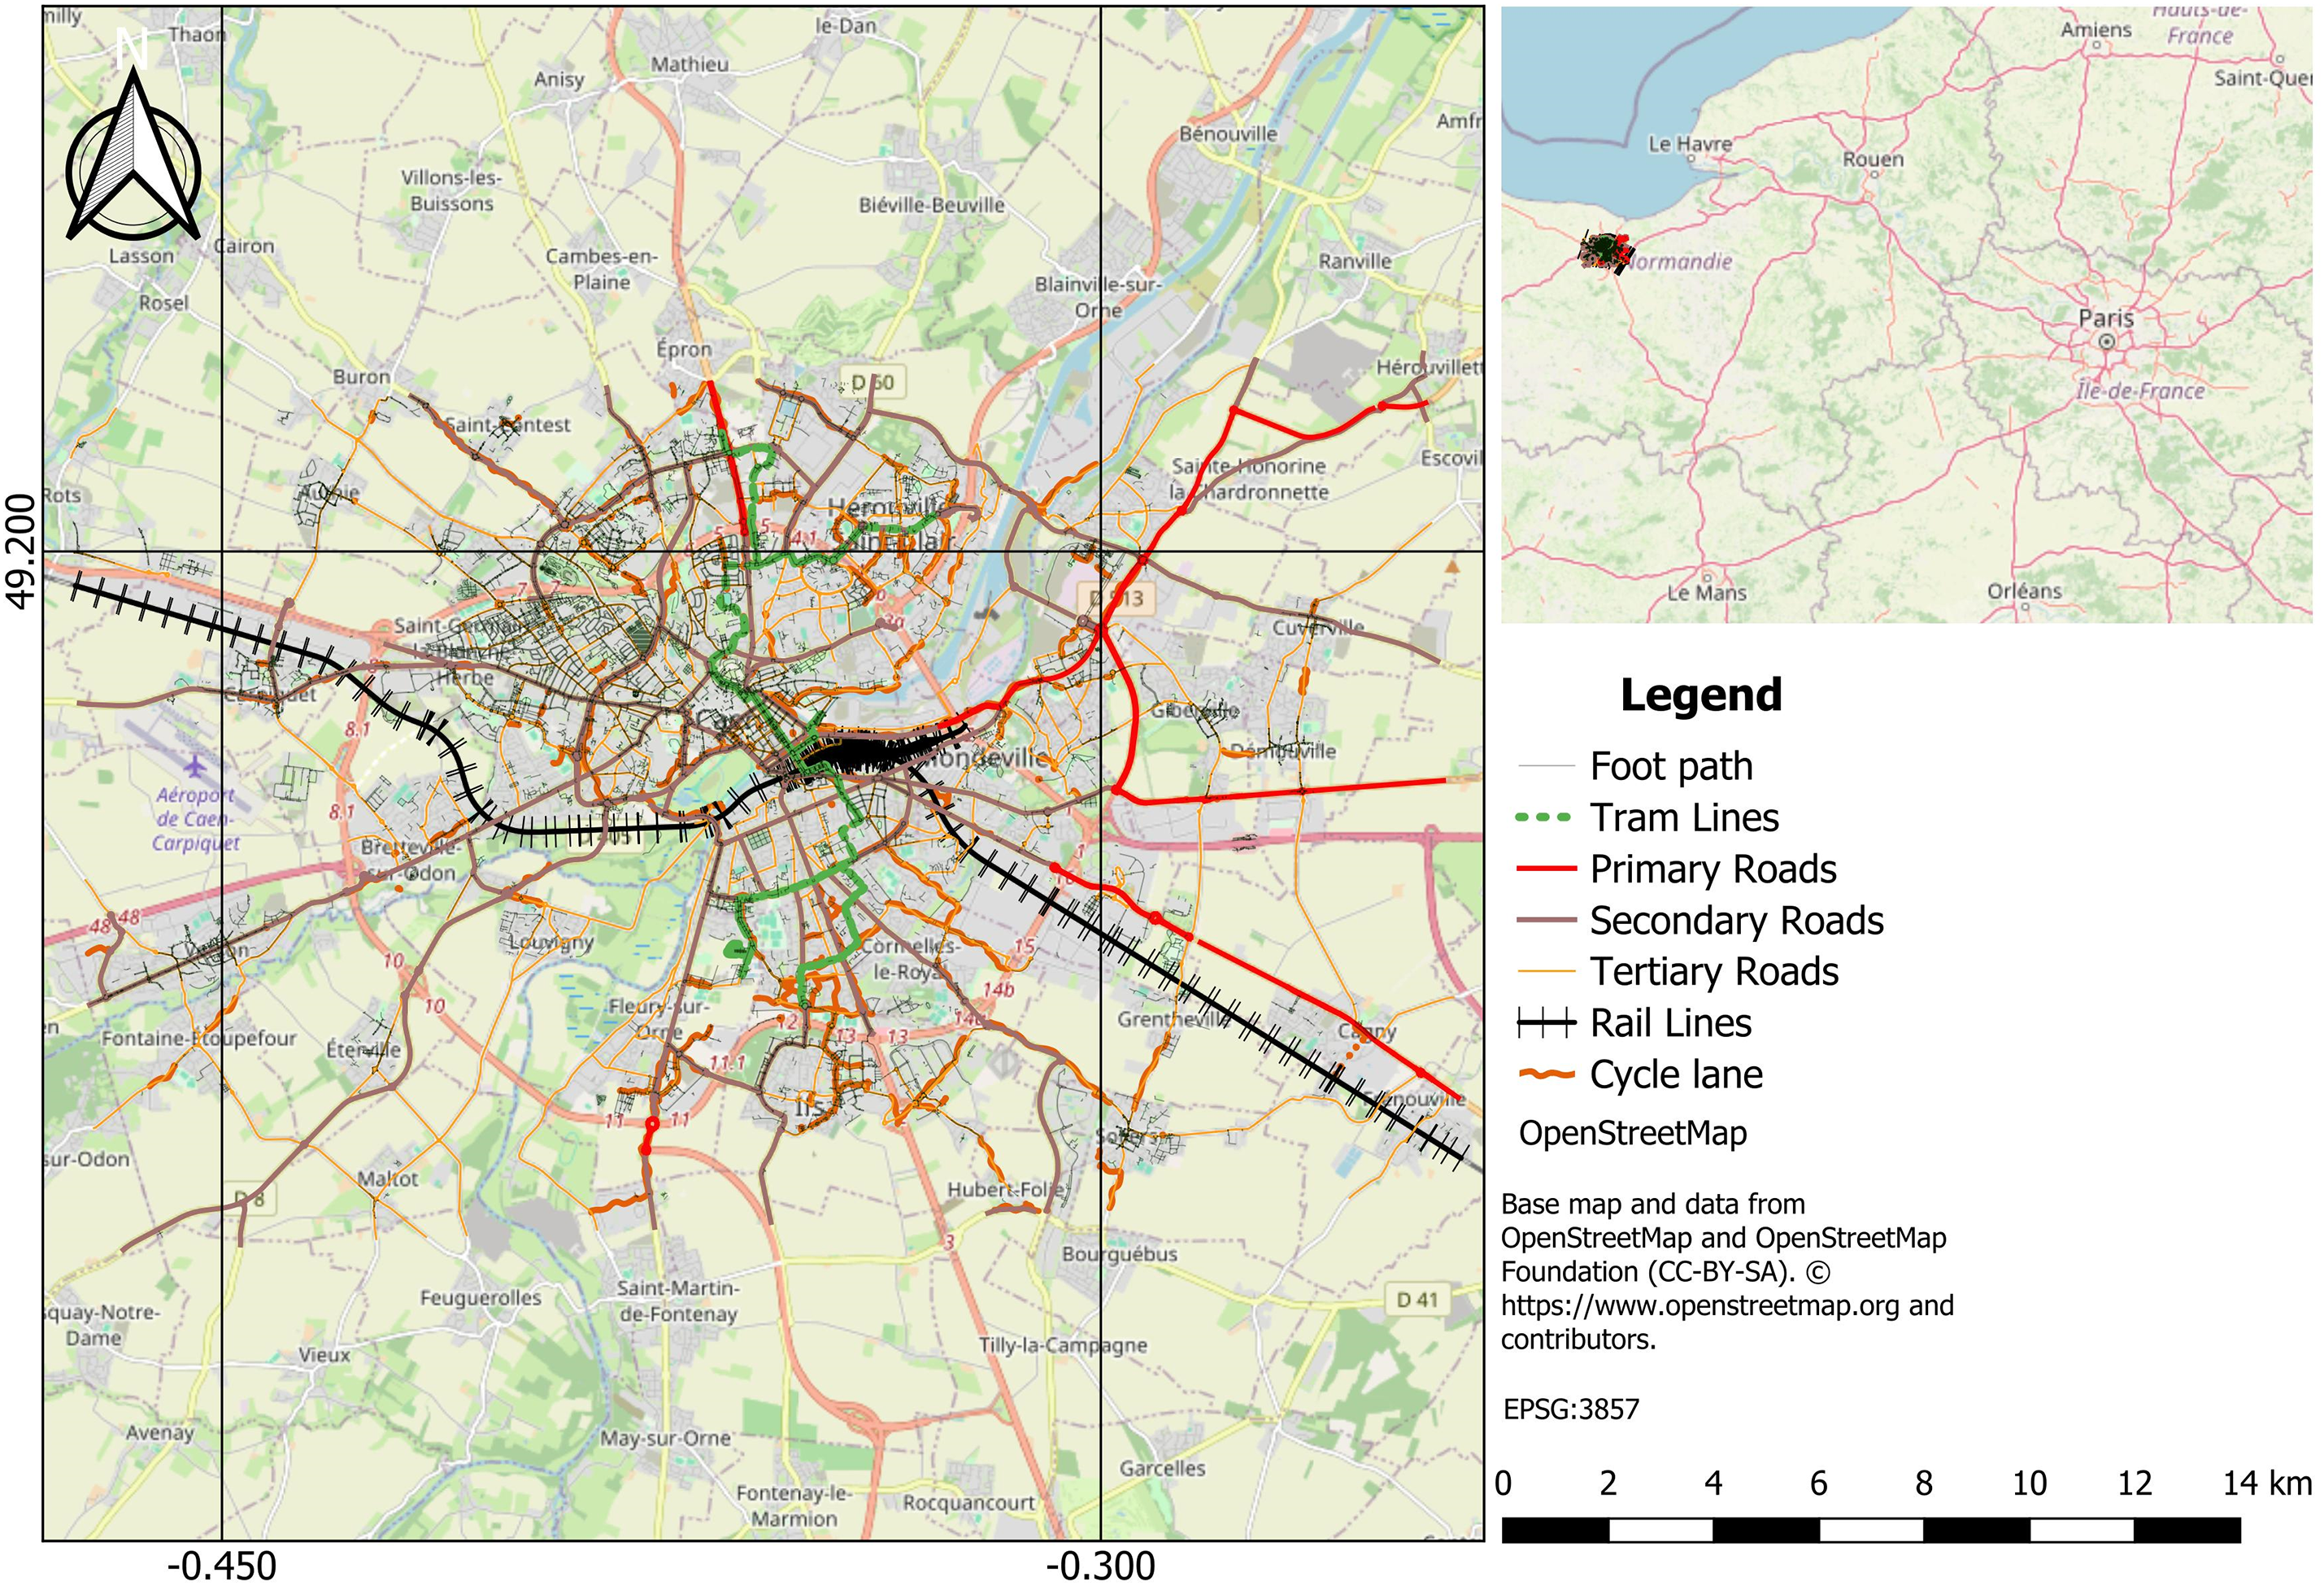
Figure 1: Map of study area, Caen
By applying the proposed methodology to Caen, the study seeks to answer the following research questions:
1. How do accessibility levels vary across different services (education, healthcare, shops, etc.) and transport modes (car, bicycle, public transit);
2. What are the key spatial patterns of accessibility in Caen, and where are the most significant disparities;
3. How can accessibility insights inform urban planning and transport policies to promote equitable and sustainable mobility, and mitigate the impacts of the LEZ?
The findings of this research aim to support equitable and sustainable urban development by integrating complex and simplified accessibility measures. By using open-source data and tools, this study contributes to open science and provides a replicable methodology for other cities facing similar challenges. Additionally, the research highlights how combining accessibility indicators through PCA can improve urban decision-making by offering clearer insights into spatial inequalities.
Moreover, the study directly aligns with key European urban mobility initiatives, such as the European Green Deal and Sustainable Urban Mobility Plans (SUMPs). These frameworks advocate for reduced car dependency, increased use of active and public transport, and greater attention to accessibility equity. By analyzing spatial disparities in access to essential services under different modes of transport—and assessing the potential impact of LEZs—this research supports the formulation of policies that are both environmentally sustainable and socially inclusive.
The remainder of this article is structured as follows: Section 2 outlines the materials and methodology, Section 3 presents the results and Section 4 discusses policy implications and future research directions.
This study relies on open-source datasets and geospatial tools to evaluate accessibility in Caen. It can be replicated on any French city and uses French reference data produced by government agencies (with the exception of OpenStreetMap). The materials used are categorized as follows:
1. Population Data: A 200-m grid dataset (2019) from the Institut National de la Statistique et des Études Économiques (INSEE), providing detailed population distribution data.
2. Facility Data: The Base Permanente des Équipements (BPE) (2023) from INSEE, offering geolocated information on key amenities, including healthcare, education, and retail facilities.
3. Transportation Data: General Transit Feed Specification (GTFS) data from transport.data.gouv.fr, containing public transit schedules, routes, and stop locations for multimodal transport analysis.
4. Spatial Data: OpenStreetMap (OSM) data in .pbf format, used to extract road networks, pedestrian pathways, and cycling infrastructure.
1. OpenTripPlanner (OTP) [otp-1.5.0-shaded.jar]: Used to generate isochrones for multimodal travel time analysis.
2. QGIS (3.40.1): Used for geospatial visualization, spatial data processing, and map production.
3. Python Libraries: Geopandas, Shapely—Handling geospatial data; NumPy, SciPy, sklearn—Statistical analysis and dimensionality reduction; Matplotlib, Seaborn—Data visualization and graphical representation.
These datasets and tools enabled a detailed accessibility analysis, integrating population distribution, facility locations, and transport networks to assess spatial inequalities and mobility patterns in Caen, and can be adapted to any other location in France.
To evaluate accessibility in Caen, the 200-m INSEE population grid was used as a uniform spatial sampling framework. This dataset offers several advantages:
1. It provides nationwide coverage in GIS format, making it highly adaptable;
2. The grid ensures no inaccessible locations (e.g., rivers, highways) are used as origins for travel time computations; and
3. New grid squares can be added to analyze potential urban expansion.
Two approaches were considered for synthesizing accessibility results:
1. Hansen-like gravity models: weighted accessibility scores were computed using an impedance function that decreases with travel time or distance. The travel impedance was discretized into different time thresholds to capture variations in accessibility levels. In this model, the attractiveness of origin and destination areas is primarily measured by the availability and diversity of services and facilities relevant to each category (e.g., shops, healthcare, education). Specifically, we use the number and type of accessible amenities within each spatial unit as proxies for attractiveness, reflecting demand at origins and opportunities at destinations. The distance decay coefficient was calibrated based on expert judgment to represent how travel impedance reduces the likelihood of accessing services as distance or travel time increases. This calibration helps the model realistically capture local mobility patterns.
The distance decay coefficient quantifies how quickly accessibility diminishes with increasing travel distance or time. Higher decay values indicate greater sensitivity to distance, meaning users are less willing to travel far to access certain services. The decay values assigned to each facility type reflect typical travel behaviors and service characteristics observed in Caen and similar urban contexts:
a. Education (1.5): Moderate decay reflects that students and staff tolerate moderate travel distances but prefer schools and universities to be reasonably close.
b. Health and Social Action (1.8): Higher decay indicates that people tend to seek healthcare services nearby due to urgency and frequency of visits.
c. Services for Individuals (1.5): Similar to education, many individual services (e.g., administrative offices) are accessed within moderate travel ranges.
d. Shops (1.0): Lower decay reflects the tendency to travel further for shopping, particularly specialty or large retail stores.
e. Sports, Leisure, and Recreation (1.8): High decay reflects infrequent visits to recreational facilities, with users favoring closer options for convenience.
f. Tourism (1.9): The highest decay value, indicating tourists generally prefer attractions nearby and are less likely to travel long distances to dispersed sites.
g. Transport and Travel (1.0): Lower decay reflects that transport hubs (e.g., stations, airports) serve wide catchment areas, with users accepting longer travel distances.
These parameters allow the gravity model to more accurately represent local access behaviors and improve the reliability of accessibility estimates across different service categories; and
2. Dimensionality reduction via PCA: instead of aggregating indicators into a single accessibility metric, PCA was applied to reduce dimensionality while preserving meaningful distinctions.
The raw dataset consists of a four-dimensional matrix: N, number of grid squares where accessibility is computed; P, number of Points of Interest (POI) categories (e.g., healthcare, education, shops); T, number of time intervals used for travel analysis; M, Number of transport modes. The final output is a PCA-transformed dataset, allowing flexible interpretation. For instance:
1. Accessibility can be analyzed for a specific mode (e.g., bicycle accessibility to all destinations);
2. Focus can be placed on a specific service (e.g., healthcare accessibility across all modes); and
3. Short-range vs. long-range accessibility can be emphasized based on planning needs.
This methodology ensures high replicability across time and space, allowing future studies to:
1. Reproduce the analysis in other cities using freely available data;
2. Track accessibility changes over time (e.g., assessing transport network improvements); and
3. Support urban planning decisions with data-driven insights on mobility and equity.
Isochrones are spatial boundaries representing areas reachable within a given travel time. In this study, isochrone maps were generated for multiple transport modes to assess accessibility across Caen. From the 200-m INSEE population grid, each grid cell’s midpoint was used as an origin point for accessibility calculations. From these origins, isochrones were generated for multiple travel times and transport modes (car, bicycle, and public transit). OpenTripPlanner (OTP) library was employed to compute the isochrones due to its ability to integrate multimodal transportation networks. OTP (version 1.5) was specifically chosen because it offers built-in isochrone computation capabilities, despite being an older version. This tool is particularly well-suited for public transit and bicycle itinerary calculations, with options to consider factors such as topography (slopes) when modeling cycling accessibility. The OTP framework was configured to process the following datasets:
1. OpenStreetMap (OSM) (pbf format): provides detailed road, pedestrian, and cycling networks;
2. GTFS data: supplies public transit schedules, routes, and stop locations;
3. Origin points: extracted from the centroids of INSEE population grid cells; and
4. User-defined parameters: specifies transport modes (public transit, bicycle, car), maximum travel times, and walking distance limits.
A python-based workflow was developed to automate isochrone generation using the OTP API. This script:
1. Reads CSV files containing origin coordinates (centroids of population grids);
2. Sends API requests with user-defined parameters, including:
a. Travel time cutoffs: 15-min intervals up to 90 min;
b. Maximum walking distance: set to ensure realistic travel scenarios; and
c. Processes API responses into shapefiles, stored in an organized directory for further geospatial analysis.
This automated approach enhances efficiency and reproducibility, allowing large-scale accessibility calculations with minimal manual intervention. The scripts used for centroid extraction and isochrone generation are publicly available on GitHub, ensuring transparency and ease of replication. These scripts can be adapted for other cities, making the methodology widely applicable for urban accessibility studies.
The Base Permanente des Équipements (BPE) is a comprehensive geospatial dataset maintained by INSEE from data collected by municipalities. It provides geolocated data on public and private facilities across France, serving as the primary source for facility information in this study. The BPE dataset is updated annually, ensuring up-to-date analysis of service availability. Facilities in the BPE dataset are classified into seven main categories:
1. Services for Individuals: Hair salons, banks, repair services.
2. Shops: Supermarkets, bakeries, bookstores, clothing stores.
3. Education: Preschools to universities.
4. Health and Social Services: Hospitals, medical offices, pharmacies, social assistance centers.
5. Transport and Mobility: Train stations, bus stops, metro stations, airports.
6. Sports, Leisure and Recreation: Gyms, swimming pools, libraries, cinemas.
7. Tourism: Hotels, campsites, tourism offices.
To extract and preprocess relevant facilities for the study area, an exploratory data analysis (EDA) was conducted to ensure data quality and relevance before integrating the facilities into the accessibility calculations. The Python script used for this analysis is publicly available on GitHub (Availability of Data and Materials).
2.2.3 Point Count in Isochrones
To quantify accessibility, the number of amenities (from the BPE dataset) accessible within each isochrone was then counted for each mode (car, bicycle, and public transit). These counts serve as accessibility indicators, allowing for comparisons across different locations and transportation modes. This process involved spatially joining the BPE facility dataset with the isochrone polygons generated in Section 2.2.1. This spatial operation ensures that only facilities within each travel-time boundary are considered in the accessibility calculations. The Python script used for this computation is publicly available on GitHub.
The resulting accessibility indicators provide insights into spatial equity (how evenly facilities are distributed across locations) and multi-modal connectivity (how accessibility varies across transport modes). These indicators can be analyzed in two key ways:
1. Spatial comparison: comparing accessibility between locations to identify areas with high or low service availability.
2. Modal comparison: comparing different travel modes to determine whether certain modes offer significantly better access to services.
However, direct comparisons between different POI categories (e.g., health vs. education) at a single location are less straightforward. Since the absolute number of amenities varies greatly by category, a normalization step (e.g., comparing each POI count to the category’s mean) is necessary to ensure meaningful aggregation and interpretation.
The python script of the geospatial analysis of accessibility in Caen is publicly available on GitHub.
2.2.4 Principal Component Analysis (PCA) and Hierarchical Clustering
To improve the interpretability of accessibility indicators derived from isochrone-based facility counts, we applied Principal Component Analysis (PCA) followed by hierarchical clustering. PCA was applied before clustering to reduce the dimensionality of the complex, multivariate accessibility dataset, which includes correlated variables across transport modes, service types, and time. PCA transforms these correlated variables into a smaller set of uncorrelated components that capture most of the variance, helping to reduce noise and redundancy. This improves the stability and interpretability of clustering by preventing distortion from multicollinearity and highlighting the main patterns in the data. Additionally, dimensionality reduction enhances computational efficiency and often results in clearer cluster separation, allowing us to identify meaningful spatial accessibility typologies more reliably than clustering directly on raw variables. Together, these techniques help to reduce complexity, reveal patterns in the data, and classify areas based on their accessibility levels to all facilities by transport mode. In this study, PCA was used to simplify the multi-dimensional dataset, which contains facility counts across different travel modes, time thresholds, and facility categories. By applying PCA, we achieved the following:
1. Reduced data redundancy: many accessibility indicators are correlated (e.g., areas with high bicycle accessibility may also have high public transit accessibility). PCA consolidates this redundancy into fewer components.
2. Improved interpretability: the first few principal components capture the majority of variance in the dataset, allowing for a more meaningful summary of accessibility patterns.
3. Standardized analysis: before applying PCA, all variables were standardized (mean = 0, standard deviation = 1) to ensure comparability across different units of measurement.
The principal components (PCs) serve as the best summaries of the accessibility indicators, as they are the most correlated (on average) with all initial variables. In practice, retaining only the first principal component (PC1) often provides a robust, low-noise summary of accessibility variations across the city. Following PCA, hierarchical clustering was used to categorize locations based on similarities in accessibility patterns. Specifically, Agglomerative Clustering (a bottom-up approach) was applied using Ward’s linkage method, which minimizes variance within clusters at each merging step. The clustering process identified four distinct accessibility categories: “High Accessibility”, “Medium Accessibility”, “Low Accessibility”, and “Very Low Accessibility”. Note that different territories might lead to somewhat different classifications, and that this step of the analysis must be supervised by a statistician. These clusters provide meaningful insights into spatial and socio-economic disparities in accessibility. By grouping areas with similar accessibility characteristics, policymakers can more effectively identify underserved regions and prioritize infrastructure improvements. To enhance interpretability, the clustered data was exported as shapefiles and visualized in QGIS—overlaid on the base map of Caen (OSM).
After analyzing each travel mode separately (i.e., car, bicycle, and public transit), the results were combined into a single dataset that includes accessibility data across all modes. This synthesis dataset was then subjected to PCA and clustering again to identify broader patterns of accessibility that account for all travel modes. This helps to:
1. Capture the overall accessibility patterns across different modes of transport (not just each mode in isolation); and
2. Identify how different modes of transport interact in terms of accessibility, and how their combination impacts areas’ accessibility scores.
The Python scripts for performing PCA and hierarchical clustering are publicly available on GitHub.
This section presents the key findings of the accessibility analysis in Caen, structured as follows:
1. Multimodal accessibility synthesis through PCA;
2. Accessibility to different categories of services;
3. Accessibility over time by transport mode; and
4. Accessibility by location.
3.1 Multimodal Accessibility Synthesis through PCA
The accessibility analysis revealed significant variations in service availability based on the mode of transport. Fig. 2 illustrates the spatial distribution of accessibility scores across Caen for car, bicycle, public transit, and a combination of all travel modes. As expected, car travel provided the highest overall accessibility across all facility categories (Fig. 2a). Most areas within Caen had access to a wide range of services within short travel times, however, peripheral areas exhibited lower accessibility. The heart of Caen (around Place Saint-Pierre, Rue Écuyère, and Rue Saint-Pierre) has limited car access, with some areas being pedestrian-only. The city has been reducing car traffic in favor of walking, cycling, and public transport. Many streets in the historic center are narrow and one-way, making driving difficult. Traffic can get congested, especially during rush hours (e.g., near Place Courtonne). This is why there are a lot of orange dots (very low accessibility) in the city center. Accessibility by bicycle was highest in the city center and along well-connected cycling corridors (Fig. 2b). However, gaps in the cycling network and topographical constraints led to lower accessibility scores in certain suburban and hilly areas. The spatial distribution of public transit accessibility showed strong centrality effects (Fig. 2c), with the highest accessibility scores concentrated around tram and major bus stops. Peripheral zones and areas with lower transit frequency exhibited significantly lower accessibility scores. When all three modes—public transit, car, and bicycle—were combined (Fig. 2d), the analysis revealed a more comprehensive picture of accessibility in Caen. The combined score in Fig. 2d is based in a principal component analysis (PCA) of all three transport modes so it captures the underlying patterns of variance across these modes rather than simply aggregating them. Consequently, areas with good car access but poor public transit or cycling infrastructure may still show medium or even very low multimodal accessibility. Furthermore, pedestrianized zones in central Caen—although relatively well-served by non-car modes—continue to score lower, indicating that these alternatives may not fully offset the limitations on car use. This shows that multimodal accessibility prioritizes balanced, sustainable transport integration over mere spatial coverage, emphasizing the need for improved coordination between transport modes to ensure equitable access across the city. Central areas benefited from high accessibility across all modes, creating a robust network that ensures residents can reach essential services efficiently. However, suburban and peripheral regions remain underserved, particularly for public transit and cycling. Car travel fills some of these gaps but at the cost of sustainability and equity. The integration of multimodal accessibility highlights the importance of developing complementary transportation systems. These findings highlight the importance of transport infrastructure in shaping accessibility patterns, with transit-dependent populations being particularly vulnerable to spatial inequalities.
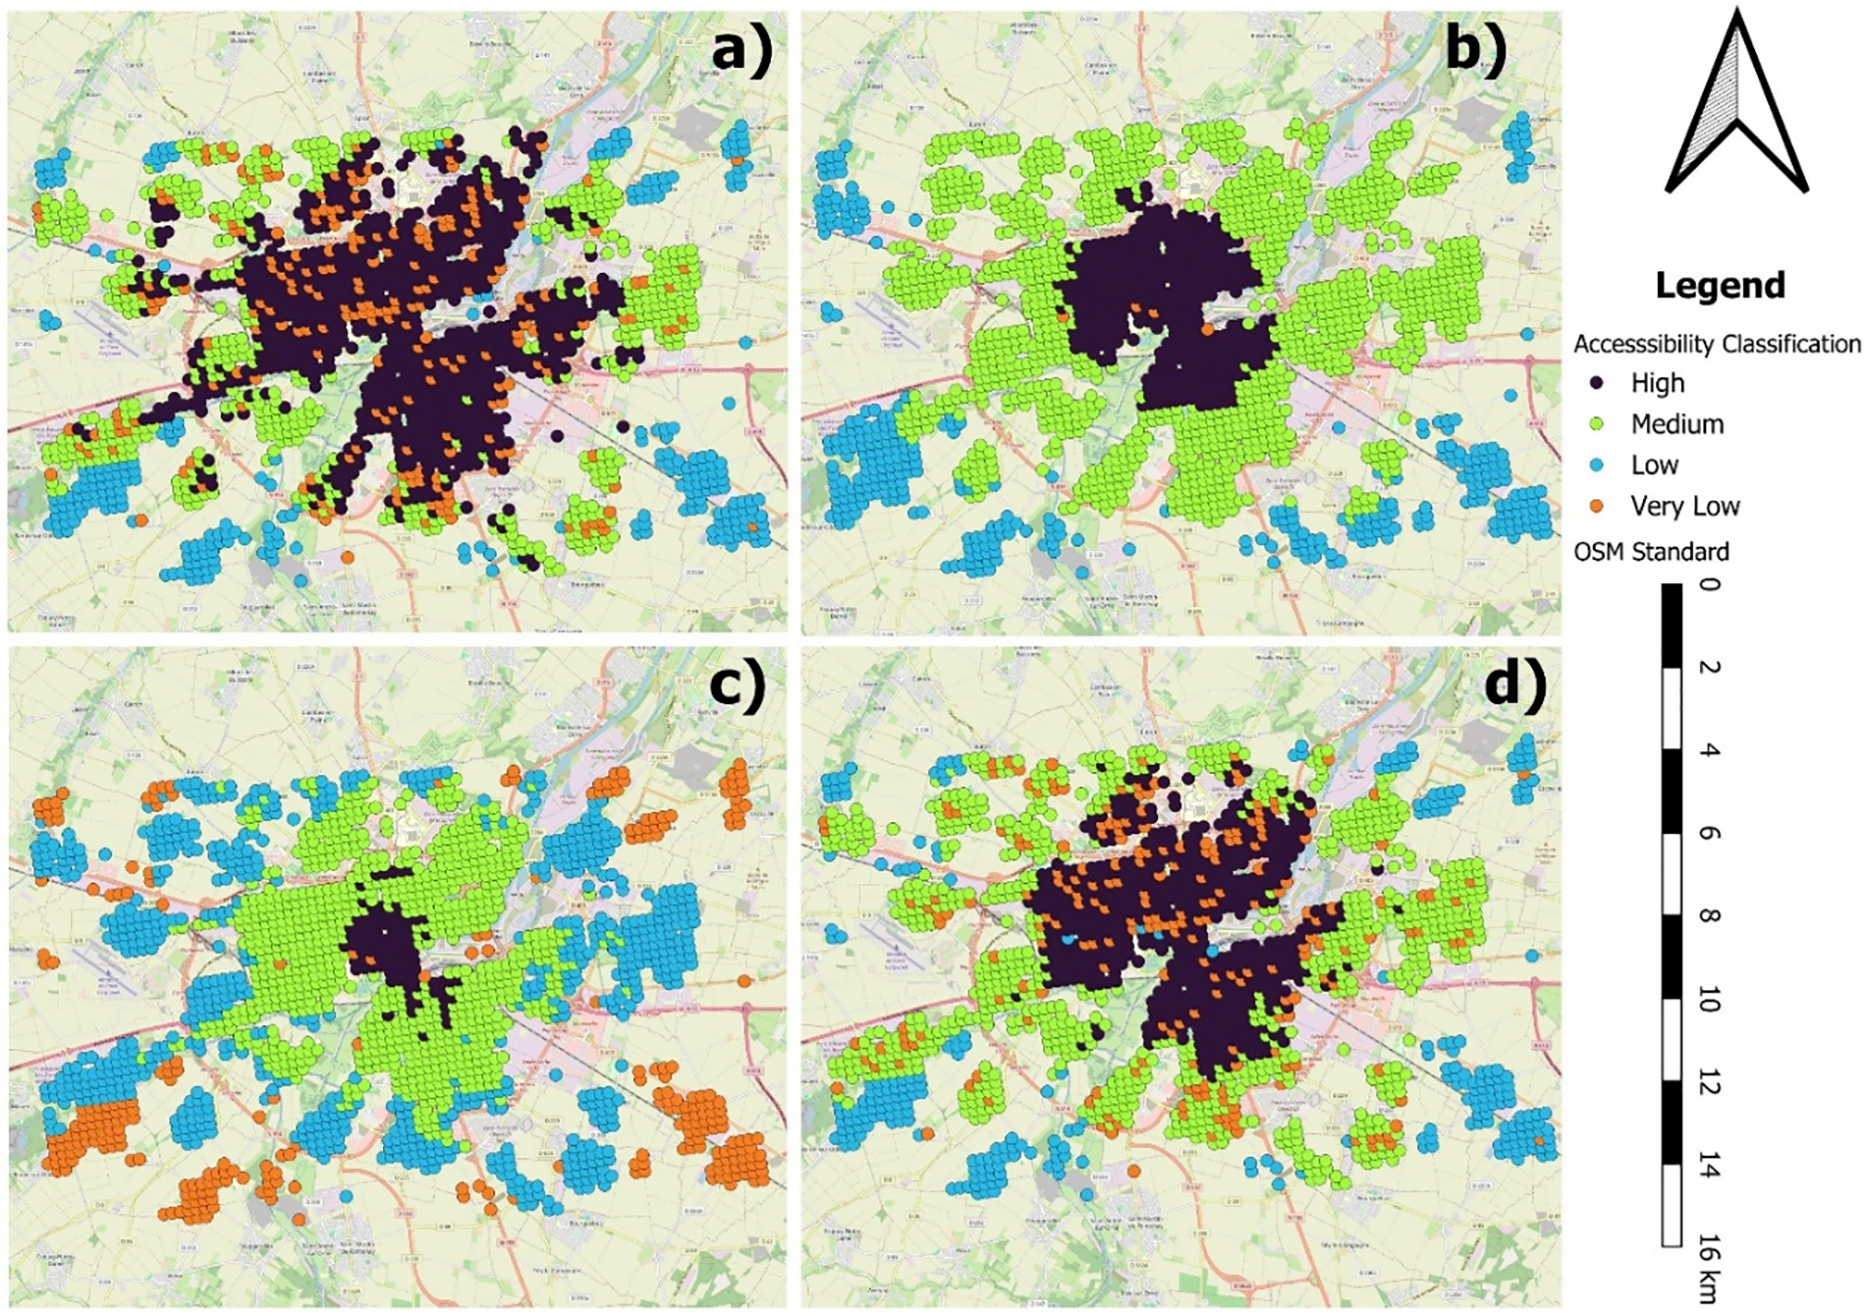
Figure 2: (a–d) Accessibility classification maps for Caen by transport mode. (a) Car, (b) Bicycle, (c) Public Transit, (d) Combined Multimodal. Darker zones indicate higher accessibility levels. The composite layout facilitates direct comparison of spatial access patterns across different modes
3.2 Accessibility to Different Categories of Services
Fig. 3 summarizes the average facility accessibility across transport modes for each service type. Car travel consistently offers the highest access levels, particularly for shops, healthcare, and transport-related services. This confirms the dominance of car-centric planning in Caen’s urban fabric.
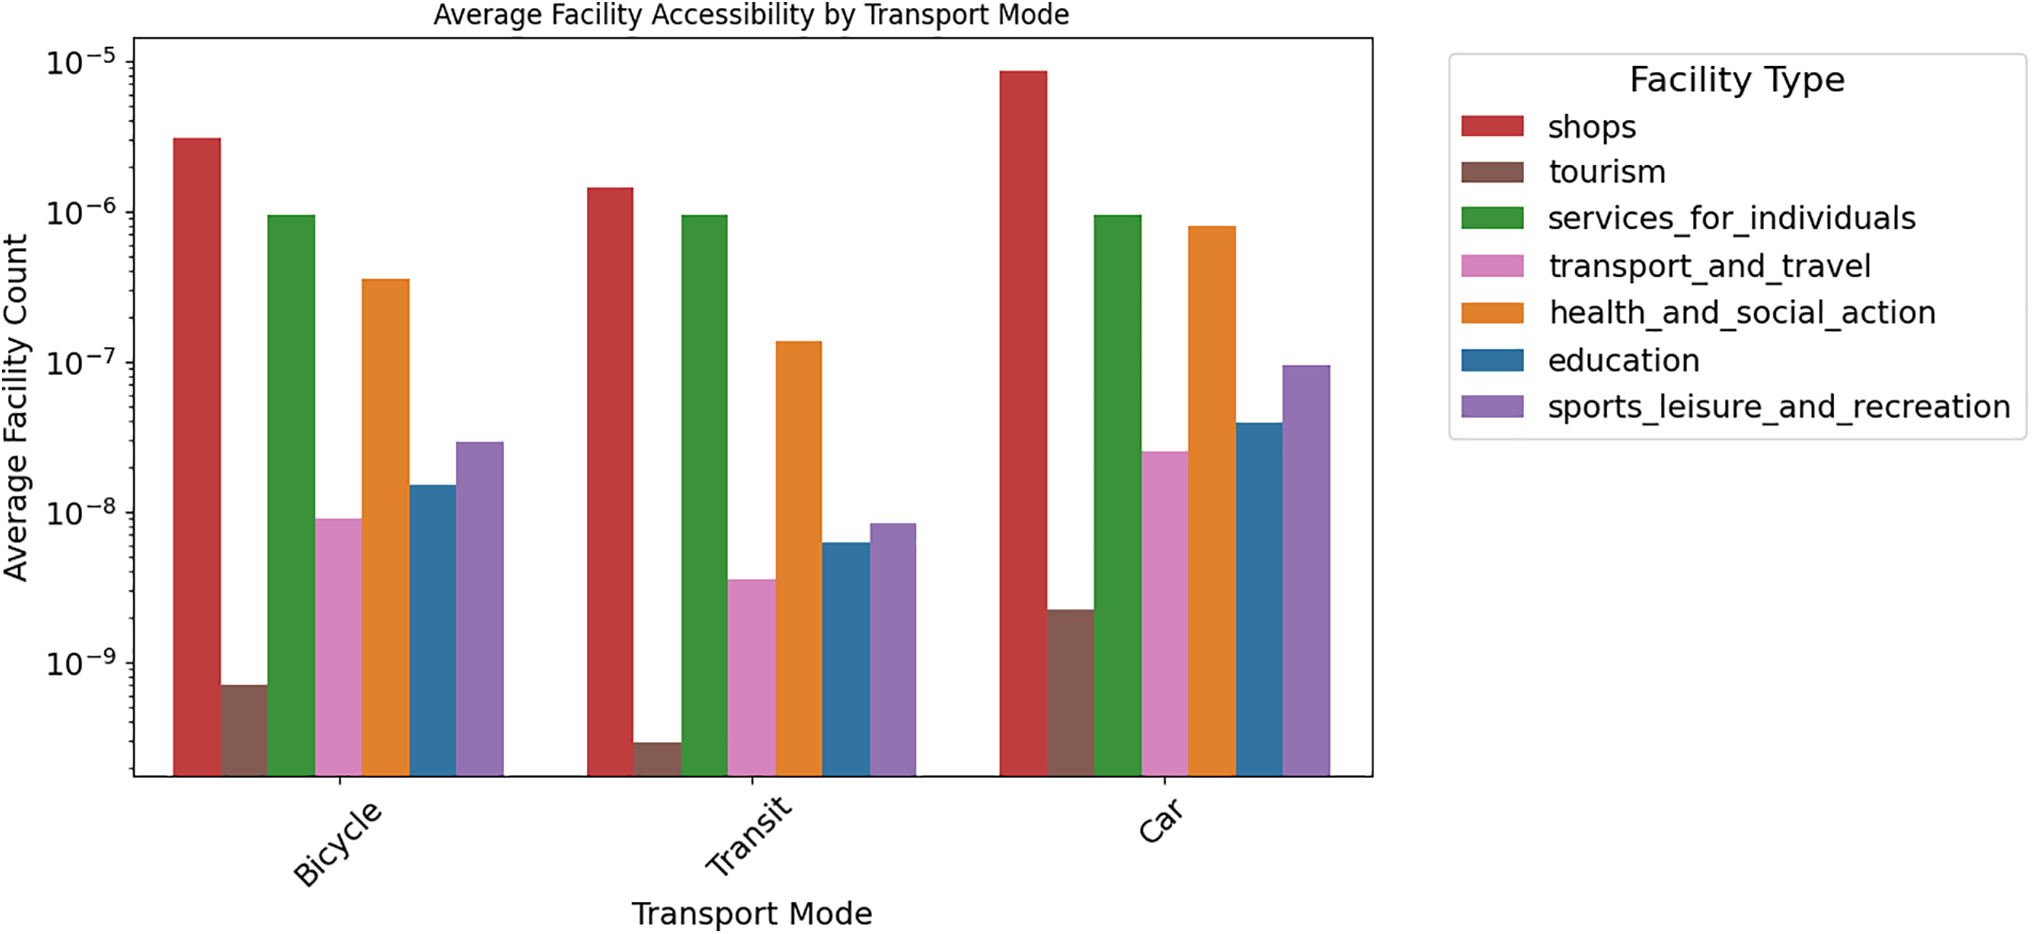
Figure 3: Average facility accessibility by transport mode and service type (log scale). Car travel outperforms other modes in most categories, though cycling provides competitive access for some central services. Tourism, healthcare, and transport hubs remain least accessible by non-car modes
Bicycles provide relatively strong access to centrally located services such as shops and services for individuals, sometimes outperforming transit. Public transit, while moderate overall, underperforms particularly for healthcare and tourism facilities, highlighting coverage or network inefficiencies.
Education and recreational services show lower access levels across all modes, reflecting suburban or spatially dispersed locations. The chart also shows that tourism and transport hubs pose challenges for non-car users, suggesting the need for better intermodal integration and strategic infrastructure expansion.
This side-by-side comparison underscores the need for targeted investment in public transit and cycling infrastructure, especially for healthcare, education, and tourism services, to reduce car dependency and promote sustainable, equitable access.
3.3 Accessibility over Time by Transport Mode
Understanding how accessibility changes over time for different transport modes provides insights into mobility efficiency and connectivity. Fig. 4 is a chart showing accessibility trends for cars, bicycles, and public transit over a range of travel times, highlighting differences in reachability across modes.
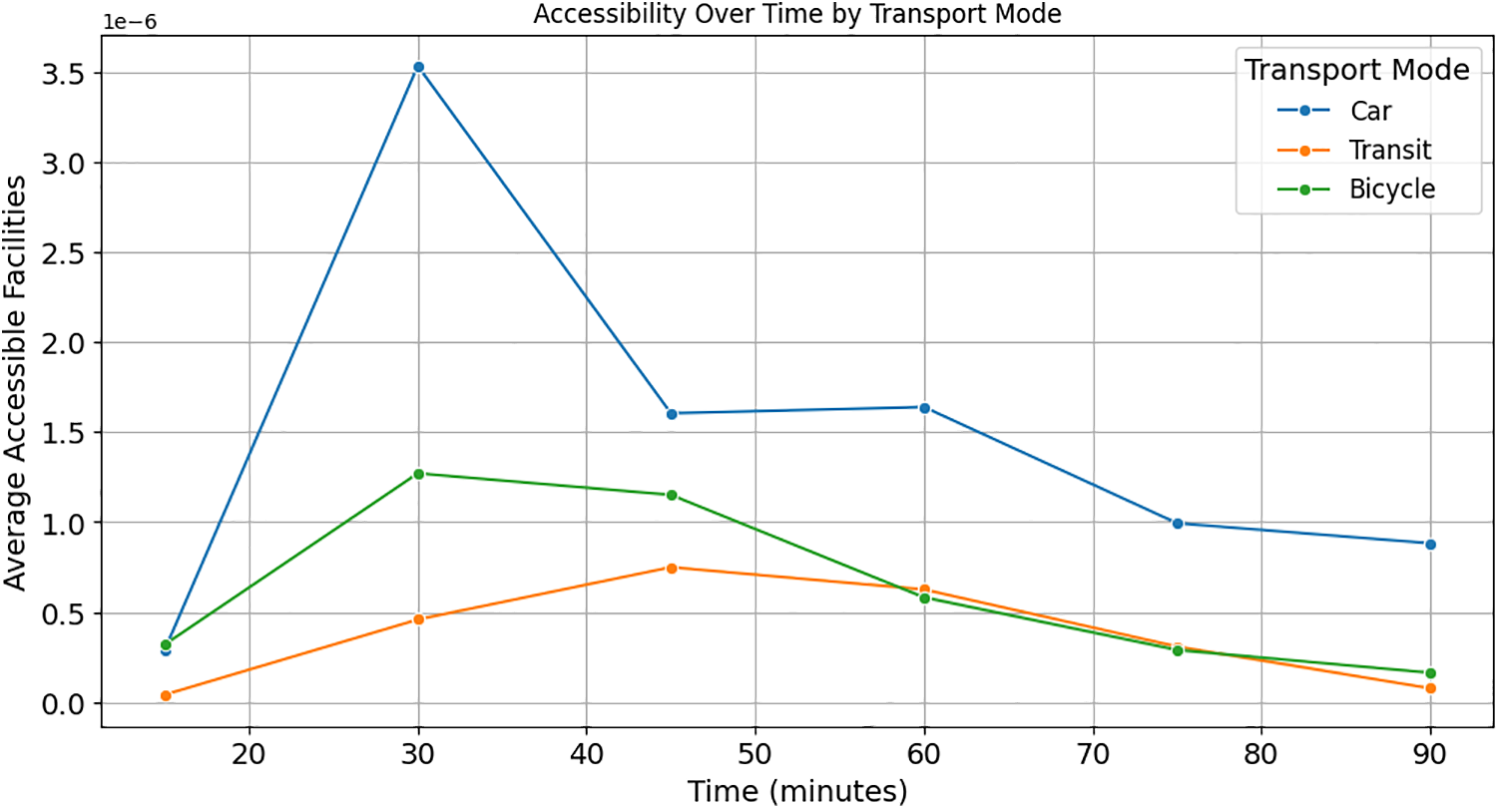
Figure 4: Average facility accessibility over time by transport mode. The graph shows the number of accessible facilities averaged across the study area as a function of travel time thresholds (from 15 to 90 min). Car travel consistently provides the highest accessibility, peaking around 30 min before declining. Bicycle accessibility follows a similar but lower trend, with transit accessibility showing a gradual increase and plateau. These patterns reflect differences in network coverage, speed, and modal suitability for reaching diverse services within limited time windows
3.3.1 Car Accessibility: High but Declining over Time
Car users experience the highest accessibility, peaking sharply at around 30 min before gradually declining. This indicates that within short to moderate travel durations, cars provide access to a large number of facilities. However, beyond this peak, accessibility decreases, likely due to the diminishing density of facilities further from central locations.
3.3.2 Bicycle Accessibility: Moderate with a Clear Decline
Cycling accessibility increases steadily, reaching its highest point between 30 and 40 min. After this, it starts to decline, suggesting that bicycles are effective for accessing facilities within moderate distances but become less efficient for longer trips. The decline may be attributed to physical travel constraints and limited infrastructure support for longer cycling trips.
3.3.3 Transit Accessibility: Gradual Increase, Then Decline
Public transit has the lowest accessibility across all time intervals. Unlike cars and bicycles, the accessibility of transit increases gradually, peaking around 50 min before it starts to decline. This slower rise in accessibility suggests that transit takes longer to connect people to facilities, likely due to factors like waiting times, transfers, and fixed route structures.
When considering mobility planning, several key points emerge. For short trips under 30 min, cars provide the best accessibility, with bicycles serving as a viable alternative. For medium-length trips between 30 to 60 min, cars still offer the best accessibility, although bicycles start to provide reasonable access, with transit accessibility beginning to improve. For longer trips over 60 min, cars continue to offer the highest accessibility, but accessibility declines for all modes. Bicycle accessibility tends to be higher within short to medium distances due to the flexibility of routing, lack of wait times, and the increasing availability of bike lanes and electric-assist options (e.g., Caen’s Vélolib system). In contrast, public transport accessibility is influenced by schedule constraints, waiting times, transfer requirements, and limited coverage in some suburban or peripheral areas. As such, even though public transport serves longer distances, these factors can reduce its effective accessibility compared to the direct and uninterrupted travel possible by bike, especially within the city’s core and mid-range zones.
To enhance accessibility over time for those not using cars, urban planners should focus on improving first- and last-mile connectivity for transit riders and invest in better cycling infrastructure. Expanding bike-sharing programs, integrating multimodal transport options, and reducing transit transfer times can help bridge accessibility gaps and promote more equitable mobility.
Understanding accessibility at a spatial level helps identify areas with strong connectivity and those with limited access to key services. The accessibility map (Fig. 5) categorizes locations based on their accessibility scores, ranging from “High” to “Very Low”, illustrating disparities across the region.
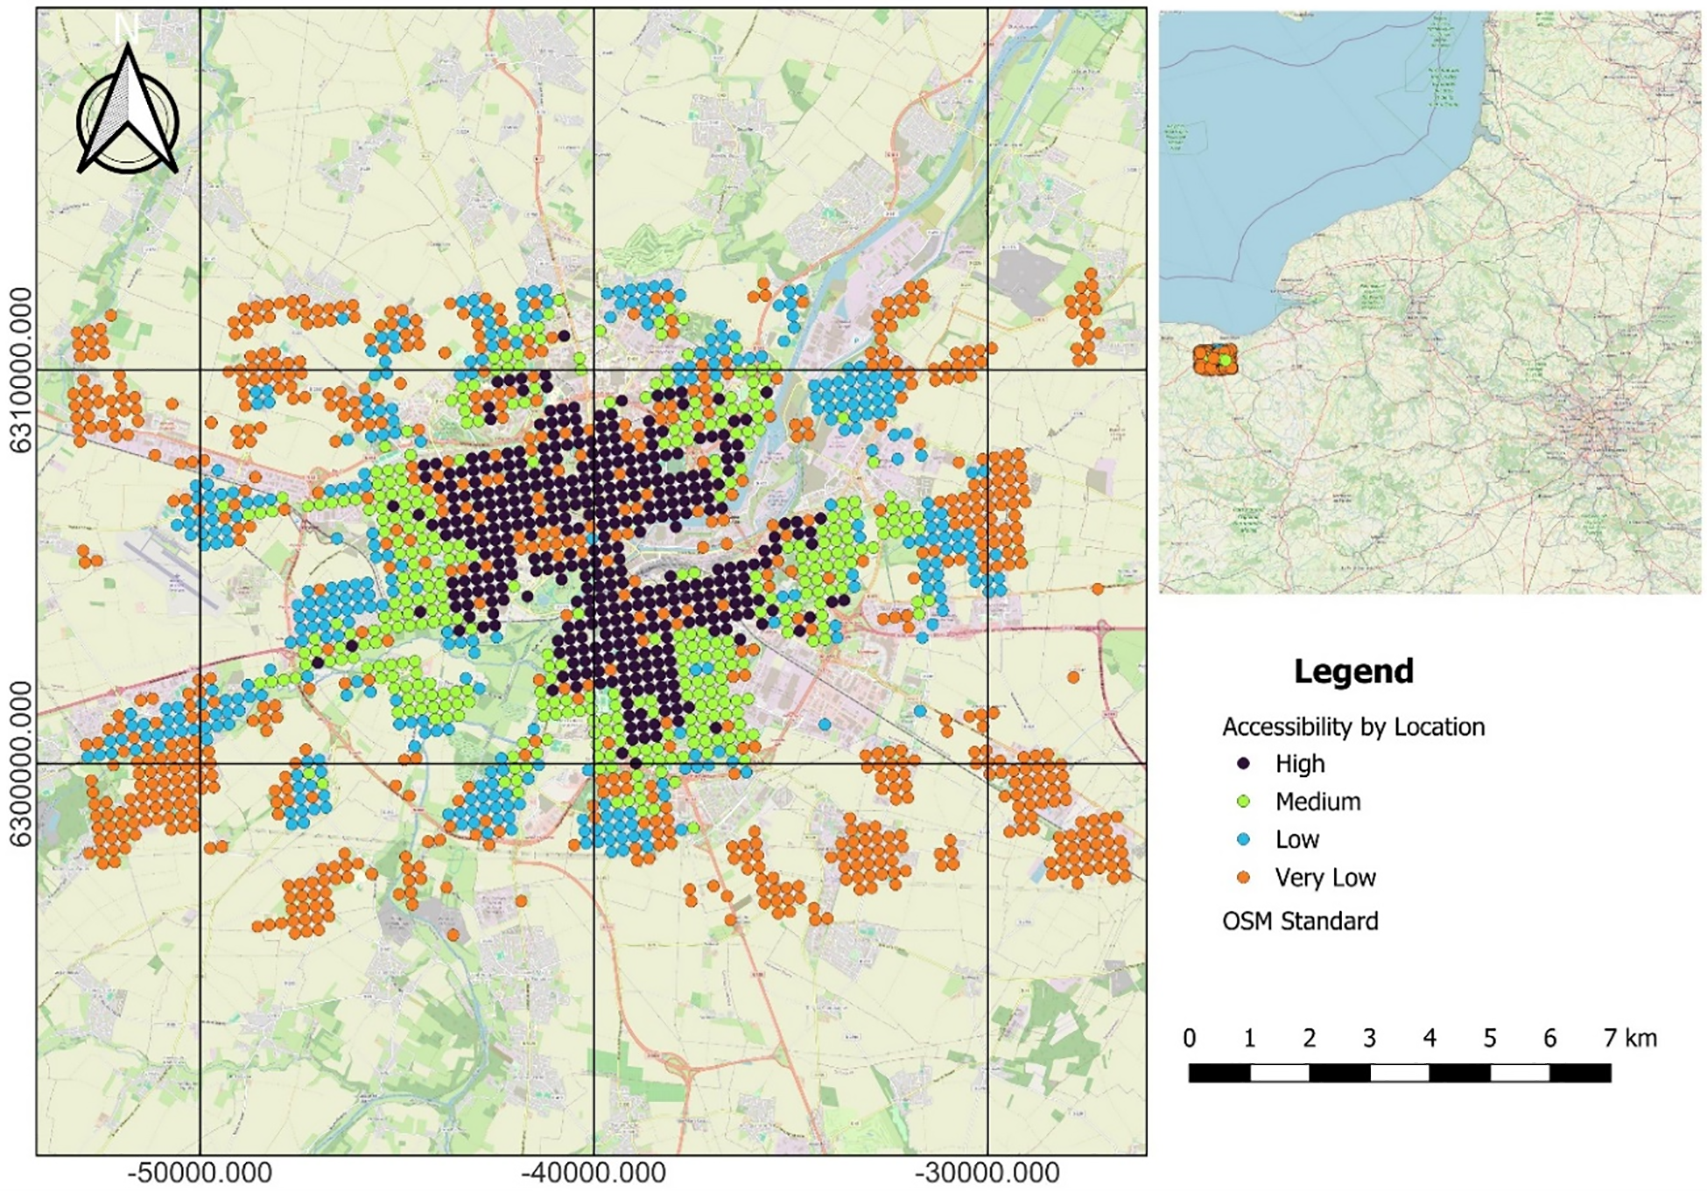
Figure 5: A map displaying accessibility levels by location, categorized as High, Medium, Low, and Very Low
3.4.1 Urban Core: High Accessibility
The highest accessibility is concentrated in the central urban area, where dense infrastructure and a high concentration of services allow for convenient access. This suggests that city centers benefit from well-developed road networks, public transit availability, and proximity to essential services such as retail, healthcare, and education.
3.4.2 Suburban Areas: Mixed Accessibility
Moving outward from the core, accessibility transitions from “Medium” to “Low”. This indicates that while some suburban areas still maintain reasonable connectivity, others experience a drop in accessibility, likely due to lower service density and increased reliance on private vehicles. These areas may have fewer direct transit routes and longer travel times to key destinations.
3.4.3 Peripheral and Rural Areas: Very Low Accessibility
The outermost regions, marked in orange, exhibit the lowest accessibility. These areas are often characterized by sparse development, limited public transportation, and a reliance on longer-distance travel for essential services. Poor connectivity in these zones can create mobility challenges for residents without access to private vehicles.
4 Policy Implications and Future Research Directions
The findings of this study have important implications for urban planning, transport policy, and accessibility improvements in Caen. One of the important results of this methodology is the production of a map on a fine scale of 200 m squares, which highlights the disparities in accessibility between neighbourhoods. This section outlines key policy recommendations based on the accessibility analysis and identifies potential directions for future research.
The accessibility analysis presented here provides a foundation for transport and land-use policies that align with broader EU objectives, such as those outlined in the European Green Deal and SUMPs. These frameworks call for integrated mobility solutions that reduce environmental impact while enhancing social inclusion. Based on our results, the following policy directions aim to improve equity, support sustainable modes, and foster spatial cohesion.
4.1.1 Enhancing Transport Supply
The analysis reveals that public transport accessibility consistently lags behind car accessibility, particularly in peripheral neighborhoods. This disparity highlights a central policy trade-off: improving transit equity and sustainability vs. the financial and operational cost of expanding service coverage. Enhancing public transport in the low-accessibility zones identified in Fig. 2c—through the addition of new lines, increased service frequency, and better network integration—could significantly reduce car dependency and associated emissions. However, these improvements require careful cost-benefit evaluation, especially in lower-density areas.
Investments in last-mile connectivity can improve multimodal access efficiency. This includes promoting micromobility options like e-scooters and improving pedestrian infrastructure near stops, which are relatively low-cost yet high-impact measures. Similarly, while cycling performs better than public transit in some areas, its accessibility is uneven, particularly in hilly or suburban zones. Addressing these physical barriers—such as elevation—through strategic infrastructure planning and e-bike integration can enhance cycling uptake. The existing Vélolib system in Caen, with its 400 electric bikes and 60 stations, offers a strong foundation for expansion, especially in underserved sectors.
4.1.2 Improving the Spatial Repartition of Essential Facilities
Accessibility to essential services—particularly healthcare and education—remains limited for non-car users, raising important questions of spatial equity vs. planning efficiency. Expanding transit connections to major hospitals, clinics, and educational institutions is essential for reducing dependence on private vehicles, especially for vulnerable populations. At the same time, a complementary strategy involves encouraging the decentralization of key services, such as through the development of smaller facilities in suburban locations. While this may challenge resource allocation efficiency, it enhances social inclusion and reduces travel burdens.
The concentration of amenities in car-centric commercial zones further underscores the trade-off between land-use specialization and accessibility. Promoting mixed-use development and incentivizing small businesses in residential areas can shorten travel distances, enhance walkability, and reduce emissions. Policies that support pedestrian-friendly urban design—such as the continued development of walkable neighborhoods with embedded daily services—can multiply these benefits. Caen’s pedestrianized city center already sets a strong precedent, and could serve as a model for further neighborhood-scale interventions.
4.2 Future Research Directions
This study offers a thorough examination of accessibility in Caen, but further investigation is required to refine and expand upon its findings. Future research could focus on tracking accessibility changes over time, providing insights into the effects of new transport policies, infrastructure developments, and demographic shifts. Comparing accessibility before and after major transit projects, and assessing the influence of population growth and urban expansion on mobility patterns, are potential areas for future studies.
Although this study primarily addresses spatial accessibility, future research could delve into its intersections with social and economic factors. This might include examining income-based disparities to understand whether lower-income populations face greater accessibility challenges, exploring gender differences in travel patterns, and assessing transport planning for individuals with mobility impairments.
As new mobility technologies like electric scooters, ride-sharing, and autonomous shuttles emerge, future studies could investigate their potential to transform accessibility. This could include examining the role of Mobility-as-a-Service (MaaS) in improving access, assessing the impact of shared and autonomous vehicles on multimodal transport efficiency, and exploring strategies for integrating on-demand transport with traditional public transit.
Moreover, future research should incorporate the effects of dynamic social environments such as traffic congestion variability and changing population distributions, which can significantly influence accessibility patterns throughout the day or in response to socio-economic changes. In the current study, congestion is not explicitly modeled; car-based accessibility is estimated using isochrones based on average or free-flow travel speeds, which may overestimate accessibility during peak hours—especially in congested areas like central Caen. Integrating dynamic, time-dependent travel data from GPS, mobile applications, or traffic sensors would allow future models to reflect real-world conditions more accurately and support more responsive transport planning. Similarly, assessing the impacts of extreme disaster events—such as floods, typhoons, and other natural hazards—on transport infrastructure and service availability is essential to enhance urban resilience and emergency preparedness.
Finally, as cities strive to meet sustainability goals, research on the environmental implications of accessibility is crucial. Key topics may include investigating the relationship between accessibility and carbon emissions, the potential of active transportation (walking and cycling) to reduce urban air pollution, and policy strategies that balance accessibility improvements with environmental sustainability.
The study of accessibility on a fine spatial scale, taking into account the diversity of modes, destinations, and journey times—rather than relying on aggregate indicators like Hansen—reveals the strengths and weaknesses of Caen’s territorial organisation. As cities adopt traffic restrictions such as Low Emission Zones (LEZs), this detailed approach enables the identification of areas most affected and supports the design of corrective measures. Moreover, the methodological consistency allows for dimension reduction techniques to produce synthetic indicators and summary visualisations that inform strategic decision-making.
The results underscore the spatial disparities in accessibility and the need for targeted, mode-sensitive interventions. Enhancing public transport, expanding cycling infrastructure, decentralising key services, and promoting mixed-use urban development are not only crucial for equity but also align closely with the European Green Deal and Sustainable Urban Mobility Plans (SUMPs). These policies emphasize reducing greenhouse gas emissions, promoting active and shared mobility, and ensuring inclusive access to urban opportunities. Future research should continue to monitor the dynamic evolution of transport systems and socio-spatial inequalities, integrating resilience planning for both long-term sustainability and immediate disruptions such as natural disasters.
Acknowledgement: We appreciate the efforts of Open Data Providers such as: INSEE, OpenStreetMap, and transport.data.gouv.fr for making their datasets publicly available, which greatly facilitated our analysis.
Funding Statement: This research, part of the MOB-SCI Dat Factory project, is funded by the French National Research Agency (Agence Nationale de la Recherche, ANR).
Author Contributions: The authors confirm contribution to the paper as follows: Olivier Bonin: Conceptualization, Methodology, Supervision, Writing—Review & Editing. Kofi Bonsu: Formal Analysis, Data Curation, Software, Visualization, Writing—Original Draft. All Authors: Validation, Writing—Review & Editing, Final Approval. All authors reviewed the results and approved the final version of the manuscript.
Availability of Data and Materials: All datasets used in this study are openly available from public sources, as referenced in the manuscript. Population and facility data were obtained from the INSEE, while transport network data were sourced from OpenStreetMap and transport.data.gouv.fr. The Python scripts for isochrone generation, accessibility analysis, and visualization are publicly archived on GitHub at: https://github.com/Kbonsu100/Accessibility_indicators (accessed on 16 July 2025).
Ethics Approval: Not applicable.
Conflicts of Interest: The authors declare no conflicts of interest to report regarding the present study.
References
1. Wan T, Lu W, Sun P. Equity impacts of the built environment in urban rail transit station areas from a transit-oriented development perspective: a systematic review. Environ Res Commun. 2023;5(9):092001. doi:10.1088/2515-7620/acf8b2. [Google Scholar] [CrossRef]
2. Chaiechi T, Pryce J, Eijdenberg EL, Azzali S. Rethinking the contextual factors influencing urban mobility: a new holistic conceptual framework. Urban Plan. 2022;7(4):140–52. doi:10.17645/up.v7i4.5784. [Google Scholar] [CrossRef]
3. Crane M, Lloyd S, Haines A, Ding D, Hutchinson E, Belesova K, et al. Transforming cities for sustainability: a health perspective. Environ Int. 2021;147(1):106366. doi:10.1016/j.envint.2020.106366. [Google Scholar] [PubMed] [CrossRef]
4. Hansen WG. How accessibility shapes land use. J Am Inst Plan. 1959;25(2):73–6. doi:10.1080/01944365908978307. [Google Scholar] [CrossRef]
5. Dalvi MQ, Martin KM. The measurement of accessibility: some preliminary results. Transportation. 1976;5(1):17–42. doi:10.1007/BF00165245. [Google Scholar] [CrossRef]
6. Siddiq F, Taylor BD. Tools of the trade? Assessing the progress of accessibility measures for planning practice. J Am Plan Assoc. 2021;87(4):497–511. doi:10.1080/01944363.2021.1899036. [Google Scholar] [CrossRef]
7. Ingram DR. The concept of accessibility: a search for an operational form. Reg Stud. 1971;5(2):101–7. doi:10.1080/09595237100185131. [Google Scholar] [CrossRef]
8. Geurs KT, Wee BV. Accessibility evaluation of land-use and transport strategies: review and research directions. J Transp Geogr. 2004;12(2):127–40. doi:10.1016/j.jtrangeo.2003.10.005. [Google Scholar] [CrossRef]
9. Kwan MP. Space-time and integral measures of individual accessibility: a comparative analysis using a point-based framework. Geogr Anal. 1998;30(3):191–216. doi:10.1111/j.1538-4632.1998.tb00396.x. [Google Scholar] [CrossRef]
10. Gyamerah S, Tour Soori G, Redeemer Korda D, Kwame Tawiah J, Ayintareba Akolgo E, Oteng Dapaah E. Comparative analysis of feature extraction of high dimensional data reduction using machine learning techniques. Am J Electr Comput Eng. 2023;7(2):27–39. doi:10.11648/j.ajece.20230702.12. [Google Scholar] [CrossRef]
11. Allee KD, Do C, Raymundo FG. Principal component analysis and factor analysis in accounting research. J Financ Report. 2022;7(2):1–39. doi:10.2308/jfr-2021-005. [Google Scholar] [CrossRef]
12. Barbierato E, Gatti A. Toward green AI: a methodological survey of the scientific literature. IEEE Access. 2024;12(1):23989–4013. doi:10.1109/access.2024.3360705. [Google Scholar] [CrossRef]
13. Fei Y, Liu Y, Jia C, Li Z, Wei X, Chen M. A survey of geometric optimization for deep learning: from euclidean space to Riemannian manifold. ACM Comput Surv. 2025;57(5):1–37. doi:10.1145/3708498. [Google Scholar] [CrossRef]
14. Charte D, Charte F, Herrera F. Reducing data complexity using autoencoders with class-informed loss functions. IEEE Trans Pattern Anal Mach Intell. 2022;44(12):9549–60. doi:10.1109/TPAMI.2021.3127698. [Google Scholar] [PubMed] [CrossRef]
15. Pereira MF, Vale DS, Santana P. Is walkability equitably distributed across socio-economic groups?—A spatial analysis for Lisbon metropolitan area. J Transp Geogr. 2023;106:103491. doi:10.1016/j.jtrangeo.2022.103491. [Google Scholar] [CrossRef]
16. Bourdin S, Rivoallan Y. Recreational activities, economic and territorial development: caen (France) in the reconquest of its river? In: Machemehl C, Sirost O, Ducrotoy JP, editors. Reclaiming and rewilding river cities for outdoor recreation. Berlin/Heidelberg, Germany: Springer; 2020. p. 87–98. doi:10.1007/978-3-030-48709-6_11. [Google Scholar] [CrossRef]
17. Scheurer J, Verschuer M, Newman P, Desha C. Delivering tram-based boulevards: learning from opportunities and challenges in three European city case studies. J Transp Technol. 2023;13(2):262–81. doi:10.4236/jtts.2023.132013. [Google Scholar] [CrossRef]
18. Foletta N, Field S. Europe’s vibrant new low car(bon) communities. New York, NY, USA: Institute for Transportation and Development Policy (ITDP); 2011. 10 p. [Google Scholar]
Cite This Article
 Copyright © 2025 The Author(s). Published by Tech Science Press.
This work is licensed under a Creative Commons Attribution 4.0 International License , which permits unrestricted use, distribution, and reproduction in any medium, provided the original work is properly cited.
 Downloads
 Citation Tools