
 Submit a Paper
 Propose a Special lssue
 Open Access
ARTICLE

Evaluating Geographical Variations of Road Traffic Accidents in Matara, Sri Lanka: A Geospatial Perspective to Policy Decisions
1 Department of Geography, Faculty of Humanities and Social Sciences, University of Ruhuna, Wellamadama, Matara, 81000, Sri Lanka
2 Department of Geography, Shivaji College, University of Delhi, New Delhi, 110027, India
* Corresponding Author: Prabuddh Kumar Mishra. Email:
(This article belongs to the Special Issue: Resource and Environmental Information Modeling)
Revue Internationale de Géomatique 2025, 34, 707-729. https://doi.org/10.32604/rig.2025.067395
Received 02 May 2025; Accepted 18 August 2025; Issue published 12 September 2025
 View Full Text
 Download PDF
Abstract
Road Traffic Accidents (RTAs) pose significant threats to public safety and urban infrastructure. While numerous studies have addressed this issue in other countries, there remains a notable gap in localized RTA research in Sri Lanka. In this context, the present study investigates the spatial and temporal patterns of RTAs in the Matara urban area in 2023, with the goal of supporting evidence-based policy interventions. A suite of GIS-based spatial analysis techniques including hotspot analysis, kernel density estimation, GiZscore mapping, and spatial autocorrelation (Moran’s I = 0.36, p < 0.01) was applied to examine the distribution and contributing factors of RTAs. The results identified several high-risk zones, particularly along the Colombo–Wellawaya main road, as well as near the southern expressway exit, and around Rahula Junction, which collectively accounted for over 40% of all recorded accidents. These areas are characterized by high traffic volumes, complex road geometries, and significant pedestrian activity. Driver-related behaviors were dominant causes, with negligence accounting for 57% of accidents, aggressive driving for 14%, and alcohol influence for 8%. Temporally, the highest incidence of RTAs (38%) was recorded during the afternoon peak hours (11:00 a.m. to 4:59 p.m.). Based on these findings, targeted policy measures such as enhanced traffic enforcement, infrastructure redesign, and public awareness campaigns are recommended to reduce accident frequency and improve road safety in high-risk areas. This study provides a localized, data-driven framework that can guide urban traffic planning and safety interventions in Matara and similar urban settings.Keywords
A collision involving a vehicle on the road with another automobile, an individual, a creature, or an architectural hurdle is classified as a Road Traffic Accident (RTA). Such incidents can result in fatalities, injuries, or property damage [1]. Recent studies show that RTA claims over 1.35 million lives every year and injure nearly quadruple that number. Notably, males make up nearly three-fourths of those affected [2]. Additionally, up to 50 million people sustain injuries every year [3], with these figures continuing to rise. Notably, juveniles and youths between 5–29 are the most frequently killed in these accidents [4]. Alarmingly, 93% of these demises take place in low- and middle-income countries [2]. Furthermore, pedestrians, cyclists, and motorcyclists represent more than half of all road traffic fatalities. Between 20 and 50 million individuals sustain non-fatal injuries, many of whom may face lifelong disabilities as a result [3]. RTA fatalities have now risen to become the seventh foremost reason of death globally, climbing three positions from tenth place in 2000 [4]. Projections indicate that by 2030, road traffic accidents will become the fifth leading cause of death worldwide [5]. However, RTAs are not among the top ten causes of death in developed countries, highlighting the particularly dire situation in developing countries. Developing countries are responsible for 92% of global traffic fatalities, even though they possess only 60% of the world's vehicles [6]. Moreover, the financial burden of road traffic accidents on these countries ranges from 1% to 3% of their annual GDP [7].
While there are numerous causes for RTAs, slip-ups of human stand out as the primary reason [8], encompassing driving mistakes, excessive speed, and disregard of road regulations [9]. Additional contributing causes include environmental conditions, road quality, mechanical issues, the volume of vehicles, extension of transportation networks, national progress strategies, the coexistence of fast, intense automobiles with creeping, light automobiles and walkway commuters, suboptimal ensuring compliance of road regulations, and the lack of rescue operations [10–12]. Key factors influencing traffic fatalities include gender, age of drivers, vehicle condition, overloading, inadequate safety measures, lack of clear sight, insufficient road lamps, light automobile type, driver experience, morning rush hour, and adverse weather conditions [13]. Various studies [14–16] have demonstrated a significant relationship among meteorological variables and RTA. These relationships can differ depending on the class of road, such as remote roads, city roads, or highways [17]. RTA data is categorized according to severity. The most critical accidents lead to fatalities and serious injuries, while minor incidents typically result in less severe injuries or just (merely) vehicle/property damage [18].
Geographic Information Systems (GIS) facilitates improved data processing, analysis and visualization. Today, to investigate the spatial and temporal characteristics of geographical phenomenon, GIS based spatial modeling techniques and tools are extensively used. GIS tools and techniques provide a comprehensive framework for integrating real world RTA data in order to identify, analyze, and mitigate RTA for improved public safety. This includes mapping and visualization, spatial analysis, prediction models, infrastructure analysis, decision support integrating real time data, and public awareness.
Sri Lanka, categorized as a low-medium-wealth nation in South Asia, faces noteworthy challenges with RTA and their repercussions. The country has seen a troubling rise in traffic-related accidents, resulting in numerous fatalities. This increase can be attributed to a surge in the number of vehicles on the roads coupled with inadequate road infrastructure [19]. According to Somasundaraswaran [20], the total number of accidents in Sri Lanka is rising sharply due to the rapid increase in vehicle ownership. Research on roadside traffic incidents indicates a significant increase in road traffic crashes from 1938 to 2013 [21]. As a developing country, Sri Lanka suffers considerable economic repercussions due to these incidents. Alarmingly, a large segment of the population of youths is particularly vulnerable to such accidents [22]. Additionally, the rate of property damage resulting from these traffic incidents is alarmingly high, indicating a severe nationwide issue. The Colombo Municipal Council (CMC) area reports the highest incidence of traffic accidents in the country [21]. In Sri Lanka, road traffic crashes result in approximately 2000 fatalities and 20,000 injuries annually [20]. According to police statistics from 2011, the most frequently involved vehicles are motorcycles, cars, and three-wheelers. Notably, 45% of road traffic deaths are attributed to vehicle drivers or riders, while nearly 33% are pedestrians [22]. Alarmingly, about 80% of the casualties fall within the economically prolific age segment. The rate of RTA has escalated from 61.2 to 195.9 per 100,000 people between 1938 and 2011 [23]. The systematic review by Selvaratnam et al. [24] examines Sri Lankan traffic crash research up to 2025, highlighting key gaps in spatial coverage, methodological diversity, and data sources. The study emphasizes the need for enhanced geospatial research to support informed policy-making. According to the findings of Amarasinghe and Dharmaratne [25], young males in their most productive years were disproportionately affected. While urban areas recorded a higher incidence of crashes, rural areas posed a greater risk of fatal accidents, especially during nighttime.
In Sri Lanka, there exists a significant research gap concerning RTA, particularly in the context of GIS based spatial analysis. The scarcity of comprehensive studies and the finite availability of information have hindered authorities from effectively launching targeted initiatives aimed at reducing road accidents. Consequently, there is a pressing need for more rigorous GIS based spatial modeling that can provide a nuanced understanding of spatial temporal patterns of RTA and contribute to evidence-based policy making in Sri Lanka. Addressing this gap is essential for developing effective strategies to enhance traffic safety and reduce the burden of RTA related fatalities and injuries within the country. In this context, the objectives of this study were: (i) evaluating spatial and temporal variations of RTA within the Matara urban area; (ii) identifying characteristics and behaviour of RTA; (iii) examining factors that influence the RTA in the Matara urban area and providing actionable insights for local authorities and policymakers. The significance of this research lies in its potential to enhance public safety and inform urban planning in the City of Matara. By understanding the patterns and trends of RTA, stakeholders can prioritize infrastructure improvements, implement effective traffic management strategies, and allocate resources more efficiently. Ultimately, the findings may contribute to lowering the occurrence and intensity of RTA, thereby protecting lives, and minimizing economic losses associated with these accidents in the area.
2 Previous Literature on GIS-Based RTA Analysis
Since 1990s, numerous studies have focused on GIS based RTA analysis, modeling, and their applications in traffic safety in both spatial and temporal dimensions using real world data. Areas of analysis applicable to this field include; hotspots, intersections, segment, cluster, density, pattern, proximity, spatial query analysis, and auto correlation analysis etc. The study conducted by Bhele et al. [26] uses Kernel Density Estimation (KDE) and temporal trend analysis with QGIS/ArcGIS to identify road accident hotspots in Nepal from 2019 to 2023, highlighting patterns based on severity and location. Alsahfi [27] analyzes five years (2019–2023) of accident data from Los Angeles, Sacramento, San Diego, and San Jose using space–time cube analysis, DBSCAN clustering, KDE, and Getis-Ord Gi* methods to map trends in accident severity and density. Hazaymeh et al. [28] investigate road accidents in the Irbid Governorate (Jordan) from 2015 to 2019 using Global Moran’s I and Getis-Ord Gi* hotspot analysis within a GIS framework, revealing spatial clustering and the temporal evolution of accident hotspots. The study by Tola et al. [29] applied GIS-based spatial autocorrelation and Getis-Ord Gi* analysis to four years (2014–2017) of crash data in Ethiopia, aiming to identify and rank road traffic crash hotspots based on severity. The findings revealed high-risk areas near the entry and exit points of Addis Ababa, underscoring the need for targeted interventions to reduce crashes and their socio-economic impacts. The study by Bil et al. [30] analyzed traffic crashes along 3933 km of rural primary roads in the Czech Republic from 2010 to 2018 using a spatiotemporal clustering method with a three-year moving time window and one-day resolution. It identified three types of hotspots emergent, stable, and disappearing. The study by Zhang et al. [31] investigates stratification heterogeneity and the influencing factors of traffic accidents in Shenzhen using geographical detection methods. It reveals that the causes of accidents and the primary responsible parties significantly affect fatalities and injuries, with additional impacts from location, time, and specific behaviors. The study by Al-Omari [32] used Geographic Information System (GIS) and fuzzy logic to predict traffic accident hotspots in Irbid City, Jordan, based on data from 2013 to 2015, incorporating accident types, timing, fatalities, and injuries through spatial-temporal analysis. Affum and Taylor [33] explained the creation of a safeguard assessment program to analyze accident patterns over time. Hirasawa and Asano [34] developed an RTA analysis system utilizing GIS technology to manage accident data, road structures, and related facilities, enabling the assessment of RTA intensities, levels, and meteorological influences on RTA. Liang et al. [35] created an RTA evaluation framework to allow users to identify accident-prone places, rank accident places, and visualize road accident data. In addition, it allows users to input and retrieve accident databases. Several studies have been conducted to identify critical locations by establishing spatial patterns in vehicle or pedestrian accidents. Thomas [36] investigated red areas using spatial auto correlation and kernel estimation on roads. Kim and Yamashita [37] and Levine et al. [38] analyzed spatial patterns of pedestrian crashes in Honolulu, Hawaii, employing the k-means clustering method. Bello [39] conducted a tiered accident analysis focusing on identifying spatial patterns of RTA involving school children compared to other road incidents in the city, utilizing kernel density methods. Sabel et al. [40] derived a technique using kernel estimation cluster analysis to automatically detect RTA red spots in Christchurch, New Zealand.
Hotspot identification remains the most extensively studied area in traffic crash pattern analysis, using methods such as KDE [41]. These methods have been shown to surpass non-spatial hotspot detection techniques [42]. Moreover, current research on RTA intensity predominantly focuses on identifying contributing causes related to specific road users [43], the number of automobiles involved in accidents [44], accident types [45], and the prediction of crash severity [46]. Levine et al. [47] found a positive correlation between commercial and business zones and an increase in fatal and traumatic (Injury causing) crashes. Conversely, Kim and Yamashita [48] highlighted that residential neighborhoods posed greater risks, particularly during peak hours. Scheiner and Holz-Rau [49] examined the relationship between road crash distributions and residents’ locations through case studies in Germany. Few studies conducted in Bangladesh focused on GIS based hotspots analysis to detect hotspots and discover the leading causes [50,51]. Some researchers have used spatial statistics methods in recent works to understand the spatial and temporal characteristics of RTA [52,53]. Soltani and Askari [54] and Lee and Khattak [55] have used spatial auto correlational techniques to analysis crash patterns, their severity and their geographic regions. Getis and Ord [56], and Sacchi et al. [57] have used Geo statistical methods to evaluate spatial units of RTA and examine the geographical arrangement of crash attributes.
In Sri Lanka few previous works on GIS based RTA can be identified in Colombo and other major cities such as Kandy and Galle. Munasighe [58] has analyzed RTA in Colombo MC using hotspot, kernel density estimation and nearest neighbor hierarchy techniques. Except in the Colombo area Nalaka et al. [59] have evaluated accident hotspots along southern expressway using nearest neighbor, KDE, and ordinary kriging. Also, De silva et al. [60] conducted research to analysis traffic crashes and built environmental characteristics in Galle police area using GIS based hotspot mapping. Gaspe et al. [61] have conducted another study, as a pilot survey, in Kandy MC using fatal accidents reported during 2000–2008 to identify the spatial patterns of RTA using ArcGIS tools. This review played a contributing role in our research by shaping, justifying, and informing its relevance, rigor, and contribution to the field. Further, it allowed us to familiarize ourselves with existing knowledge, theories, methods, and arguments while identifying existing gaps where future research work is essential.
Matara, a vibrant city located on the southern coast of Sri Lanka, serves as a significant hub for commerce and tourism. According to recent population reports, the city had a resident population of 88,558 in 2022. Matara has become a critical starting point (launchpad) for a nationally and regionally important road network that spans the island, including the southern expressway, the Colombo-Beliatta railway line, and the Colombo-Wellawaya main road. The city is also home to well-established education infrastructure, featuring one of Sri Lanka’s national university, numerous reputable schools. It also hosts essential healthcare facilities, including the Matara General Hospital. These factors, combined with a thriving fishing industry and various tourist attractions, have drawn a substantial population from surrounding areas, further increasing urban density and commuting. The city's strategic location along the southern expressway significantly enhances its connectivity to other major urban centers, driving economic growth and elevating road traffic. The rapid urbanization and surge in transportation activities have raised critical concerns regarding road safety, particularly in relation to road traffic accidents. The Matara Divisional Secretariat Division (DSD), encompassing the city and its surrounding areas, has witnessed notable fluctuations in road traffic incidents over recent years (Fig. 1). Understanding the spatial-temporal variations in accidents is essential for formulating effective interventions and policies aimed at improving road safety.
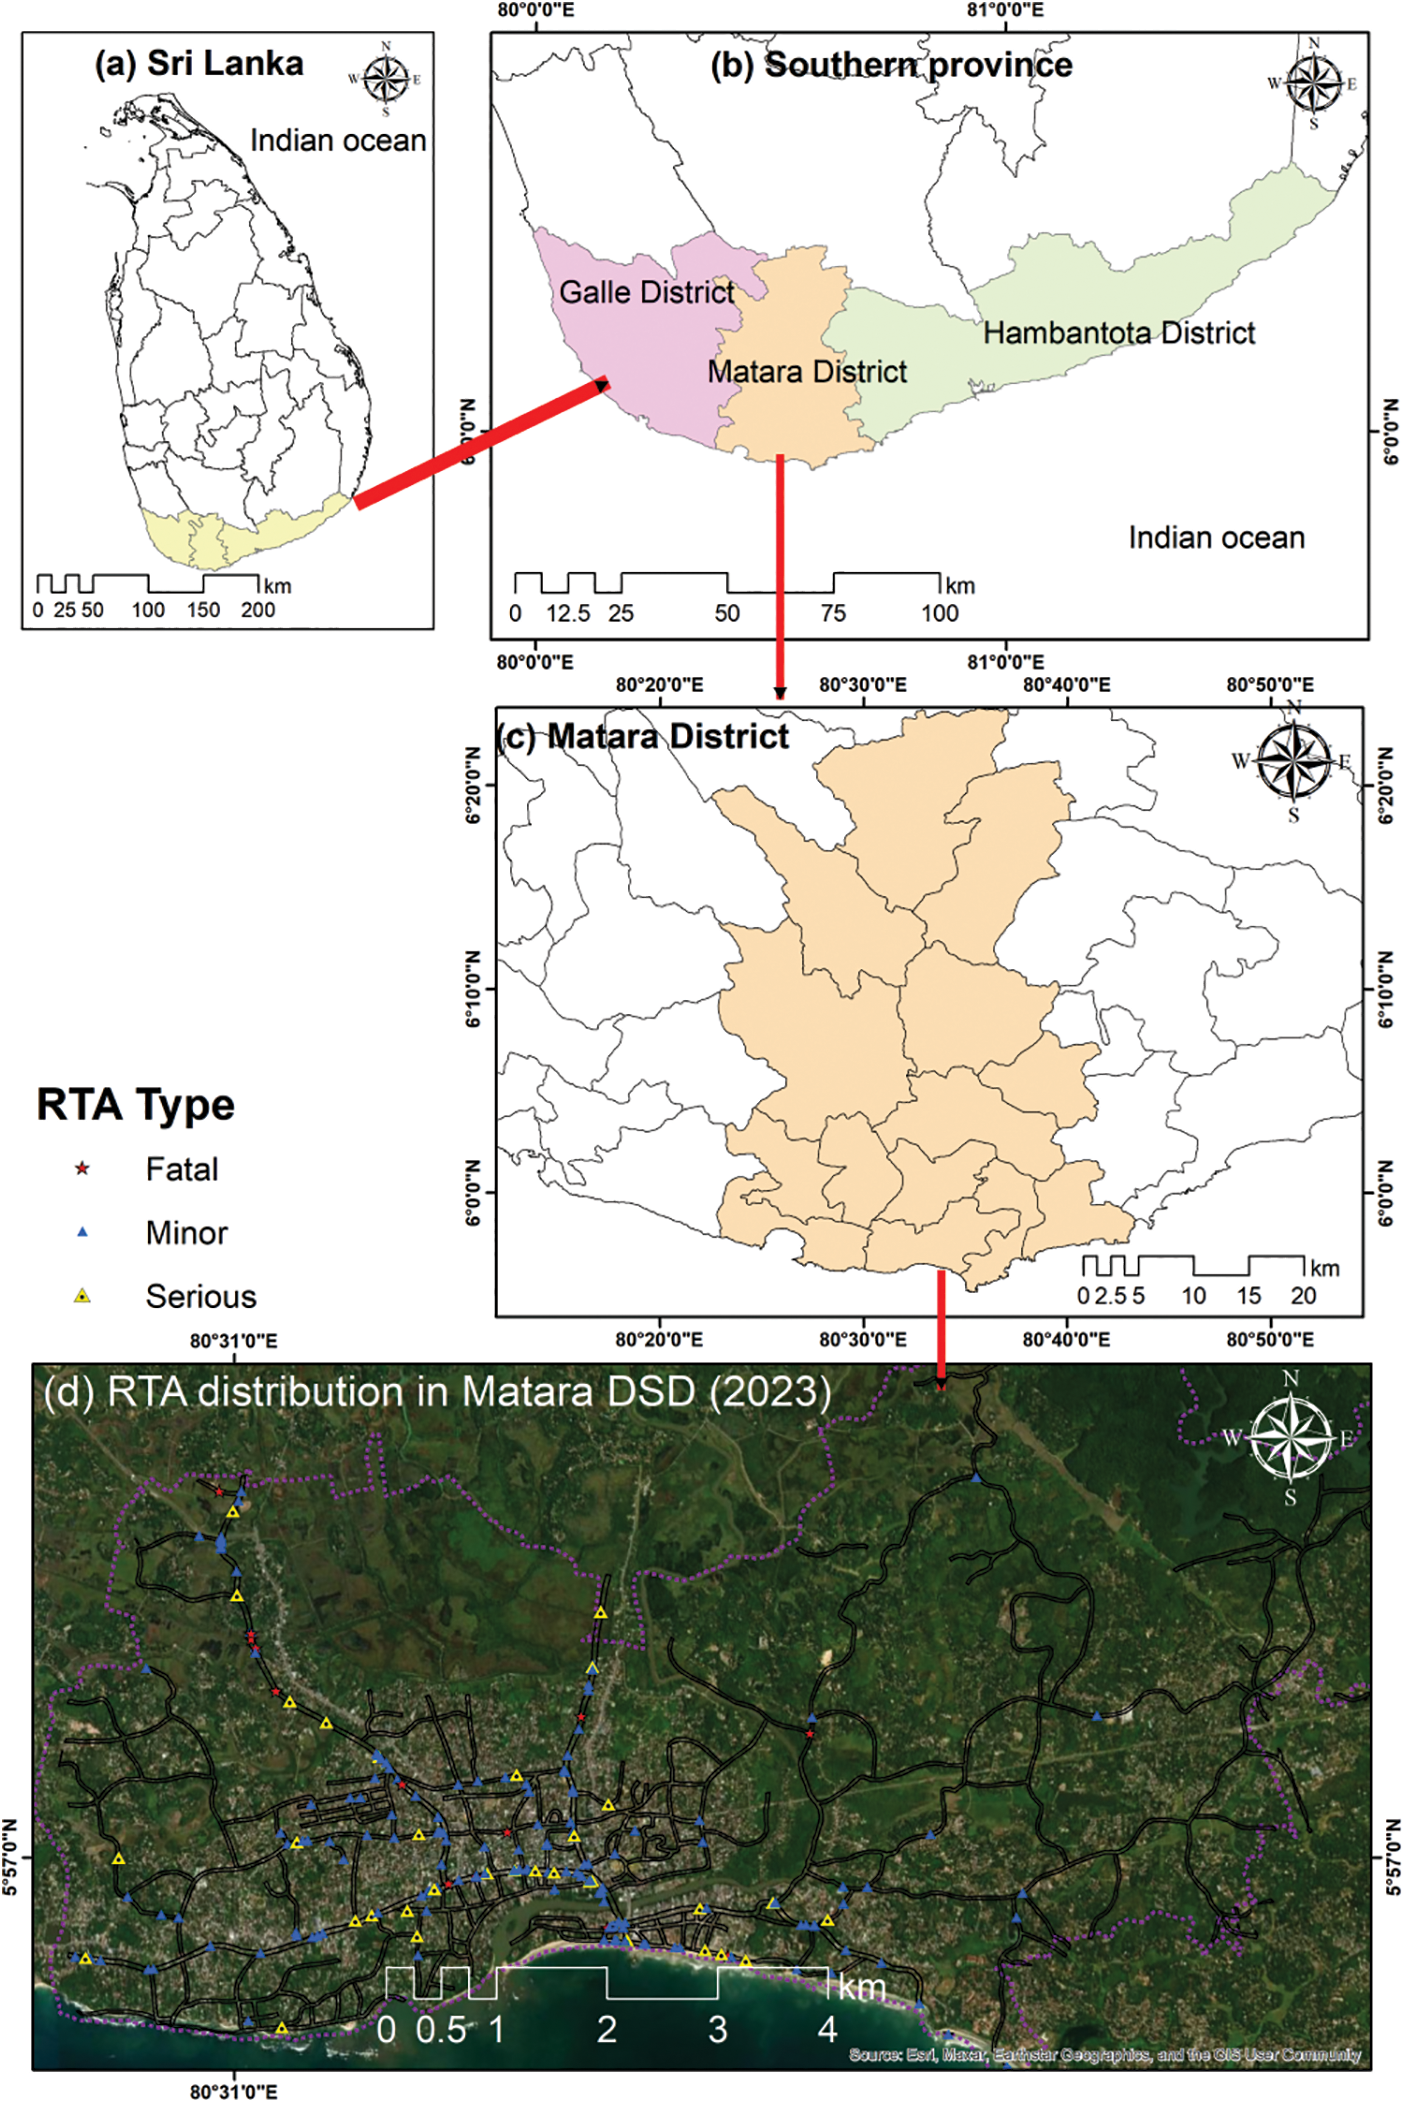
Figure 1: Location of study area: (a) Sri Lanka; (b) Southern province; (c) Matara district; and (d) Distribution of RTAs in Matara DSD, 2023
RTA records for the year 2023 from the Matara police station's First Information Reports (FIRs) were reviewed to identify accident-prone locations for this research [62]. Due to limitations in data availability and institutional access, this study focused exclusively on road accident data from the year 2023. While the use of single-year data may limit longitudinal analysis, it nonetheless provides a critical and timely snapshot of current spatial accident patterns within the Matara DSD.
The spatial distribution, clustering tendencies, and hotspot identification derived from GIS analysis are still highly valuable for short-term planning and policy interventions. Moreover, the 2023 dataset represents the most recent and complete record available at the time of the study, ensuring the relevance and immediacy of findings. Future research can extend this work by incorporating multi-year datasets when they become accessible, enabling trend analysis and deeper statistical rigor.
Based on the information recorded in the FIRs, field visits were conducted to the accident sites, and GPS coordinates were recorded using an android supported CTDroid Sri Lanka GPS tracking system (version 4.5). These coordinates were then imported to ArcMap environment in order to visually highlight the accident-prone areas within the Matara DSD. Reproduced data were gathered from various sources, including online available research papers, census reports and government statistics.
For data analysis, descriptive and quantitative techniques were employed. Fig. 2 shows the methodological procedure applied for the research. The qualitative approach involved description of RTA trends, characteristics, reasons, and effects, that were examined and illustrated using Microsoft Excel 2021. In contrast, the GIS techniques included severity, density, cluster, and hot spots which were performed using ArcMap 10.8 developed by the Environment Systems Research Institute. The spatial dataset consisted of geo-referenced RTA point data obtained from local traffic police records for the year 2023. The data underwent a multi-step pre-processing procedure to ensure accuracy and consistency. These steps were; data cleaning: duplicate entries, missing coordinates, and incomplete or inconsistent records were identified and removed; geocoding: accident locations were geocoded manually using google maps and verified through cross-referencing with known landmarks and road intersections in the study area; projection and spatial resolution: All geospatial data were projected using the WGS 1984 UTM Zone 44N coordinate system. For raster-based spatial analysis, a resolution of 100 meters per cell was applied. This resolution was selected as a balance between capturing local variations in accident density and minimizing noise or over-generalization in the output.

Figure 2: The flowchart illustrates the methodology of the study, outlining the step-by-step process
The application of spatial analytical techniques such as KDE, Getis-Ord Gi* (GiZscore), and Moran’s I in this study is grounded in their established effectiveness in identifying spatial patterns and clusters of RTAs. KDE is widely used to visualize and estimate the intensity of point events over a continuous surface, facilitating the identification of high-risk zones or “hotspots” of RTAs. This method has been effectively applied in diverse geographical contexts, such as in Tehran, Iran, and Mumbai, India, where it enabled the detection of accident-prone locations for targeted interventions. The Getis-Ord Gi* statistic complements KDE by statistically confirming the presence of significant hotspots and cold spots through spatial clustering analysis. Its application in studies such as those in Ghana and South Africa has demonstrated its robustness in validating RTA concentration in areas beyond visual inspection. Furthermore, Moran’s I, a global spatial autocorrelation measure, is essential for quantifying the overall spatial dependence of accident occurrence, determining whether the spatial distribution of RTAs is clustered, dispersed, or random. Its utility has been demonstrated in research conducted in China, providing critical insights into the spatial dynamics of accidents. These spatial methods collectively enable a comprehensive understanding of the spatial structure and distribution of RTAs, offering evidence-based guidance for localized traffic safety interventions.
The selection of parameters, particularly the bandwidth for KDE, was guided by Exploratory Spatial Data Analysis (ESDA) and aligned with spatial distribution characteristics and study area size. A fixed bandwidth approach was used based on the average nearest neighbor distance of accidents, ensuring sensitivity to localized patterns while minimizing over-smoothing. For Getis-Ord Gi* and Moran’s I, spatial weights were defined using inverse distance methods, and assumptions such as spatial stationarity and normality of residuals were considered during interpretation. While formal cross-validation or sensitivity testing was limited due to dataset constraints, the methods were applied following standard practices in spatial epidemiology and transportation geography. Future studies will aim to incorporate robust validation strategies such as Monte Carlo simulations, bandwidth sensitivity analysis, and temporal cross-checking, subject to data availability. These analytical methods are elaborated in the sub-sections below.
This index used to assess the gravity of accidents upon 2023 accident data. A higher value of the index demonstrates a more severe accident, which is directly associated with higher costs. The index was based on the Belgian severity weighting system, with assigning 5, 3, 1 weights for fatal, serious, and minor accidents, respectively [63]. Due to the lack of statistical data for above three categories for each RTA locations 25 main junctions were defined to calculate the SI index. Then the locations with a SI value greater than 12 were considered as accident black spots. While this approach provides valuable insights into the most critical nodes within the city’s traffic system, it may underrepresent severity patterns in peripheral or low-density areas. Future studies should aim to expand the SI analysis to a broader spatial scale, contingent upon the availability of granular severity data across all recorded accident points. This would enable a more inclusive and representative assessment of accident severity across the entire urban area. The SI was derived using the below Eq. (1) [63]:
In the equation severity index for each location is explains by SI, while D refers total number of deaths, S stands for total number of serious injuries, and L indicates the total number of minor injuries.
This is a method used to quantify spatial auto correlation. This was used to examine the distribution pattern of accidents by considering the positions and feature values [64]. Then, to assess whether accidents are distributed randomly, clustered or dispersed by analyzing the whole dataset. High positive spatial auto correlation indicates that similar values are grouped together, while negative auto correlation suggests the dispersion. Moran's I and Geary’s C are the most popular indices of spatial auto correlation. Moran’s I values range from −1 to 1 and value close to 1 suggests the presence of spatial auto correlation and a clustering trend, while a value near to −1 indicates that the data are scattered and discontinuous. Moran's statistic is computed based on the weight matrix using the fundamental Eq. (2) as shown below [64]:
where,
xi = The interval variable’s value in areal units i
wij = Spatial weight between i and j
For Moran’s I, we applied the Global Moran’s I to assess overall spatial autocorrelation and validated the results through Monte Carlo simulations (999 permutations) to ensure statistical significance, following standard practices. This confirmed that the spatial patterns observed were not due to random chance.
This is a non-parametric technique used to assess the probability density function of a random variable. In this research, the KDE was applied to create a heat map that illustrates the variation in RTA statistics, ranging from high to low. This method measures the likelihood of RTA occurring at any predefined place on the map. The two major variables that significantly influence the KDE technique are cell size and bandwidth. In this study, a bandwidth value of 500 m and a cell size of 100 m were used to visualize RTA hotspots effectively in similar studies of Katun et al. [63]. The KDE was computed using the below Eq. (3) [63]:
In above equation f(x, y) indicates the density estimate of the location (x, y), n denotes observation numbers, h refer bandwidth, K stands for kernel function, and di denotes distance between the location (x, y) and the target location. For KDE, the bandwidth (500 m) critically influences the smoothing and accuracy of the resulting density surface. We initially determined the bandwidth using Silverman’s rule of thumb, a well-established method in spatial point pattern analysis that balances the risk of over- and under-smoothing.
To ensure the robustness of hotspot identification, we conducted sensitivity testing by applying multiple bandwidth values ranging from 300 to 800 m. This allowed us to observe the impact of different smoothing levels on hotspot patterns. The 500-m bandwidth was ultimately selected because it provided the clearest spatial differentiation of accident clusters without introducing artificial fragmentation or excessive generalization.
Additionally, a cell size of 100 meters was used for the raster output, aligning with the spatial resolution of other datasets and ensuring an appropriate level of detail for urban-scale analysis. This combination of informed parameter selection and iterative validation supports the reliability of the KDE-based hotspot results presented in this study.
This was conducted using the statistics of RTAs to identify the locations of clusters. Accident hot spots are defined as areas where there is an unusual concentration of crash patterns that employs the Getis-Ord Gi* statistic to detect clusters of geographical frequencies. This statistic measures the extent to which weighted points are concentrated and detects mathematically influential hot spots and cold spots. The Getis-Ord local statistic is represented by the following Eq. (4) [63,64]:
In this equation n stands for the number of attributes, while the attribute value for feature j denotes by xj, wi.j indicates the spatial weights between the feature i and j. S refers the standard deviation of all attributes. In the case of Getis-Ord Gi* (GiZscore), we ensured that statistical assumptions were met by using z-score and p-value thresholds to identify statistically significant clusters at a 95% confidence level. The spatial weight matrix was defined using the fixed distance band method, which maintains consistency in spatial interactions and has been widely adopted in urban accident clustering studies.
The analysis of RTA statistics from 2020 to 2023 offers insights into accident trends within the Matara DSD. According to Table 1 and Fig. 3, a total of 785 accidents occurred during the four-year period, resulting in 55 fatalities. The highest number of accidents was recorded in 2020 (245 incidents), while the lowest was in 2023 (153 incidents), showing an overall decline in accident frequency. Although no statistically significant linear trend was observed, these yearly fluctuations highlight the importance of understanding temporal and behavioral factors influencing RT incidents, which are explored in subsequent sections.


Figure 3: Yearly trend of reported RTAs in Matara DSD from 2020 to 2023
In this study, the temporal distribution of RTAs was analyzed using defined time intervals that correspond to key traffic activity periods. The time intervals were categorized as (Morning peak: 06:00 a.m. to 10:59 a.m., Afternoon peak: 11:00 a.m. to 04:59 p.m., Evening peak: 05:00 p.m. to 07:59 p.m., Late night: 08:00 p.m. to 11:59 p.m., Night: 12:00 a.m. to 05:59 a.m.). These intervals were selected based on typical daily traffic flow patterns observed in urban Sri Lankan contexts, reflecting work commutes, school hours, and late-night travel behavior.
The temporal evaluation of road traffic accidents in the Matara DSD, considering modified time intervals for different periods, shows a significant variation in accident frequency and severity across different times of the day. Fig. 4 shows the road accidents distribution across peak hours in Matara DSD. The analysis of road traffic accidents in the Matara DSD reveals notable temporal patterns in accident occurrence, with the most of accidents occurred during the afternoon peak (11:00 a.m. to 4:59 p.m.). This time period, often characterized by a mix of post-lunch traffic, school-related congestion, and commuters returning home, sees a notable increase in accident frequency.

Figure 4: Temporal distribution of RTAs during peak hours in Matara DSD for the year 2023 (a–e)
Spatially, the accident hotspots are concentrated around areas such as Hitthatiya, Ellawella Junction, Isadeen town, Rahula Junction, Nupe Junction, Welegoda, Godagama, Palatuwa, and bus stand area. These locations are particularly vulnerable due to a combination of heavy vehicle traffic, complex road layouts, and pedestrian activity. For instance, Rahula Junction and Nupe Junction are both major traffic hubs, with frequent intersections and high pedestrian movement, particularly during school hours, contributing to higher accident rates. Hitthatiya and Ellawella Junction are critical points where traffic congestion and complex intersection designs may lead to accidents, including severe or fatal crashes.
The area around the bus stand, where people congregate and cross the road, also see a higher frequency of accidents due to the interaction between vehicles and pedestrians. These zones, characterized by poor traffic flow management and a mix of vehicle types, see both minor collisions and more severe accidents, sometimes involving pedestrians. The increased accident severity is observed in these areas, particularly during the afternoon peak.
4.3 Accident Characteristics Analysis
The majority of accidents occurred near the city center along the Colombo-Wellawaya Road. In addition, accidents were also concentrated near the southern expressway exit and Rahula Junction. The area around the southern expressway exit is a hotspot for accidents, likely due to high vehicle traffic exiting the area. Rahula Junction is also a significant accident-prone location, as it is situated near Rahula national school and several other well-known schools, leading to increased vehicle presence and pedestrian activity. Along the Colombo-Wellawaya main road, accidents are notably frequent, with specific locations such as in front of Asiri hospital in Nupe, near the Matara bodhiya pedestrian crossing, and close to the main bus stand in Matara standing out as key accident zones.
Several factors cause to the occurrence of TRA and these factors can be classified into three main groups: vehicle-related factors, human factors, and road environment factors, as illustrated in Fig. 5. In 2023, the primary cause of road accidents was driver negligence (57%), which contributed significantly to the overall accident rate. Other notable factors included aggressive driving (14%), and driving under influence (8%), both of which were responsible for a considerable number of accidents. Additionally, issues like driving on the wrong side, and improper overtaking also played a role in causing accidents. Slippery road conditions and vehicle-related issues were less frequent but still contributed to the overall accident statistics. Out-of-control driving was another contributing factor, highlighting the importance of maintaining proper control over the vehicle at all times.

Figure 5: Breakdown of the main contributing factors to RTAs in Matara DSD during 2023
The analysis of accident hot spots and cold spots highlights key areas requiring focused attention to enhance road safety. With 95%–99% confidence scales, 6 locations were found to be RTA hot spots, these are illustrated in Fig. 6. Accident hot spots, identified in dark blue, are locations with high accident density, including Hitthatiya, Ellawella Junction, Isadeen town, Rahula Junction, Welegoda, and Thihagoda area.

Figure 6: RTA hotspots and coldspots at Matara in the year 2023
These areas likely suffer from issues such as heavy traffic, inadequate road infrastructure, poorly designed intersections, and insufficient pedestrian safety measures, leading to to the high intensity of accidents. In contrast, coldspot areas, shown in yellow, have a low accident density, but these regions still need monitoring to ensure that they do not become accident-prone due to under reporting, changing traffic conditions, or deteriorating infrastructure. Moderate accident density areas, marked in green, require attention to factors such as road conditions, driver behavior, and traffic regulation. Overall, targeted interventions in the identified hotspot areas, coupled with continued surveillance of coldspots, will help improve road safety and reduce traffic-related incidents across the region.
4.5 RTA Hotspots Based on GiZscore
The Getis-Ord Gi* (GiZscore) analysis offers a statistically robust method for identifying spatial clusters of high and low accident intensities. The calculated Z-scores ranged from −1.73 to 2.10, indicating varying degrees of spatial clustering in accident occurrences. These Z-scores are associated with p-values that signify the statistical confidence with which a point can be identified as part of a significant hotspot or cold spot. Specifically: Z-scores ≥ ±1.65 correspond to a 90% confidence level (p < 0.10), Z-scores ≥ ±1.96 to a 95% confidence level (p < 0.05), Z-scores ≥ ±2.58 to a 99% confidence level (p < 0.01).
Points in red colour on the map (Fig. 7) represent statistically significant hotspots (positive Z-scores), while blue points indicate cold spots (negative Z-scores), where accident incidence is lower than expected. The highest confidence clusters (Z > 1.96) were found at Hittatiya Junction, Rahula Junction, Isadden Junction, Kumaradasa Junction, Nupe Junction, Asiri Hospital, and Godagama Junction. These areas are flagged as high-priority locations for intervention based on both the frequency and spatial significance of accident occurrences. The identification of these clusters provides actionable insights for urban planners and traffic safety authorities. The statistical significance strengthens the reliability of hotspot designation and minimizes the likelihood of random chance influencing the observed patterns.

Figure 7: Spatial distribution of RTAs hotspots in 2023, identified using the GiZ score [Note: High GiZ values indicate statistically significant clustering of accidents]
Based on death, serious injuries, and minor injuries the SI values were calculated for 25 main junctions in the study area and RTA black spots was identified accordingly (Table 2 and Fig. 8). Nupe junction, bus stand and police station junction stand out due to high SI values as 16, 15, 14, 13, 12 due to considerable concentration of RTA. Kumaradasa, Godagama and Buddhist college junction was not identified as black spots due to their low SI values as 1, 2, 3, respectively. Thus, the roads in and around city center illustrates a high prevalence of severe RTA according to RTA data from 2023.


Figure 8: Spatial distribution of the RTA severity index in Matara DSD
4.7 Cluster Pattern of the RTA
The spatial auto correlation analysis (Moran's I) of RTA for the year 2023 reveals an observed z-score value of −1.085 and a p-value of 0.2775 (Fig. 9). A negative z-score indicates that there is a tendency for accidents to be dispersed rather than clustered, suggesting that accidents are spread out across different locations rather than occurring in concentrated hotspots. The p-value of 0.2775, which is higher than the typical significance threshold of 0.05, further supports the conclusion that the geographical variations of accidents in 2023 is not statistically significant in terms of clustering. In other words, the accident data does not show a strong spatial pattern, and the accidents appear to be randomly distributed across the study area.

Figure 9: Spatial autocorrelation of road accidents in 2023 based on Moran’s I analysis
While the global Moran’s I statistic (z = −1.085; p = 0.2775) indicates no statistically significant overall spatial clustering of road traffic accidents in the study area, this does not preclude the existence of localized hotspots. Global Moran’s I captures the broad spatial trend and is sensitive to uniform or widespread clustering across the entire region. However, road accidents are often the result of localized risk factors such as traffic volume, road geometry, or junction complexity which may not significantly influence the global index.
Therefore, complementary spatial techniques such as Getis-Ord Gi* and KDE were employed to detect local patterns of significance. These methods revealed specific locations such as Hittatiya Junction, Rahula Junction, and Nupe Junction with statistically significant clustering of accidents at the local level. This multi-scale analytical approach is widely adopted in spatial epidemiology and accident research, as it enables the detection of fine-grained spatial heterogeneity that may be masked in global statistics. Hence, the lack of global clustering does not contradict the identification of localized high-risk zones; instead, it highlights the spatial variability of risk within an otherwise spatially dispersed dataset.
The KDE map for RTA in 2023 in Fig. 10 demonstrates a spatial representation of accident occurrences across the area. The values on the map range from 0 to 945,067, with the blue color areas representing regions with the highest accident occurrences, ranging from 592,983 to 945,067 accidents. These blue zones indicate areas with a high concentration of accidents, suggesting that these locations are particularly prone to frequent traffic incidents. The areas marked in blue with high accident density likely experience significant traffic congestion, poorly designed roadways, or a combination of both. These areas may also be characterized by increased pedestrian movement, inadequate road safety infrastructure, or a higher volume of vehicles. In contrast, areas with lower accident occurrences are represented by values closer to 0, indicating relatively safer regions with fewer accidents. While these areas are less prone to accidents, continued monitoring and maintenance of road safety measures are still necessary to ensure that they remain low-risk. The kernel density map helps in identifying where focused interventions should be made, allowing for more effective resource allocation and safety improvements.

Figure 10: KDE map showing the spatial intensity of RTAs in Matara City for the year 2023
5.1 Spatial Patterns of RTA and Effect of Severity Factors
The geo spatial analysis of RTA identified critical hotspots along major routes such as the Colombo-Wellawaya road, near the southern expressway exit, and Rahula Junction. These findings align with similar studies, such as those by Prasannakumara et al. (2011) in Thiruvananthapuram, Kerala, and Kaygisiz et al. (2015) in Tunisia, which observed high accident frequencies in areas with significant urban intersections and dense pedestrian activity [65,66]. In Matara, hotspots were concentrated in locations with complex road conditions, heavy vehicle traffic, and increased pedestrian presence; particularly during school hours. The severity of accidents in these areas was linked to the high vehicle volume and pedestrian interaction, consistent with findings from studies in other regions where intersections, major road networks, and pedestrian hubs significantly contribute to accident hotspots. Moreover, the spatial patterns of accident severity were similar to those in studies by Kaygisiz et al. (2015), where high-speed roads with complex junctions and heavy traffic led to more severe crashes [66]. The Southern Expressway exit, for example, exhibited a higher likelihood of serious accidents due to the combined effect of high-speed traffic and congestion during peak hours.
5.2 Temporal Patterns and Effects of Severity Factors
The temporal distribution of RTA revealed a peak during the afternoon hours (11:00 a.m. to 4:59 p.m.), a pattern that is consistent with the results of Erdogan et al. [67], and Soltani and Aksari [54]. These studies identified high accident frequencies during specific time frames, such as weekends or peak hours. In Matara, the peak coincided with school hours, particularly near Rahula Junction, where the combined presence of vehicles and pedestrians heightened accident risks. The study also found that severe accidents occurred more frequently during nighttime, a trend similar to that observed in Khatun et al. [63], where nighttime accidents were linked to poor visibility and high-speed driving. These findings highlight that both temporal factors, such as the time of day, and environmental conditions, such as, lighting, significantly contribute to the severity of accidents.
5.3 Implications for RTA Prevention & Mitigation
These findings suggest several implications for accident prevention, which align with recommendations from other studies. In particular, the hotspots identified along Rahula Junction and the southern expressway exit call for targeted interventions such as enhanced pedestrian facilities, optimized traffic signal systems, and improved road design. These suggestions are similar with the recommendations of Aati et al. [68] and Khatun et al. [63], who emphasized better traffic management, stricter enforcement of traffic regulations, and road safety infrastructure. Additionally, focusing on reducing accidents during peak traffic hours, particularly in areas with high pedestrian activity, could help mitigate the risks. The need for improved enforcement of traffic regulations and raising awareness on driver behavior is also crucial. The study aligns with Soltani and Aksari, and Khatun et al. which identified driver negligence and speeding as major contributors to accidents [54,63]. By strengthening traffic enforcement, particularly during peak times, and promoting better driving habits, the risks associated with these factors could be significantly reduced.
The spatial and temporal patterns identified in this study have direct implications for public health and traffic safety policy in the Matara DSD. The KDE and GiZscore results highlight critical accident hotspots such as Nupe Junction, Rahula Junction, and the bus stand area, which require immediate attention from urban planners and traffic authorities. Interventions in these zones should prioritize pedestrian safety through the installation of signalized crosswalks, improved street lighting, and traffic calming measures. Moreover, the finding that driver negligence is the leading cause of accidents underscores the need for targeted awareness campaigns, driver training programs, and stricter enforcement of road safety laws, particularly during afternoon peak hours when accidents are most frequent. Alcohol-related and aggressive driving incidents also warrant enhanced police monitoring and public education, especially around nightlife zones. At the policy level, this study supports the establishment of a data-driven traffic accident management framework that integrates spatial analysis into urban road safety planning. The identification of blackspots and high-severity zones can also inform ambulance placement, trauma care access, and resource allocation for first responders contributing to reduced morbidity and mortality associated with road traffic injuries.
5.4 Limitations and Future Directions
This study focused exclusively on road traffic accident data from the year 2023, which offered the most complete and reliable dataset at the time of analysis. While this single-year snapshot allows for the identification of current spatial patterns, high-risk locations, and behavioral factors contributing to accidents, it inherently limits the temporal robustness of conclusions regarding long-term trends or inter-annual fluctuations. We recognize that accident rates and spatial concentrations may vary across years due to changes in traffic volume, enforcement policies, infrastructure development, or external events (e.g., weather, public holidays, or socio-economic conditions). Future research should incorporate multi-year accident datasets to enable temporal trend analysis and better assess the stability of identified hotspots over time. Such longitudinal analyses would also support the development of more sustainable and adaptable road safety policies. This limitation is noted in studies like those by Gedamu et al. [64], where long-term data analysis is critical for understanding shifts in accident trends and assessing the success of safety measures. Additionally, the study did not consider external factors such as weather conditions, which could influence both the frequency and severity of accidents. Other research, such as that by Khatun et al. [63] suggests that incorporating environmental factors like seasonal variations and weather conditions would enhance the comprehensiveness of future analyses. Furthermore, the study did not include detailed information on driver behavior, which plays a significant role in accidents. While this study utilizes available official records to incorporate key aspects of driver behavior, such data is often aggregated and lacks detailed context on individual decision-making processes. We acknowledge this limitation and emphasize the importance of future research incorporating more granular behavioral data such as real-time driver monitoring or telematics-based assessments to more systematically understand and model the impact of driver behavior on road safety outcomes. Studies conducted by Soltani and Aksari [54] and Erdogan et al. [67] emphasize that factors such as speeding, alcohol consumption, and poor driving habits contribute significantly to accidents. Future research should focus on integrating behavioral data to gain a deep understanding of accident causality. Another limitation is the lack of a comparison of accident trends before and after safety interventions, which would provide more clarity on the effectiveness of implemented measures. Future studies could address this by expanding the study period to include pre- and post-intervention data, thereby enabling a more robust evaluation of safety measures. In summary, future research in Matara should aim to integrate long-term data, weather conditions, and driver behavior to create a more comprehensive understanding of traffic accidents and their causes. Additionally, the inclusion of a comparative analysis of accident data before and after interventions would help assess the effectiveness of safety measures, ultimately contributing to improved road safety strategies in the region.
One limitation in interpreting the findings lies in the absence of directly comparable studies using spatial analytical tools in the Sri Lankan context, particularly for Matara. While several studies have assessed road traffic accidents using descriptive statistics or regression models, few (if any) have applied GIS-based techniques such as KDE, Getis-Ord Gi*, or Moran’s I within the country. As a result, this study represents a pioneering effort to spatially quantify accident risk at a sub-city level in Sri Lanka. In the absence of direct benchmarks, we referred to broader studies in South Asia such as hotspot analyses in India (e.g., Mumbai, Bengaluru) and Pakistan, which report similar trends in urban areas: accident hotspots are typically concentrated around high-volume intersections, commercial centers, and near transit hubs. The spatial concentration of accidents near Rahula Junction and Hittatiya Junction in Matara mirrors these international patterns, indicating a degree of external validity despite the local focus. Future research can build on this foundational work to develop national or regional spatial benchmarks for urban accident risk in Sri Lanka, enabling more robust cross-city comparisons and performance tracking over time.
This study examined the spatial distribution of RTAs in the Matara DSD using GIS-based spatial analysis techniques. The findings identified several high-risk accident zones particularly along the Colombo–Wellawaya road, the southern expressway exit, and Rahula Junction characterized by high traffic volumes, complex road layouts, and a mix of pedestrian and vehicular movement. KDE and GiZscore analysis confirmed these as accident hotspots with significantly high accident densities. Conversely, the Moran’s I spatial autocorrelation analysis revealed a relatively dispersed pattern of accidents across the region, indicating that while certain hotspots are prominent, RTAs are not exclusively confined to these locations. Driver behavior specifically negligence, aggressive driving, and alcohol consumption- was identified as a major contributing factor to accidents, more so than road or vehicle-related issues. Based on these insights, the study recommends a series of targeted interventions including infrastructure improvements in high-risk areas, stronger enforcement of traffic laws, especially against speeding and drunk driving, increased police presence at critical junctions, deployment of surveillance technologies (e.g., traffic cameras), public education and awareness campaigns, especially around schools and busy pedestrian zones. In summary, while RTAs are distributed across the Matara DSD, certain hotspots demand urgent attention. In response, we recommend site-specific interventions, including Rahula Junction & Isadeen Town: installation of pedestrian overpasses or signalized crosswalks due to high student and pedestrian traffic; Hittatiya and Godagama junctions: redesign of intersection geometry and signal synchronization to reduce vehicle conflict points; Southern expressway exit: improved signage, speed bumps, and road surface markings to better regulate merging traffic and reduce high-speed conflicts; Enhanced law enforcement, particularly night-time DUI checkpoints and speed enforcement along Colombo–Wellawaya road. Implementing these recommendations alongside continuous monitoring and evaluation can substantially reduce accident rates and enhance traffic safety in the region.
Acknowledgement: Our sincere thanks go to the all officials in Matara police station and Matara DS office who provided supplementary information relevant to the study. The authors also gratefully acknowledge the anonymous reviewers who helped immensely to improve the quality of the manuscript through their constructive comments and suggestions.
Funding Statement: The authors received no specific funding for this study.
Author Contributions: Conceptualization, Buddhini Chaturika Jayasinghe and Neel Chaminda Withanage; Data curation, Buddhini Chaturika Jayasinghe and Neel Chaminda Withanage; Formal analysis, Buddhini Chaturika Jayasinghe and Neel Chaminda Withanage; Investigation, Buddhini Chaturika Jayasinghe and Neel Chaminda Withanage; Methodology, Buddhini Chaturika Jayasinghe and Neel Chaminda Withanage; Resources, Neel Chaminda Withanage and Prabuddh Kumar Mishra; Software, Buddhini Chaturika Jayasinghe and Neel Chaminda Withanage; Supervision, Prabuddh Kumar Mishra; Validation, Neel Chaminda Withanage; Visualization, Buddhini Chaturika Jayasinghe and Neel Chaminda Withanage; Writing—original draft, Buddhini Chaturika Jayasinghe; Review & editing, Neel Chaminda Withanage and Prabuddh Kumar Mishra. All authors reviewed the results and approved the final version of the manuscript.
Availability of Data and Materials: All relevant data used for the study will be available upon request from the corresponding author.
Ethics Approval: Not applicable.
Conflicts of Interest: The authors declare no conflicts of interest to report regarding the present study.
References
1. Alemi F, Circella G, Handy S, Mokhtarian P. What influences travelers to use Uber? Exploring the factors affecting the adoption of on-demand ride services in California. Travel Behav Soc. 2018;13(1):88–104. doi:10.1016/j.tbs.2018.06.002. [Google Scholar] [CrossRef]
2. Waqar A, Alshehri AH, Alanazi F, Alotaibi S, Almujibah HR. Evaluation of challenges to the adoption of intelligent transportation system for urban smart mobility. Res Transp Bus Manag. 2023;51(3):101060. doi:10.1016/j.rtbm.2023.101060. [Google Scholar] [CrossRef]
3. WHO. World report on road traffic injury Prevention. [cited 2025 Aug 7]. Available from: https://www.who.int/publications/i/item/world-report-on-road-traffic-injury-prevention. [Google Scholar]
4. WHO. Road traffic injuries. 2022. [cited 2025 Aug 7]. Available from: https://www.who.int/news-room/fact-sheets/detail/road-traffic-injuries. [Google Scholar]
5. Yan X, Zhang H, Wu C. Research and development of intelligent transportation systems. In: 2012 11th International Symposium on Distributed Computing and Applications to Business, Engineering & Science; 2012 Oct 19–22; Guilin, China. p. 321–7. doi:10.1109/DCABES.2012.107. [Google Scholar] [CrossRef]
6. WHO. Road traffic injuries: fact sheet; 2023. [cited 2025 Aug 7]. Available from: https://www.who.int/news-room/fact-sheets/detail/road-traffic-injuries. [Google Scholar]
7. WHO. Global status reports on road safety. [cited 2025 Aug 7]. Available from: http://www.who.int/violence_injury_prevention/road_safety_status/. [Google Scholar]
8. Loo BPY, Anderson TK. Spatial analysis methods of road traffic collisions. 1st ed. Boca Raton, FL, USA: CRC Press; 2015. doi:10.1201/b18937. [Google Scholar] [CrossRef]
9. Bucsuházy K, Matuchová E, Zůvala R, Moravcová P, Kostíková M, Mikulec R. Human factors contributing to the road traffic accident occurrence. Transp Res Procedia. 2020;45(6):555–61. doi:10.1016/j.trpro.2020.03.057. [Google Scholar] [CrossRef]
10. Ansari S, Akhdar F, Mandoorah M, Moutaery K. Causes and effects of road traffic accidents in Saudi Arabia. Public Health. 2000;114(1):37–9. doi:10.1038/sj.ph.1900610. [Google Scholar] [PubMed] [CrossRef]
11. Sharma BR. Road traffic injuries: a major global public health crisis. Public Health. 2008;122(12):1399–406. doi:10.1016/j.puhe.2008.06.009. [Google Scholar] [PubMed] [CrossRef]
12. Schmucker U, Dandona R, Kumar GA, Dandona L. Crashes involving motorised rickshaws in urban India: characteristics and injury patterns. Injury. 2011;42(1):104–11. doi:10.1016/j.injury.2009.10.049. [Google Scholar] [PubMed] [CrossRef]
13. Wangdi C, Gurung MS, Duba T, Wilkinson E, Tun ZM, Tripathy JP. Burden, pattern and causes of road traffic accidents in Bhutan, 2013–2014: a police record review. Int J Inj Contr Saf Promot. 2018;25(1):65–9. doi:10.1080/17457300.2017.1341930. [Google Scholar] [PubMed] [CrossRef]
14. Zhang G, Yau KKW, Chen G. Risk factors associated with traffic violations and accident severity in China. Accid Anal Prev. 2013;59:18–25. doi:10.1016/j.aap.2013.05.004. [Google Scholar] [PubMed] [CrossRef]
15. Gao J, Chen X, Woodward A, Liu X, Wu H, Lu Y, et al. The association between meteorological factors and road traffic injuries: a case analysis from Shantou city. China Sci Rep. 2016;6(1):37300. doi:10.1038/srep37300. [Google Scholar] [PubMed] [CrossRef]
16. Hansen JA. Weather components and employee accidents in a psychiatric hospital [master’s thesis]. Hays, KS, USA; 1988. doi: 10.58809/kcyx1786. [Google Scholar] [CrossRef]
17. Drosu A, Cofaru C, Popescu MV. Relationships between accident severity and weather and roadway adherence factors in crashes occurred in different type of collisions. In: The 30th SIAR International Congress of Automotive and Transport Engineering; 2019 Oct 23–25; Craiova, Romania. p. 251–64. doi:10.1007/978-3-030-32564-0_30. [Google Scholar] [CrossRef]
18. Bergel-Hayat R, Debbarh M, Antoniou C, Yannis G. Explaining the road accident risk: weather effects. Accid Anal Prev. 2013;60(3):456–65. doi:10.1016/j.aap.2013.03.006. [Google Scholar] [PubMed] [CrossRef]
19. Li W, Wu G, Zhang Y, Barth MJ. Safety analysis of the eco-approach and departure application at a signalized corridor. Tsinghua Sci Technol. 2018;23(2):157–71. doi:10.26599/tst.2018.9010061. [Google Scholar] [CrossRef]
20. Dharmaratne SD, Jayatilleke AU, Jayatilleke AC. Road traffic crashes, injury and fatality trends in Sri Lanka: 1938–2013. Bull World Health Organ. 2015;93(9):640–7. doi:10.2471/BLT.14.150193. [Google Scholar] [PubMed] [CrossRef]
21. Somasundaraswaran AK. Accident statistics in Sri Lanka. IATSS Res. 2006;30(1):115–7. doi:10.1016/S0386-1112(14)60162-X. [Google Scholar] [CrossRef]
22. Gunaruwan TL, Nayanalochana PCJ. Economic cost of human fatalities due to road traffic accidents in Sri Lanka: an estimation based on the human capital approach. J South Asian Logist Transp. 2023;3(1):39–57. doi:10.4038/jsalt.v3i1.59. [Google Scholar] [CrossRef]
23. Sri Lanka Police Department. Sri Lanka Police Statistics. Colombo, Sri Lanka: Sri Lanka Police Department; 2010. [Google Scholar]
24. Selvaratnam NC, Selvaratnam ND, Lanter P, Dharmaratne SD, Acker PC. Evaluating Sri Lanka’s road traffic crash and injury research: a systematic review focusing on data sources and methodological approaches. Eur J Public Health Stud. 2025;8(2):28–57. doi:10.46827/ejphs.v8i2.214. [Google Scholar] [CrossRef]
25. Amarasinghe PG, Dharmaratne SD. Epidemiology of road traffic crashes reported in the Kurunegala Police Division in Sri Lanka. SL J Med. 2019;28(1):10. doi:10.4038/sljm.v28i1.102. [Google Scholar] [CrossRef]
26. Bhele R, Dhungana S, Chimoriya D, Sapkota A, Ghorasaini S. Spatial and temporal analysis of road traffic accidents using GIS. Int J Engin Technol. 2024;2(1):1–18. doi:10.3126/injet.v2i1.72464. [Google Scholar] [CrossRef]
27. Alsahfi T. Spatial and temporal analysis of road traffic accidents in major Californian cities using a geographic information system. ISPRS Int J Geo-Inf. 2024;13(5):157. doi:10.3390/ijgi13050157. [Google Scholar] [CrossRef]
28. Hazaymeh K, Almagbile A, Alomari AH. Spatiotemporal analysis of traffic accidents hotspots based on geospatial techniques. ISPRS Int J Geo-Inf. 2022;11(4):260. doi:10.3390/ijgi11040260. [Google Scholar] [CrossRef]
29. Tola AM, Demissie TA, Saathoff F, Gebissa A. Severity, spatial pattern and statistical analysis of road traffic crash hot spots in Ethiopia. Appl Sci. 2021;11(19):8828. doi:10.3390/app11198828. [Google Scholar] [CrossRef]
30. Bíl M, Andrášik R, Sedoník J. A detailed spatiotemporal analysis of traffic crash hotspots. Appl Geogr. 2019;107(41):82–90. doi:10.1016/j.apgeog.2019.04.008. [Google Scholar] [CrossRef]
31. Zhang Y, Lu H, Qu W. Geographical detection of traffic accidents spatial stratified heterogeneity and influence factors. Int J Environ Res Public Health. 2020;17(2):572. doi:10.3390/ijerph17020572. [Google Scholar] [PubMed] [CrossRef]
32. Al-Omari A, Shatnawi N, Khedaywi T, Miqdady T. Prediction of traffic accidents hot spots using fuzzy logic and GIS. Appl Geomat. 2020;12(2):149–61. doi:10.1007/s12518-019-00290-7. [Google Scholar] [CrossRef]
33. Affum JK, Taylor MAP. Selatm—a GIS based program for evaluating the safety benefits of local area traffic management schemes. Trans Plann Tech. 1998;21(1–2):93–119. doi:10.1080/03081069708717603. [Google Scholar] [CrossRef]
34. Hirasawa M, Asano M. Development of traffic accident analysis system using GIS. East Asia Soc Transp Stud. 2003;4:1193–9. [Google Scholar]
35. Liang LY, Mosoem DM, Hua LT. Traffic accident application using geographic information system. J East Asia Soc Transp Stud. 2005;6:3574–89. doi:10.11175/easts.6.3574. [Google Scholar] [CrossRef]
36. Thomas I. Spatial data aggregation: exploratory analysis of road accidents. Accid Anal Prev. 1996;28(2):251–64. doi:10.1016/0001-4575(95)00067-4. [Google Scholar] [PubMed] [CrossRef]
37. Kim K, Yamashita EY. Using a k-means clustering algorithm to examine patterns of pedestrian involved crashes in Honolulu. Hawaii J Advced Transportation. 2007;41(1):69–89. doi:10.1002/atr.5670410106. [Google Scholar] [CrossRef]
38. Levine N. Building a spatial crash information system: examples from the Houston-Galveston metropolitan safety planning program. In: ITE 2006 Technical Conference and Exhibit Compendium of Technical Papers; 2006 Mar 19–22; San Antonio, TX, USA. [Google Scholar]
39. Bello T. A stratified traffic accident analysis case study: city of Richardson [master’s thesis]. Dallas, TX, USA: University of Texas; 2005. [Google Scholar]
40. Sabel CE, Kingham S, Nicholson A, Bartie P. Road traffic accident simulation modeling—a Kernel estimation approach. In: The 17th Annual Colloquium of the Spatial Information Research Centre; 2005 Nov 24–25; Dunedin, New Zealand. [Google Scholar]
41. Anderson TK. Kernel density estimation and k-means clustering to profile road accident hotspots. Accid Anal Prev. 2009;41(3):359–64. doi:10.1016/j.aap.2008.12.014. [Google Scholar] [PubMed] [CrossRef]
42. Bíl M, Andrášik R, Janoška Z. Identification of hazardous road locations of traffic accidents by means of kernel density estimation and cluster significance evaluation. Accid Anal Prev. 2013;55(3):265–73. doi:10.1016/j.aap.2013.03.003. [Google Scholar] [PubMed] [CrossRef]
43. Flahaut B, Mouchart M, San Martin E, Thomas I. The local spatial autocorrelation and the kernel method for identifying black zones: a comparative approach. Accid Anal Prev. 2003;35(6):991–1004. doi:10.1016/s0001-4575(02)00107-0. [Google Scholar] [PubMed] [CrossRef]
44. Le KG, Liu P, Lin LT. Traffic accident hotspot identification by integrating kernel density estimation and spatial autocorrelation analysis: a case study. Int J Crashworthiness. 2022;27(2):543–53. doi:10.1080/13588265.2020.1826800. [Google Scholar] [CrossRef]
45. Thakali L, Kwon TJ, Fu L. Identification of crash hotspots using kernel density estimation and Kriging methods: a comparison. J Mod Transp. 2015;23(2):93–106. doi:10.1007/s40534-015-0068-0. [Google Scholar] [CrossRef]
46. Baddeley A, Nair G, Rakshit S, McSwiggan G, Davies TM. Analysing point patterns on networks—a review. Spat Stat. 2021;42(4):100435. doi:10.1016/j.spasta.2020.100435. [Google Scholar] [CrossRef]
47. Levine N, Kim KE, Nitz LH. Spatial analysis of Honolulu motor vehicle crashes: ii. Zonal Generators Accid Anal Prev. 1995;27(5):675–85. doi:10.1016/0001-4575(95)00018-U. [Google Scholar] [PubMed] [CrossRef]
48. Kim K, Pant P, Yamashita E. Accidents and accessibility: measuring influences of demographic and land use variables in Honolulu. Hawaii Transp Res Rec J Transp Res Board. 2010;2147(1):9–17. doi:10.3141/2147-02. [Google Scholar] [CrossRef]
49. Scheiner J, Holz-Rau C. A residential location approach to traffic safety: two case studies from Germany. Accid Anal Prev. 2011;43(1):307–22. doi:10.1016/j.aap.2010.08.029. [Google Scholar] [PubMed] [CrossRef]
50. Rahman M, Shah Newaz SH. Development of a GIS based hazardous road location identification system for National Highways of Bangladesh. Online J Sci Technol. 2013;3:72–85. [Google Scholar]
51. Rahman F, Uddin M, Rahman A, Islam A. Identification of hazardous road locations and black spots on Dhaka-Barisal national highway. In: First International Conference on Advances in Civil Infrastructure and Construction Materials; 2015 Dec 14–15; Dhaka, Bangladesh. p. 911–9. [Google Scholar]
52. Jackson TL, Sharif HO. Rainfall impacts on traffic safety: rain-related fatal crashes in Texas. Geomat Nat Hazards Risk. 2016;7(2):843–60. doi:10.1080/19475705.2014.984246. [Google Scholar] [CrossRef]
53. Sun X, Hu H, Ma S, Lin K, Wang J, Lu H. Study on the impact of road traffic accident duration based on statistical analysis and spatial distribution characteristics: an empirical analysis of Houston. Sustainability. 2022;14(22):14982. doi:10.3390/su142214982. [Google Scholar] [CrossRef]
54. Soltani A, Askari S. Exploring spatial autocorrelation of traffic crashes based on severity. Injury. 2017;48(3):637–47. doi:10.1016/j.injury.2017.01.032. [Google Scholar] [PubMed] [CrossRef]
55. Lee M, Khattak AJ. Case study of crash severity spatial pattern identification in hot spot analysis. Transp Res Rec J Transp Res Board. 2019;2673(9):684–95. doi:10.1177/0361198119845367. [Google Scholar] [CrossRef]
56. Getis A, Ord JK. The analysis of spatial association by use of distance statistics. Geogr Anal. 1992;24(3):189–206. doi:10.1111/j.1538-4632.1992.tb00261.x. [Google Scholar] [CrossRef]
57. Sacchi E, Sayed T, El-Basyouny K. Multivariate full Bayesian hot spot identification and ranking. Transp Res Rec J Transp Res Board. 2015;2515(1):1–9. doi:10.3141/2515-01. [Google Scholar] [CrossRef]
58. Munasinghe DS. Spatial analysis of urban road traffic accidents using GIS. Br J Multidiscip Adv Stud. 2023;4(6):70–83. doi:10.37745/bjmas.2022.0368. [Google Scholar] [CrossRef]
59. Nalaka PK, Akther MSR, Naveendrakumar G. Accident hotspots in southern expressway of Sri Lanka: interpolation evaluation using GIS. Adv Tech. 2021;1(1):191–206. doi:10.31357/ait.v1i1.4835. [Google Scholar] [CrossRef]
60. De Silva V, Tharindra H, Vissoci JRN, Andrade L, Mallawaarachchi BC, Østbye T, et al. Road traffic crashes and built environment analysis of crash hotspots based on local police data in Galle, Sri Lanka. Int J Inj Contr Saf Promot. 2018;25(3):311–8. doi:10.1080/17457300.2018.1431932. [Google Scholar] [PubMed] [CrossRef]
61. Gaspe GS, Weeratunge NC, Dharmaratne SD, Gunatilake J, Dassanayake DS, Gamage O, et al. Analysis of fatal road traffic crashes in Kandy, Sri Lanka using GIS. Inj Prev. 2010;16(Suppl 1):A154. doi:10.1136/ip.2010.029215.552. [Google Scholar] [CrossRef]
62. Matara Police Station. First information reports (FIRs). Matara, Sri Lanka: Police Department; 2023. [Google Scholar]
63. Khatun MS, Hossain MA, Kabir MA, Rahman MA. Identification and analysis of accident black spots using geographic information system (GISa study on Kushtia-Jhenaidah national highway (N704Bangladesh. Heliyon. 2024;10(3):e25952. doi:10.1016/j.heliyon.2024.e25952. [Google Scholar] [PubMed] [CrossRef]
64. Gedamu WT, Plank-Wiedenbeck U, Wodajo BT. A spatial autocorrelation analysis of road traffic crash by severity using Moran’s I spatial statistics: a comparative study of Addis Ababa and Berlin cities. Accid Anal Prev. 2024;200:107535. doi:10.1016/j.aap.2024.107535. [Google Scholar] [PubMed] [CrossRef]
65. Prasannakumar V, Vijith H, Charutha R, Geetha N. Spatio-temporal clustering of road accidents: GIS based analysis and assessment. Procedia-Soc Behav Sci. 2011;21(1):317–25. doi:10.1016/j.sbspro.2011.07.020. [Google Scholar] [CrossRef]
66. Kaygisiz O, Yildız A, Duzgun S. Spatio-temporal pedestrian accident analysis to improve urban pedestrian safety: the case of the Eskisehir motorway. Gazi Univ J Sci. 2015;28:623–30. [Google Scholar]
67. Erdogan S, Yilmaz I, Baybura T, Gullu M. Geographical information systems aided traffic accident analysis system case study: city of Afyonkarahisar. Accid Anal Prev. 2008;40(1):174–81. doi:10.1016/j.aap.2007.05.004. [Google Scholar] [PubMed] [CrossRef]
68. Aati K, Houda M, Alotaibi S, Khan AM, Alselami N, Benjeddou O. Analysis of road traffic accidents in dense cities: geotech transport and ArcGIS. Transp Eng. 2024;16:100256. doi:10.1016/j.treng.2024.100256. [Google Scholar] [CrossRef]
Cite This Article
 Copyright © 2025 The Author(s). Published by Tech Science Press.
This work is licensed under a Creative Commons Attribution 4.0 International License , which permits unrestricted use, distribution, and reproduction in any medium, provided the original work is properly cited.
 Downloads
 Citation Tools