
 Submit a Paper
 Propose a Special lssue
 Open Access
ARTICLE

Advancing Sinkhole Susceptibility Mapping in Urbanised Karst Landscapes
Department of Civil Engineering, Faculty of Engineering, Universiti Putra Malaysia, Serdang, 43400, Malaysia
* Corresponding Author: Yan Eng Tan. Email:
(This article belongs to the Special Issue: Innovative Applications and Developments in Geomatics Technology)
Revue Internationale de Géomatique 2025, 34, 777-791. https://doi.org/10.32604/rig.2025.070997
Received 29 July 2025; Accepted 29 September 2025; Issue published 23 October 2025
 View Full Text
 Download PDF
Abstract
Sinkholes, typically associated with karst landscapes, are emerging as significant geohazards in rapidly urbanising regions such as Kuala Lumpur, where human activities like land development, underground infrastructure, and groundwater extraction exacerbate subsurface instability. Despite their destructive potential, sinkholes remain under-monitored in Malaysia due to fragmented data and the lack of predictive spatial tools. This study aimed to develop a web-based, machine learning-driven framework for sinkhole susceptibility mapping to support public awareness, hazard mitigation, and geospatially informed urban planning. The framework was implemented using Google Earth Engine and Google Colab, focusing on Kuala Lumpur and parts of Selangor. Fourteen natural and anthropogenic control factors were derived from remote sensing and government datasets, including topography, lithology, groundwater depth, and proximity to infrastructure. High-and low-susceptibility zones were labelled based on sinkhole inventory and geological stability. Three models, Random Forest (RF), Artificial Neural Network (ANN), and One-Dimensional Convolutional Neural Network (1D CNN) were trained and compared. The RF achieved the highest predictive accuracy but showed signs of overfitting, the ANN produced sharper boundaries between classes, and the 1D CNN, while slightly less accurate, achieved the best ability to distinguish between high-and low-risk areas and generated smoother probability surfaces ideal for visual communication. Constrained by the limited sinkhole inventory and the scarcity of detailed subsurface datasets, this study is positioned as a prototype demonstration of cloud-based machine and deep learning–driven susceptibility mapping rather than a fully generalised model. The 1D CNN model was ultimately deployed in an interactive Google Earth Engine web application featuring toggleable layers and a click function to retrieve local sinkhole case information. This study demonstrates the potential of integrating remote sensing and deep learning for dynamic, interpretable, and publicly accessible urban geohazard mapping in karst-prone areas.Keywords
Sinkholes are subsidence features typically associated with karst terrains, formed through the dissolution of soluble rocks such as limestone [1]. While traditionally considered natural geohazards, increasing evidence points to the growing influence of anthropogenic factors, such as uncontrolled urban expansion, underground construction, and groundwater extraction, in accelerating sinkhole formation, particularly in urban environments [2–4]. These events pose significant risks to infrastructure and public safety, often occurring without warning and resulting in property damage, service disruptions, and in severe cases, casualties [5,6].
Globally, urban karst environments face similar hazards. In Europe, frequent collapses have been documented in Italy and other cities with intensive land use [7]. In Asia, rapid urbanisation and intensive human activities have driven sinkhole risks in China and South Korea [8,9], while excessive groundwater extraction has been identified as a major trigger in Turkey [10]. In the Americas, sinkhole cases have been reported in Mexico and Kentucky, USA [11,12]. These examples demonstrate that sinkholes are a widespread global geohazard influenced by both natural processes and anthropogenic pressures. While susceptibility mapping has been attempted in many of these contexts, traditional approaches have largely relied on GIS-or Multi-Criteria Decision-Making (MCDM) frameworks, which are often limited in resolution, scalability, and adaptability. Although recent studies have introduced machine learning and deep learning models, their application remains uneven, and cloud-native, publicly accessible frameworks are still rare.
Malaysia is highly susceptible to sinkhole formation due to the widespread presence of limestone across regions such as the Kinta Valley, Langkawi, Batu Caves, and Kuala Lumpur. The capital and surrounding Selangor districts sit atop karstified formations that have been further stressed by decades of mining, construction, and infrastructural development. While major karst features are visually identifiable, the subsurface complexity remains largely unmapped, complicating hazard assessments. Urban centres like Bandar Sunway and parts of the Klang Valley, once mining zones, have since been transformed into densely populated areas, further intensifying the risk of collapse due to loading and subsurface instability [13].
The Kinta Valley in Perak, one of Malaysia’s most extensively documented karst regions, has recorded over 250 sinkholes of varying sizes prior to 2012 [14], underscoring the scale and persistence of the issue. In contrast, Kuala Lumpur lacks systematic sinkhole records, yet major incidents such as the 2014 Jalan Pudu collapse and the fatal 2024 sinkhole at Jalan Masjid India highlight the severity of risks in urbanised limestone areas. These incidents reflect a broader issue of poorly monitored subsurface risks in fast-developing karst urban areas. Current approaches, such as the karst susceptibility map used by Kuala Lumpur City Hall (DBKL) [15], are largely static, relying heavily on lithological boundaries and offering limited spatial detail. Moreover, Malaysia lacks a centralised, open-access geospatial platform for recording and analysing sinkhole events. Most records are held privately or within government agencies and are not shared publicly, restricting hazard assessment and awareness efforts. In addition to data access constraints, existing susceptibility maps remain methodologically limited, as they rely on static GIS or expert-driven weighting approaches that capture only a subset of the relevant factors and lack the adaptability for dynamic updates.
Manual mapping methods remain the norm, despite their limitations in accuracy and scalability. As urban development pressures mount, a more robust and dynamic approach to sinkhole susceptibility mapping is urgently needed. Such an approach should integrate both natural and anthropogenic factors and allows for periodic updates based on newly acquired data. Current approaches in Malaysia are predominantly expert-driven and lithology-focused, lacking dynamic integration of anthropogenic, geospatial, and subsurface factors needed for scalable urban hazard assessment. This study responds to this need by aiming to develop a machine learning-driven sinkhole susceptibility mapping framework for Kuala Lumpur and adjacent Selangor areas, with the objective of generating a publicly accessible, web-based map to support geohazard awareness, urban planning, and risk mitigation. By integrating both publicly available and requested datasets, this research applies three modelling approaches: Random Forest (RF), Artificial Neural Network (ANN), and One-Dimensional Convolutional Neural Network (1D CNN). These models were selected for their proven performance in geospatial classification tasks, ability to capture complex non-linear relationships, and scalability in data-driven hazard mapping. These models are implemented using Google Earth Engine and Google Colab, enabling efficient processing and scalable application.
The final susceptibility map is deployed as a web-based interactive platform. Although not real-time, the platform supports periodic updates, offering a transparent and reproducible solution for urban geohazard communication and planning. This research contributes to the advancement of automated geohazard risk assessment in karst landscapes, moving beyond conventional geology-only methods toward a more inclusive, data-driven, and publicly accessible framework.
The study was conducted in Kuala Lumpur, Malaysia, and its adjacent regions in Selangor, covering approximately 800 km2. This region is underlain by the Kuala Lumpur Limestone Formation (Fig. 1), a deeply karstified carbonate bedrock alongside the Kenny Hill Formation, granitic intrusions, and fault zones [16–19]. Rapid urbanisation, historical mining, and subsurface infrastructure have increased the susceptibility to sinkhole hazards, particularly where anthropogenic activity intersects with soluble lithology. The area experiences a tropical monsoon climate with high rainfall (~2800 mm annually), which further accelerates karst development, making the city a suitable case study for advanced geospatial hazard assessment (Fig. 2).
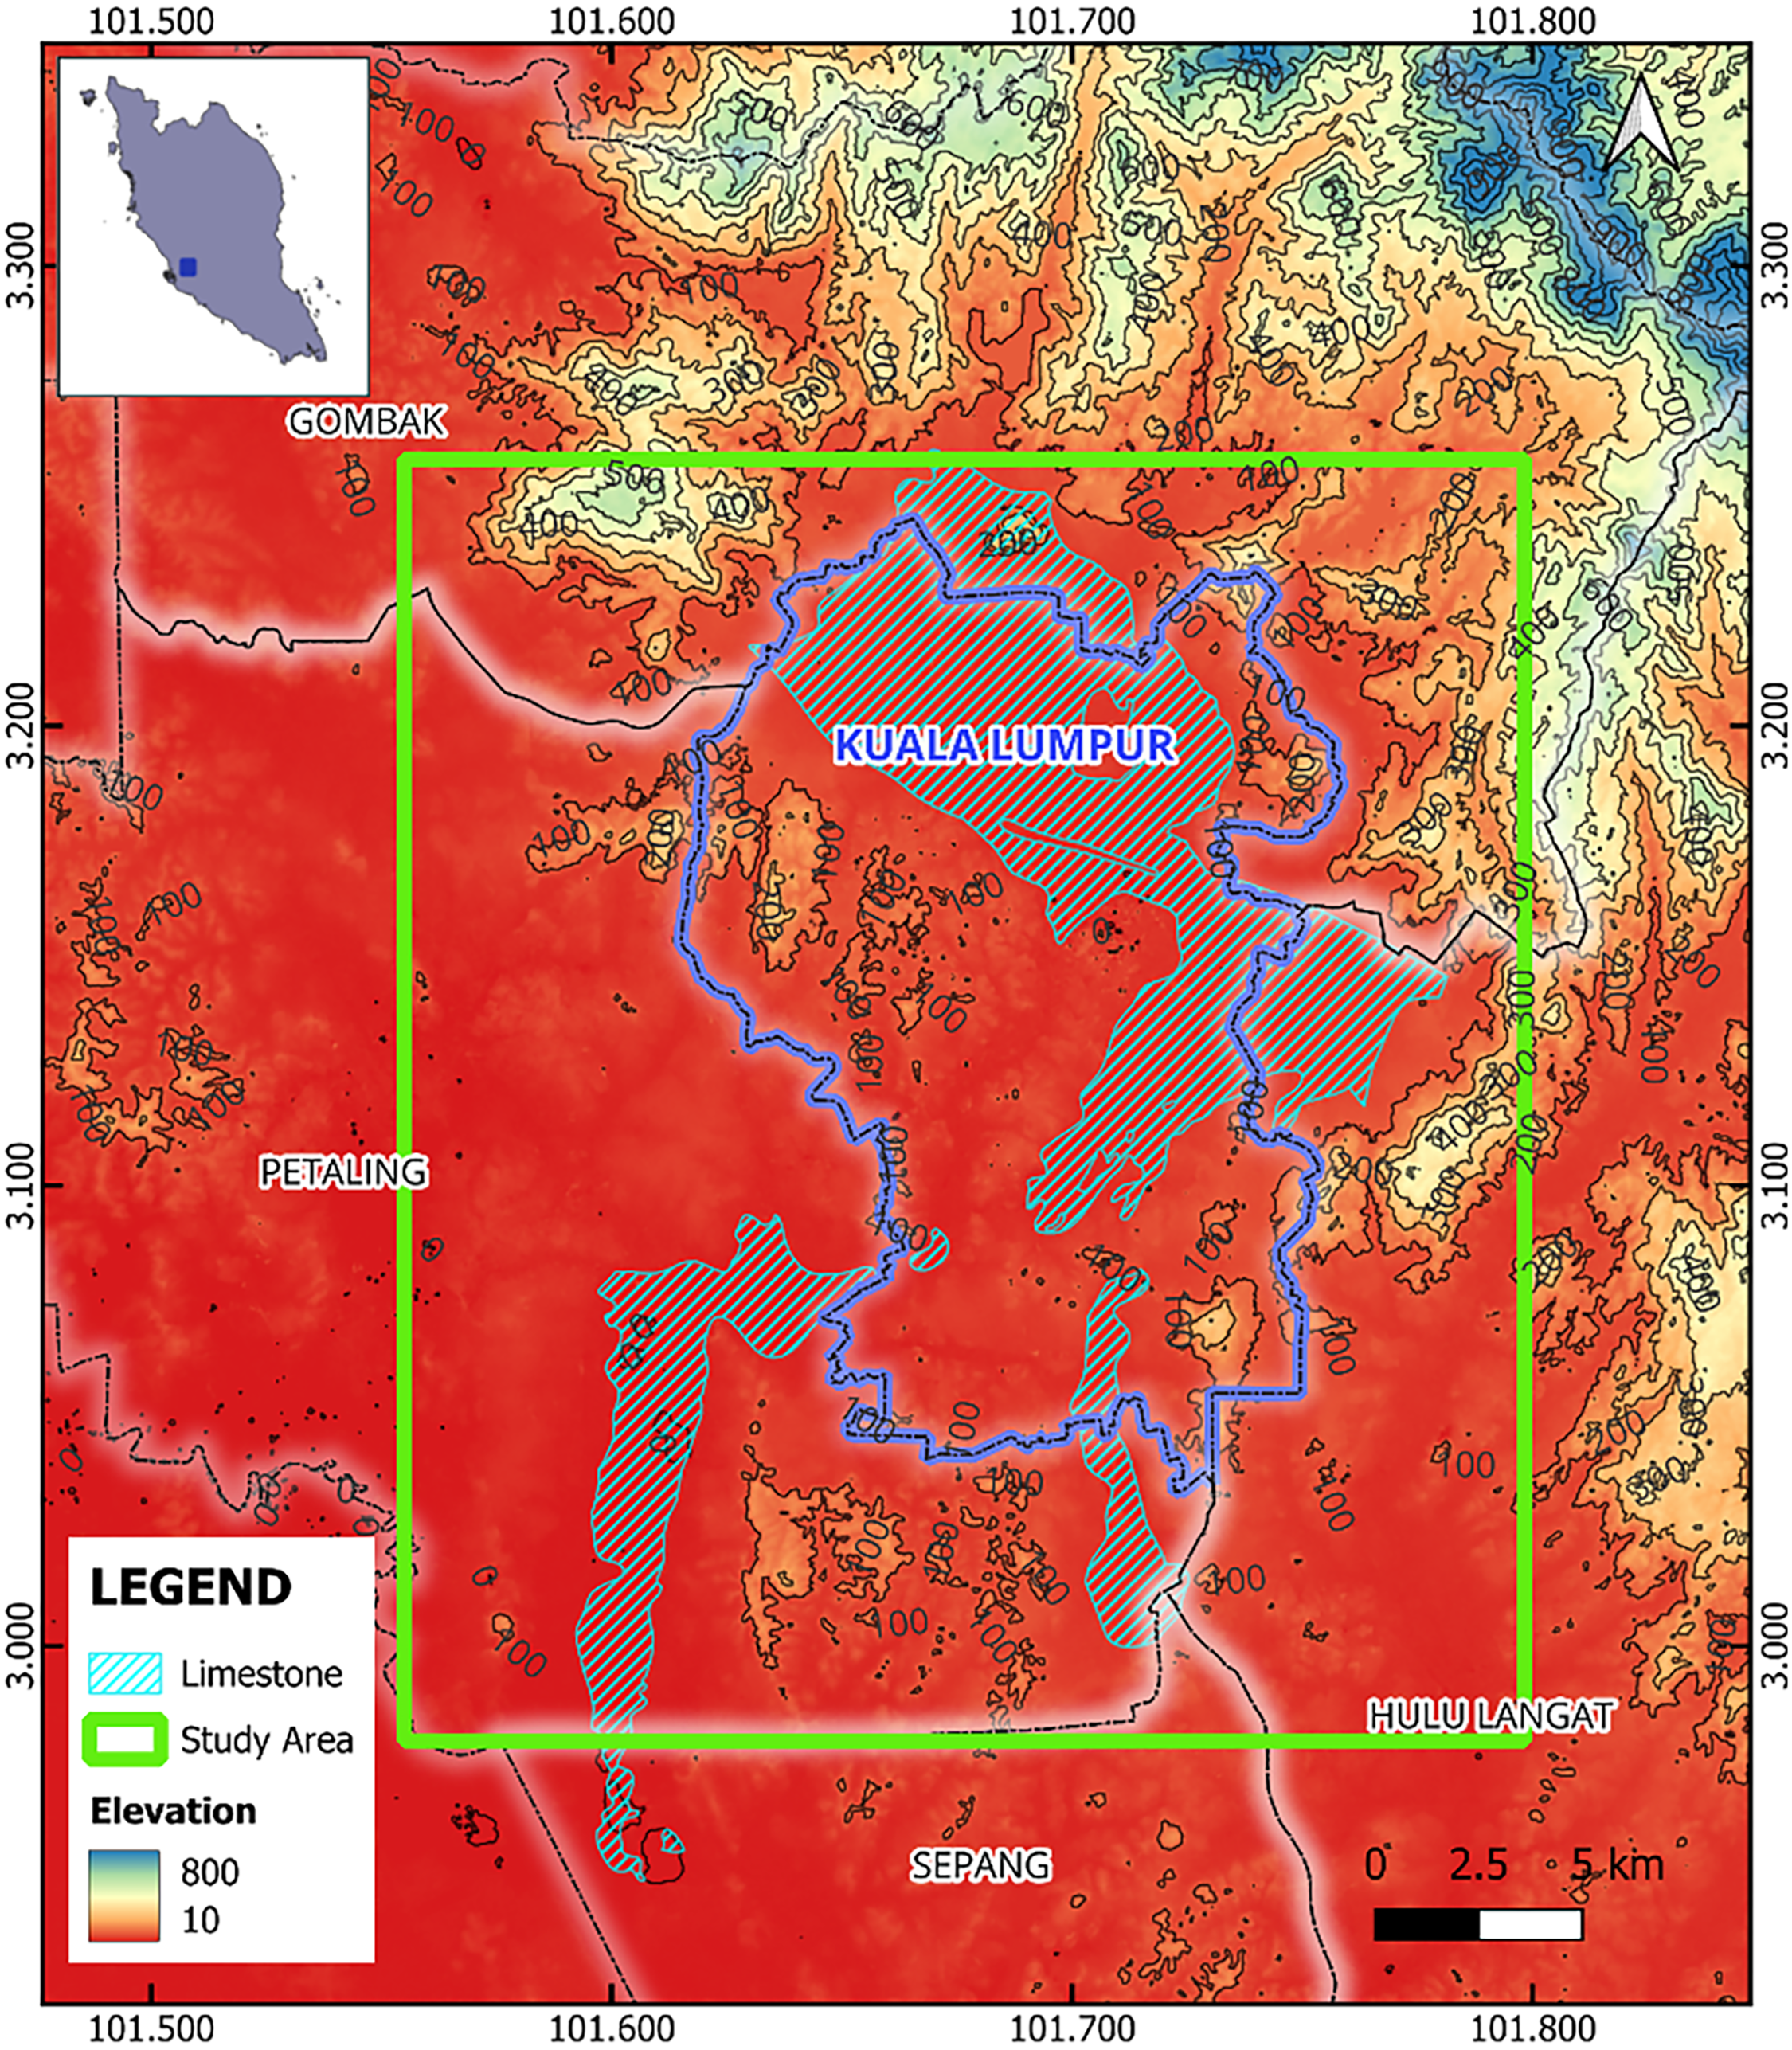
Figure 1: Study area and surface karst terrain shown on an elevation map of Kuala Lumpur and parts of Selangor
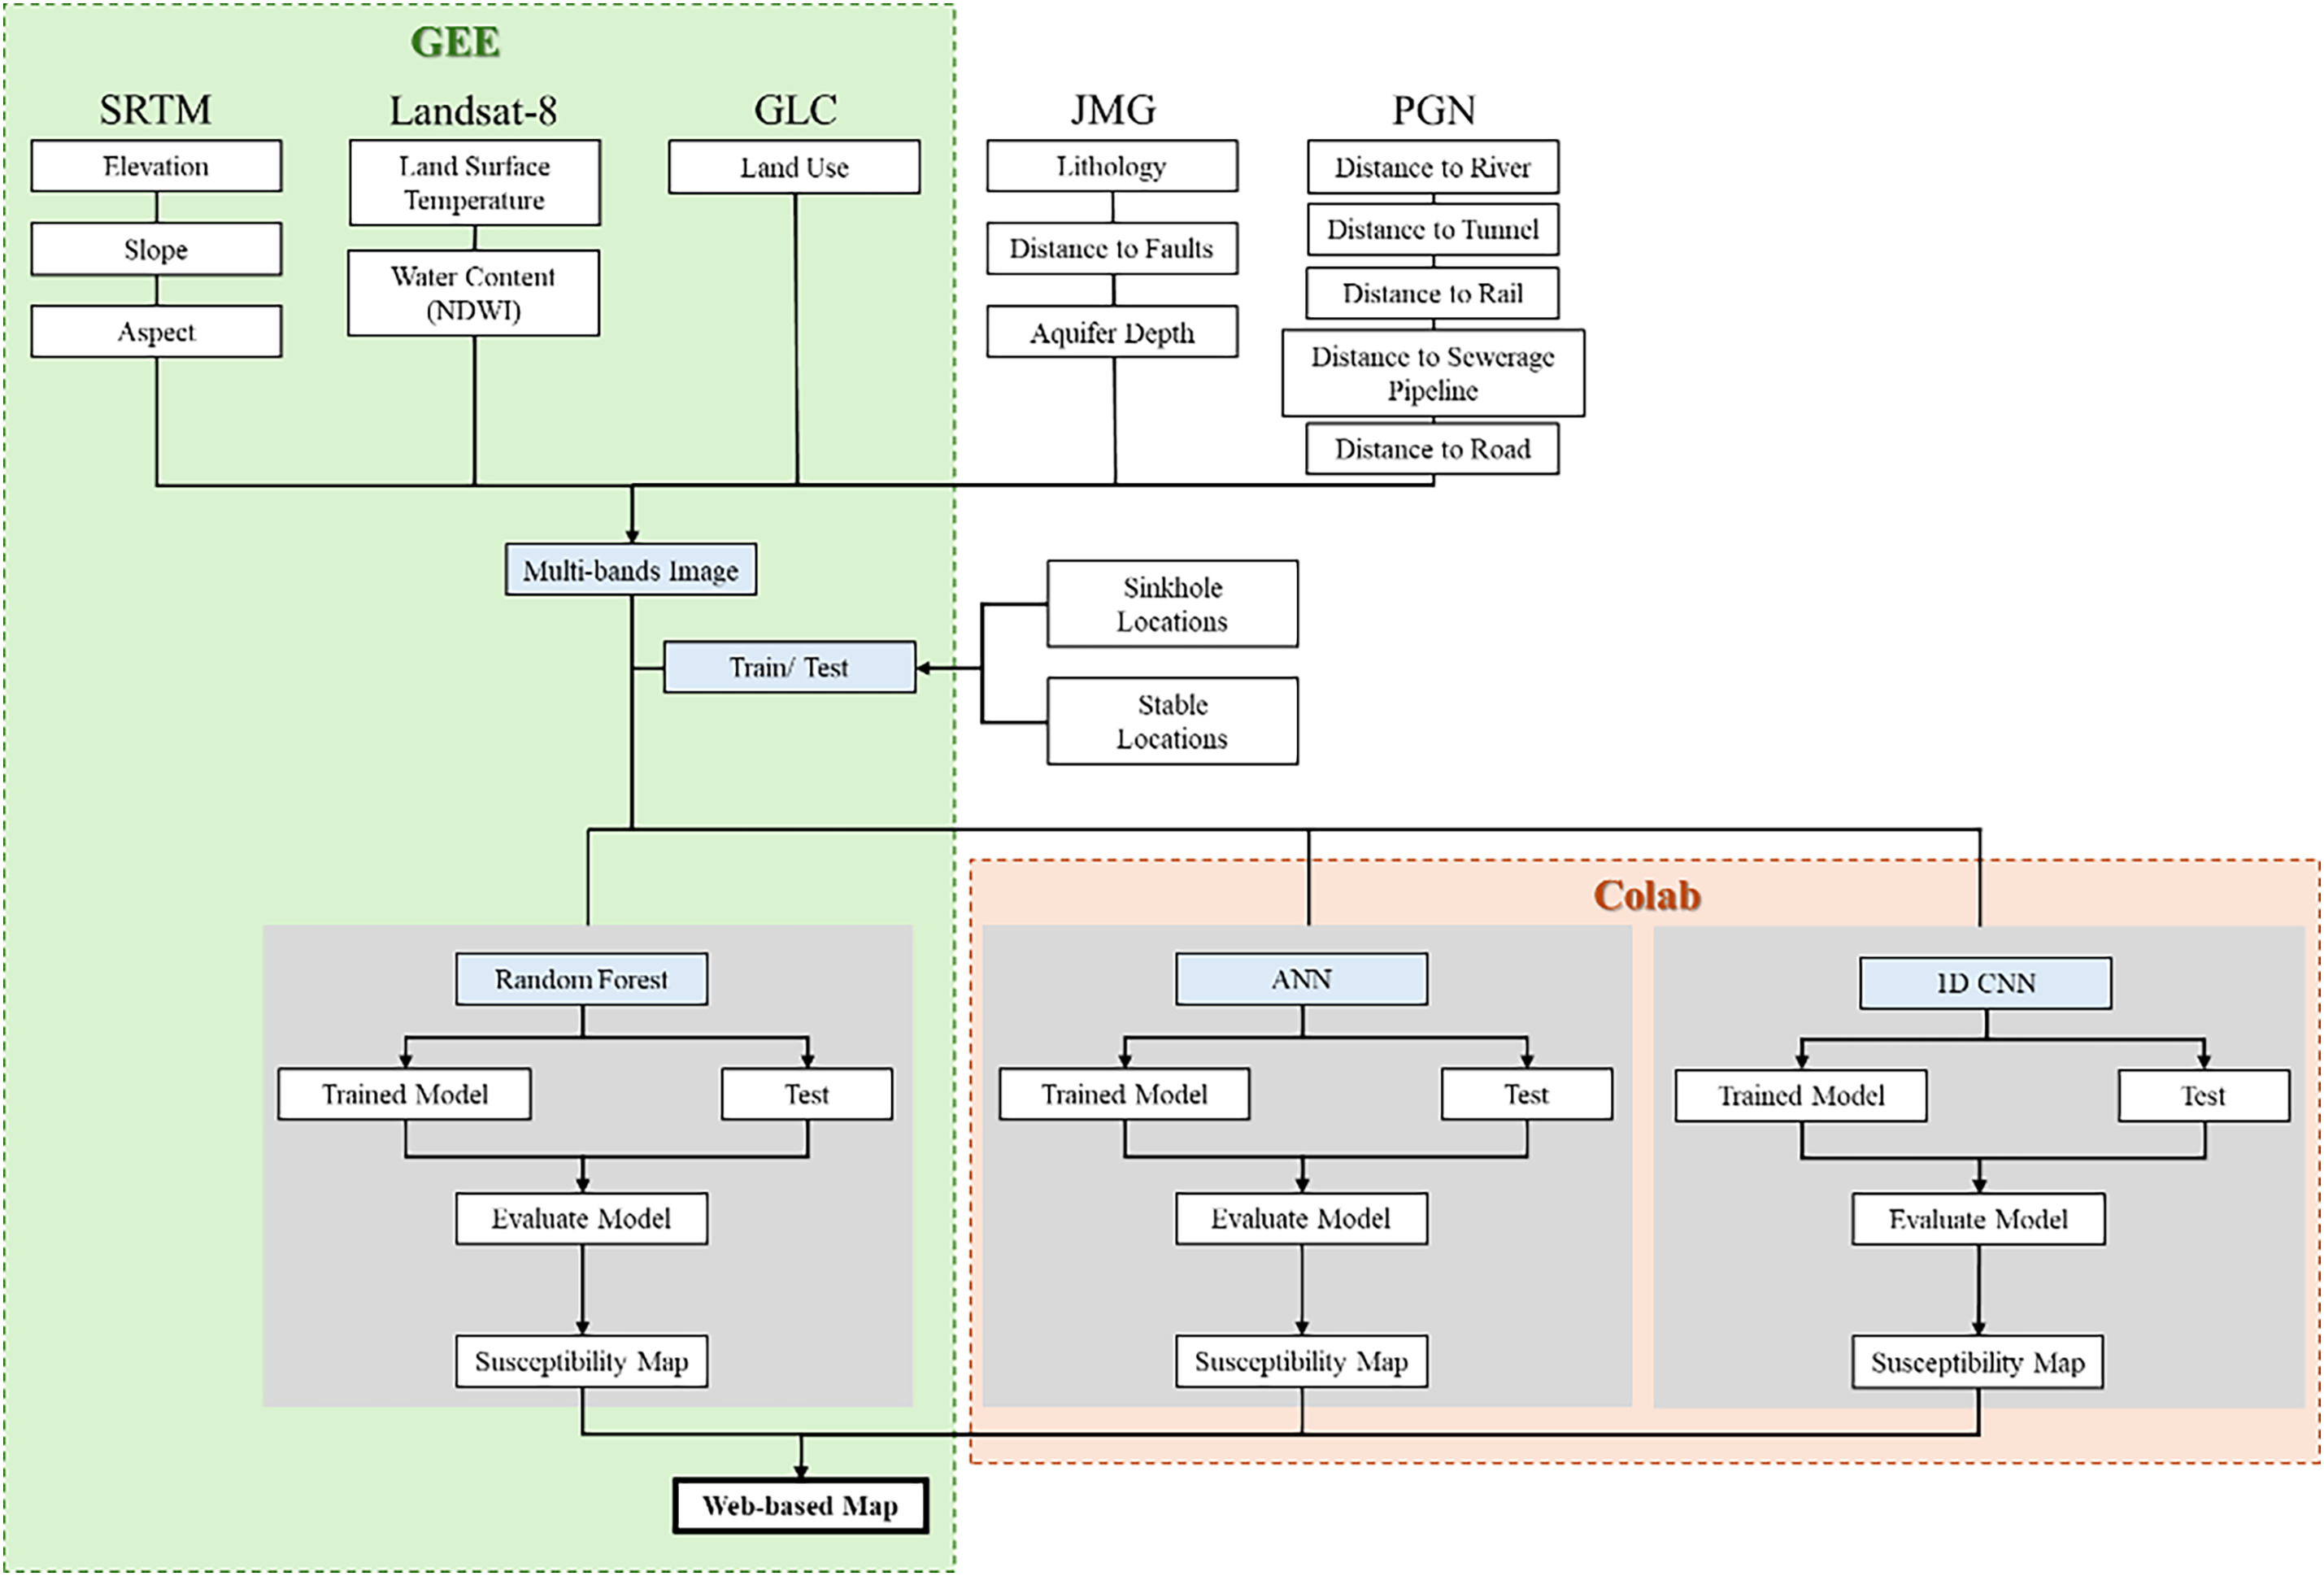
Figure 2: General workflow for sinkhole susceptibility mapping and web-based deployment using GEE and Colab
2.2 Data Collection and Preprocessing
Data for this study were sourced from a combination of national authorities and global open datasets (Table 1). All spatial layers were processed in Google Earth Engine (GEE) and resampled to a standard 30 m resolution to ensure compatibility and optimise computational efficiency.

2.3 Control Factor and Sample Development
Control factors were selected based on known physical and anthropogenic influences on sinkhole formation. Fourteen predictor layers were derived and integrated into the model (Fig. 3). Topographic features such as elevation, slope, and aspect were calculated from the Shuttle Radar Topography Mission (SRTM) DEM. Landsat-8 imagery was used to compute the Normalised Difference Water Index (NDWI) and land surface temperature (LST), proxies for soil moisture and thermal anomalies.
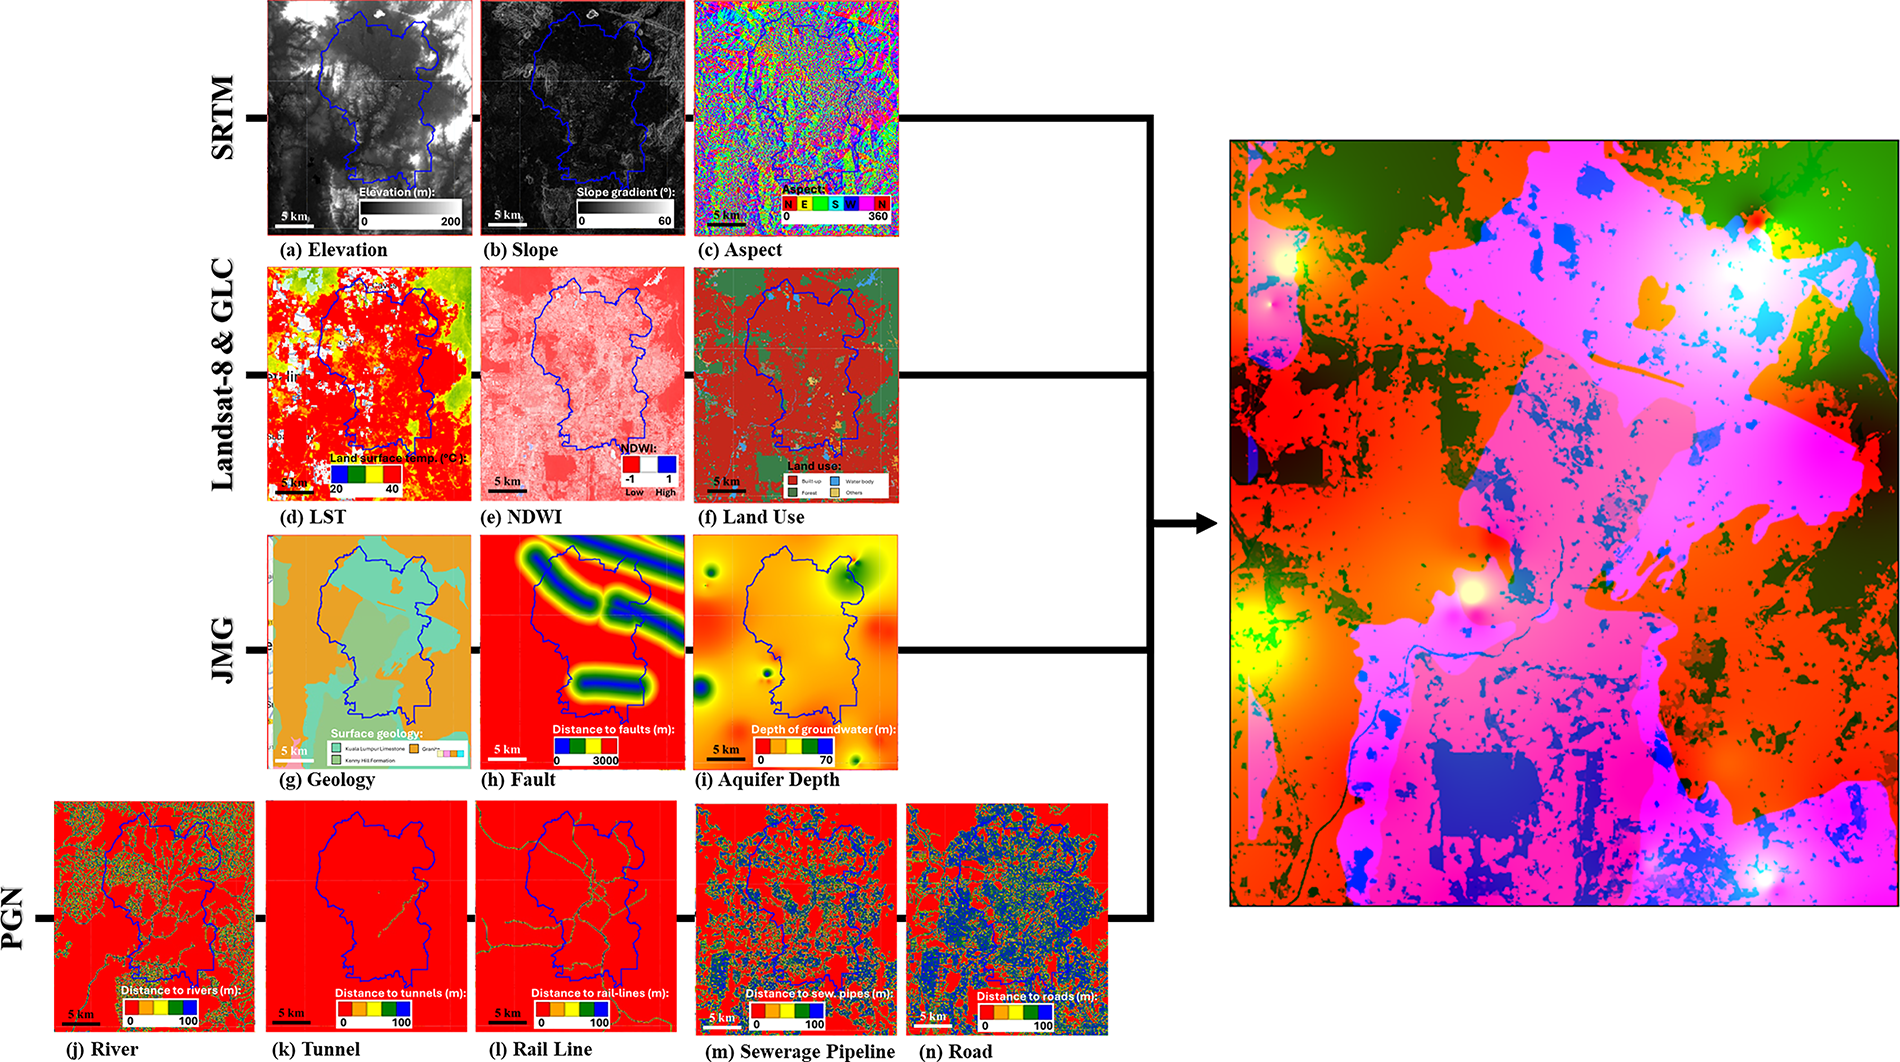
Figure 3: The fourteen control factors incorporated in the sinkhole susceptibility modelling, each supported by findings in sinkhole-related literature
Geological inputs included a lithology raster constructed from digitised maps, categorising carbonate, clastic, and igneous formations. Fault proximity was calculated using a 3 km buffer, reflecting the potential spatial influence of regional tectonic features on subsurface dissolution [20]. Groundwater aquifer depth was interpolated from well log data using Inverse Distance Weighting (IDW).
Anthropogenic layers, including road, rail, tunnel, sewerage, and pipeline networks, were buffered by 100 m to account for the influence of ground loading, excavation, and leakage-induced soil erosion [9]. Distance-to-river was included to capture natural hydrological instability near channel banks.
Sinkhole inventory points provided by the Department of Mineral and Geoscience Malaysia (JMG) were buffered at 30 m, aligning with the 30 m spatial resolution of the remote sensing imagery used in this study, to delineate high-susceptibility training zones. These represent areas most susceptible to ground collapse based on prior reported events. Low-susceptibility samples were manually selected from geologically stable zones devoid of conditioning factors. The sinkhole inventory available for this study comprised fewer than 35 documented cases within the study area. This limited sample size constrains the training dataset for machine learning models and may affect their generalisation capability. For deep learning models, this limitation may also reduce training stability, as small datasets increase sensitivity to random initialisation and partitioning. To mitigate this, low-susceptibility samples were carefully selected and the analysis was geographically constrained to ensure an appropriate balance between sample size and study area extent.
All control factors were stacked into a multi-band image using GEE, where each pixel contained 14 input features. The corresponding sample points were used to extract pixel values, forming a tabular training dataset. A standard 80/20 split was applied to separate training and validation samples.
To ensure robustness and comparative analysis, three classification models were employed: RF, ANN, and 1D CNN. Each model was selected for its distinct strengths in handling geospatial tabular data, ranging from ensemble decision trees to neural architectures optimised for structured inputs. RF was executed entirely in GEE, while ANN and 1D CNN were trained in Google Colab.
RF was trained on the stacked GEE image using 100 decision trees. Each pixel was classified into binary susceptibility categories. Output was converted into continuous probabilities (0–1) for enhanced visual interpretation. RF was selected due to its robustness, non-parametric nature, and prior success in geohazard applications [9,21,22].
ANN modelling was trained using features and stratified samples exported from GEE to Google Colab. The architecture consisted of two fully connected layers with ReLU (Rectified Linear Unit) activation, which introduces non-linearity by converting all negative values to zero while retaining positive values. A dropout layer was added to randomly deactivate a portion of neurons during training, reducing overfitting. The final layer was a sigmoid output unit, which maps predictions to a probability between 0 and 1, reflecting the likelihood of sinkhole susceptibility. ANNs have been widely applied in environmental and geospatial modelling due to their flexibility in learning non-linear relationships from multivariate data [23].
The 1D CNN was selected for its suitability with structured tabular inputs, as it applies convolution across a single axis, making it appropriate for data where each input represents a feature vector of a single spatial unit (e.g., a pixel). The architecture included two convolutional layers, max pooling for downsampling, dropout for regulation, and a dense layer, concluding with a softmax output. Softmax converts the output values into a probability distribution across classes, enabling probabilistic classification. Input samples were reshaped into [samples, features, 1] format. This approach avoids computational overhead and overfitting risks while retaining spatial interpretability [24]. 1D CNNs offer computational efficiency and are well-suited for geospatial and environmental classification tasks using vectorised inputs [24–26].
All models were evaluated using overall accuracy, Cohen’s Kappa coefficient, and the Area Under the Receiver Operating Characteristic Curve (AUC–ROC). A standard 80/20 split was applied to separate training and testing samples for all models, ensuring consistency across evaluations. Accuracy measures the proportion of correctly classified instances among all samples, while Kappa quantifies the agreement between predicted and actual classes after correcting for chance agreement [27]. AUC–ROC, a threshold-independent metric, reflects the model’s ability to distinguish between high and low susceptibility classes across all possible classification thresholds. It is especially suitable for probabilistic outputs because it evaluates how well the model distinguishes between classes, without relying on a single cut-off value. This offers a more accurate reflection of predictive capability than Overall Accuracy or Kappa, which require binarisation and may not fully capture the performance of continuous probability-based models such as those used in this study. Among all metrics, AUC–ROC was adopted as the primary evaluation measure due to its threshold-independence and robustness to sample imbalance. Accuracy and Kappa were used as complementary indicators to support classification performance analysis. Performance differences were also assessed qualitatively by comparing predicted high-susceptibility zones with known sinkhole occurrences.
The final susceptibility map, generated by the highest-performing model, was published via a web application using Google Earth Engine’s App interface. This interactive platform includes zooming, layer toggles, and a click function that retrieves information such as district, subdistrict, and the number of recorded sinkhole cases. The application is openly available online and requires no login, offering intuitive access for both expert and non-expert users. While not real-time, the system is designed to support periodic updates based on the availability of new data, including updated static layers from government agencies and automatically refreshed remote sensing inputs directly integrated from GEE. Visual cues, such as colour-coded susceptibility zones and clickable map elements, help communicate risk levels in a clear and accessible way, even to non-specialist audiences.
3.1 Susceptibility Mapping Outputs
The three models produced distinct susceptibility patterns, with 1D CNN offering the smoothest and most interpretable outputs. Three supervised classification models: Random Forest (RF), Artificial Neural Network (ANN), and One-Dimensional Convolutional Neural Network (1D CNN) were used to generate sinkhole susceptibility maps across Kuala Lumpur and adjacent Selangor. Each model produced pixel-wise probabilistic outputs ranging from 0 (low susceptibility) to 1 (high susceptibility) using identical 14-band composite geospatial inputs.
The RF model produced a somewhat patchy map with susceptibility values largely ranging from 0.2 to 0.9 (Fig. 4). High-risk zones (red) were spatially correlated with fault proximity, utility corridors, and lower elevations. RF predictions showed generalised patterns but also included fragmented high-risk zones near known sinkholes (darker red).
Figure 4: Sinkhole susceptibility map generated using the RF model. Darker red indicates areas with the highest susceptibility and known sinkhole concentrations, while darker green represents low-risk zones with minimal influence from control factors
ANN produced more polarised outputs (Fig. 5), classifying susceptibility values with sharper boundaries and more frequent extremes (values < 0.1 or > 0.9). High-susceptibility predictions aligned with urban corridors, particularly road and pipeline networks.
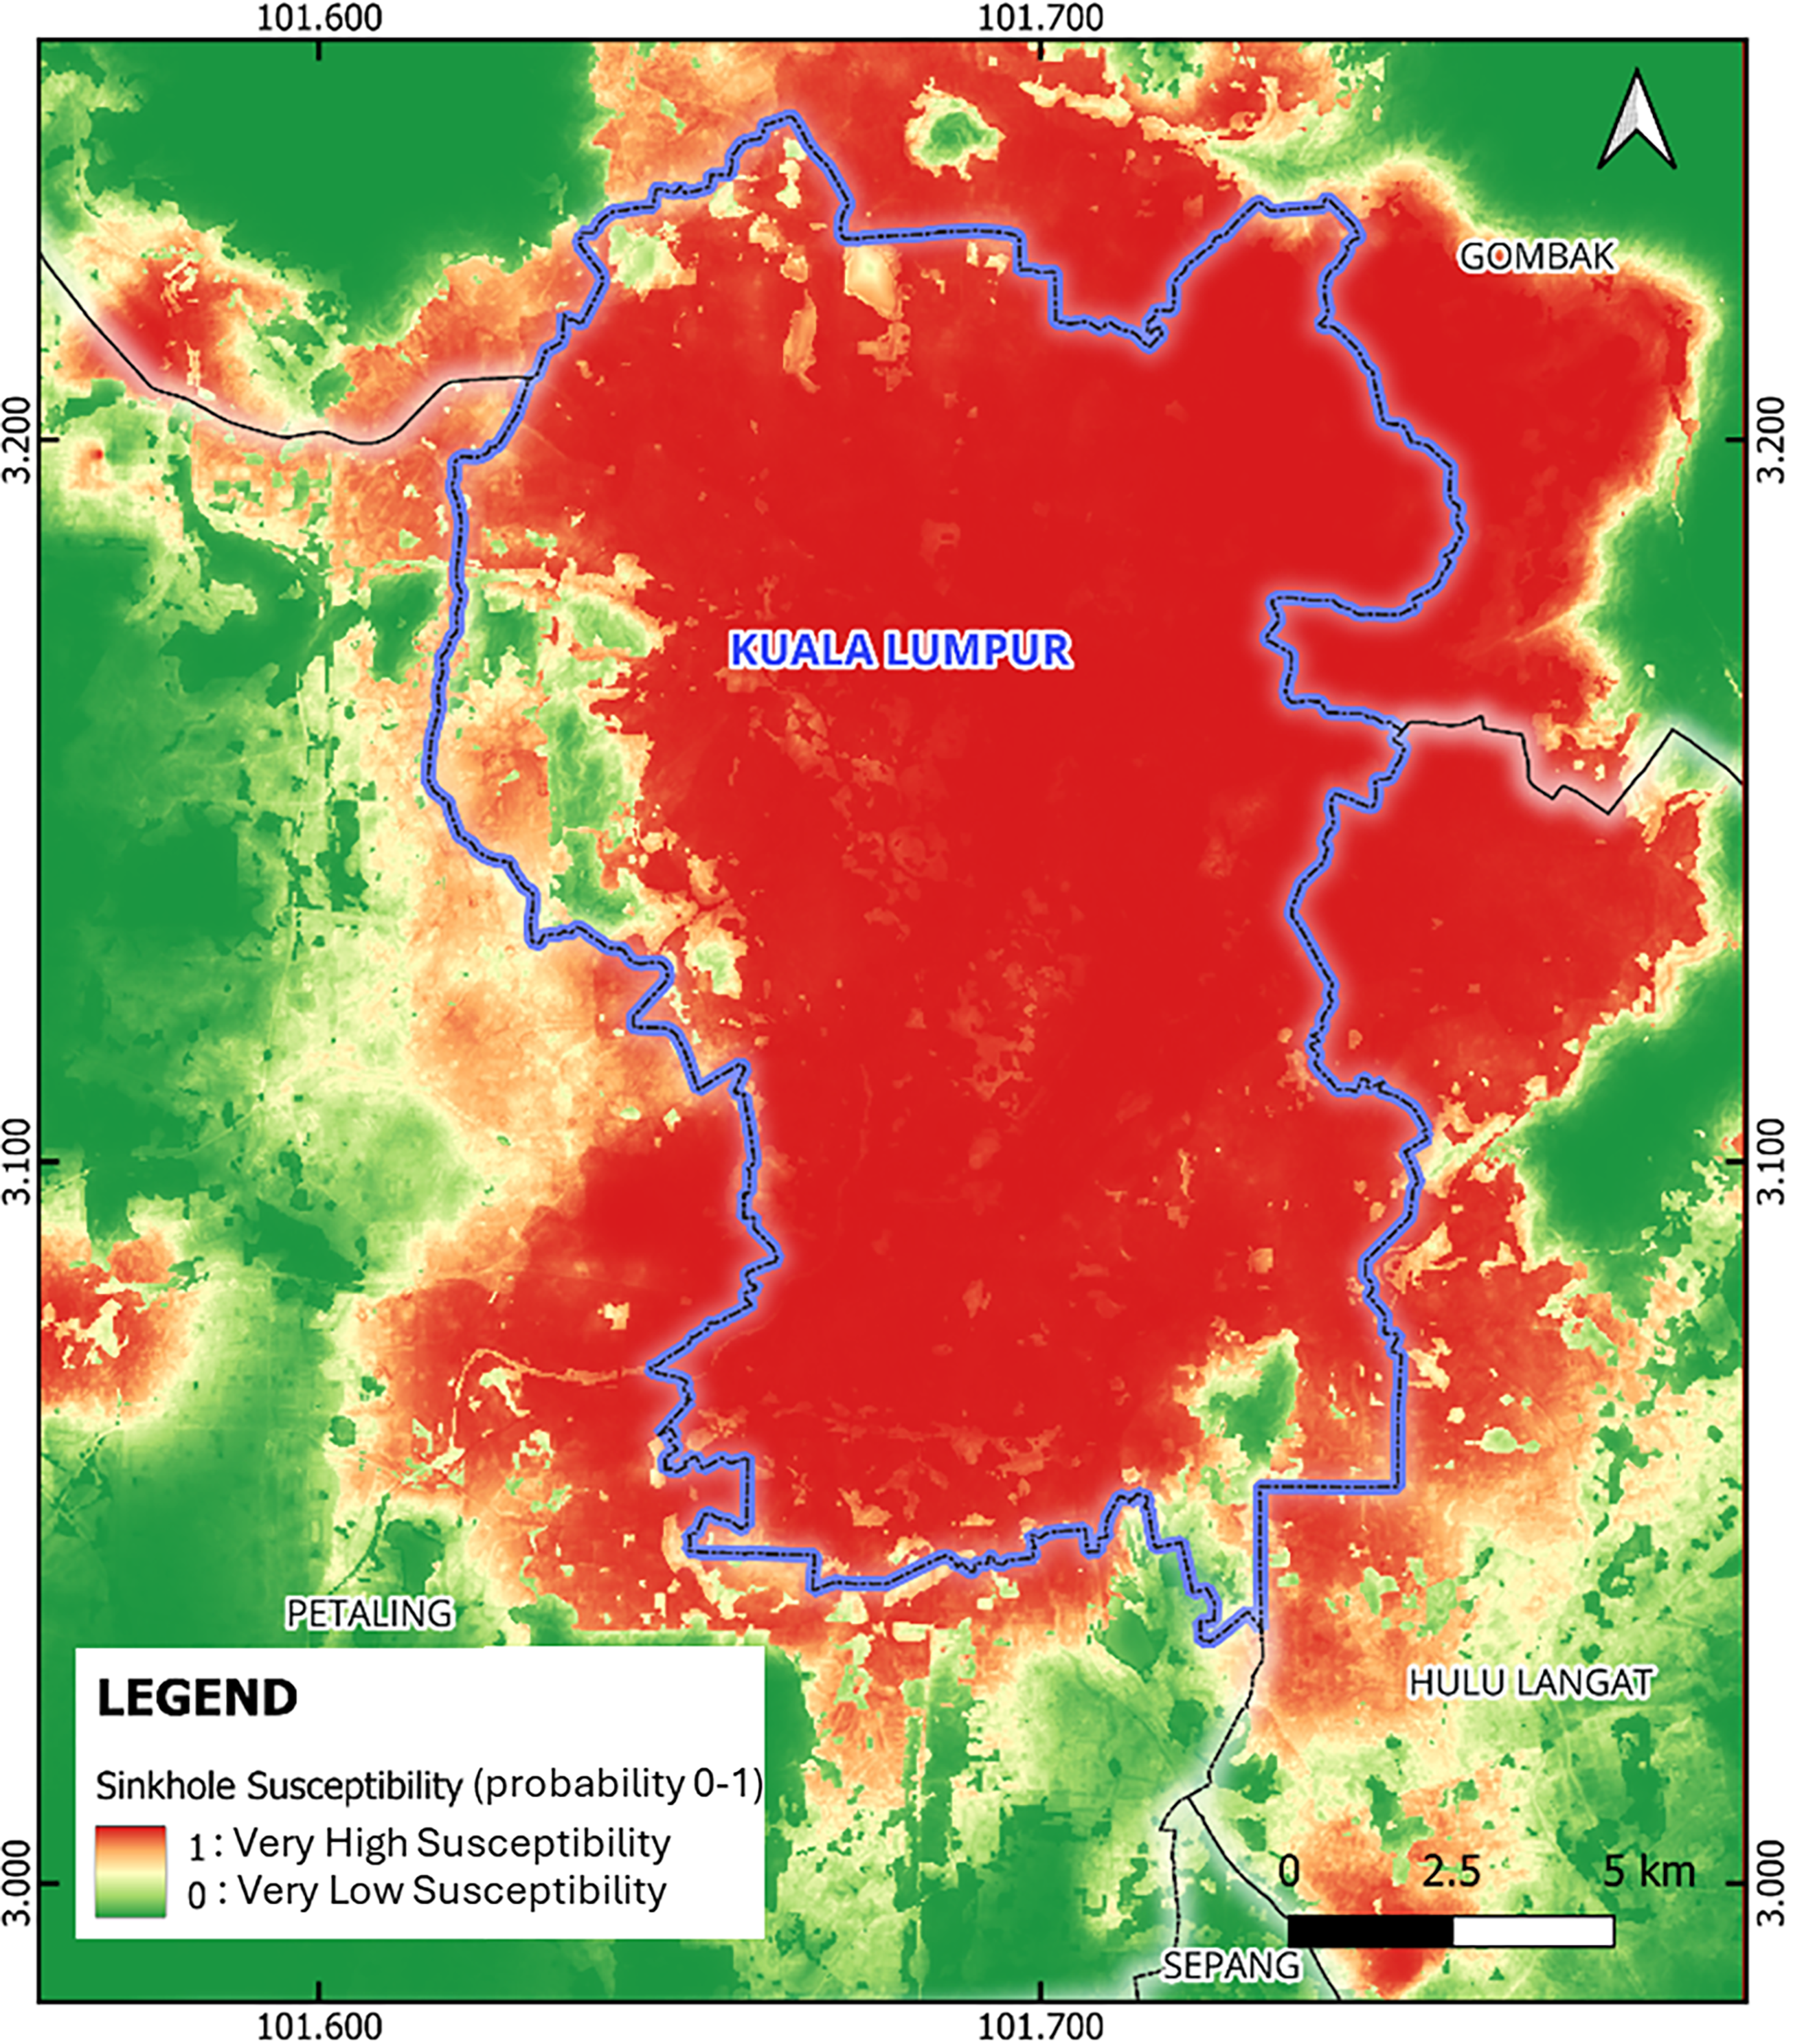
Figure 5: ANN-derived sinkhole susceptibility map, showing sharper contrast in predicted risk levels, particularly concentrated in urban areas
The 1D CNN provided a smoother output, with susceptibility values typically between 0.2 and 0.7 (Fig. 6). Its predictions revealed a gradual gradient in susceptibility transitions, making it more suitable for visual interpretation and public communication.
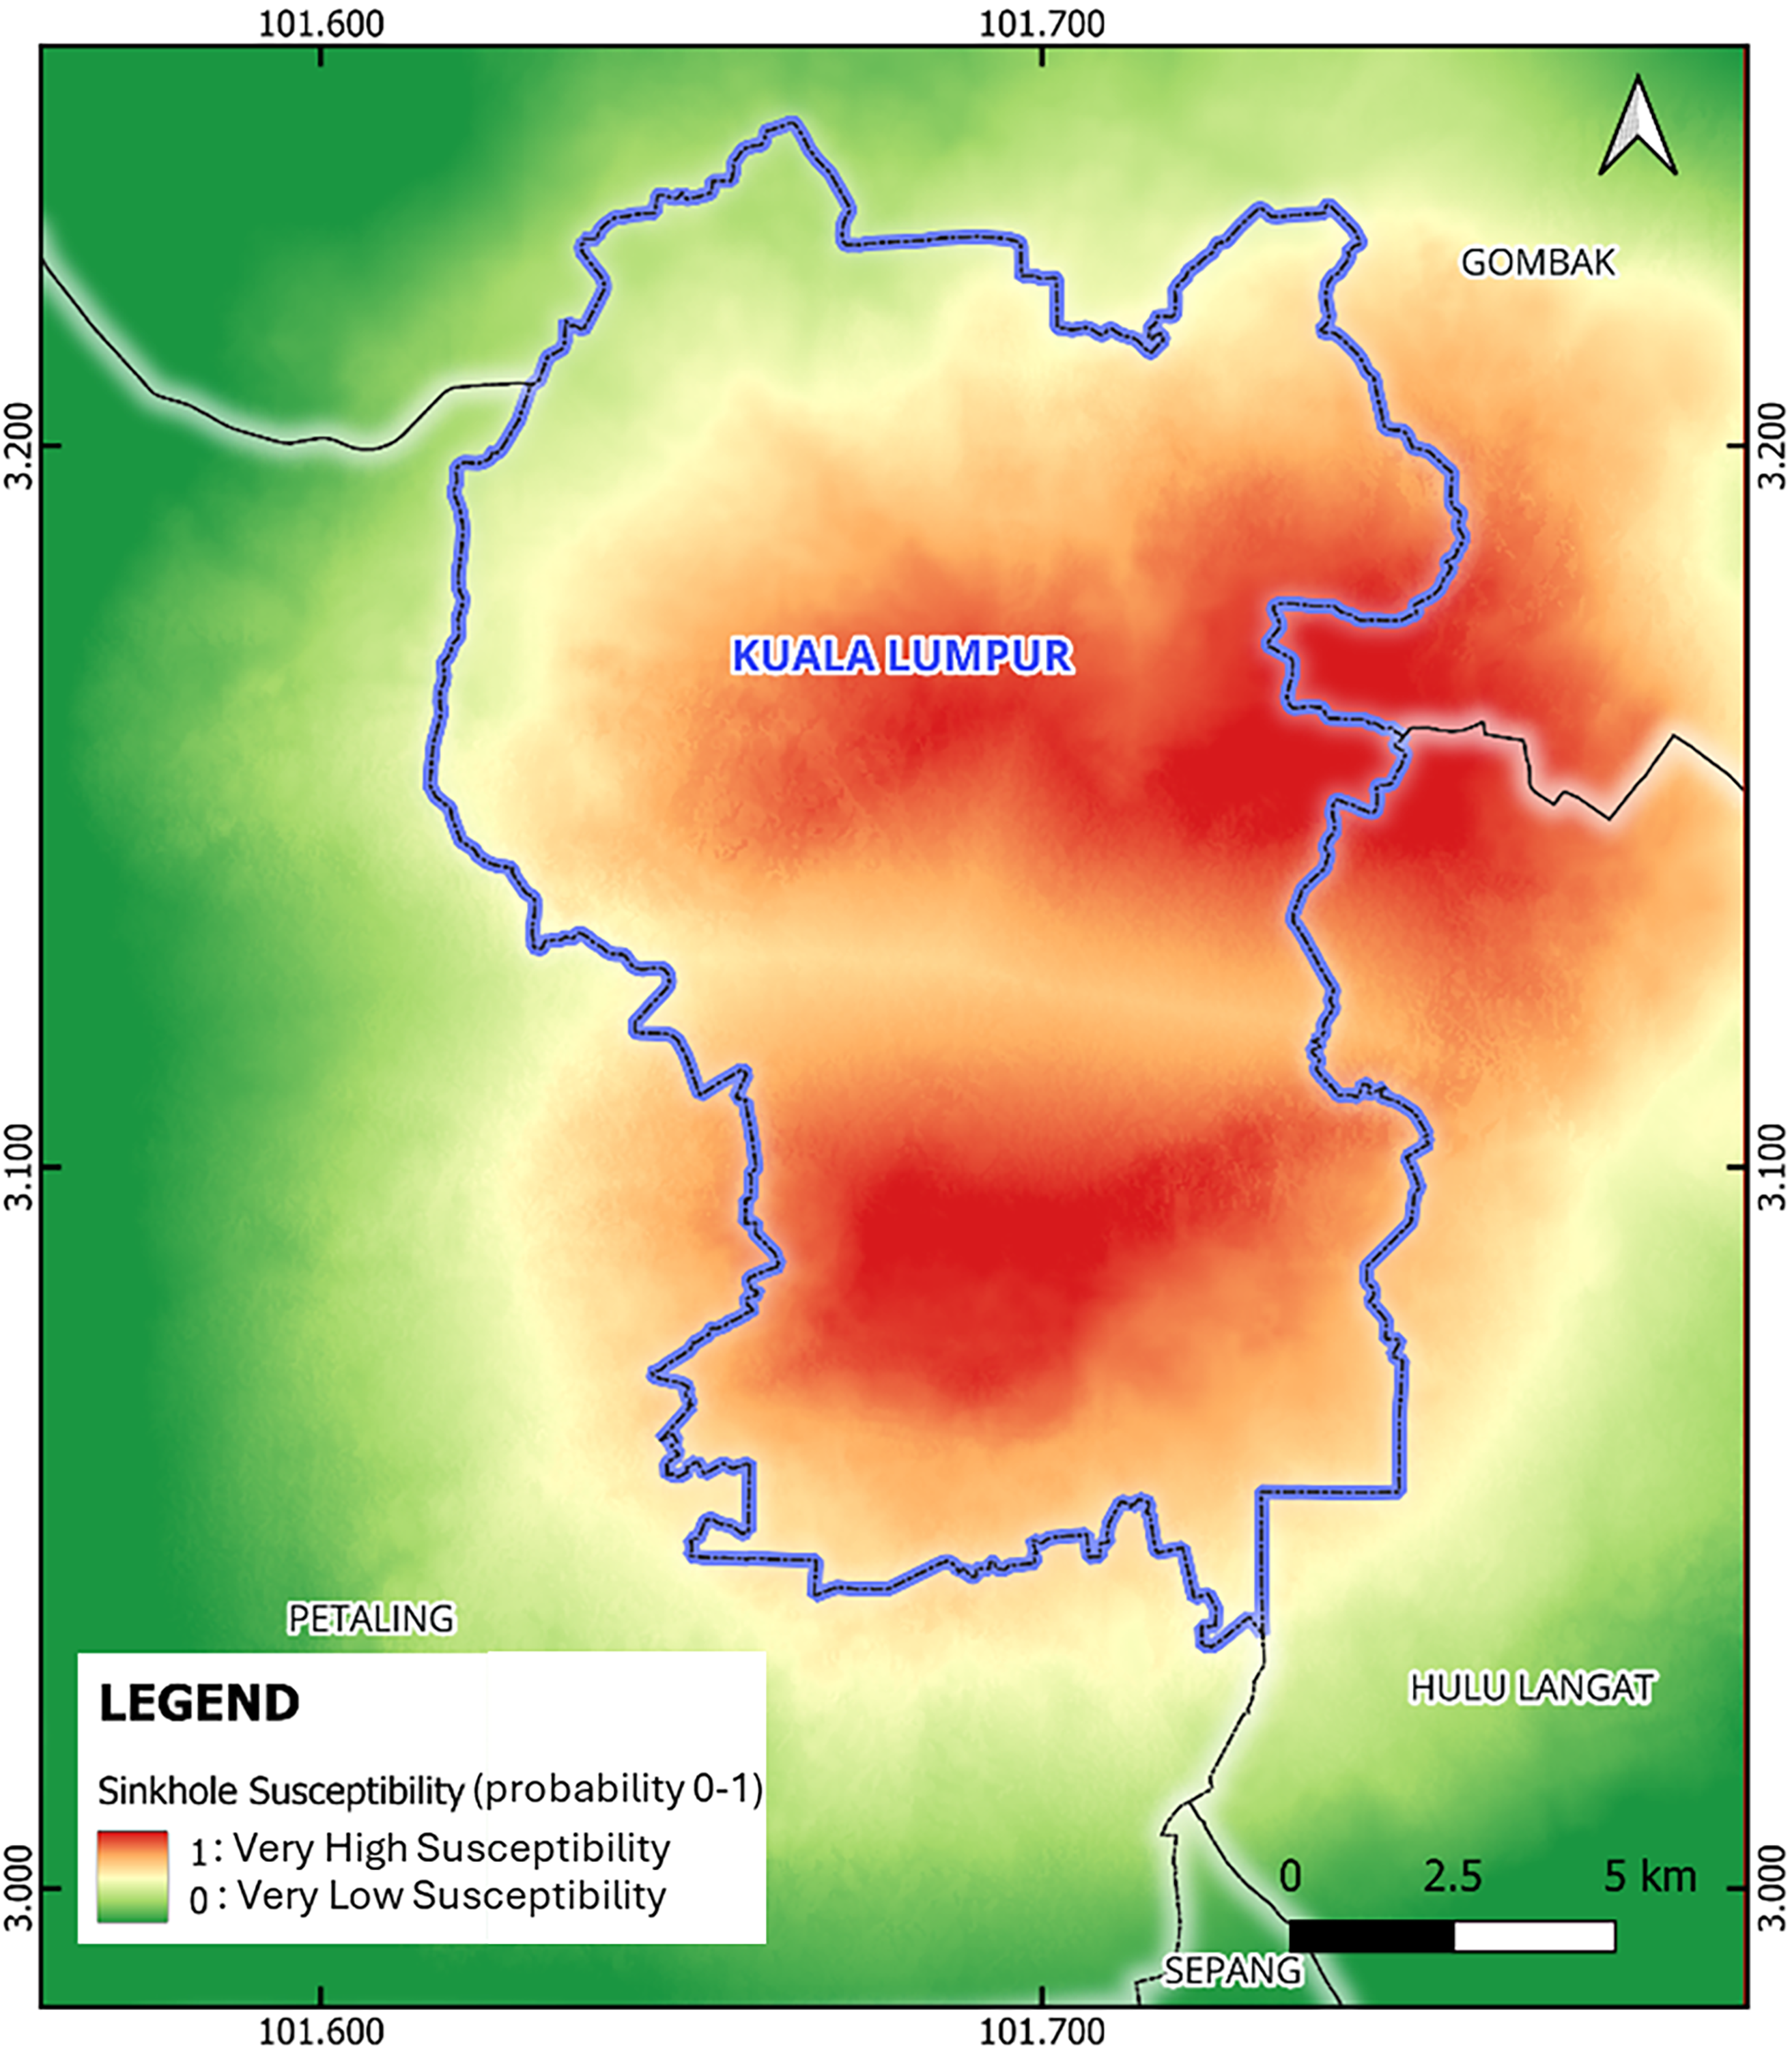
Figure 6: Sinkhole susceptibility map generated by the 1D CNN model, illustrating smoother and more continuous gradient transitions
Model differences stem from architectural characteristics. RF uses independent decision trees with no spatial smoothing, resulting in patchy maps. ANN classifies each pixel independently and often overstates binary boundaries due to the absence of pooling layers. In contrast, the 1D CNN’s convolution and pooling layers reduce noise and create spatially interpretable gradients.
3.2 Quantitative Model Performance
Despite lower accuracy, the 1D CNN achieved strong AUC–ROC scores and was best suited for probabilistic interpretation and deployment (Table 2). Model performance was assessed using withheld test samples via accuracy, Cohen’s Kappa coefficient, and the Area Under the ROC Curve (AUC–ROC). Although accuracy and Kappa remain widely used for classification, AUC was adopted as the primary evaluation metric due to its threshold-independence and robustness with small sample sizes.
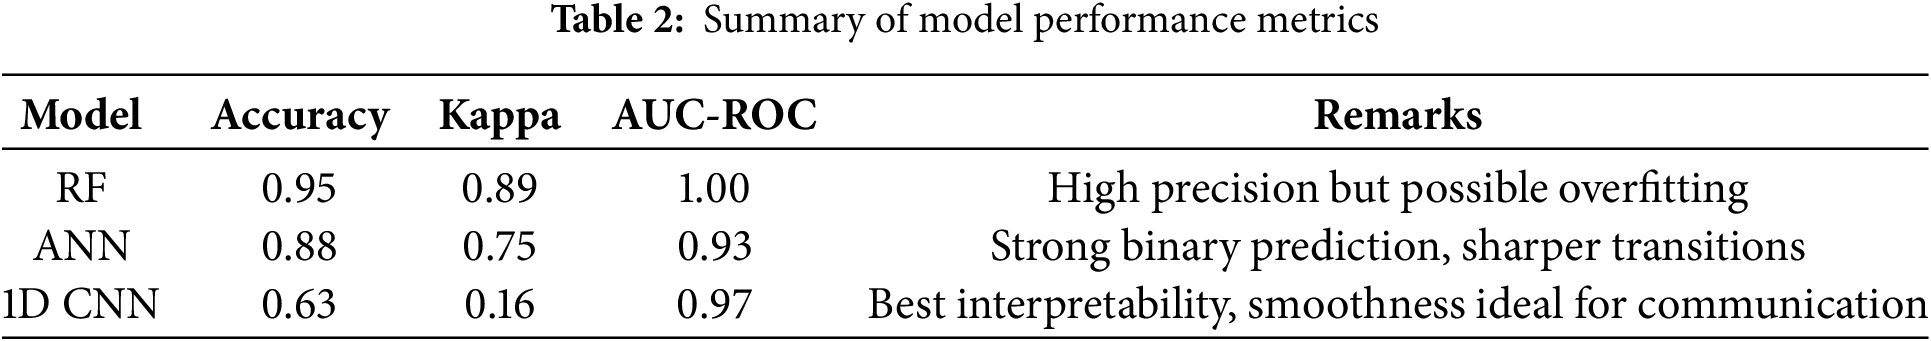
Among the three models, RF achieved the highest overall accuracy (0.95), Kappa (0.89), and a perfect AUC (1.00). However, this near-perfect performance on a small independent test set raises concerns of potential overfitting. To assess robustness, RF was retrained with different random seeds, resulting in accuracy between 0.90–0.95 (mean 0.93, standard deviation 0.02) and Kappa 0.80–0.89. The ANN model also performed well, with sharp binary classification, but produced more polarised outputs. In contrast, the 1D CNN yielded lower accuracy and Kappa. Despite lower threshold-based metrics, the 1D CNN model achieved a high AUC–ROC (0.97), indicating strong class separation. Its probabilistic outputs provided gradual transitions in susceptibility, aligning better with real-world geohazard dynamics (Fig. 7).
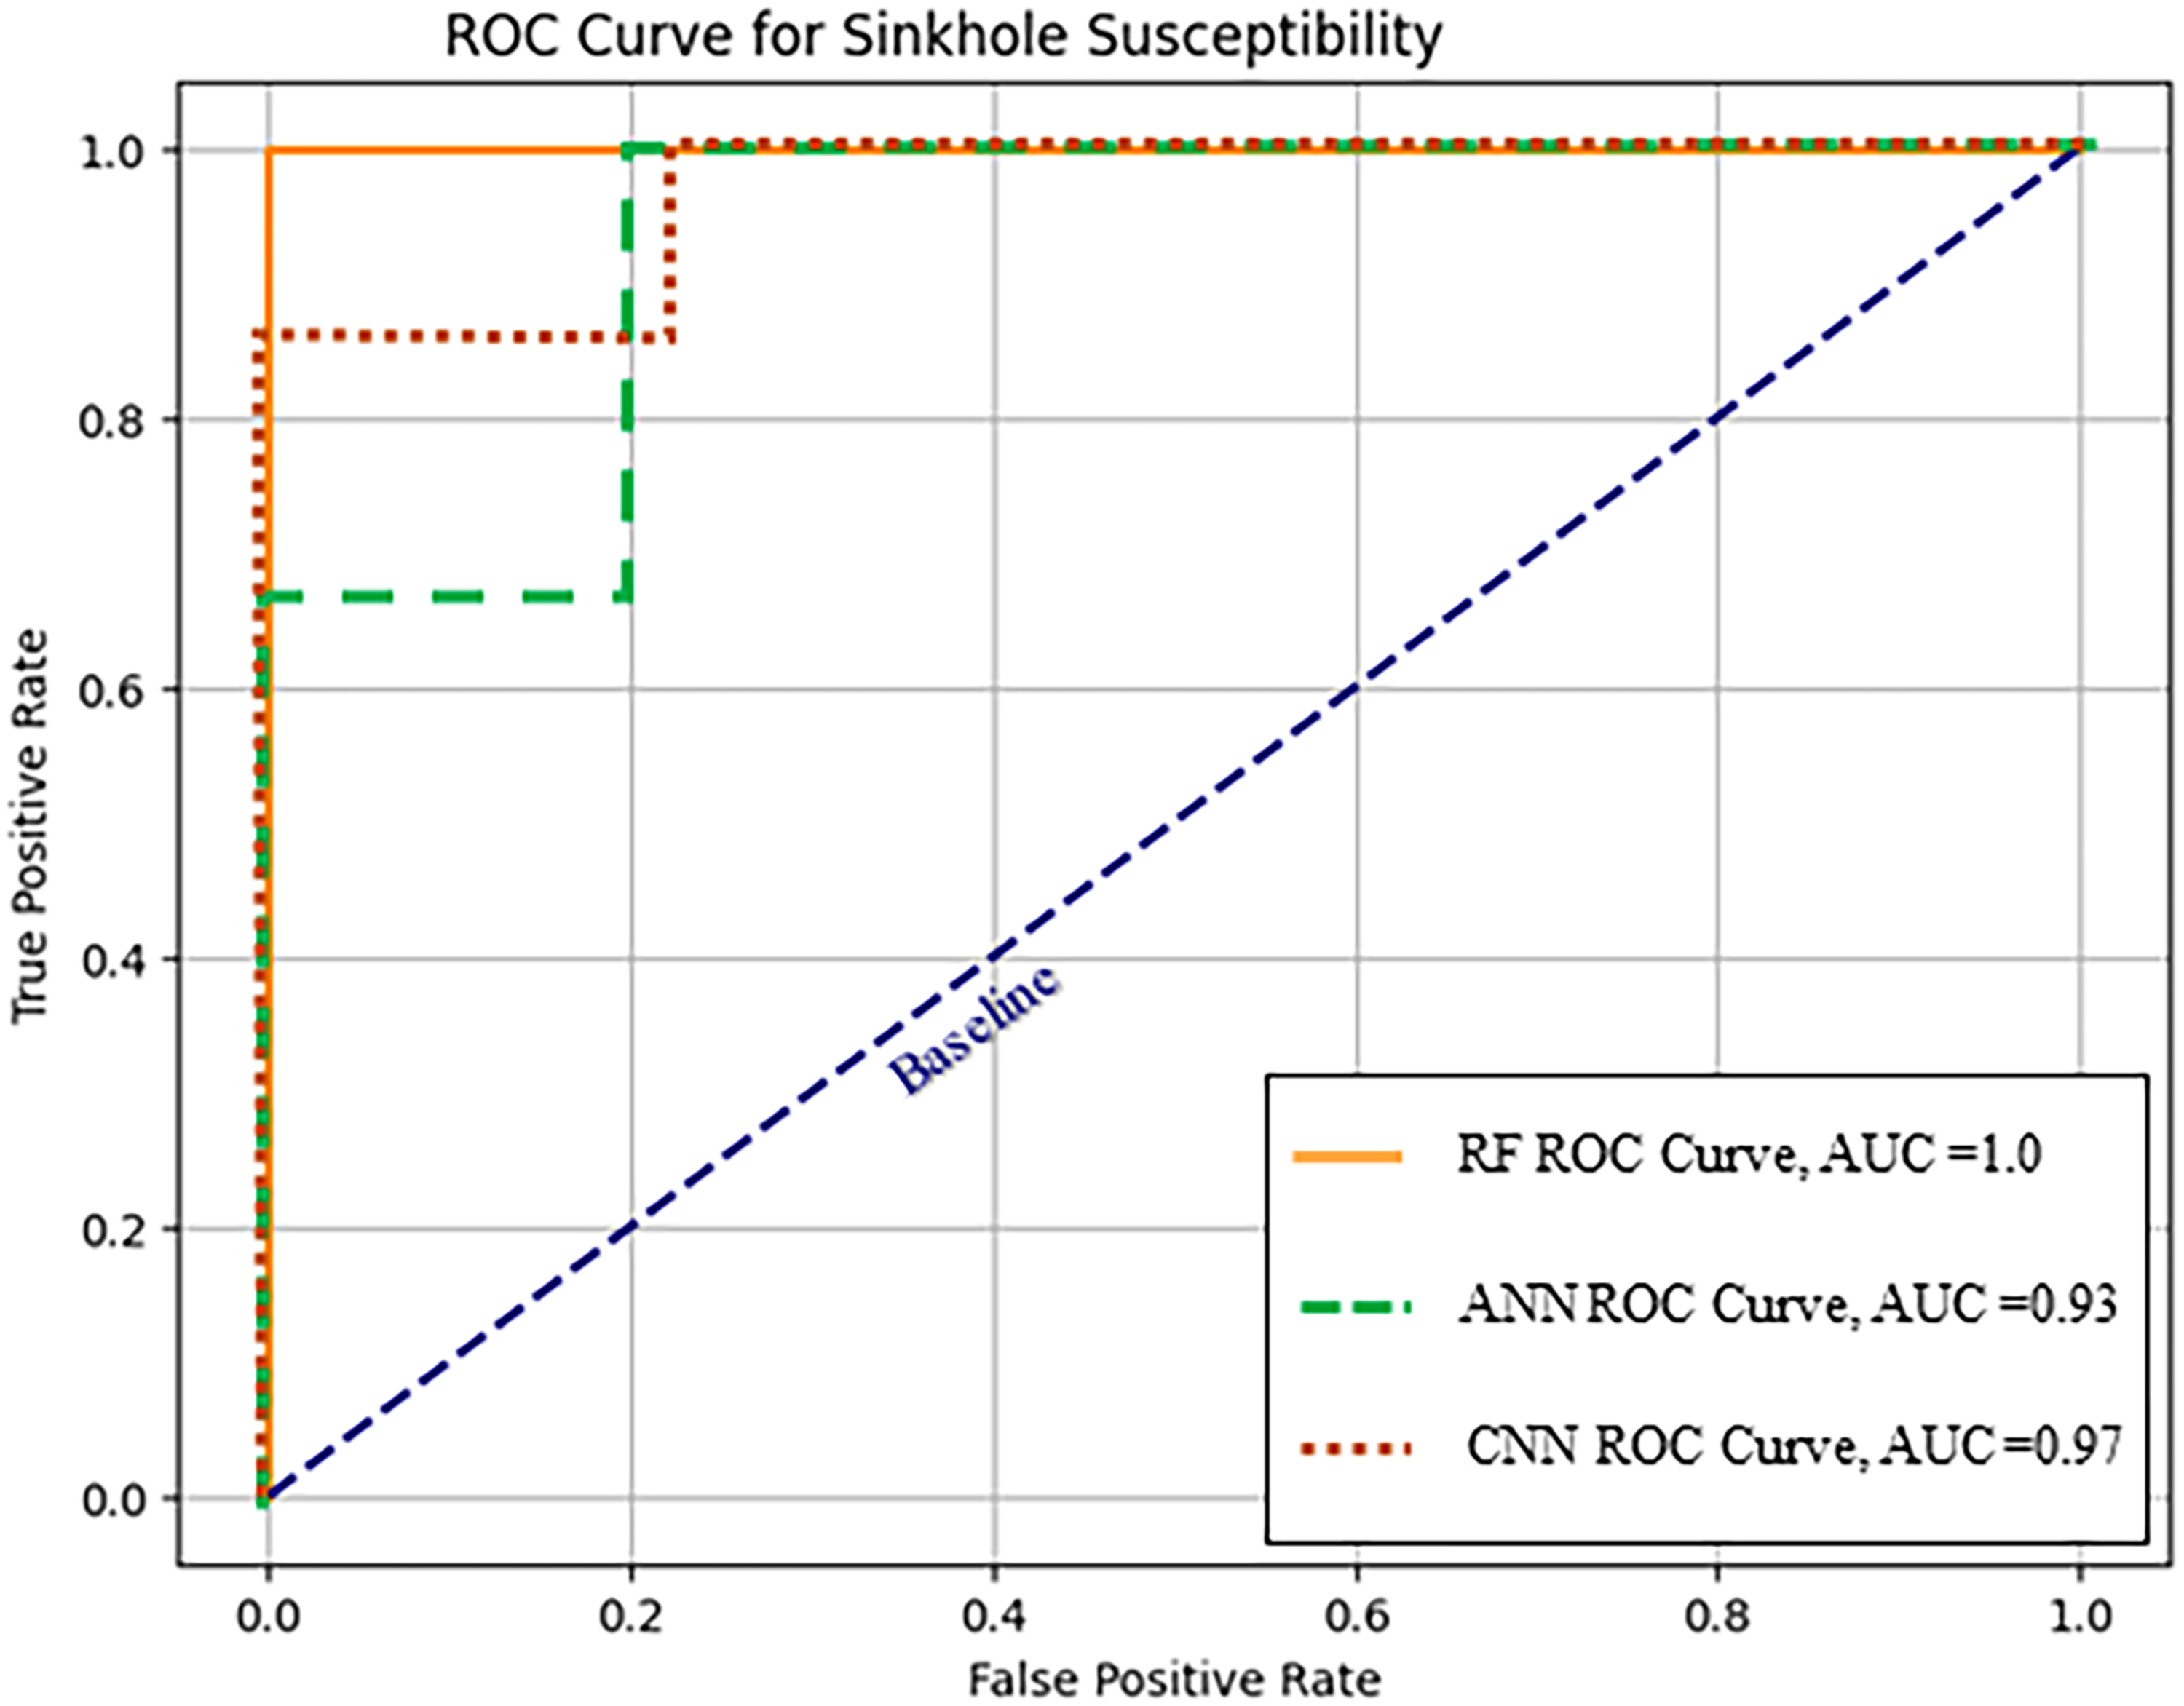
Figure 7: ROC curves of the RF, ANN, and 1D CNN models, highlighting each model’s ability to distinguish between high-and low-susceptibility zones
The RF and ANN models tend to emphasise classification certainty, which may be unsuitable for communicating nuanced susceptibility patterns to non-specialists. The 1D CNN, though yielding lower accuracy, better supports user interpretation in web applications due to its visually coherent gradients. Based on its high AUC–ROC performance and smoother, more interpretable susceptibility outputs, the 1D CNN model was selected for final deployment in the public-facing web application.
When the sinkhole inventory was overlaid on the 1D CNN susceptibility map, 85% of the documented sinkholes were located within areas of ≥0.6 susceptibility (classified here as high or very high). This compares favourably with Rosdi et al. (2017), who reported 76% of sinkholes in high/very high classes using an AHP-based model. The probabilistic nature of our outputs further allows gradation, with 79% sinkholes falling in the 0.6–0.8 range and 6% sinkholes in the 0.8–1.0 range, offering finer interpretability compared to static discrete-class approaches. An additional 16% of sinkholes fell within the moderate range (0.4–0.6), broadly comparable to Rosdi’s report of 24% in moderate/low classes.
3.3 Web Deployment and Stakeholder Engagement
The final 1D CNN model was deployed through a publicly accessible Google Earth Engine (GEE) App, intended for use by urban planners, local authorities, educators, and the general public to support sinkhole awareness, hazard communication, and planning. The web interface features a toggleable sinkhole susceptibility layer overlaid on a hillshaded terrain background. Users can interact with the map by clicking on any location within the mapped area to retrieve the corresponding number of reported sinkhole cases, along with the district and subdistrict names. An interactive legend and control panel are also included to facilitate visual interpretation, improve transparency, and enhance user navigation (Fig. 8).
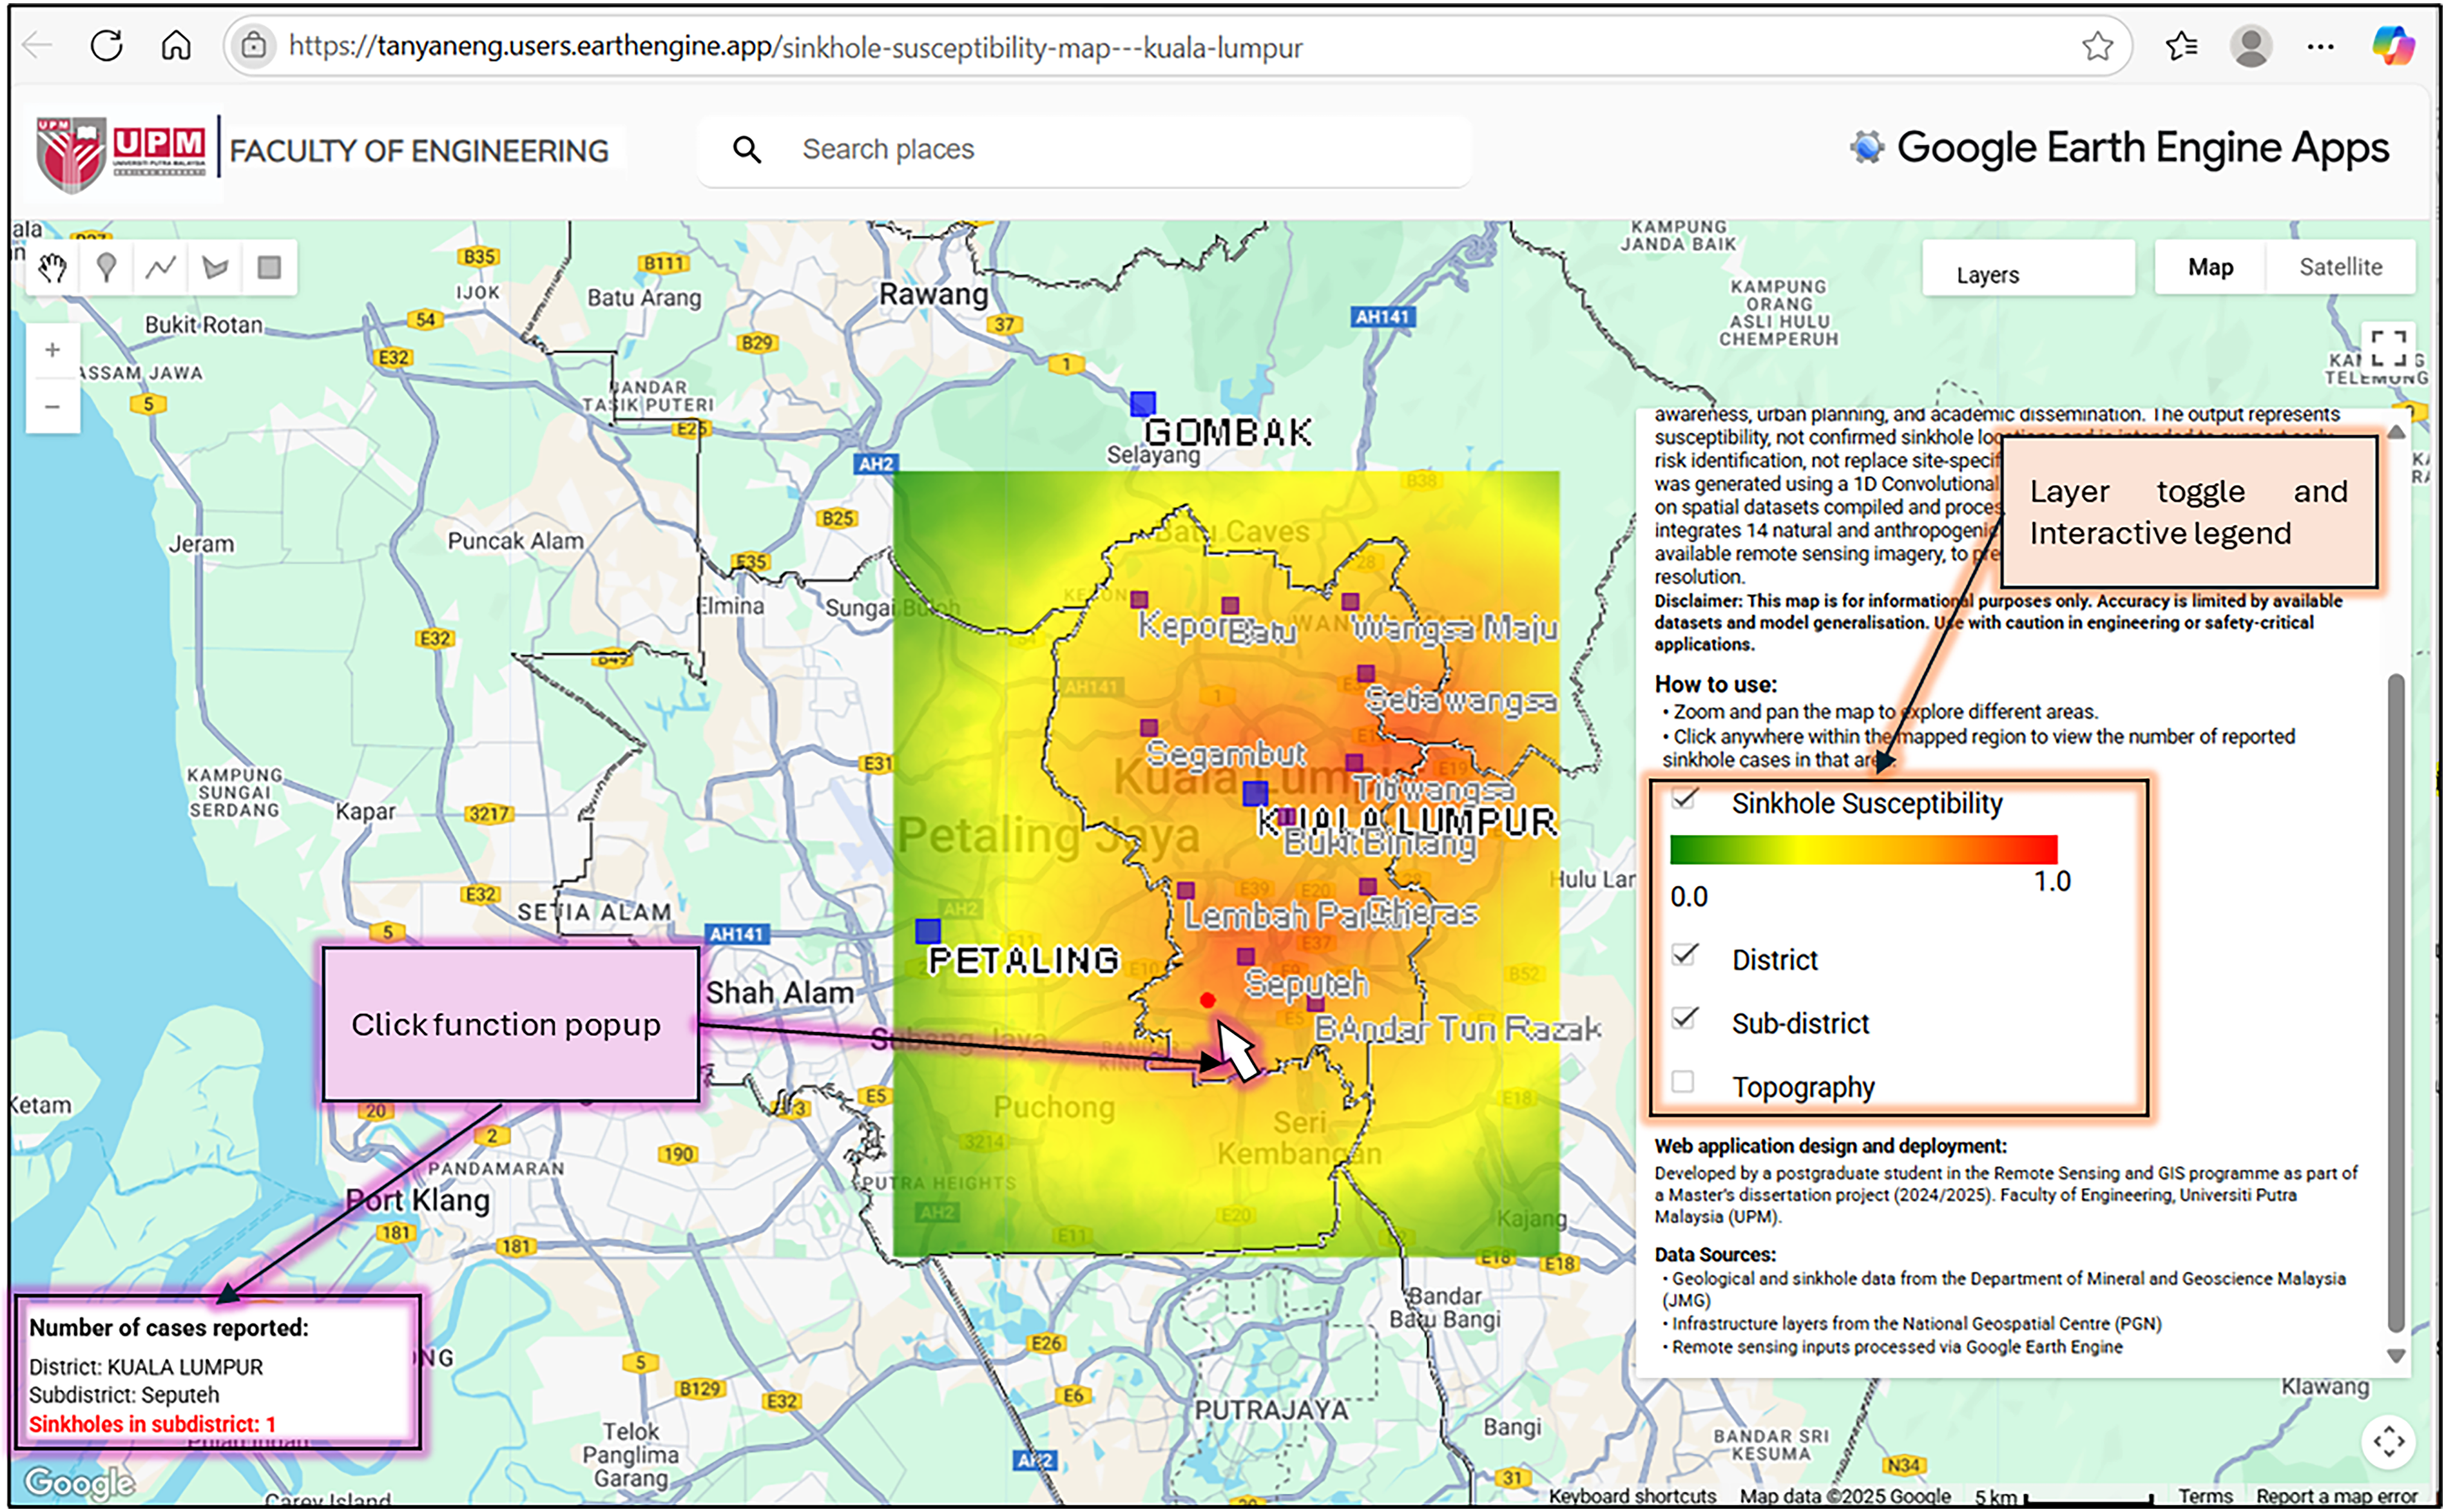
Figure 8: Screenshot of the publicly accessible GEE web application displaying the 1D CNN-derived susceptibility map with interactive features
This cloud-based deployment facilitates community access, supports planning decisions, and allows periodic updates. Its intuitive interface supports geohazard communication, especially in urban planning and public education contexts.
3.4 Practical Implications and Limitations
This study demonstrates the value of interpretable machine learning in karst risk mapping, although data limitations restrict its full predictive capability. While RF and ANN offer strong classification, the 1D CNN’s smoother, probabilistic surface better reflects the nature of subsurface risk. In susceptibility mapping, interpretability often outweighs strict binary accuracy. However, the study is limited by the small, static dataset (<35 samples/class), which restricts the generalisation capability of deep learning models and may increase the risk of overfitting. The analysis was therefore constrained to the Kuala Lumpur–Selangor region to maintain an appropriate ratio between sample size and study area extent. In addition, the absence of temporal indicators and the scarcity of subsurface datasets further limit predictive robustness. These constraints highlight the prototype nature of the framework, which is intended as a pilot demonstration of advanced, cloud-based sinkhole susceptibility mapping using machine learning. Future work should focus on expanding the sinkhole inventory, incorporating temporal indicators, and integrating subsurface datasets (e.g., borehole profiles and underground utilities) to improve model generalisation.
Building on this, recent studies highlight that models trained on very small datasets are inherently unstable, as performance is strongly influenced by sample size and diversity. Gütter et al. (2022) [28] demonstrated that model robustness declines as training size decreases. In remote sensing studies, small sample conditions have also been linked to unusually high accuracies due to limited evaluation schemes, raising concerns about generalisability and overfitting [29]. Despite these limitations, small datasets can be useful for rapid training and prototyping [29], which aligns with the pilot-scale nature of this study. Alzubaidi et al. (2023) [30] further note that deep learning normally requires large datasets for robust performance and propose transfer learning as a strategy to mitigate data scarcity, which could be explored in future work.
In terms of validation strategy, this study employed an 80/20 split, a widely used practice in machine learning and remote sensing [31,32]. Bichri et al. (2024) [32] showed that allocating more than 70% of data for training tends to yield improved performance, supporting the choice of an 80/20 configuration. However, in small-sample contexts, random splits can yield unstable or overly optimistic results due to spatial autocorrelation, as highlighted by Abriha et al. (2023) [33]. Ramezan (2019) [34] demonstrated that small sample sets may still provide comparable performance in relatively homogeneous environments, but recommended k-fold cross-validation as a practical approach to improve reliability. While independent validation data were not available for this pilot study, future work should incorporate k-fold or spatial cross-validation to ensure robustness and generalisability.
Applied to our models, the RF in particular showed unusually high scores (Accuracy 0.95, AUC 1.00) which appear optimistic. Repeated runs confirmed consistently strong but variable performance, suggesting some overfitting risk under small-sample conditions. This effect may also be amplified by the presence of highly correlated predictor variables (e.g., terrain-derived factors and buffered anthropogenic layers), which RF models can overfit when training data are limited. ANN and 1D CNN, by contrast, showed more stable results across repeated runs. This further underscores the importance of adopting more robust validation approaches in future work. It should also be noted that this study did not perform a formal uncertainty quantification (e.g., via bootstrapping or Bayesian approaches). Instead, sources of uncertainty were considered qualitatively, such as sample scarcity, partitioning variability, and model dependence. Future work should explicitly incorporate uncertainty quantification methods to better communicate confidence levels in susceptibility predictions and support decision-making under uncertainty.
Compared to prior static geology-focused maps (e.g., Banks et al., 2020; Rosdi et al., 2017), this study provides a more dynamic, multi-factorial assessment. Banks et al. (2020) [15] produced a lithology-focused conceptual map without quantitative validation, underscoring the lack of robust benchmarks. By contrast, a direct comparison with Rosdi et al. (2017) [35] using sinkhole inventory overlay demonstrates comparable or improved performance, while also offering probabilistic outputs that enhance interpretability. The 1D CNN-based framework therefore represents a reproducible, scalable, and accessible approach for karst risk assessment in rapidly urbanising environments.
The findings of this study carry several important policy implications for urban planning, infrastructure management, and environmental governance in karst-prone regions. The machine learning–derived susceptibility map can serve as a decision-support tool, helping authorities integrate high-risk zones into zoning regulations, mandate geotechnical investigations prior to construction, and prioritise maintenance of roads, tunnels, pipelines, and other critical assets. From an environmental perspective, susceptibility mapping could also inform groundwater management strategies, given the close link between hydrological change and sinkhole formation.
The interactive web map further enhances transparency and stakeholder engagement. Its intuitive design supports public education, early warning dissemination, and emergency preparedness. Local governments could embed such outputs into emergency response frameworks, outreach campaigns, or national spatial planning guidelines, ensuring that geohazard information is both actionable and scalable to other rapidly urbanising karst regions.
Although applied here in the Malaysian context, the framework advances the broader field by demonstrating how cloud-native platforms (Google Earth Engine and Google Colab) can be integrated with machine and deep learning to deliver reproducible, scalable, and publicly accessible susceptibility maps. Unlike many international studies that remain desktop-based or method-specific, this approach highlights the feasibility of operationalising geohazard modelling in data-limited settings, where traditional monitoring networks or large sinkhole inventories may be absent. The prototype nature of this study also underscores its transferability to other rapidly urbanising karst regions worldwide, offering a pathway for comparative assessments and cross-regional standardisation in susceptibility mapping.
An automated, cloud-based sinkhole susceptibility mapping framework was developed and deployed for the Kuala Lumpur region, integrating 14 control variables spanning geological, hydrological, and anthropogenic domains. Using satellite and official geospatial datasets, the study evaluated three classification models, Random Forest (RF), Artificial Neural Network (ANN), and One-Dimensional Convolutional Neural Network (1D CNN), within scalable platforms (Google Earth Engine and Google Colab). Among the models, 1D CNN produced the most interpretable and visually coherent susceptibility map, achieving a strong AUC–ROC of 0.97. The final result is a publicly accessible web application that supports dynamic updates and enables interactive exploration of sinkhole risk, designed to aid hazard communication, urban planning, and public awareness.
Key limitations include the small training dataset, reliance primarily on surface lithology due to the lack of accessible subsurface data, and the absence of temporal indicators such as time of sinkhole formation or groundwater fluctuations.
Future work should focus on expanding the sinkhole inventory, integrating temporal indicators, and incorporating subsurface data such as borehole profiles, utility maps, and underground geological models to better capture hidden risk factors. In addition, advanced deep learning approaches, such as 2D/3D CNNs or transformer-based architectures should be explored to improve spatial generalisation and feature learning. Applying this framework to other karst-prone regions could also enable broader geohazard monitoring at a national scale.
This study demonstrates the feasibility of combining geospatial data and interpretable deep learning to produce accessible and updatable sinkhole susceptibility maps. By addressing data availability and modelling limitations, the proposed approach supports more informed infrastructure planning, utility maintenance, and public safety initiatives in rapidly urbanising karst environments.
Acknowledgement: The authors gratefully acknowledge the Department of Minerals and Geoscience Malaysia (JMG) and the National Geospatial Centre (PGN) for providing key geospatial datasets used in this study. The computational workflow was supported by open-access platforms including Google Earth Engine, Google Colab, and Google Cloud Console. Special thanks are extended to Sr Gs Dr Siti Nur Aliaa Roslan for academic guidance throughout the research. The authors also wish to thank Lembaga Jurukur Tanah Malaysia (LJT) for sponsoring the oral presentation of this paper at the 10th International Conference on Geomatics and Geospatial Technology (GGT2025).
Funding Statement: The authors received no specific funding for this study.
Author Contributions: The authors confirm contribution to the paper as follows: Conceptualisation, Yan Eng Tan; methodology, Yan Eng Tan; validation, Yan Eng Tan; formal analysis, Yan Eng Tan; data curation, Yan Eng Tan; writing, Yan Eng Tan; project administration, Yan Eng Tan; software: Yan Eng Tan; validation, Yan Eng Tan; visualization, Yan Eng Tan; supervision, Siti Nur Aliaa Roslan. All authors reviewed the results and approved the final version of the manuscript.
Availability of Data and Materials: The remote sensing datasets used in this study (e.g., SRTM, Landsat) are openly accessible via Google Earth Engine. However, geospatial datasets provided by Malaysian government agencies (e.g., sinkhole records, infrastructure, and geological maps) were obtained under academic data request and are not publicly available.
Ethics Approval: Not applicable.
Conflicts of Interest: The authors declare no conflicts of interest to report regarding the present study.
References
1. Ford D, Williams PD. Karst hydrogeology and geomorphology. Oxford, UK: John Wiley & Sons; 2007. [Google Scholar]
2. Ha KM. Coping with sinkholes: a systematic literature review. J Environ Earth Sci. 2024;6(3):186–96. doi:10.30564/jees.v6i3.6812. [Google Scholar] [CrossRef]
3. Li P, Bai M, Wei Z, Li X, Shi H. Stability analysis of subgrade under dynamic loading of single and double high-speed railways in karst areas. KSCE J Civ Eng. 2022;26(8):3301–13. doi:10.1007/s12205-022-1308-6. [Google Scholar] [CrossRef]
4. Shi X, Zhang S, Jiang M, Pei Y, Qu T, Xu J, et al. Spatial and temporal subsidence characteristics in Wuhan (Chinaduring 2015–2019, infrared from sentinel-1 synthetic aperture radar (SAR) interferometry. Nat Hazards Earth Syst Sci. 2021;21(8):2285–97. doi:10.5194/nhess-21-2285-2021. [Google Scholar] [CrossRef]
5. Gutiérrez F, Parise M, De Waele J, Jourde H. A review on natural and human-induced geohazards and impacts in karst. Earth-Sci Rev. 2014;138:61–88. doi:10.1016/j.earscirev.2014.08.002. [Google Scholar] [CrossRef]
6. Yumba J, Ferentinou M, Grobler M. Experimental study of sinkhole propagation induced by a leaking pipe using fibre bragg grating sensors. Sensors. 2024;24(19):6215. doi:10.3390/s24196215. [Google Scholar] [PubMed] [CrossRef]
7. Bianchini S, Confuorto P, Intrieri E, Sbarra P, Di Martire D, Calcaterra D, et al. Machine learning for sinkhole risk mapping in Guidonia-Bagni di Tivoli plain (RomeItaly. Geocarto Int. 2022;37(27):16687–715. doi:10.1080/10106049.2022.2113455. [Google Scholar] [CrossRef]
8. Zhang Y, Jiao YY, He LL, Tan F, Zhu HM, Wei HL, et al. Susceptibility mapping and risk assessment of urban sinkholes based on grey system theory. Tunn Undergr Space Technol. 2024;152:105893. doi:10.1016/j.tust.2024.105893. [Google Scholar] [CrossRef]
9. Park JH, Kang J, Kang J, Mun D. Machine-learning-based ground sink susceptibility evaluation using underground pipeline data in Korean urban area. Sci Rep. 2022;12(1):20911. doi:10.1038/s41598-022-25237-8. [Google Scholar] [PubMed] [CrossRef]
10. Yavariabdi A, Kusetogullari H, Orhan O, Uray E, Demir V, Celik T, et al. SinkholeNet: a novel RGB-slope sinkhole dataset and deep weakly-supervised learning framework for sinkhole classification and localisation. Egypt J Remote Sens Space Sci. 2023;26(4):966–73. doi:10.1016/j.ejrs.2023.10.006. [Google Scholar] [CrossRef]
11. García-Cruzado SA, Ramírez-Serrato NL, Herrera-Zamarrón GS, Hernandez-Hernandez MA, Yépez-Rincón FD, Villarreal S, et al. Mapping sinkhole susceptibility in Mexico City using the weight of evidence method. J South Am Earth Sci. 2025;153:105368. doi:10.1016/j.jsames.2025.105368. [Google Scholar] [CrossRef]
12. Zhu G, Niu Y, Ruan L, Zhang X. AMFENet: an adaptive multiscale feature fusion enhancement network for sinkhole detection. IEEE Geosci Remote Sens Lett. 2024;21:1–5. doi:10.1109/LGRS.2024.3357062. [Google Scholar] [CrossRef]
13. Tan BK. Urban geology of Kuala Lumpur and Ipoh, Malaysia. In: Proceedings of the IAEG; 2006 Sep 6–10; Nottingham, UK. Bath, UK: The Geological Society Publishing House; 2006. [Google Scholar]
14. Termizi AK, Mohamed TRT, Roslee R. An overview of sinkhole geohazard incidence recorded in the Kinta Valley area, Perak. ASM Sci J. 2018;11(2):19–28. [Google Scholar]
15. Banks VJ, Arnhardt C, Ramli Z, Ahmad F, Pereira J. Sinkhole susceptibility mapping in the Kuala Lumpur and the need for a buried karst database. In: Proceedings of the 16th Multidisciplinary Conference on Sinkholes and the Engineering and Environmental Impacts of Karst; 2020 Apr 20–24; San Juan, Puerto Rico. doi:10.5038/9781733375313.1073. [Google Scholar] [CrossRef]
16. Nizar NH, Xin KL, Ismail S, Ahmad F, Zabidi H. Characterization of Kuala Lumpur bedrock subsurface limestone aquifer system by using borehole modelling analysis. Mater Today Proc. 2022;66(5):3036–9. doi:10.1016/j.matpr.2022.07.333. [Google Scholar] [CrossRef]
17. Gobbett DJ. The lower Palaeozoic rocks of Kuala Lumpur, Malaysia. Fed Malaya Geol Surv. 1964;9:67–79. [Google Scholar]
18. Hutchison CS, Tan DK. Geology of peninsular Malaysia. Kuala Lumpur, Malaysia: University of Malaya and the Geological Society of Malaysia; 2009. [Google Scholar]
19. Zabidiand H, De Freitas M. Preferred direction of karst in the Kuala Lumpur limestone formation: a smart tunnel case study. Asean Eng J. 2011;1(3):152–61. doi:10.11113/aej.v1.15305. [Google Scholar] [CrossRef]
20. He X, Xu C, Xu X, Yang Y. Advances on the avoidance zone and buffer zone of active faults. Nat Hazards Res. 2022;2(2):62–74. doi:10.1016/j.nhres.2022.05.001. [Google Scholar] [CrossRef]
21. Arabameri A, Saha S, Roy J, Tiefenbacher JP, Cerda A, Biggs T, et al. A novel ensemble computational intelligence approach for the spatial prediction of land subsidence susceptibility. Sci Total Env. 2020;726:138595. doi:10.1016/j.scitotenv.2020.138595. [Google Scholar] [PubMed] [CrossRef]
22. Bilgilioglu SS, Gezgin C, Iban MC, Bilgilioglu H, Gündüz HI, Arslan S. Explainable sinkhole susceptibility mapping using machine-learning-based SHAP: quantifying and comparing the effects of contributing factors in Knoya, Türkiye. Appl Sci. 2025;15(6):3139. doi:10.3390/app15063139. [Google Scholar] [CrossRef]
23. Haykin S. Neural networks and learning machines. 3rd ed. London, UK: Pearson Education; 2009. [Google Scholar]
24. Singh K, Mahajan A, Mansotra V. 1D-CNN based model for classification and analysis of network attacks. Int J Adv Comput Sci Appl. 2021;12(11):604–13. doi:10.14569/IJACSA.2021.0121169. [Google Scholar] [CrossRef]
25. Kiranyaz S, Avci O, Abdeljaber O, Ince T, Gabbouj M, Inman DJ. 1D convolutional neural networks and applications: a survey. Mech Syst Signal Process. 2021;151:107398. doi:10.48550/arXiv.1905.03554. [Google Scholar] [CrossRef]
26. Ye X, Cao Y, Liu A, Wang X, Zhao Y, Hu N. Parallel convolutional neural network toward high efficiency and robust structural damage identification. Struct Health Monit. 2023;22(6):3805–26. doi:10.1177/14759217231158786. [Google Scholar] [CrossRef]
27. Ben-David A. About the relationship between ROC curves and cohen’s kappa. Eng Appl Artif Intell. 2008;21(6):874–82. doi:10.1016/j.engappai.2007.09.009. [Google Scholar] [CrossRef]
28. Gütter J, Kruspe A, Zhu XX, Niebling J. Impact of training set size on the ability of deep neural networks to deal with omission noise. Front Remote Sens. 2022;3:932431. doi:10.3389/frsen.2022.932431. [Google Scholar] [CrossRef]
29. Safonova A, Ghazaryan G, Stiller S, Main-Knorn M, Nendel C, Ryo M. Small data problems in deep learning applications with remote sensing: a review. EarthArXiv. 2023. doi:10.31223/X52H3B. [Google Scholar] [CrossRef]
30. Alzubaidi L, Bai J, Al-Sabaawi A, Santamaria J, Albahri AS, Al-Dabbagh BSN, et al. A survey on deep learning tools dealing with data scarcity: definitions, challenges, solutions, tips, and applications. J Big Data. 2023;10(1):46. doi:10.1186/s40537-023-00727-2. [Google Scholar] [CrossRef]
31. Gholamy A, Kreinovich V, Kosheleva O. Why 70/30 or 80/20 relation between training and testing sets: a pedagogical explanation. El Paso, TX, USA: University of Texas at El Paso; 2018. [Google Scholar]
32. Bichri H, Chergui A, Hain M. Investigating the impact of train/test split ratio on the performance of pre-trained models with custom datasets. Int J Adv Comput Sci Appl. 2024;15(2):1–9. doi:10.14569/IJACSA.2024.0150235. [Google Scholar] [CrossRef]
33. Abriha D, Srivastava PK, Szabo S. Smaller is better? Unduly nice accuracy assessment in roof detection using remote sensing data with machine learning and k-fold cross-validation. Heliyon. 2023;9(3):e14045. doi:10.1016/j.heliyon.2023.e14045. [Google Scholar] [PubMed] [CrossRef]
34. Ramezan CA, Warner TA, Maxwell AE. Evaluation of sampling and cross-validation tuning strategies for regional-scale machine learning classification. Remote Sens. 2019;11(2):185. doi:10.3390/rs11020185. [Google Scholar] [CrossRef]
35. Rosdi MAHM, Othman AN, Zubir MAM, Latif ZA, Yusoff ZM. Sinkhole susceptibility hazard zones using gis and analytical hierarchical process (AHPa case study of Kuala Lumpur and Ampang Jaya. Int Arch Photogramm Remote Sens Spat Inf. 2017;42:145–51. doi:10.5194/isprs-archives-XLII-4-W5-145-2017. [Google Scholar] [CrossRef]
Cite This Article
 Copyright © 2025 The Author(s). Published by Tech Science Press.
This work is licensed under a Creative Commons Attribution 4.0 International License , which permits unrestricted use, distribution, and reproduction in any medium, provided the original work is properly cited.
 Downloads
 Citation Tools