
 Submit a Paper
 Propose a Special lssue
 Open Access
ARTICLE

Spatio-Temporal Flood Inundation Dynamics and Land Use Transformation in the Jhelum River Basin Using Remote Sensing and Historical Hydrological Data
1 College of Environmental Science and Engineering, Yangzhou University, Yangzhou, 225127, China
2 Department of Irrigation and Drainage, University of Agriculture, Faisalabad, 38000, Pakistan
3 Department of Agricultural Engineering, Khwaja Fareed University of Engineering and Information Technology, Rahim Yar Khan, 64200, Pakistan
4 Precision Agriculture Center, Department of Soil, Water and Climate, University of Minnesota, St. Paul, MN 55108, USA
* Corresponding Author: Jun Wu. Email:
(This article belongs to the Special Issue: Geospatial Techniques for Precision Agriculture and Water Resources Sustainability)
Revue Internationale de Géomatique 2025, 34, 831-853. https://doi.org/10.32604/rig.2025.069020
Received 12 June 2025; Accepted 13 October 2025; Issue published 10 November 2025
 View Full Text
 Download PDF
Abstract
The Jhelum River Basin in Pakistan has experienced recurrent and severe flooding over the past several decades, leading to substantial economic losses, infrastructure damage, and socio-environmental disruptions. This study uses multi-temporal satellite remote sensing data with historical hydrological records to map the spatial and temporal dynamics of major flood events occurring between 1988 and 2019. By utilizing satellite imagery from Landsat 5, Landsat 8, and Sentinel-2, key flood events were analyzed through the application of water indices such as the Normalized Difference Water Index (NDWI) and the Modified NDWI (MNDWI) to delineate flood extents. Historical discharge data from key hydrological control points, including Mangla Dam and Rasul Barrage, were incorporated to validate and interpret flood intensity and inundation patterns. Flood footprints were extracted and mapped using pre- and post-flood images in Google Earth Engine, while land use and land cover (LULC) analysis revealed a consistent increase in built-up areas and a corresponding decline in vegetative cover in flood-prone tehsils from 1988 to 2023. Findings indicated that the flood years 1992 and 1997 were the most catastrophic, with over 180 km² of land submerged. A substantial proportion of inundated zones consisted of agricultural land and low-lying urban settlements, underscoring the vulnerability of these areas. This study proved the effectiveness of integrating satellite imagery and historical hydrological data for spatio-temporal flood monitoring and provides essential insights for future flood risk assessment and the development of site-specific mitigation strategies in vulnerable areas of the Jhelum River Basin.Keywords
Floods are among the most devastating natural disasters, causing significant socio-economic losses, environmental degradation, and loss of life worldwide [1,2]. The increasing frequency and severity of flood events have been closely linked to climate change [3,4] and rapid urbanization [5], which alter natural hydrological systems, reduce infiltration capacity, and intensify surface runoff, and exacerbate the flood events [6,7]. Developing regions are particularly vulnerable due to inadequate infrastructure, unregulated land-use change, and institutional constraints, especially limited access to hydrological and spatial data critical for effective flood management. However, understanding the spatio-temporal dynamics of floods is crucial for effective risk assessment and the development of mitigation strategies.
The integration of Remote Sensing (RS) and Geographic Information Systems (GIS) has revolutionized flood risk assessment by providing high-resolution, real-time data for monitoring and mapping flood-prone areas [8]. Tools such as the Normalized Difference Water Index (NDWI) and Modified NDWI (MNDWI) are widely applied to delineate water bodies and flood inundation extents, particularly in regions with limited ground-based observations [9]. Concurrently, machine learning classifiers like Random Forest (RF) are increasingly applied for land use/land cover (LULC) classification due to their accuracy, scalability, and ability to handle complex datasets [10,11]. These technologies enable the analysis of land use and land cover (LULC) changes over time, which is essential for understanding the impact of human activities on flood vulnerability. Previous studies have demonstrated that urban expansion and deforestation significantly alter hydrological responses, increasing surface runoff and reducing natural water retention capacities [12–15].
Pakistan, home to the world’s fifth-largest population, currently stands at approximately 220 million and is projected to exceed 250 million by 2025, maintaining an annual growth rate of 2.8% [16]. Historically, the nation has faced substantial flood-related challenges, experiencing nearly 19 major flood events over the past six decades [17]. These events have collectively inundated an estimated 594,700 square kilometers, impacted over 166,000 communities, and resulted in direct economic losses totaling approximately $30 billion [18]. Furthermore, the human toll has been considerable, with more than 10,600 lives lost during this period. Although floods are inherent to natural hydrological cycles and cannot be completely averted, their impacts can be significantly reduced through proactive planning and the application of mitigation strategies. A growing body of research emphasizes that comprehensive flood risk management encompassing both structural interventions (e.g., levees, dams) and non-structural approaches (e.g., zoning, early warning systems) is critical in minimizing vulnerability and reducing damages to manageable levels. In regions like the Jhelum River Basin, floods are recurrent due to complex interactions between natural and anthropogenic factors. The basin has experienced significant LULC changes, including deforestation, agricultural expansion, and urban development, which have exacerbated flood risks [19]. Despite these risks, there remains limited spatially explicit research that holistically examines the interplay of flood events and long-term land-use transitions using integrated hydrological and remote sensing datasets.
To evaluate areas susceptible to flooding, researchers employ a range of analytical models. As highlighted in [20], traditional flood hazard mapping approaches are often constrained by the lack of sufficient and reliable data, particularly in resource-limited regions. These conventional techniques typically rely on comprehensive data acquisition processes, which are not only costly and labor-intensive but are also frequently inaccessible at local or regional scales. In contrast, the application of GIS and remote sensing technologies has become increasingly valuable for flood risk assessment, spatial forecasting, and zoning. Given that natural hazards like floods are inherently spatial in nature, GIS offers a robust platform for handling and analyzing large-scale geospatial datasets necessary for accurate flood modeling [21]. Effective management of flash floods requires integrated modeling of hydrological, meteorological, and topographic characteristics within a catchment area. This integrative approach is especially useful in catchments like Jhelum, where cross-boundary coordination is limited and institutional capacity is fragmented.
The utilization of historical hydrological data, combined with RS and GIS, offers a robust framework for spatio-temporal flood analysis. This integrated approach allows for the assessment of flood trends over time, identification of vulnerable regions, and development of effective mitigation strategies [22]. For instance, multi-criteria decision analysis (MCDA) integrated with RS and GIS has been employed to delineate flood risk zones, providing valuable information for disaster management. The present study addresses this critical research gap by combining historical flood extent mapping (using NDWI and MNDWI), RF-based LULC classification, and discharge trend analysis to evaluate urbanization-driven flood vulnerability over a 35-year period in the Jhelum River Basin. Specifically, the study aims to: (i) quantify multi-decadal LULC changes in flood-prone tehsils; (ii) map flood inundation extents from 1988 to 2023; (iii) assess discharge trends using data from Mangla Dam and Rasul Barrage; and (iv) evaluate the spatial overlap between flood zones and urban expansion. The novelty of this research lies in its integration of multi-source data and spatial techniques to produce a temporal narrative of flood exposure and land-use pressures in one of Pakistan’s most sensitive river basins. The findings offer practical guidance for urban planners, disaster managers, and policymakers, and present a replicable methodological framework applicable to other flood-prone regions with similar geospatial and institutional constraints.
The study focuses on a 328.736 km segment of the Jhelum River, extending downstream from Mangla Dam to Trimu Barrage, within the expansive Jhelum River Basin, which spans approximately 33,500 km2. This basin exhibits a complex geomorphology, transitioning from the rugged Himalayan foothills in the north to the fertile alluvial plains of Punjab, shaping its hydrological dynamics. The Neelum and Poonch Rivers, two major tributaries, play a crucial role in modulating the basin’s flow regime and flood susceptibility (Fig. 1).
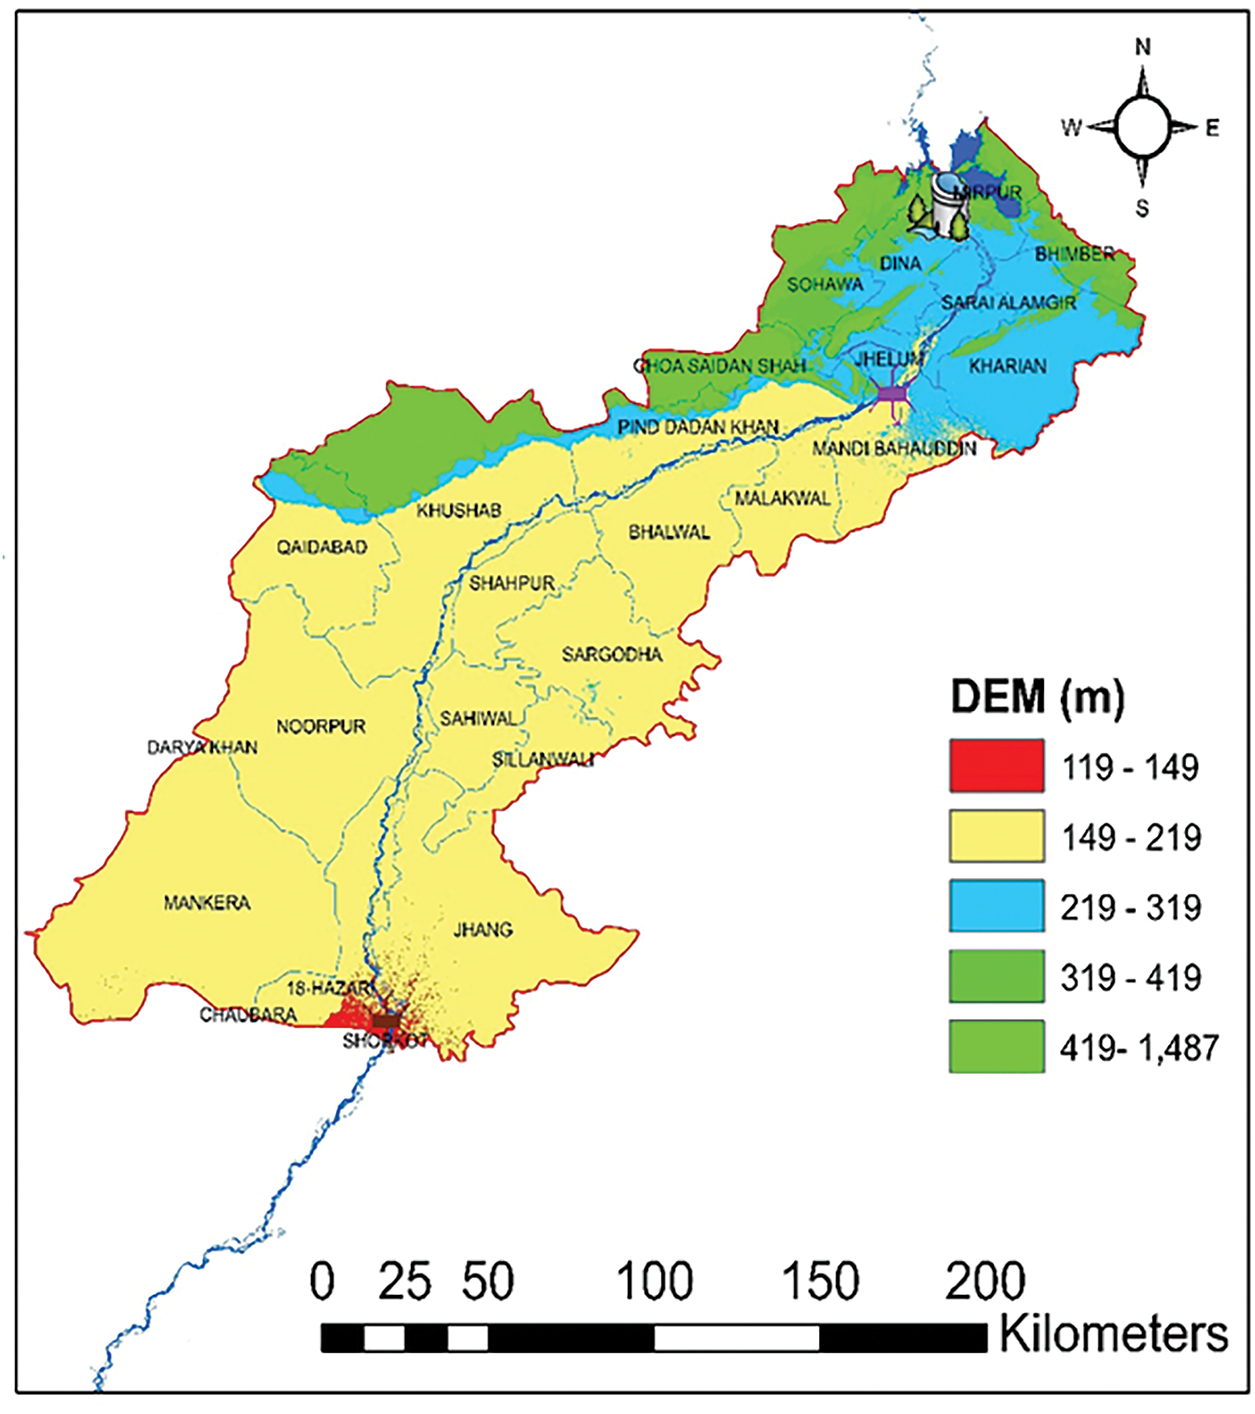
Figure 1: Geographic extent of the study area within Punjab Province, Pakistan, encompassing the Jhelum River and its tributaries, along with key infrastructure (Mangla Dam, Rasul and Trimmu Barrages) and designated flood-prone areas
Climatically, the basin experiences a broad spectrum ranging from temperate conditions in the northern highlands to semi-arid and arid zones in the southern reaches. Seasonal variations are pronounced, with a dry winter (November–February), an intensely hot spring (March–May), and a monsoon season (June–September), which contributes 60%–70% of the annual precipitation. During the monsoon, river discharge frequently surges beyond 15,000 m3/s, exacerbating flood risks across the region.
Hydrological data from critical monitoring stations, including Mangla Dam and Rasul Barrage, provide key insights into spatial and temporal variations in river discharge and flood events. To enhance the understanding of flood dynamics, this study integrates historical hydrological records, high-resolution remote sensing data, and advanced modeling techniques. The findings will support the development of data-driven flood risk assessment and mitigation strategies, contributing to more effective flood management policies.
This study employed a comprehensive, multi-source data acquisition strategy to facilitate an in-depth analysis of flood dynamics, risk assessment, and mitigation strategies within the Jhelum River Basin. Historical flood records spanning 1973–2024 were systematically compiled from three principal agencies: the Federal Flood Commission (FFC), Water and Power Development Authority (WAPDA), and the Pakistan Meteorological Department (PMD). These records provided critical insights into flood frequency, magnitude, and temporal variability, forming the foundation for long-term flood trend analysis.
Hydrological datasets, including river discharge, stage height, and channel geometry, essential for hydraulic and hydrodynamic modeling, were obtained from the National Engineering Services Pakistan (NESPAK). Additionally, meteorological parameters, such as precipitation, temperature, and evapotranspiration, were acquired from PMD to examine the relationships between atmospheric conditions and flood occurrences. All satellite datasets used in this study are publicly available. Landsat imagery was obtained from the United States Geological Survey (USGS) Earth Explorer (https://earthexplorer.usgs.gov/), and Sentinel-2 data were sourced from the Copernicus Open Access Hub (https://scihub.copernicus.eu/). MODIS data were accessed via the NASA Earthdata portal (https://earthdata.nasa.gov/). These datasets are not openly accessible online but can be obtained upon formal request to the respective agencies. To evaluate the effectiveness of existing flood mitigation infrastructure, comprehensive data on levees, dams (e.g., Mangla Dam), and barrages (e.g., Rasul Barrage, Trimu Barrage) were collected from WAPDA and other relevant authorities. These datasets enabled an assessment of structural resilience and provided a basis for identifying potential enhancements to flood defense systems.
Furthermore, multi-temporal remote sensing datasets from MODIS, Landsat, and Sentinel-2 satellites were leveraged to analyze land use and land cover (LULC) dynamics, floodplain modifications, and environmental changes that may exacerbate flood risk. These satellite-derived datasets facilitated the characterization of landscape features, spatial flood extent, and temporal shifts in flood-prone areas.
To enhance the accuracy and reliability of remote sensing analyses, ground-truth observations were conducted. These field-based validations provided on-the-ground verification of remotely sensed flood extents, land use changes, and the structural condition of flood protection measures. This integrative approach ensured a high-resolution, multi-dimensional understanding of flood dynamics within the Jhelum River Basin. Table 1 summarizes key parameters including spatial resolution, temporal coverage, spectral bands used, and data sources. Where applicable, basic statistics were computed to describe the hydrological dataset characteristics, including discharge values from Mangla Dam and Rasul Barrage.

Spatio-Temporal Analysis
A comprehensive spatio-temporal analysis of flood occurrences in the Jhelum River Basin was conducted using multi-temporal Landsat 5, Landsat 8, and Sentinel-2 satellite imagery. These satellite platforms were selected due to their extended temporal coverage and high spatial resolution, which are critical for accurately capturing flood dynamics over time. The Normalized Difference Water Index (NDWI) [23] and its improved form, the Modified NDWI [24], are widely used for mapping surface water and flood extents. MNDWI enhances accuracy in urban and turbid areas by reducing the misclassification of built-up land common with NDWI, which incorporates the shortwave infrared (SWIR) band. The analysis began with the selection of cloud-free images for each flood event, ensuring minimal atmospheric interference and consistency across datasets. For each event, pre-flood and post-flood satellite images were selected, allowing a direct comparative assessment of flood-induced changes in water extent. To enhance data consistency, all selected images underwent atmospheric correction and radiometric normalization to mitigate sensor-specific discrepancies and temporal variations.
NDWI and MNDWI were computed using the following formulas [25,26]:
where NIR is the reflection in the near-infrared spectrum, GREEN is the reflection in the green range spectrum, SWIR is shortwave infrared. These indices were processed using Google Earth Engine (GEE), a cloud-based geospatial analysis platform that enables scalable and efficient remote sensing computations. The NDWI and MNDWI values were thresholded within a range of 0.1 to 1.0 to identify flood-inundated areas, based on empirical trials across different flood events and satellite scenes. The lower threshold of 0.1 was selected as it effectively minimized commission errors in non-water regions, while values greater than 0.1 consistently corresponded with observed flood extents in the imagery. To validate the accuracy of water body classification, ground-truth points were collected from flood-affected regions through field visits and consultations with local disaster response teams during and after major flood events. These reference points were then compared with the classified flood extents derived from remote sensing to assess agreement. Ground-truth data were collected through field visits to affected tehsils. These data included GPS-based flood inundation areas coordinates and recorded observations of inundated structures, croplands, and roadways. In instances where direct access was limited, proxy validation was performed using data from local disaster management offices, eyewitness accounts, and flood reconnaissance reports issued by the Federal Flood Commission (FFC). The study encompassed major flood events spanning multiple decades, including the July 1988, September 1992, August–September 1997, July–August 2010, September 2014, and June 2019 floods. For each event, the extent of inundation was quantified by comparing classified pre-flood and post-flood images, enabling an assessment of spatial distribution, flood depth variations, and temporal trends.
To facilitate the visualization of flood-affected areas, ArcGIS was employed to generate high-resolution flood maps and perform advanced spatial analyses. The classified flood extents were overlaid onto historical flood records and auxiliary datasets to validate the accuracy of the satellite-derived classifications. Ground-truth observations, where available, were incorporated to further enhance the reliability of the classification. The results demonstrated a strong agreement between the remotely sensed flood zones and historical flood records, confirming the robustness of the classification approach.
By integrating multi-source satellite imagery, advanced geospatial processing (GEE, ArcGIS), and ground-truth validation, this study provides a comprehensive, high-resolution assessment of flood dynamics over time. The combined use of Google Earth Engine for automated data processing and ArcGIS for spatial visualization enabled a systematic, scalable, and reproducible methodology for understanding flood extent, patterns, and impacts. These findings contribute to the development of improved flood forecasting models and risk mitigation strategies for flood-prone regions.
Land Use & Land Cover Analysis
This study employed multi-source satellite imagery to assess spatiotemporal variations in land use and land cover (LULC) within the study area. Historical LULC patterns were extracted using Landsat 5 Thematic Mapper (TM) imagery at a 30-m resolution, while contemporary classifications relied on Landsat 8 Operational Land Imager/Thermal Infrared Sensor (OLI/TIRS) imagery, maintaining the same spatial resolution. To enhance classification accuracy and spatial detail, Sentinel-2 Multi-Spectral Instrument (MSI) imagery with a 10-m resolution was incorporated. All datasets were obtained from the Copernicus Open Access Hub and the United States Geological Survey (USGS) Earth Explorer.
Preprocessing of satellite imagery was conducted within the Google Earth Engine (GEE) platform to ensure consistency and minimize atmospheric and radiometric distortions. Cloud and shadow masking were applied using the Quality Assessment (QA) bands from Landsat and Sentinel-2 datasets to eliminate atmospheric noise. The Dark Object Subtraction (DOS) technique was used for atmospheric correction, mitigating scattering effects and ensuring spectral consistency across images. Radiometric normalization was performed to address inter-sensor variability and differences in illumination conditions across acquisition periods, enhancing the comparability of multi-temporal datasets.
A supervised classification approach using the Random Forest (RF) algorithm was adopted for LULC classification, a widely recognized machine learning technique in remote sensing due to its high classification accuracy and robustness in handling high-dimensional data [27,28]. Training samples were collected through the visual interpretation of high-resolution Google Earth imagery to ensure homogeneity within class categories. The classification scheme included four major LULC categories: barren land, water bodies (e.g., lakes, rivers, and reservoirs), agricultural land, and built-up areas. To improve class separability, spectral indices such as the Normalized Difference Vegetation Index (NDVI) and the Normalized Difference Water Index (NDWI) were computed and integrated into the classification model. NDVI was particularly useful for distinguishing vegetated areas from non-vegetated surfaces, while NDWI enhanced the identification of water bodies. The trained Random Forest classifier was applied to preprocessed images, generating classified LULC maps. For each classified year, training samples per class were manually digitized using true color Earth imagery and local land cover knowledge, resulting in a total of over 600–800 samples per year. The training points were evenly distributed across the spatial extent of the study area to ensure representative sampling of each LULC category, particularly in heterogeneous regions near urban-rural boundaries. To validate classification accuracy, an independent set of 20% random points was selected, and used to assess classification accuracy, with standard metrics including user accuracy to evaluate model performance.
To analyze LULC changes over time, a post-classification comparison approach was implemented. Classified maps derived from Landsat 5, Landsat 8, and Sentinel-2 datasets were systematically compared to detect land cover transformations and spatial distribution shifts across different periods. Transition matrices were generated to quantify LULC category conversions, revealing trends such as urban expansion, shifts in agricultural land, and variations in water body extents. The results were visualized through thematic maps and graphical representations to illustrate both spatial and temporal dynamics in land use patterns.
Computational efficiency and analytical robustness were ensured by integrating multiple geospatial processing tools. Google Earth Engine (GEE) facilitated large-scale image processing, classification, and change detection, while ArcGIS was used for post-classification mapping, geospatial visualization, and accuracy assessment. Python scripting was employed to automate data extraction, transition matrix computation, and statistical analysis. The integration of multi-resolution, multi-temporal satellite data with advanced machine learning-based classification techniques provided a comprehensive framework for LULC monitoring. The findings contribute to a deeper understanding of how land cover changes influence hydrological processes and flood risk, thereby informing sustainable land management and flood mitigation strategies.
3.1 Spatio-Temporal Patterns of Floods
This section presents a long-term spatio-temporal assessment of flood inundation patterns over 35 years using integrated NDWI/MNDWI indices, offering a detailed perspective rarely applied to the Jhelum River Basin. The spatio-temporal analysis of flood events from 1988 to 2019 (Fig. 2) highlights a progressive increase in flood extent and variability, reflecting both hydrological extremes and anthropogenic influences within the Jhelum River Basin. The blue shade in Fig. 2 shows the flood inundation within the Jhelum River Basin, starting from the Rasul Barrage to Mangle Dam. The pre-flood maps (A, C, E, G, I, K) represent conditions before inundation, while post-flood maps (B, D, F, H, J, L) illustrate flood extents delineated using NDWI and MNDWI indices. The flood mapping results were validated using GPS-referenced ground-truth points collected during the 2010, 2014, and 2019 flood events. The classification achieved a user’s accuracy of 89%, confirming the high reliability of NDWI/MNDWI thresholding for delineating inundated areas across multiple flood years. Compared to previous studies that relied solely on rainfall-runoff models, e.g., [22], this study’s use of spectral indices provided a rapid, high-resolution delineation of flood spread without requiring ground calibration, which is ideal for data-scarce regions.
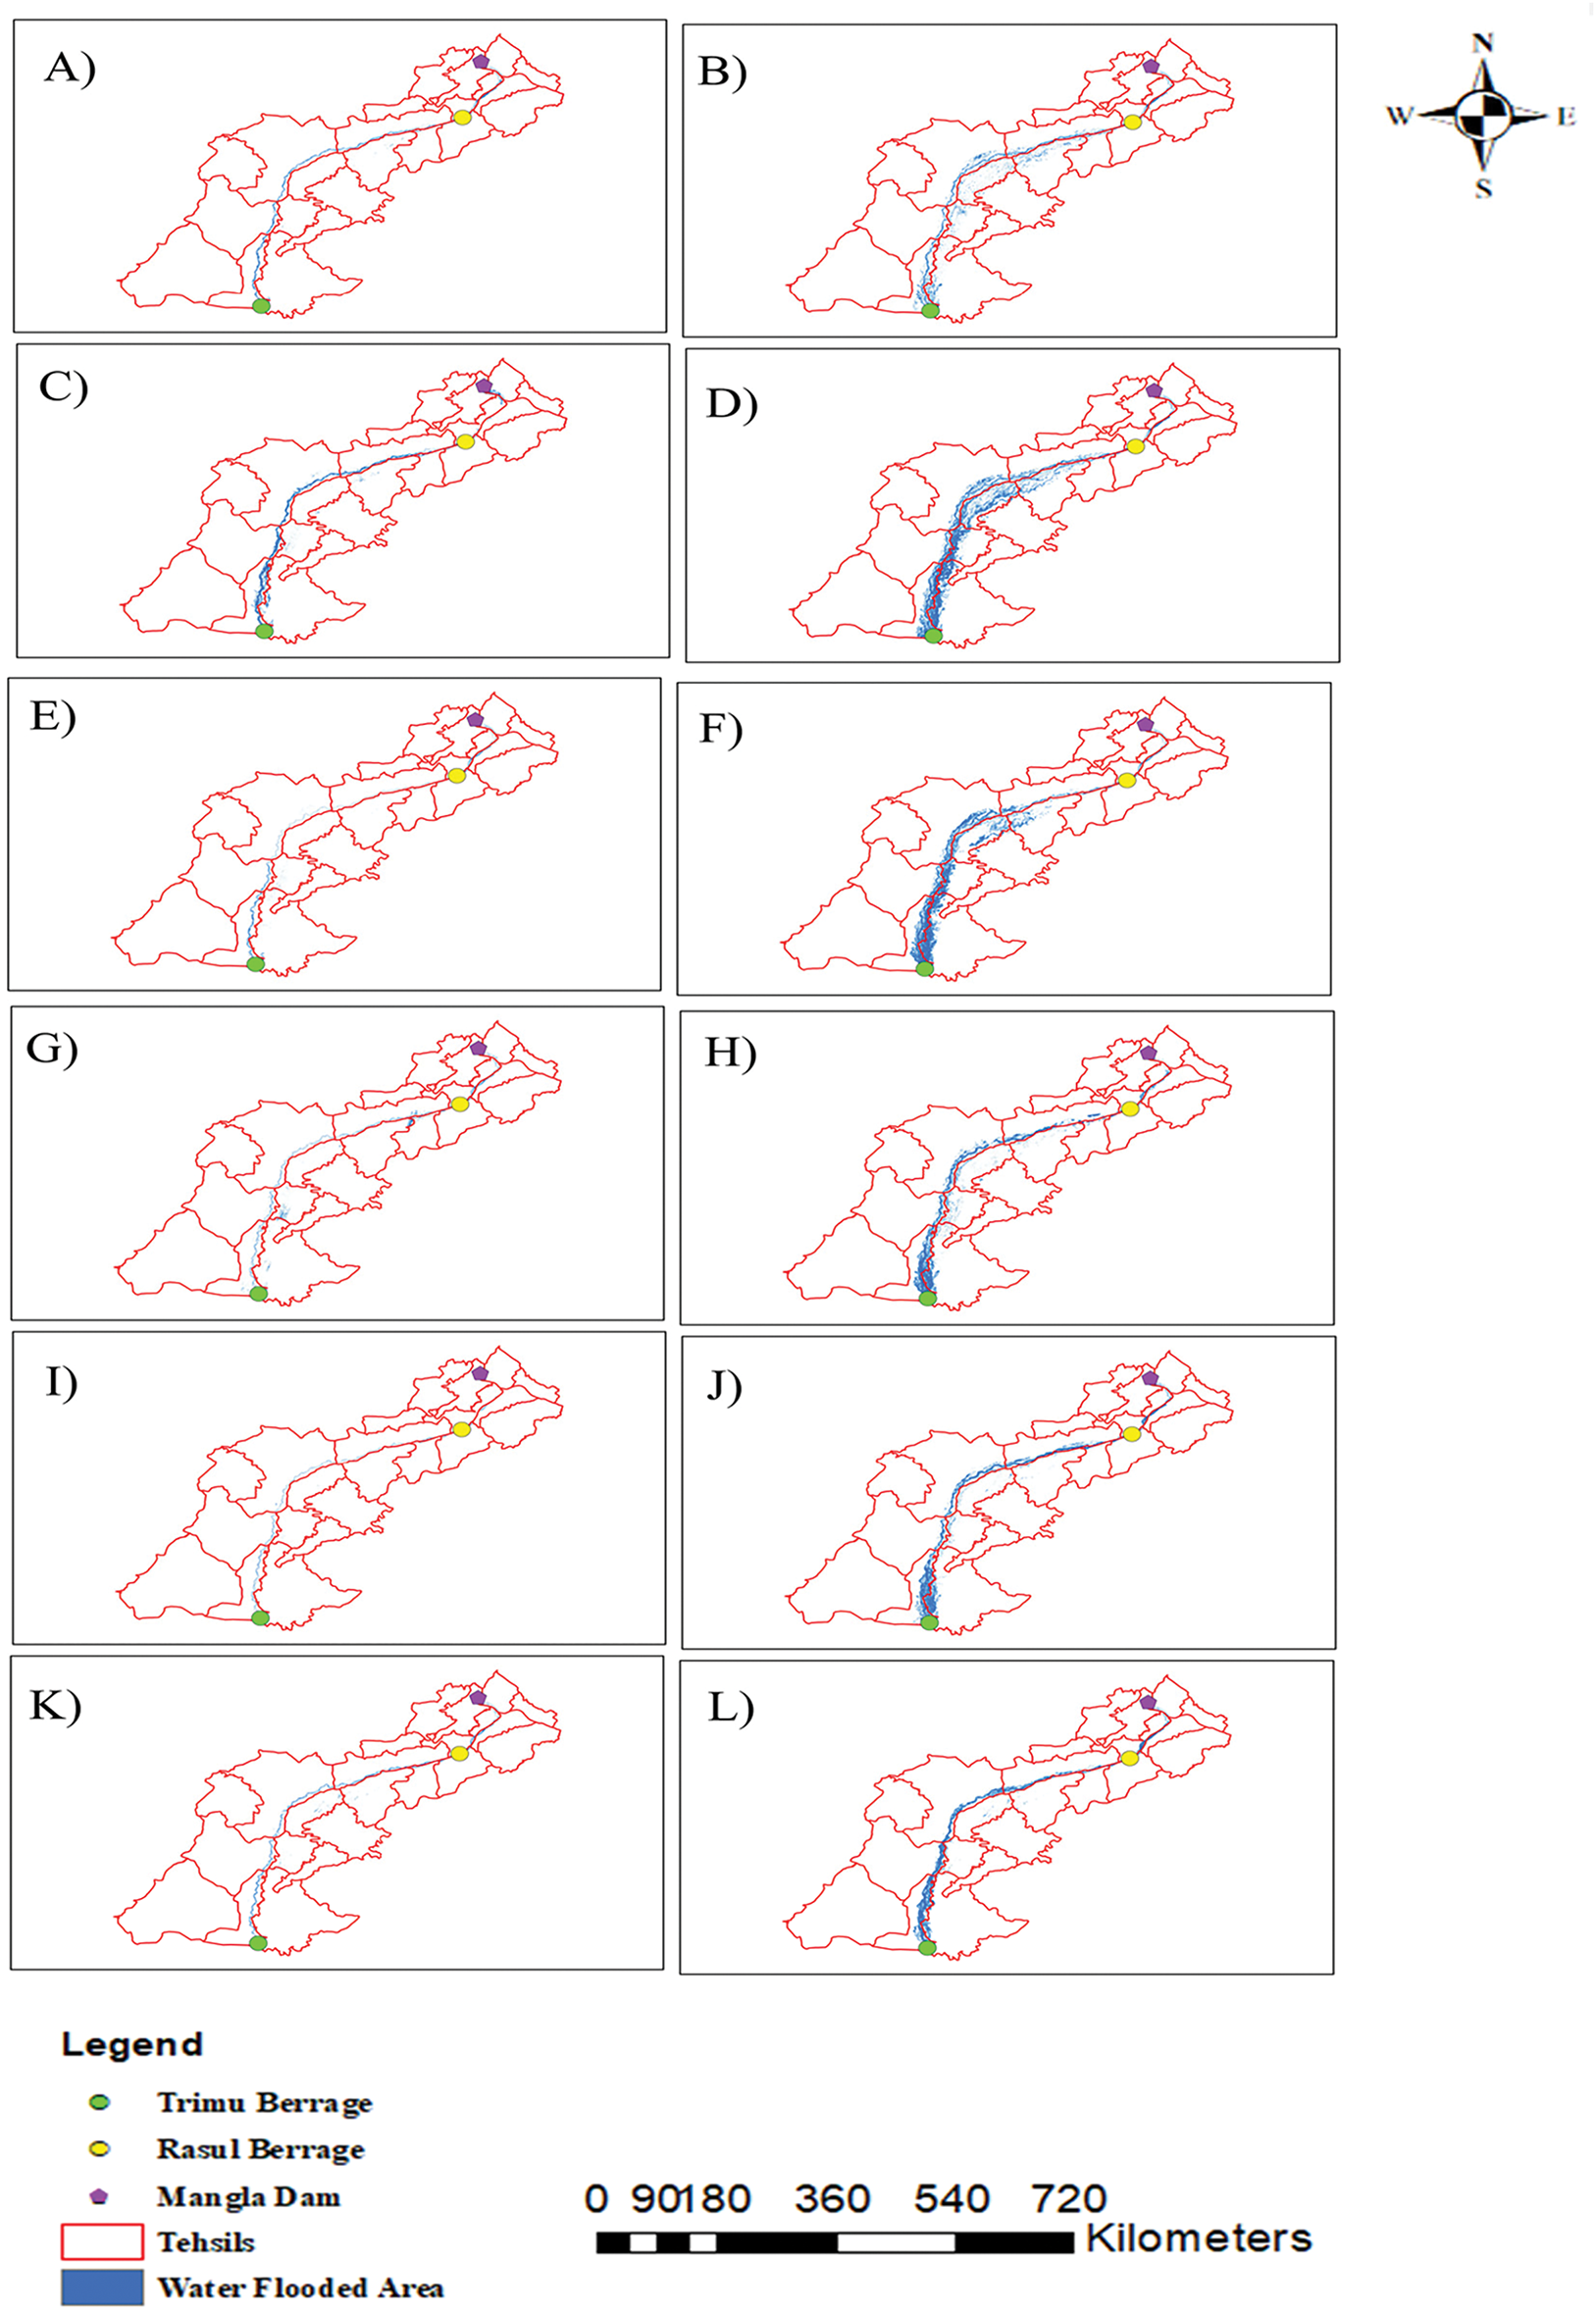
Figure 2: Spatio-temporal flood inundation in the Jhelum River Basin. The left column (A, C, E, G, I, K) shows pre-flood conditions, while the right column (B, D, F, H, J, L) illustrates post-flood inundation for 1988, 1992, 1997, 2010, 2014, and 2019
Fig. 3 represents the flood distribution area during the study period. The 1988 flood exhibited a moderate expansion in flood extent, increasing from 27.89 to 72.71 km2, with agricultural lands and low-lying settlements most affected. The 1992 flood, however, recorded the largest flood extent, surging from 58.95 to 181.02 km2, significantly surpassing historical floodplains. The 1997 flood followed a similar trajectory, with water extent increasing from 19.26 to 161.07 km2, suggesting that land-use modifications may have amplified flood severity.
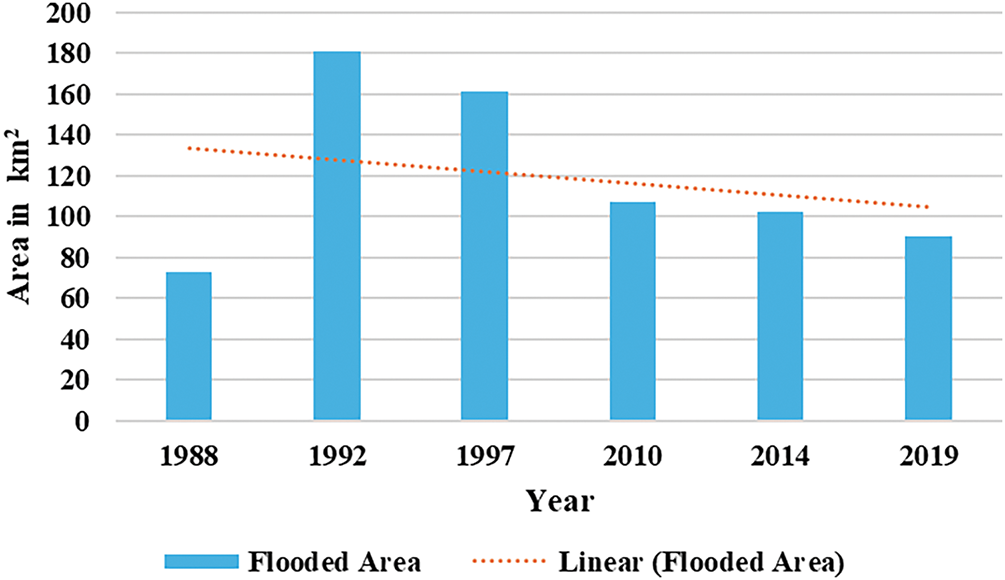
Figure 3: Flooded area distribution of different flood events
Post-2010 flood events exhibited distinct spatio-temporal patterns, characterized by localized but severe urban inundation. The 2010 flood (Fig. 2G–H) expanded from 24.96 to 107.25 km2, with prolonged water retention in low-lying agricultural zones, emphasizing the role of drainage inefficiencies. The 2014 flood showed a smaller pre-flood extent (11.97 km2) but expanded significantly post-flood to 102.11 km2, with urban infrastructure and transport networks experiencing severe waterlogging. The 2019 flood, while less extensive than previous major events, showed an increase from 26.55 to 90.72 km2, with urbanized floodplain regions demonstrating heightened vulnerability due to impervious surface expansion and inadequate drainage systems.
The progressive expansion of flood extent and shifting flood dynamics across the study period highlights three critical trends: (1) a steady increase in flood frequency, (2) a transition from purely hydrological to land-use-driven flood impacts, and (3) an escalating risk to urban settlements. The most extreme flood events (1992, 1997) exhibited extensive floodplain expansion, while post-2010 floods (2010, 2014, 2019) showed highly localized but severe urban flood risks. These patterns indicate that climate variability, anthropogenic encroachments, and inadequate flood control measures collectively exacerbate flood severity.
The findings underscore the critical need for integrating remote sensing-based flood prediction, real-time hydrological monitoring, and urban flood risk assessment. Given the increasing recurrence of extreme flood events, strengthening floodplain zoning policies, nature-based flood defenses, and AI-driven predictive flood models will be essential for mitigating future flood risks and enhancing disaster resilience in the Jhelum River Basin.
Fig. 4 presents the time series of peak discharge at Mangla Dam (1973–2022), illustrating significant inter-annual variability in river discharge magnitudes. The dataset highlights extreme hydrological events, with certain years exhibiting exceptionally high peak flows, primarily due to intense monsoonal rainfall, glacial melt contributions, and changing climatic patterns.
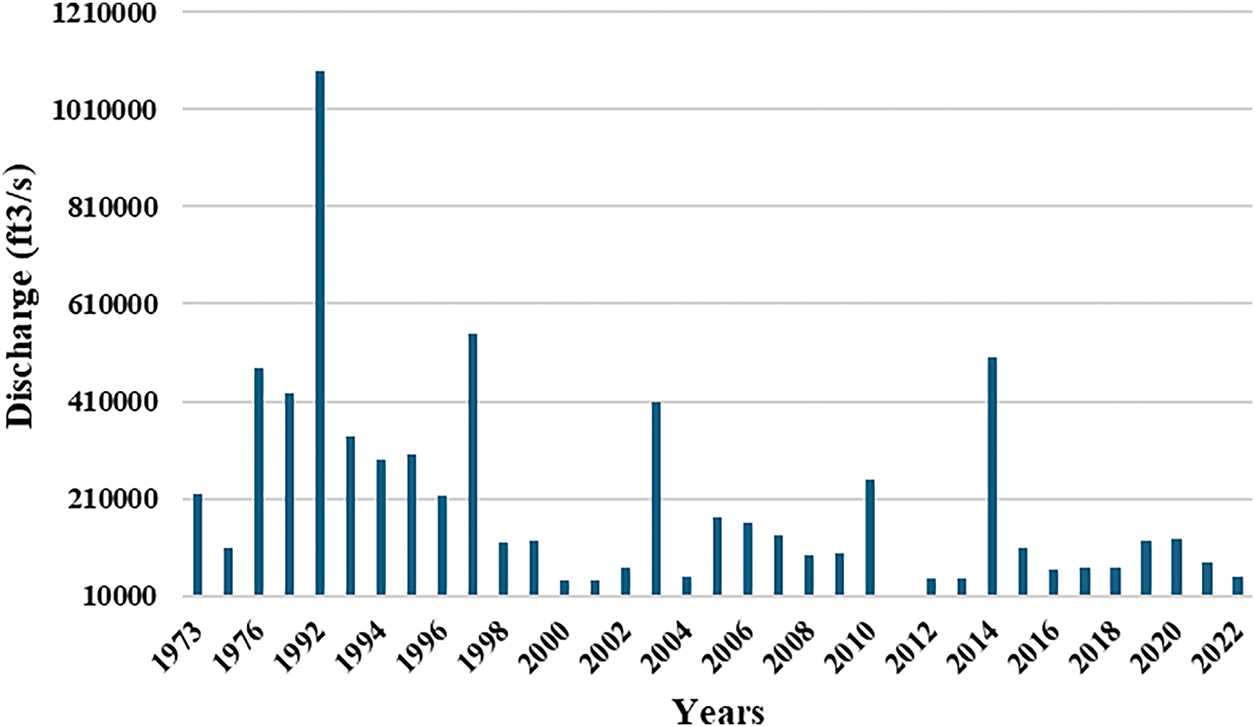
Figure 4: Peak flow at mangla dam
The highest recorded peak flow occurred in 1992, reaching 1,110,000 ft3/s, following record-breaking monsoon precipitation and extreme upstream runoff, which resulted in severe flooding across the basin. This peak discharge far exceeded historical averages, indicating an unprecedented hydrological event. Another significant peak flow was observed in 1997, with a discharge of 580,000 ft3/s, followed by another extreme event in 2014, when peak flow reached 700,000 ft3/s, likely due to prolonged heavy rainfall and excessive catchment runoff. In contrast, the lowest recorded peak discharge occurred in 2022, with only 13,000 ft3/s, reflecting a significant reduction in high-flow events in recent years.
While peak discharge fluctuates considerably, the trend over the study period suggests a gradual decline in extreme flood magnitudes. The years prior to 2000 exhibited more frequent and intense high-flow events, whereas post-2000 data show a reduction in peak discharge, which may be attributed to improved flood control infrastructure, evolving precipitation patterns, and water management strategies. However, isolated high-discharge events in 2010 and 2014 suggest that extreme hydrological occurrences persist, possibly influenced by climate change and increased glacial melt contributions. The analysis revealed that 1992 and 2014 were the most severe in terms of spatial flood extent, each affecting over 300 km2. Notably, flood-prone zones demonstrated high recurrence, particularly in low-lying regions of Sohawa and Jhelum tehsils.
The implications of these trends are critical for flood risk management and reservoir operations at Mangla Dam. The recurrence of high peak discharges above 400,000 ft3/s, particularly in 1992, 1997, and 2014, emphasizes the necessity for adaptive spillway operations and enhanced flood regulation strategies. Conversely, the reduction in peak flows after 2020 raises concerns regarding reservoir storage management, particularly in balancing flood mitigation, irrigation demands, and hydropower generation.
With shifting hydrological patterns influenced by climate variability and anthropogenic modifications, there is a growing need for integrated water resource management. Strengthening early warning systems, advancing hydrological modeling, and reassessing dam capacity under future climate scenarios will be essential in ensuring flood resilience and sustainable water resource allocation in the Jhelum River Basin.
Fig. 5 illustrates the time series of peak discharge at Rasul Barrage, highlighting both seasonal variations and long-term trends in river discharge at this key downstream control point. Like Mangla Dam, the hydrograph for Rasul Barrage exhibits a distinct seasonal pattern, with peak flows occurring primarily between July and September, coinciding with monsoonal rainfall and increased upstream runoff. Conversely, the lowest flows are consistently observed during winter and early spring (December–April), reflecting minimal precipitation and reduced glacial melt contributions during the dry season.
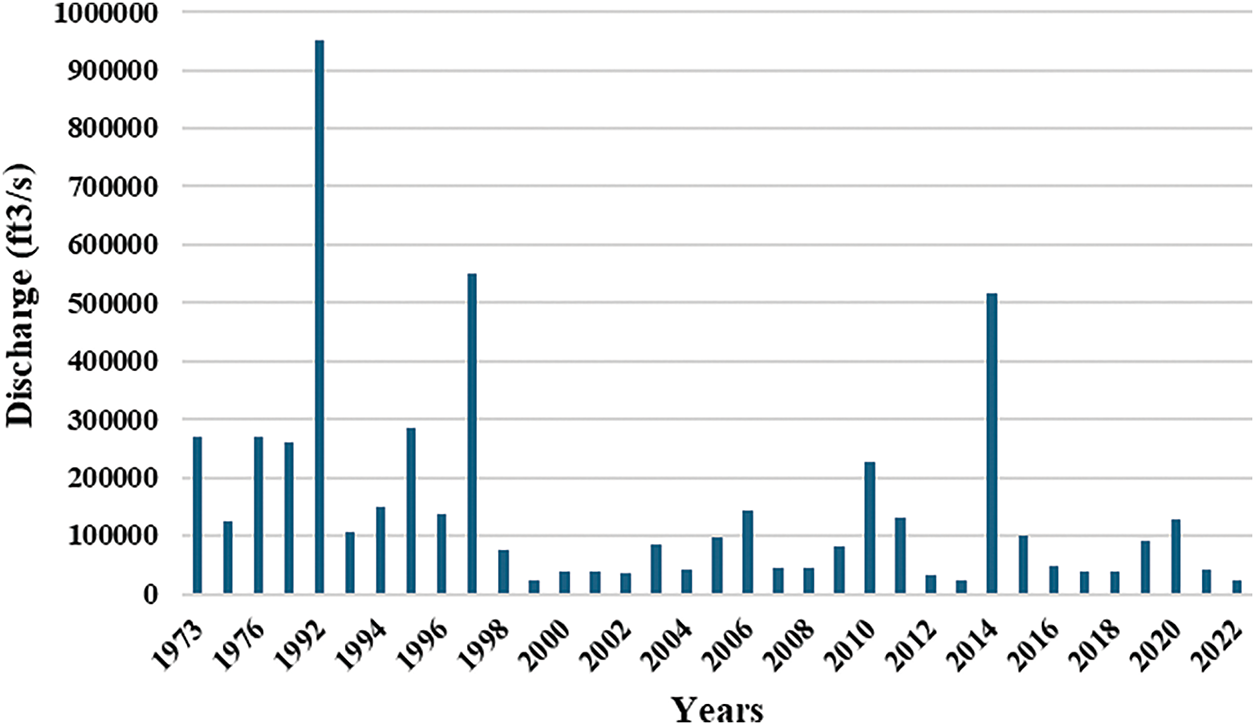
Figure 5: Peak flow at rasul barrage
While the seasonal trend at Rasul Barrage parallels that of Mangla Dam, the magnitude of peak flows differs significantly due to upstream flow regulation. The highest recorded peak discharge at Rasul Barrage occurred in 1992, reaching approximately 950,000 ft3/s, following extreme rainfall and high upstream inflows. This is notably lower than the 1,110,000 ft3/s recorded at Mangla Dam, indicating flow attenuation due to reservoir storage and controlled releases at Mangla before water reaches Rasul. Similarly, in 1997, peak flow at Rasul Barrage was approximately 580,000 ft3/s, following heavy monsoon precipitation, whereas Mangla recorded a similar peak of 580,000 ft3/s, suggesting limited attenuation during this event.
Despite the overall dampening effect of Mangla Dam on peak flows, certain years exhibit similar discharge magnitudes at both locations. For instance, in 2014, Mangla Dam recorded a peak discharge of 580,000 ft3/s, while Rasul Barrage measured 550,000 ft3/s, indicating that during periods of near-capacity storage at Mangla, controlled releases may closely match inflows, reducing the disparity in peak flows downstream. In 2022, a significantly lower flood event was observed, with Mangla registering only 13,000 ft3/s, while Rasul recorded 10,000 ft3/s, reflecting a subdued hydrological response across the system.
The long-term trend in peak flow magnitudes at Rasul Barrage suggests a shift in flood dynamics, with a decline in extreme peak flows compared to pre-2000 events. While historically, peak discharges exceeded 400,000 ft3/s more frequently, recent decades have exhibited fewer extreme flood events, likely due to improved flood control measures, changes in precipitation regimes, and evolving reservoir management strategies. However, isolated high-flow events, such as in 2010 and 2014, indicate that extreme hydrological occurrences persist, potentially driven by climate variability, increased glacial melt, and shifting monsoon patterns.
The differences in peak flow magnitudes, time lags in peak discharge, and the role of upstream regulation at Mangla Dam underscore the complex interactions between reservoir operations and downstream flood dynamics. While Mangla Dam provides critical flood attenuation, the increasing recurrence of high peak flows at Rasul Barrage in certain years highlights the need for coordinated water management strategies to optimize flood mitigation, maintain water availability, and minimize downstream flood risks. Given the increasing frequency of extreme weather events, strengthening real-time hydrological monitoring, predictive flood modeling, and adaptive reservoir management will be essential for ensuring long-term water security and flood resilience in the Jhelum River Basin. In addition to historical drivers, projected climate shifts including intensified glacial melt and altered monsoon cycles are expected to further exacerbate flood risks in the basin. Incorporating such projections into flood models will be critical for long-term resilience planning.
Fig. 6 indicates that the annual flood peaks at Trimmu Barrage from 1940 to 2022 exhibit a statistically significant decreasing trend, as confirmed by the Mann-Kendall test (p-value = 6.67 × 10⁻⁵, Tau = −0.298). This suggests that, on average, peak discharge values have been declining over the long term. However, the time series also shows sporadic extreme flood events where discharge rises sharply, demonstrating the potential for severe flooding despite the overall decreasing trend. Post-2000 analysis reveals no significant trend (p-value = 0.915), indicating relatively stable discharge variability in recent decades. These findings emphasize that although the long-term flood peaks are declining, extreme flood events still pose a considerable risk to flood-prone areas, highlighting the need for effective flood management and mitigation strategies.
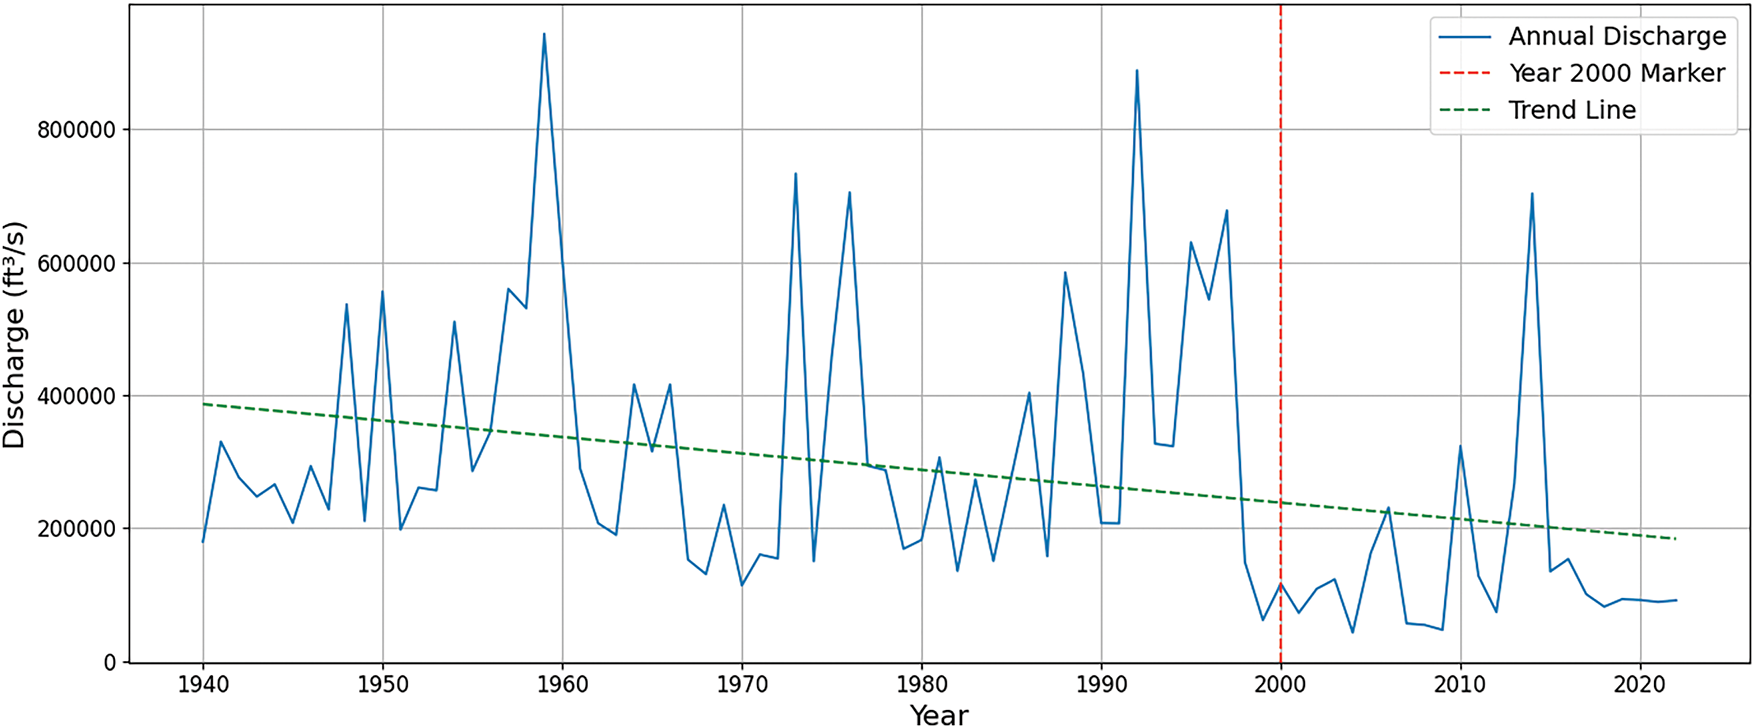
Figure 6: Flood peaks at trimmu barrage from 1940 to 2022. Discharge values are plotted at 10-year intervals along the x-axis to improve temporal clarity. The green dashed line represents the overall trend in peak discharge during the observed period
3.2 Spatio-Temporal Land Use and Land Cover
The provided maps (Fig. 7) and graph (Fig. 8) from 1988 to 2023 illustrate significant land use and land cover (LULC) changes in flood-prone tehsils, highlighting the transformation of built-up and vegetative areas over the years. Green shading shows the vegetation while red shading shows the built-up area (Fig. 7). Initially, in 1988, according to Fig. 8, vegetative areas constituted about 93.28% of the total land, while built-up areas accounted for 6.72%. By 1993, there was a slight increase in built-up areas to 7.42%, while vegetative areas slightly decreased to 92.58%. From 1998 to 2003, there was a continued trend of urban expansion, with built-up areas increasing from 8.11% to 9.05%, and vegetative areas decreasing from 91.89% to 90.95%. This period reflects gradual urbanization and the associated reduction in natural vegetative zones. Between 2008 and 2013, significant urban growth was observed, with built-up areas expanding from 10.07% to 14.10%. Consequently, vegetative areas decreased from 89.93% to 85.90%. This period saw rapid infrastructure development and increased urban sprawl into vegetative zones. From 2018 to 2023, the trend of urban expansion continued, with built-up areas increasing to 19.63% and vegetative areas decreasing to 80.37%. This reflects ongoing pressures of urbanization and the conversion of vegetative areas into urban infrastructure. The graph quantifies these changes, showing a steady increase in built-up areas from 6.72% in 1988 to 19.63% in 2023. Correspondingly, vegetative areas declined from 93.28% to 80.37%, highlighting the impacts of deforestation and urban development over the decades. These changes underscore the profound impact of urbanization on land use in flood-prone tehsils. The conversion of vegetative areas into built-up zones reduces the land’s natural resilience and increases vulnerability to flooding. Effective land management and flood mitigation strategies are crucial to mitigate these adverse impacts and promote sustainable development and resilience in these regions.
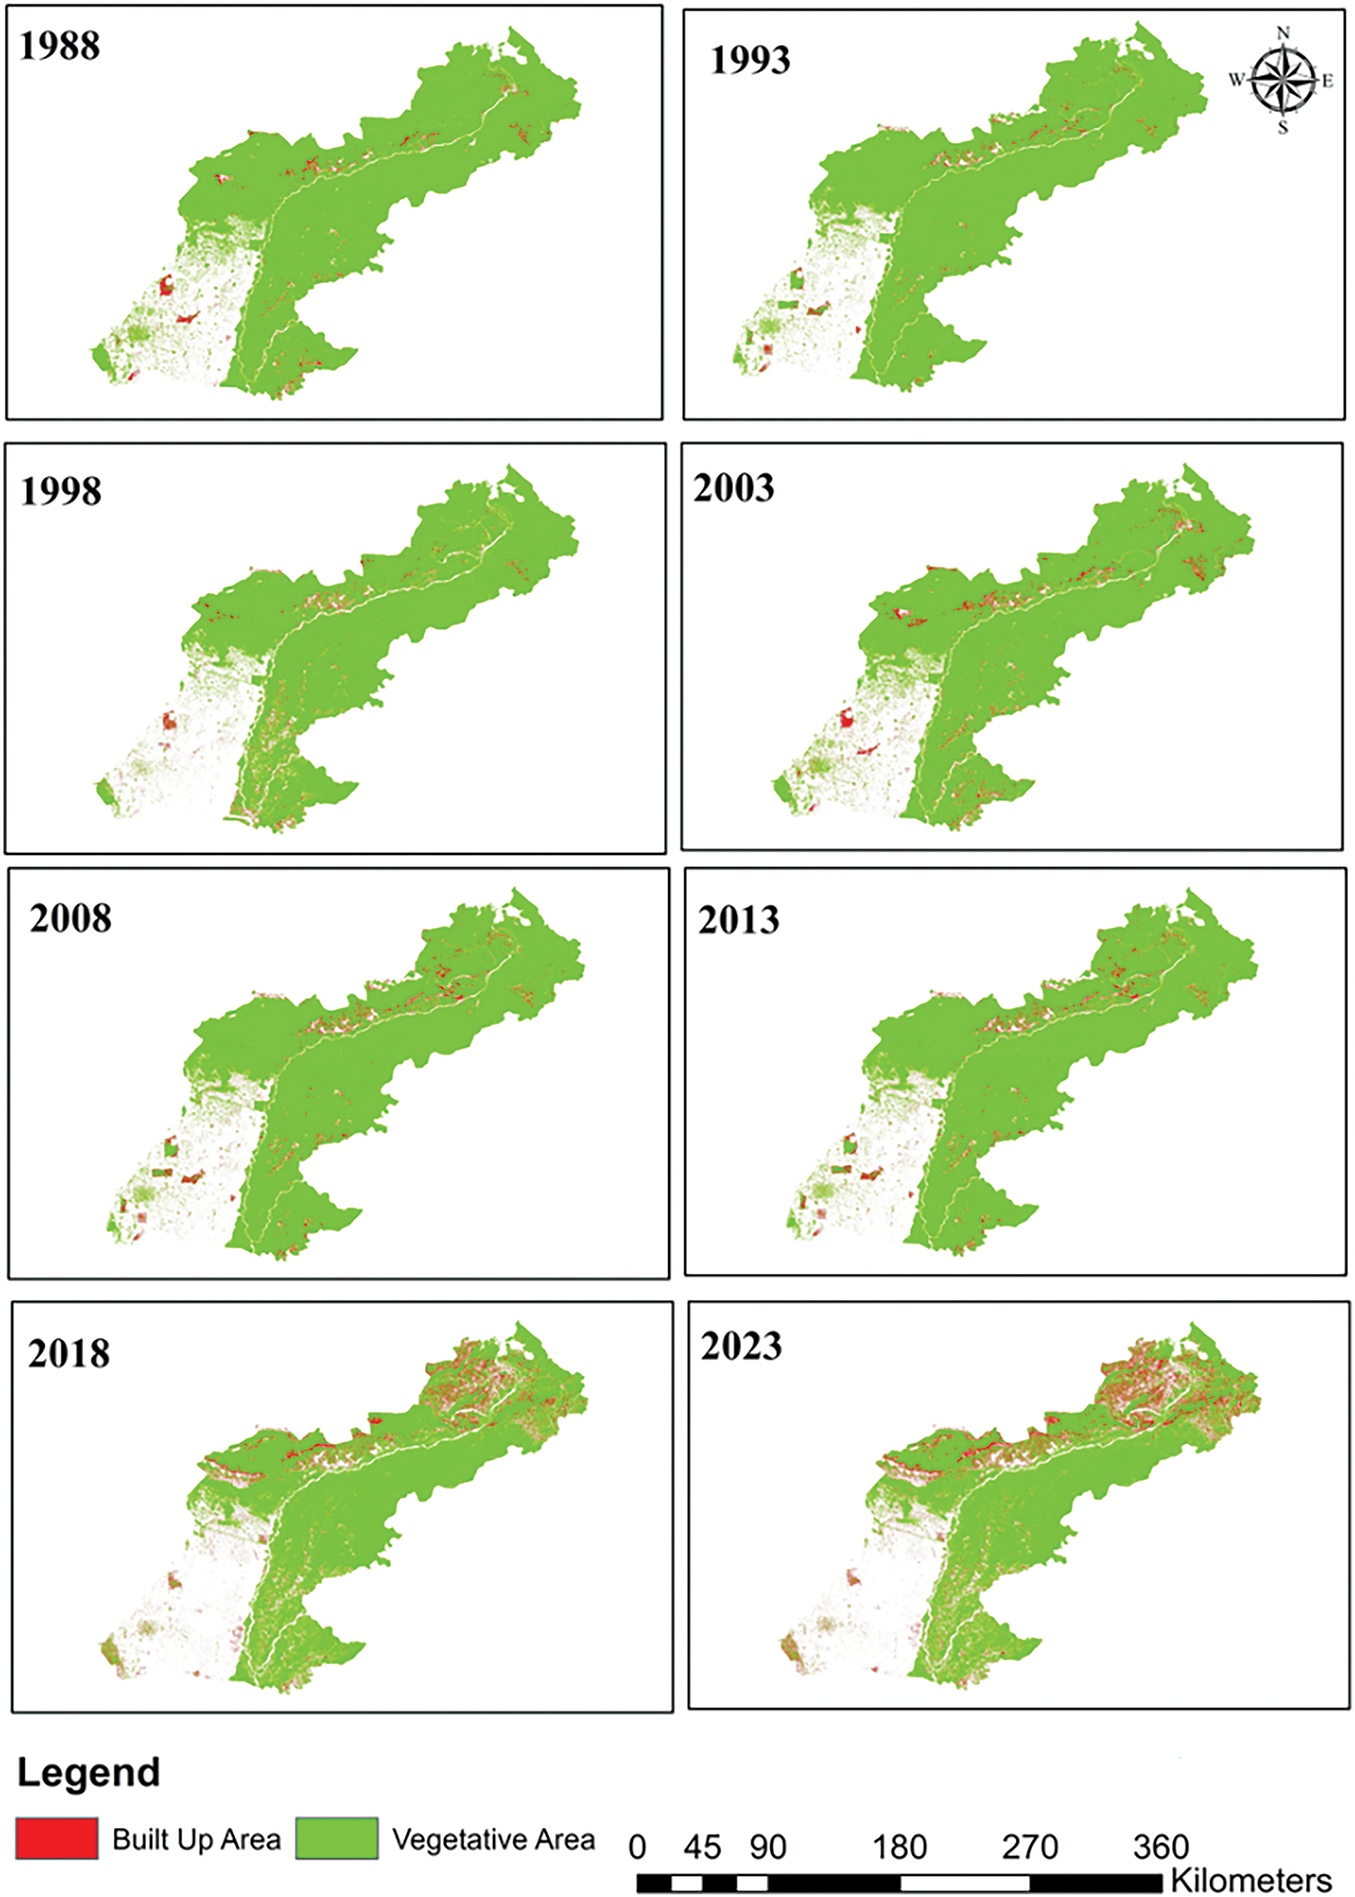
Figure 7: Land use and land cover change from 1988 to 2023 in flood prone tehsil

Figure 8: Proportional area distribution land use and land cover change in flood prone tehsils
The green areas, representing vegetation, were widespread across the region in 1988. However, by 2023, a noticeable decline in vegetative cover is observed, particularly in the southwestern and some central parts of the study area. This indicates land conversion for urban development, agriculture, or other human activities, leading to a loss of natural ecosystems that previously played a role in flood absorption and ecological balance. Simultaneously, agricultural land has experienced a significant reduction, decreasing by approximately 25% over the study period. The loss of farmland is particularly evident along the western floodplain regions, where encroachment by urban settlements and infrastructure projects has transformed what was once primarily cropland into residential and commercial zones [29]. This decline in agricultural land cover is likely to affect local livelihoods and food production while also reducing the natural absorption capacity of flood-prone areas.
In addition to urbanization and agricultural land conversion, the study reveals a decline in vegetative and forested areas, with a reduction of 15%–20% in tree cover, particularly near riverbanks and low-lying wetlands. This loss of vegetation could have long-term consequences for soil stability, groundwater recharge, and flood mitigation, as natural vegetation plays a crucial role in slowing runoff and reducing soil erosion during extreme rainfall events. The classification achieved an accuracy of 83% and a user accuracy of 85% for the LULC maps based on validation using independent samples. The Kappa coefficient was computed at 0.78, indicating substantial agreement between the classified outputs and reference data. The relatively high accuracy confirms the robustness of the Random Forest classifier, particularly when combined with NDVI and NDWI as spectral indices.
Interestingly, water bodies and wetland areas have also decreased by approximately 10%, likely due to urban encroachment, sedimentation, and the diversion of natural watercourses for infrastructure development. The reduction in wetlands may have further exacerbated flood risks, as these areas traditionally function as natural flood buffers by storing excess water during high-flow periods. Overall, the spatial patterns in LULC change indicate a clear trend of urban expansion at the expense of agricultural and vegetative land, particularly in low-lying flood-prone areas. This transformation has critical implications for flood vulnerability, as the loss of permeable surfaces and natural water retention areas increases the likelihood of surface runoff and urban flooding. The findings highlight the need for sustainable land-use planning and flood risk management strategies, such as the preservation of green spaces, improved drainage infrastructure, and strict zoning regulations to prevent excessive construction in high-risk areas. The LULC analysis over the 35-year period (1988–2023) clearly shows rapid urbanization and a corresponding decline in vegetative cover, particularly in southern and central areas. These changes have significant implications for flood risk, ecological stability, and urban planning, emphasizing the need for sustainable land-use management strategies to balance development with environmental conservation.
Fig. 8 presents the proportional distribution of land use and land cover (LULC) classes in the flood-prone tehsil from 1988 to 2023, illustrating the temporal changes in built-up and vegetative areas. The graph shows a clear and consistent increase in built-up areas (red bars) over the 35-year period, while vegetative cover (dark green bars) has declined proportionally. The proportion of built-up areas has increased significantly from less than 5% in 1988 to nearly 15% in 2023, reflecting an almost threefold rise in urbanization over the study period. The most rapid expansion occurred between 2008 and 2023, with particularly sharp growth from 2013 onward. This trend is consistent with increased population density, infrastructure development, and urban sprawl in the region. Conversely, vegetative cover, which initially accounted for nearly 90% of the total land area in 1988, experienced a steady decline, dropping to approximately 80% by 2023. While the reduction may appear moderate in percentage terms, it represents a substantial absolute loss of green areas, particularly in peri-urban and lowland regions.
This decrease corresponds with land conversion for residential, commercial, and industrial purposes, as observed in Fig. 7, which highlights significant urban expansion over time. This quantitative analysis supports the spatial trends observed in Fig. 6, where vegetative land has been replaced by built-up infrastructure, particularly in the southern and central parts of the tehsil. The increasing built-up area at the expense of vegetative cover is especially concerning in flood-prone regions, as the loss of natural vegetation reduces the landscape’s ability to absorb and slow down surface runoff, exacerbating flood risks. The LULC changes quantified in Fig. 8 confirm the trend of urban expansion and vegetative cover loss, as depicted in Fig. 6. The steady increase in built-up areas at the cost of natural vegetation underscores the need for sustainable land-use planning and flood mitigation strategies. This methodology demonstrates high replicability for similar basins across South Asia, particularly where satellite data is the only consistent information source. It also facilitates integration with LULC data to identify land use shifts in flood-prone areas, unlike static flood zoning models. Moving forward, policymakers and urban planners must focus on green infrastructure, flood-resilient urban design, and stricter zoning regulations to balance development with environmental conservation.
3.3 Flood Prone Area Distribution
Fig. 9 illustrates the spatial extent of flood inundation along the river system from Mangla Dam to Trimu Barrage, highlighting flood-prone regions based on observed and simulated data. The blue-shaded areas represent regions affected by flooding, while key hydraulic structures, including Mangla Dam (red pentagon), Rasul Barrage (yellow circle), and Trimu Barrage (green circle), are marked for reference. The flood-affected areas predominantly follow the course of the river, with extensive inundation observed along the floodplains. The map indicates that flooding is most severe in the middle and lower reaches of the study area, particularly downstream of Rasul Barrage and toward Trimu Barrage. This pattern suggests that floodwater accumulates and disperses over broader floodplain regions as they travel downstream.

Figure 9: Flood inundation area from mangla to trimu berrage
Upstream near Mangla Dam, the inundation is relatively contained within the river channel, likely due to the dam’s regulatory function in controlling water discharge. However, localized flooding may still occur due to spillovers or extreme precipitation events. Between Rasul Barrage and Trimu Barrage, the flood extent increases significantly, with wider floodplains experiencing inundation. This is likely due to a combination of reduced channel confinement, low-lying topography, and contributions from tributaries, which amplify flood spread. Near Trimu Barrage, in the southern part of the study area, flooding reaches its peak spatial extent, indicating that downstream floodplains are highly vulnerable to prolonged inundation. The presence of extensive floodplains allows for floodwater dispersion over a larger area, exacerbating potential agricultural and infrastructural damage. Several hydrological and topographical factors contribute to the spatial variability of flooding along the river system: Reservoir and barrage operations: Mangla Dam regulates upstream water flow, while Rasul and Trimu Barrages influence downstream discharge patterns. Floodplain characteristics: Areas with broader floodplains, especially downstream of Rasul and near Trimu Barrage, exhibit higher flood extents due to the availability of low-lying terrain for water accumulation. Tributary contributions: Additional inflows from smaller tributaries and local drainage networks likely contribute to increased flood extents between Rasul and Trimu Barrages.
The flood inundation patterns depicted in Fig. 8 indicate a progressive increase in flood extent from upstream to downstream reaches, with the most widespread flooding occurring near Trimu Barrage. These findings underscore the importance of integrated flood management strategies, combining structural and non-structural approaches, to mitigate flood risks in the region.
Fig. 10 presents the delineated flood-prone areas within the study region, highlighting regions that are particularly susceptible to flooding. The light blue-shaded areas represent flood-prone zones, while the dark blue lines depict the drainage network, including the main river and its tributaries. The map also marks key hydraulic structures, such as Mangla Dam (red pentagon), Rasul Barrage (yellow circle), and Trimu Barrage (green circle), which play crucial roles in flood regulation and water management. The flood-prone zones are predominantly concentrated along the major river and its tributaries, indicating that areas in close proximity to these waterways are at the highest risk of inundation. The spatial pattern suggests that flooding is not confined to a single location but is widespread across multiple regions, particularly in low-lying flood plains. The southern and central portions of the study area exhibit the largest flood-prone zones, highlighting their increased vulnerability to extreme hydrological events.
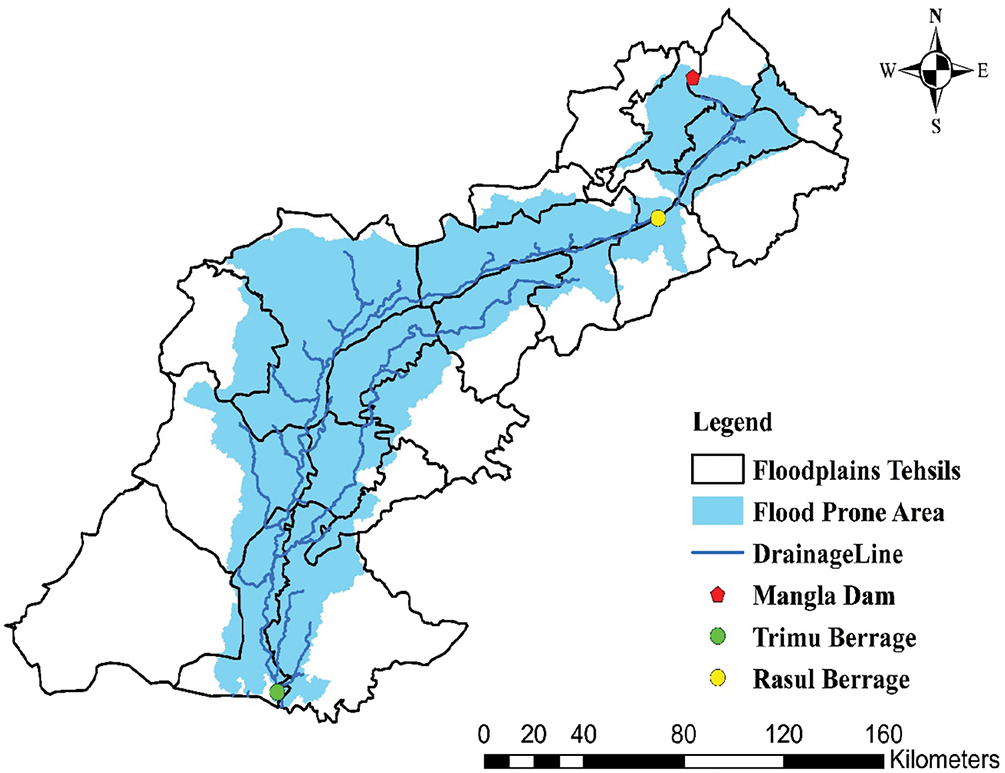
Figure 10: Map of the Jhelum River Basin showing flood susceptible areas, key hydraulic structures (Mangla Dam, Trimu Barrage, and Rasul Barrage), and drainage lines
Several geographic and topographic factors contribute to the flood susceptibility of these regions: Proximity to Major Rivers and Drainage Lines: The flood-prone areas closely follow the course of the main river and its network of tributaries, indicating that high water levels and river overflows are primary drivers of flooding. Low Elevation and Flat Terrain: The most affected regions are located in low-lying floodplains, where the relatively flat topography allows for extensive water accumulation and prolonged inundation. Hydraulic Infrastructure Influence: While Mangla Dam serves as a major flood regulation structure, its role in controlling downstream flooding is influenced by extreme weather events and high inflows. Similarly, Rasul and Trimu Barrages regulate river flow, but their operational capacities may be exceeded during extreme flood events, leading to downstream flooding. The flood-prone areas identified in Fig. 10 largely correspond to the flood inundation zones depicted in Fig. 9, confirming the consistency between hydrological modeling and flood susceptibility analysis. The extensive overlap suggests that regions historically affected by flooding are also predicted to be at high risk in future flood events. Notably, the southern part of the study area near Trimu Barrage shows significant flood susceptibility, which aligns with the flood inundation patterns observed in Fig. 9.
Given the widespread distribution of flood-prone areas, effective flood management strategies must be implemented to minimize potential damage. Early Warning Systems and Monitoring: Continuous hydrological monitoring and real-time flood forecasting are essential for mitigating risks, particularly in densely populated and agricultural areas within flood-prone zones. Structural Mitigation Measures: The construction of levees, embankments, and flood diversion channels may help reduce the extent of inundation in highly vulnerable regions. Land-Use Planning and Policy Interventions: Restricting infrastructure development in high-risk flood zones and promoting sustainable land-use practices can help minimize flood-related damages. The analysis in Fig. 10 highlights the spatial extent and distribution of flood-prone areas, demonstrating their strong correlation with major river systems, low-lying floodplains, and historical flood inundation zones. These findings underscore the need for integrated flood management approaches, combining both structural and non-structural measures, to enhance flood resilience and reduce long-term disaster risks.
The spatio-temporal analysis of flood events in the Jhelum River Basin from 1988 to 2023 reveals significant variability in flood discharge and land use and land cover (LULC) changes. The hydrological analysis, based on peak discharge at Mangla Dam and Rasul Barrage shows extreme hydrological events, particularly in 1992 and 1997, with peak flows reaching 1,110,000 ft3/s and 950,000 ft3/s, respectively. These events were primarily driven by intense monsoonal rainfall and extreme upstream runoff, highlighting the impact of climatic variability on flood dynamics. The decline in peak discharge post-2000 suggests improvements in flood control infrastructure and evolving precipitation patterns, possibly attributed to regional climate adaptation measures and enhanced water resource management.
The LULC analysis indicates rapid urbanization and a corresponding decline in vegetative cover. The increase in built-up areas from 6.72% in 1988 to 19.63% in 2023, and the decrease in vegetative areas from 93.28% to 80.37%, highlight the transformation of the landscape. This urban expansion, particularly in low-lying flood-prone areas, reduces natural resilience and increases vulnerability to flooding. The reduction in agricultural land and wetland areas further exacerbates flood risks by diminishing natural water retention capacities. Urban sprawl, especially in peri-urban and flood-prone zones, diminishes the natural retention capacity of the land, thereby exacerbating flood risks [30,31].
The flood-prone area distribution analysis shows that flooding is most severe in the middle and lower reaches of the study area, particularly downstream of Rasul Barrage and toward Trimu Barrage. The spatial extent of flood inundation aligns with flood-prone zones identified in the LULC analysis, confirming the high vulnerability of these regions. The presence of extensive floodplains and low-lying terrain allows for widespread water accumulation, exacerbating potential agricultural and infrastructural damage.
This study’s findings line up with and expand upon previous research on the flood risk in the flood-prone regions. Working upstream from this study area, Ahmad et al. [32] examined extreme precipitation patterns and their impacts on hydrology dynamics and flood events in the Jhelum River Basin. They found, as this study did, that overall rainfall amounts were not significantly changing (in fact, they were slightly decreasing), but the intensity and frequency of 100-year events, or extreme precipitation, were going up, and those are the sorts of events that lead to flash flooding. Again, we see the alignment of findings here, where the crazy, intense, heavy rain that we’re experiencing in 2023 over a couple of days is not the same sort of cumulative rainfall that leads to a 100-year-type event. Other studies conducted in different river basins, like the Ghagra River Basin, have shown comparable spatio-temporal variability in flood events. One such study by Cuo [13] looked into the causes for this variability and came up with some interesting findings.
Furthermore, studies conducted in other regions of Pakistan, including Waseem et al. [16], who undertook an exposure and vulnerability assessment of urban flood risk using AHP and geospatial techniques, found that the increased pace of urbanization in flood-prone areas has substantially raised flooding vulnerability. They concur with the conclusion of this study that sprawl in topographically low settings, with or without poor drainage systems, greatly enhances the likelihood of flooding not just during atypical high-rainfall events but also in the big snowmelt years.
Moreover, investigations carried out by Malik et al. [33] into flood vulnerability in the Jhelum River Basin has reinforced the understanding that flood risk management necessitates both structural and non-structural components. These components encompass a range of regulatory, forecasting, and monitoring systems that feed into a more rigorous real-time flood risk decision-making process, which ultimately helps in saving lives and property. The case study highlights that much like the combination of surgical and medical interventions that save lives in the instance of a heart attack, an effective flood risk management strategy requires the combination of structural (like dams and levees) and nonstructural (like regulatory and environmental management) approaches. The situation in the Jhelum River Corridor is serious, and the research implications are instructive for many mountainous basins around the world.
The findings of this study underscore the urgent need for adaptive flood management strategies and sustainable land-use planning to reduce flood risks in the Jhelum River Basin. The recurrence of high peak discharges, particularly in the 1992 and 1997 floods, emphasizes the necessity for adaptive spillway operations and enhanced flood regulation strategies at key hydrological structures, such as Mangla Dam. While flood control infrastructure has mitigated some flood risks, the decline in peak flows post-2020 raises concerns about reservoir storage management. This shift may indicate a change in flood patterns that could impact the balance between flood mitigation, irrigation demands, and hydropower generation, making it crucial for flood management strategies to adapt to evolving hydrological conditions.
The transformation of vegetative and agricultural land into urban infrastructure significantly reduces the landscape’s natural resilience to flooding. As built-up areas replace permeable surfaces, the capacity of the land to absorb and slow down runoff is diminished, leading to increased surface water flow and exacerbated flood risks, particularly in urbanized floodplains. Therefore, the integration of effective land management and flood mitigation strategies is crucial to promoting sustainable development and enhancing flood resilience. Similar methodologies have shown promising results in other flood-prone regions of Pakistan. For example, a recent study in Sindh utilized cloud-based platforms and open geospatial datasets to enhance flood mapping accuracy, demonstrating the scalability and relevance of such approaches for regional flood impact assessment [34]. Preservation of green spaces, improvement of drainage infrastructure, and the implementation of strict zoning regulations to limit development in flood-prone areas are essential steps toward mitigating these adverse impacts.
The widespread distribution of flood-prone areas across the Jhelum River Basin highlights the need for an integrated flood management approach, combining both structural and non-structural measures. Structural measures, such as the construction of levees, embankments, and flood diversion channels, can help reduce the extent of inundation in highly vulnerable regions. However, these should be complemented by non-structural measures, including the establishment of early warning systems, continuous hydrological monitoring, and real-time flood forecasting. Such measures are critical for reducing the risk of flood-related damage, especially in densely populated and agricultural areas. To minimize flood-related damage and build resilience in the Jhelum River Basin, flood management strategies must be adaptive, inclusive, and forward-looking, incorporating a combination of structural defenses, land-use planning, and climate-resilient infrastructure. Implementing these measures will not only reduce flood risk but also support sustainable urban development, protect local livelihoods, and maintain the ecological integrity of flood-prone areas.
While this study provides valuable insights into the spatio-temporal dynamics of flooding and the impacts of land-use changes in the Jhelum River Basin, several limitations must be acknowledged. These limitations primarily stem from data constraints, the scope of the analysis, and the methodologies employed, which could impact the accuracy and generalizability of the results. Given the rapid pace of climate change, future flood events may differ significantly in terms of magnitude and frequency from those observed in the historical dataset. As such, the study’s findings may not fully reflect the evolving nature of flood risk in the face of climate variability and future hydrological changes [35]. Although the use of the Normalized Difference Water Index (NDWI) and Modified Normalized Difference Water Index (MNDWI) provided a useful means of delineating flood extents, these indices are primarily sensitive to surface water bodies and may not capture all factors influencing flood dynamics. For example, the indices may not account for subsurface water levels, soil saturation, or groundwater flow, which can significantly influence flood extent, especially in areas with high groundwater tables. While NDWI and MNDWI are effective in detecting surface water bodies, they may not provide a comprehensive view of flood dynamics, particularly in areas with complex hydrological characteristics [36]. However, integrating Synthetic Aperture Radar (SAR) imagery such as from Sentinel-1, can significantly enhance flood mapping accuracy under cloud cover and in vegetated or urban areas, effectively addressing the key limitations of optical indices like NDWI and MNDWI, which are constrained by atmospheric conditions and surface cover heterogeneity.
The study highlighted the impact of urbanization on flood vulnerability, especially the transformation of flood-prone areas into built-up zones (Fig. 7). The increase in built-up areas of 19.63% between 1988 and 2023 in flood-prone tehsils clearly illustrates unregulated urban sprawl, despite the well-known risk of recurring floods in these zones. This pattern of expansion often occurs without proper land-use planning or enforcement of zoning regulations, placing a growing number of residents and businesses at annual risk. In the Jhelum River Basin, flood-prone tehsils have seen rapid unregulated urban expansion in recent decades. Geospatial flood vulnerability assessments demonstrate that almost 5% of the Upper Jhelum Basin’s floodplains are occupied, affecting approximately 300,000 residents, mainly in areas with informal housing, high density, and inadequate flood protection infrastructure [37] Historical flood analyses, such as those from the catastrophic 2010 monsoon floods, link poor land-use regulation and encroachment into floodplains with severe property damage, infrastructure collapse, and higher loss of life highlighting the direct link between unplanned development and flood exposure [38]. Another study reported that approximately 40% of the population experienced displacement due to flooding. The proportion of low-income individuals declined by 9%, while those with moderate incomes fell by 22%. Nearly half of the respondents (48.7%) reported a complete loss of income following the flood. Health impacts were also notable, with 83.4% indicating they had developed an illness or disability post-flood, a sharp rise from 16.4% prior. Additionally, 92.8% believed that the floods had negatively impacted public health and sanitation in their communities. Food insecurity increased as well by 22.6% of individuals reported greater difficulty accessing food in the aftermath of the flood. Alarmingly, 59.9% admitted to having no knowledge of proper evacuation measures before the event [39]. While the overall decline in peak discharge at Trimmu Barrage suggests a reduction in average flood intensity over time, the presence of intermittent extreme events indicates that flood risks remain significant (Fig. 6). The absence of a discernible trend post-2000 further suggests a shift toward more variable but less predictable flood behavior in recent decades. These findings highlight the continued need for robust floodplain management and infrastructure planning to mitigate potential damage from episodic high-flow events.
While the study provides a robust analysis of historical flood events and land-use changes, it does not fully predict future flood dynamics, especially considering potential climate change scenarios. Climate change projections suggest that flood patterns may shift in terms of frequency, intensity, and spatial distribution, but these projections were not incorporated into the study. Future research should integrate climate change models to better predict future flood occurrences and assess the potential impacts on flood vulnerability and land-use patterns [40].
Despite these limitations, the study provides a comprehensive analysis of the spatio-temporal dynamics of flooding in the Jhelum River Basin and the role of land-use changes in flood vulnerability. The findings offer valuable insights into future flood management strategies and urban planning, although further research incorporating advanced hydrological modeling, climate change projections, and finer-scale data will be essential for refining flood risk assessments and improving mitigation strategies. Furthermore, anticipated climatic shifts including accelerated glacial melt and altered monsoon dynamics are expected to escalate future flood hazards in the Jhelum Basin. Incorporating these projections into flood modeling frameworks is crucial for developing resilient and forward-looking mitigation strategies [41].
This study has provided a comprehensive analysis of the spatio-temporal dynamics of flood events and land-use changes in the Jhelum River Basin, utilizing multi-sensor remote sensing data and historical hydrological records. By embedding such approaches into regional disaster management frameworks, long-term resilience to extreme hydrological events can be achieved. The analysis revealed that the Jhelum River Basin has experienced several major flood events over the past few decades, with the most catastrophic years being 1992 and 1997. During these years, flood extents reached 181.02 and 161.07 km2, respectively, causing significant damage to agricultural lands and low-lying urban settlements. Notably, flood events in 2010, 2014, and 2019 exhibited distinct patterns of localized urban inundation, highlighting the increasing flood risk in areas with poor drainage infrastructure. The increase in flood extent from 1988 to 2019, from 27.89 km2 to over 107 km2 in some instances, indicates a clear trend toward more frequent and intense floods in the region. The study also highlighted a significant transformation in land use and land cover (LULC) over the past 35 years. Built-up areas in flood-prone regions increased from 6.72% in 1988 to 19.63% by 2023, while vegetative areas declined from 93.28% to 80.37%. The reduction in agricultural land cover by approximately 25% is particularly notable along floodplain regions, where encroachment by urban settlements and infrastructure projects has led to increased flood susceptibility. Hydrological data from key monitoring stations, such as Mangla Dam and Rasul Barrage, indicated a reduction in peak discharge post-2000, suggesting improvements in flood control infrastructure. However, isolated high-discharge events, particularly in 2010 and 2014, demonstrate that extreme hydrological occurrences continue to pose a significant risk. The combined effects of climatic variability, urbanization, and altered land-use practices require comprehensive, integrated flood management strategies. Future research should focus on dynamic flood forecasting, integration of real-time hydrometeorological inputs, and modeling socio-economic exposure and adaptive capacity at finer spatial scales. This would enhance both the predictive power and policy relevance of flood risk assessments. Importantly, the proposed spectral index methodology and findings are transferable to other data-limited basins in South Asia, Sub-Saharan Africa, and beyond. Finally, the study underscores the urgent need to embed remote sensing tools into regional flood management systems. Forward-looking strategies including climate-resilient infrastructure, AI-assisted flood prediction, and nature-based solutions, will be vital for mitigating risks and building long-term resilience in rapidly urbanizing river basins like Jhelum.
Acknowledgement: Not applicable.
Funding Statement: The authors received no specific funding for this study.
Author Contributions: The authors confirm contribution to the paper as follows: Conceptualization, Usama Naeem and Ihsan Qadir; methodology, Usama Naeem; software, Ihsan Qadir; validation, Usama Naeem, Ahmed Nouman and Jun Wu; formal analysis, Ihsan Qadir and Usama Naeem; data curation, Ahmed Nouman; writing—original draft preparation, Usama Naeem; writing—review and editing, Aamir Raza, Ihsan Qadir and Jun Wu; visualization, Ahmed Nouman; supervision, Jun Wu. All authors reviewed the results and approved the final version of the manuscript.
Availability of Data and Materials: Data available on request from the authors.
Ethics Approval: Not applicable.
Conflicts of Interest: The authors declare no conflicts of interest to report regarding the present study.
Disclaimer: The findings and conclusions in this publication are those of the authors and should not be construed to represent any official or government determination or policy.
References
1. Jonkman SN, Curran A, Bouwer LM. Floods have become less deadly: an analysis of global flood fatalities 1975–2022. Nat Hazards. 2024;120(7):6327–42. doi:10.1007/s11069-024-06444-0. [Google Scholar] [CrossRef]
2. Ahmadi SM, Balahang S, Abolfathi S. Predicting the hydraulic response of critical transport infrastructures during extreme flood events. Eng Appl Artif Intell. 2024;133(2):108573. doi:10.1016/j.engappai.2024.108573. [Google Scholar] [CrossRef]
3. Riazi M, Bateni SM, Jun C, Farooque AA, Khosravi K, Abolfathi S. Enhancing rainfall-runoff simulation in da-ta-poor watersheds: integrating remote sensing and hybrid decomposition for hydrologic modelling. Water Resour Manage [Internet]. 2025 [cited 2025 Oct 30]. Available from: https://link.springer.com/10.1007/s11269-025-04215-5. [Google Scholar]
4. Ionno A, Arsenault R, Troin M, Martel JL, Brissette F. Impacts of climate change on flood volumes over North American catchments. J Hydrol. 2024;630(3):130688. doi:10.1016/j.jhydrol.2024.130688. [Google Scholar] [CrossRef]
5. Tang Z, Wang P, Li Y, Sheng Y, Wang B, Popovych N, et al. Contributions of climate change and urbanization to urban flood hazard changes in China’s 293 major cities since 1980. J Environ Manage. 2024;353(20):120113. doi:10.1016/j.jenvman.2024.120113. [Google Scholar] [PubMed] [CrossRef]
6. Venkata Rao G, Nagireddy NR, Keesara VR, Sridhar V, Srinivasan R, Umamahesh NV, et al. Real-time flood forecasting using an integrated hydrologic and hydraulic model for the Vamsadhara and Nagavali basins, Eastern India. Nat Hazards. 2024;120(7):6011–39. doi:10.1007/s11069-023-06366-3. [Google Scholar] [CrossRef]
7. Shah AI, Pan ND. Flood susceptibility assessment of Jhelum River Basin: a comparative study of TOPSIS, VIKOR and EDAS methods. Geosyst Geoenviron. 2024;3(4):100304. doi:10.1016/j.geogeo.2024.100304. [Google Scholar] [CrossRef]
8. Bhat MS, Alam A, Ahmad S, Farooq H, Ahmad B. Flood hazard assessment of upper Jhelum basin using morphometric parameters. Environ Earth Sci. 2019;78(2):54. doi:10.1007/s12665-019-8046-1. [Google Scholar] [CrossRef]
9. Gacul LA, Ferrancullo D, Gallano R, Fadriquela KJ, Mendez KJ, Morada JR, et al. GIS-based identification of flood risk zone in a rural municipality using fuzzy analytical hierarchy process (FAHP). Revue Internationale de Géomatique. 2024;33(1):295–320. doi:10.32604/rig.2024.055085. [Google Scholar] [CrossRef]
10. Kunwar S, Ferdush J. Mapping of land use and land cover (LULC) using EuroSAT and transfer learning. Revue Internationale de Géomatique. 2024;33(1):1–13. doi:10.32604/rig.2023.047627. [Google Scholar] [CrossRef]
11. Faheem Z, Kazmi JH, Shaikh S, Arshad S, Noreena, Mohammed S. Random forest-based analysis of land cover/land use LCLU dynamics associated with meteorological droughts in the desert ecosystem of Pakistan. Ecol Indic. 2024;159:111670. doi:10.1016/j.ecolind.2024.111670. [Google Scholar] [CrossRef]
12. Alshammari E, Rahman AA, Rainis R, Abu Seri N, Ahmad Fuzi NF. The impacts of land use changes in urban hydrology, runoff and flooding: a review. Curr Urban Stud. 2023;11(1):120–41. doi:10.4236/cus.2023.111007. [Google Scholar] [CrossRef]
13. Cuo L. Land use/Cover change impacts on hydrology in large river basins: a review. In: Tang Q, Oki T, editors. Geophysical monograph series [Internet]. 1st ed. Hoboken, NJ, USA: John Wiley & Sons, Inc.; 2016 [cited 2025 Oct 11]. Available from: https://agupubs.onlinelibrary.wiley.com/doi/10.1002/9781118971772.ch6. [Google Scholar]
14. McGrane SJ. Impacts of urbanisation on hydrological and water quality dynamics, and urban water management: a review. Hydrol Sci J. 2016;61(13):2295–311. doi:10.1080/02626667.2015.1128084. [Google Scholar] [CrossRef]
15. Stephens CM, Lall U, Johnson FM, Marshall LA. Landscape changes and their hydrologic effects: interactions and feedbacks across scales. Earth Sci Rev. 2021;212(7):103466. doi:10.1016/j.earscirev.2020.103466. [Google Scholar] [CrossRef]
16. Waseem M, Ahmad S, Ahmad I, Wahab H, Leta MK. Urban flood risk assessment using AHP and geospatial techniques in swat Pakistan. SN Appl Sci. 2023;5(8):215. doi:10.1007/s42452-023-05445-1. [Google Scholar] [CrossRef]
17. Bhutta ZA, Bhutta SZ, Raza S, Sheikh AT. Addressing the human costs and consequences of the Pakistan flood disaster. Lancet. 2022;400(10360):1287–9. doi:10.1016/S0140-6736(22)01874-8. [Google Scholar] [PubMed] [CrossRef]
18. Manzoor Z, Ehsan M, Khan MB, Manzoor A, Akhter MM, Sohail MT, et al. Floods and flood management and its socio-economic impact on Pakistan: a review of the empirical literature [Internet]. 2022 [cited 2025 Oct 1]. Available from: https://www.frontiersin.org/journals/environmental-science/articles/10.3389/fenvs.2022.1021862/full. [Google Scholar]
19. Sohail M, Mahmood S. Flood susceptibility modeling using geo-morphometric ranking approach in Jhelum River basin. Pakistan Nat Hazards Res. 2024;4(2):187–93. doi:10.1016/j.nhres.2023.11.004. [Google Scholar] [CrossRef]
20. Liu L, Yin J, Wang J, Alias AH, Haron NA, Abu Bakar N. Urban flood resilience evaluation in China: a systematic review of frameworks, methods, and limitations. Geomat Nat Hazards Risk. 2025;16(1):2445631. doi:10.1080/19475705.2024.2445631. [Google Scholar] [CrossRef]
21. Nazir U, Waseem MA, Khan FS, Saeed R, Hasan SM, Uppal M, et al. Improved flood mapping for efficient pol-icy design by fusion of Sentinel-1, Sentinel-2, and Landsat-9 imagery to identify population and infrastructure exposed to floods [Internet]. 2023 [cited 2025 Oct 30]. Available from: https://arxiv.org/abs/2306.06074. [Google Scholar]
22. Chakraborty S, Mukhopadhyay S. Assessing flood risk using analytical hierarchy process (AHP) and geographical information system (GISapplication in Coochbehar district of West Bengal. India Nat Hazards. 2019;99(1):247–74. doi:10.1007/s11069-019-03737-7. [Google Scholar] [CrossRef]
23. McFeeters SK. The use of the normalized difference water index (NDWI) in the delineation of open water features. Int J Remote Sens. 1996;17(7):1425–32. doi:10.1080/01431169608948714. [Google Scholar] [CrossRef]
24. Xu H. Modification of normalised difference water index (NDWI) to enhance open water features in remotely sensed imagery. Int J Remote Sens. 2006;27(14):3025–33. doi:10.1080/01431160600589179. [Google Scholar] [CrossRef]
25. Singh KV, Setia R, Sahoo S, Prasad A, Pateriya B. Evaluation of NDWI and MNDWI for assessment of waterlogging by integrating digital elevation model and groundwater level. Geocarto Int. 2015;30(6):650–61. doi:10.1080/10106049.2014.965757. [Google Scholar] [CrossRef]
26. Szabó S, Gácsi Z, Balázs B. Specific features of NDVI, NDWI and MNDWI as reflected in land cover categories. Landsc Environ. 2019;10(3–4):194–202. doi:10.21120/le/10/3-4/13. [Google Scholar] [CrossRef]
27. Belgiu M, Drăguţ L. Random forest in remote sensing: a review of applications and future directions. ISPRS J Photogramm Remote Sens. 2016;114(Part A):24–31. doi:10.1016/j.isprsjprs.2016.01.011. [Google Scholar] [CrossRef]
28. Nasiri V, Deljouei A, Moradi F, Sadeghi SMM, Borz SA. Land use and land cover mapping using sentinel-2, landsat-8 satellite images, and google earth engine: a comparison of two composition methods. Remote Sens. 2022;14(9):1977. doi:10.3390/rs14091977. [Google Scholar] [CrossRef]
29. Idowu D, Zhou W. Land use and land cover change assessment in the context of flood hazard in Lagos state. Nigeria Water. 2021;13(8):1105. doi:10.3390/w13081105. [Google Scholar] [CrossRef]
30. Abass K, Buor D, Afriyie K, Dumedah G, Segbefi AY, Guodaar L, et al. Urban sprawl and green space depletion: implications for flood incidence in Kumasi. Ghana Int J Disaster Risk Reduct. 2020;51(2):101915. doi:10.1016/j.ijdrr.2020.101915. [Google Scholar] [CrossRef]
31. Recanatesi F, Petroselli A. Land cover change and flood risk in a peri-urban environment of the metropolitan area of Rome (Italy). Water Resour Manag. 2020;34(14):4399–413. doi:10.1007/s11269-020-02567-8. [Google Scholar] [CrossRef]
32. Ahmad I, Wang L, Ali F, Zhang F. Spatiotemporal patterns of extreme precipitation events over Jhelum river basin. Sustainability. 2022;14(23):15558. doi:10.3390/su142315558. [Google Scholar] [CrossRef]
33. Malik IH, Ahmed R, Ford JD, Ahmad Shakoor MS, Wani SN. Beyond the banks and deluge: understanding riverscape, flood vulnerability, and responses in Kashmir. Nat Hazards. 2024;120(14):13595–616. doi:10.1007/s11069-024-06712-z. [Google Scholar] [CrossRef]
34. Usmani M, Bhatti HMT, Nanni R, Bovolo F, Napolitano M. Flood mapping and impact analysis by fusion of remote sensing and open geospatial data: sindh case study. Egypt J Remote Sens Space Sci. 2025;28(2):357–69. doi:10.1016/j.ejrs.2025.05.001. [Google Scholar] [CrossRef]
35. Kundzewicz ZW, Szwed M, Pińskwar I. Climate variability and floods—a global review. Water. 2019;11(7):1399. doi:10.3390/w11071399. [Google Scholar] [CrossRef]
36. Ali MI, Dirawan GD, Hasim AH, Abidin MR. Detection of changes in surface water bodies urban area with NDWI and MNDWI methods. Int J Adv Sci Eng Inf Technol. 2019;9(3):946–51. doi:10.18517/ijaseit.9.3.8692. [Google Scholar] [CrossRef]
37. Ahmad Romshoo S, Altaf S. Assessing flood vulnerability in the Upper Jhelum Basin using a geospatial modelling approach. Geomat Nat Hazards Risk. 2025;16(1):2435507. doi:10.1080/19475705.2024.2435507. [Google Scholar] [CrossRef]
38. Kirsch TD, Wadhwani C, Sauer L, Doocy S, Catlett C. Impact of the 2010 Pakistan floods on rural and urban populations at six months [Internet]; 2012 [cited 2025 Oct 1]. Available from: https://currents.plos.org/disasters/index.html%3Fp=2483.html. [Google Scholar]
39. Ali Khan Q, Jan A, Iram S, Haider I, Badshah A, Khan A, et al. Impact of 2022 flood on socio-economic and health status of people residing in flood-stricken areas of Pakistan: a cross-sectional survey. Ann Med Surg. 2024;86(11):6465–71. doi:10.1097/MS9.0000000000002402. [Google Scholar] [PubMed] [CrossRef]
40. Nguyen HD, Dang DK, Nguyen QH, Bui QT, Petrisor AI. Evaluating the effects of climate and land use change on the future flood susceptibility in the central region of Vietnam by integrating land change modeler, machine learning methods. Geocarto Int. 2022;37(26):12810–45. doi:10.1080/10106049.2022.2071477. [Google Scholar] [CrossRef]
41. Immerzeel WW, Lutz AF, Andrade M, Bahl A, Biemans H, Bolch T, et al. Importance and vulnerability of the world’s water towers. Nature. 2020;577(7790):364–9. doi:10.1038/s41586-019-1822-y. [Google Scholar] [PubMed] [CrossRef]
Cite This Article
 Copyright © 2025 The Author(s). Published by Tech Science Press.
This work is licensed under a Creative Commons Attribution 4.0 International License , which permits unrestricted use, distribution, and reproduction in any medium, provided the original work is properly cited.
 Downloads
 Citation Tools