
 Submit a Paper
 Propose a Special lssue
 Open Access
ARTICLE

Landslide Susceptibility Assessment Using Analytical Hierarchy Process (AHP) in Hulu Selangor
1 Centre of Studies for Surveying Science and Geomatics, Faculty of Built Environment, Universiti Teknologi MARA, Shah Alam, 40450, Selangor, Malaysia
2 Centre of Studies for Surveying Science and Geomatics, Faculty of Built Environment, Universiti Teknologi MARA, Cawangan Perlis, Kampus Arau, Perlis, 02600, Arau, Malaysia
3 Department of Survey and Mapping Malaysia, Kuala Lumpur, 50578, Malaysia
* Corresponding Authors: Nurhanisah Hashim. Email: ; Ainon Nisa Othman. Email:
(This article belongs to the Special Issue: Advancements in Geospatial Methods and Technologies for Sustainable Built Environment and Engineering)
Revue Internationale de Géomatique 2025, 34, 915-937. https://doi.org/10.32604/rig.2025.072321
Received 24 August 2025; Accepted 28 October 2025; Issue published 09 December 2025
 View Full Text
 Download PDF
Abstract
This study aims to assess landslide susceptibility in Hulu Selangor, Selangor, Malaysia, an area that is exposed to rapid industrial and infrastructural growth. Six conditioning factors, such as slope, land use, lithology, road proximity, and river proximity, were integrated through the Analytic Hierarchy Process (AHP) in a GIS environment. The weights distribution analysis revealed slope (40.50%) and lithology (23.12%) as the most important factors, followed by river proximity (15.09%) and road proximity (13.76%). The developed susceptibility map was divided into five zones: very low (12.4%), low (18.7%), medium (35.6%), high (22.1%), and very high (11.2%). Model validation was performed using past landslide events, in which it was found that all the reported events in the study area were found in medium to very high susceptibility zones, with 100% accuracy. Notwithstanding this, the validation is limited by the low number of historical landslide locations, which tends to overestimate model performance. The outcome indicates that medium to high susceptibility zones dominate the district, particularly in large road and river networks, identifying the interaction between hydrological processes and human interference in influencing landslide instability. Aside from the scientific understanding of landslide hazard, the results also provide actionable recommendations for land use planning, infrastructure security, and site-specific mitigation strategies in Hulu Selangor.Keywords
Among the most destructive natural disasters in the world, landslides cause severe damage to human life and the economy [1,2]. Weak, ailing trees and soil erosion were among the reasons for the landslides, and heavy rain could have led to the trees falling and dragging the Earth with them [3]. In recent years, Malaysia has experienced numerous landslides, with most of them attributed to heavy rainfall. Extreme rainfall, such as during the monsoon season, is a secondary factor for triggering landslides, while buildings, rivers, and the type of lithology are the most significant factors [4,5]. This is because the pressure on the landslide changes, which causes slope instability. Thus, slope materials loaded with heavy water, such as soil and rock, will collapse under the weight of gravity. Landslides of this type often have no visible signs, and they can occur rapidly, transitioning from creep to an obvious slip, which can lead to building collapses and fatalities.
Landslides and land slope have varying usages in geomorphology and geotechnical studies and should not be used synonymously. A landslide refers to the downward movement of rock, soil, or debris by gravity, a dynamic process leading to terrain instability. A land slope, in contrast, is the ground surface inclination or steepness, a static morphological aspect of the landscape. While slope is a crucial conditioning parameter governing the likelihood of landslide occurrence, it is not the landslide event itself. In this study, landslide refers to landslide in the context of susceptibility mapping, while slope is treated as one of the causative parameters governing slope stability and the likelihood of landslide initiation.
On 16 December 2022, a very sad tragedy shook Malaysians when a landslide occurred on Jalan Batang Kali Genting Highlands involving 92 victims. In that situation, the police and all authorities acted to dispatch several aid teams, including one from Selayang Hospital, to assist the victims at the scene. Sixty-one people have been found safe, while 31 people have died because of this disaster. According to a report from The Straits Times (2023), Malaysian Deputy Prime Minister Zahid Hamidi said the result of an investigation by forensic experts into the incident was caused by the unpredictable weather, which was heavy rain without stopping for five (5) days before the landslide occurred, in addition to the antecedent rainfall cumulative for 30 days before the collapse occurred, which was 118.6 and 444.8 mm, respectively.
This study focuses on Hulu Selangor District, formerly spelled Ulu Selangor, which is one of the northern districts of Selangor State. Covering an area of 175,630 hectares, almost as large as Melaka, Hulu Selangor is the largest of the nine districts in Selangor. Geographically, it lies at the northern boundary of the Klang Valley, bordered by Perak to the north and Pahang to the east. Historically regarded as the “Sleeping Hollow” due to its peripheral location, the district has undergone a profound transformation in recent decades. Situated at the foothills of the Titiwangsa Range and traversed by several rivers, including Sungai Selangor, Sungai Batang Kali, and Sungai Bernam, the area combines rugged topography with growing urbanization and industrial activity [6].
Today, Hulu Selangor has emerged as a burgeoning industrial and urban corridor, strategically connected by the North–South Expressway (PLUS), the Kuala Lumpur–Kuala Selangor Expressway (LATAR) and New Klang Valley Expressway (NKVE) highways, and the Keretapi Tanah Melayu Berhad (KTMB) electric train service (ETS), which links the district efficiently to Kuala Lumpur and Ipoh. In line with Selangor’s vision of becoming a “Desirable, Progressive, and Prosperous State”, Hulu Selangor has been earmarked as the State Transportation Manufacturing Hub, with key industrial estates such as Zurah Industrial Park and Bernam Jaya Industrial Park formally recognized as drivers of regional growth [7]. More recently, large-scale investments, including the proposed RM2.2 billion Chery Smart Auto Industrial Park, further underscore the district’s rising profile as part of Malaysia’s Automotive Hi-Tech Valley (AHTV) initiative [8].
The district’s economic transformation is accompanied by significant demographic growth. According to the 2020 Population and Housing Census, Hulu Selangor recorded a population of 243,029 with a density of 139 persons per square kilometer, making it one of the more densely populated districts in Selangor. The increasing concentration of residents, industrial estates, and urban centers, including Kuala Kubu Bharu, Serendah, Bukit Beruntung, and Batang Kali, highlights the heightened vulnerability of the area to landslide hazards.
Despite these changes, scholarly attention to landslide susceptibility in Hulu Selangor remains limited compared to more frequently studied regions such as Cameron Highlands, Kundasang, and Penang. This creates a research gap in understanding how the district’s unique combination of hilly terrain, rapid urbanization, industrial expansion, and dense settlements influences landslide risks. Addressing this gap is crucial not only for scientific advancement but also for practical applications in local land-use planning, infrastructure protection, and disaster risk management.
Due to landslide events that have been happening recently, there is a need to identify potential locations that are prone to landslides for mitigation and awareness purposes. Even though many landslide susceptibility studies have been conducted across Malaysia and around the world, fewer are specific to Hulu Selangor. Due to the unique geological, hydrological, and land-use characteristics of the area, susceptibility mapping at the local scale is necessary to obtain accurate hazard estimates and suggest suitable mitigation measures. It can be done by generating landslide susceptibility maps by first identifying factors that contribute to landslides. A landslide susceptibility map indicates areas at very low, low, high, and very high risk of landslides. It is essential to consider the factors that cause landslides when constructing a map of landslide susceptibility, including slopes, soil types, and the impact of water. Although prior work is helpful, it cannot be transferred to Hulu Selangor without considering the surrounding environment of the area. This study, therefore, aims to provide a very localized landslide susceptibility map that represents Hulu Selangor’s conditions. In the hill country, a landslide susceptibility map is a crucial tool for land use planning and management [9]. This case study at Hulu Selangor will be based on aerial photo, and several information data were considered, such as land use, rainfall data, lithology data, slope data, river proximity, and road proximity data. Apart from that, data such as geomorphological characteristics are very useful in determining the value of landslide risk and mitigation. Referring to [10,11], the features of a geomorphic landscape can be identified with the help of high-resolution digital elevation models (DEMs).
The study focuses on producing a landslide susceptibility map utilizing an Analytic Hierarchy Process (AHP) model integration with a geographic information system (GIS) at the Hulu Selangor district. Literature review, satellite imagery, and Geographical Information System (GIS) technology were used to compile the landslide inventory map. This landslide susceptibility map was classified into four categories (very low, low, high, very high) and created using an Analytic Hierarchy Process (AHP) model based on a Geographical Information System (GIS) environment to evaluate landslide susceptibility and analyze landslide conditioning factors. The dependability of the landslide susceptibility map produced with the AHP was assessed in this study, and data on slope history were used in this evaluation. The study sought to find the alignment between previous slope failures and the expected areas of susceptibility by layering the layer of slope history onto the created sensitivity map. This method guarantees that the last result is reliable and trustworthy, therefore offering important new perspectives on the accuracy and application of the landslide susceptibility model for the Hulu Selangor District.
1.1 Landslide Hazard and Risk Assessment
This phenomenon significantly influences the transformation of the landscape in a particular location. The impacts are influenced by factors like Lithology, morphology, geological environment, climate, and others [9,12]. This can also induce additional natural disasters like earthquakes, wildfires, torrential floods, and others [3]. Because landslides can happen in so many ways, landslides are one of the most varied and complicated natural events that can happen anywhere in the world. It’s impossible to determine where this phenomenon affects and how often it will happen because landslides are connected to complicated mass movements, and it is hard to get data from the past. As a result, landslide hazard assessment is crucial to highlight landslide-prone areas by denoting the likelihood that a destructive slope failure will happen within a specified time frame and location [13]. The magnitude, size, or dimension of the anticipated failure must also be quantified deterministically or probabilistically in order to define landslide hazard precisely, since the “magnitude” of the event is proportional to its destructive capacity. Furthermore, data on landslide hazard is often displayed on the map by showing the division of a region according to varying degrees of landslide risk (zoning). However, creating a single landslide hazard map is challenging due to the need to display various danger conditions and probabilities. With the abilities of the Geographical Information System (GIS), the landslide-prone area can be displayed on maps.
The most recent trend in landslide hazard assessment has been a shift towards hybrid models that combine the strengths of data-driven models and expert opinion. These combined strategies aim to enhance the accuracy and reliability of hazard predictions. For instance, Bui et al. (2023) demonstrated that the combination of Analytic Hierarchy Process (AHP) weights and machine learning algorithms such as Random Forest and Support Vector Machines can be used to increase the robustness and predictive capability of hazard maps. Such hybrid approaches utilize expert-derived weights for training machine learning classifiers, which enhance model performance and yield more credible evaluation outcomes [7]. These developments show that the integration of traditional and cutting-edge modeling methods can help improve landslide susceptibility studies.
Furthermore, many discussions about slope stability and environmental risk prevention have some scientific advancements in landslide hazard and environmental risk assessment [14]. The study about slope stability and environmental risk prevention is where locations require analysis and minimizing the risk of slope failures, such as landslides and rockfalls, to safeguard both human lives and the environment. This involves understanding the elements that lead to slope instability, such as geological characteristics, rainfall patterns, and human activity like deforestation or development [15,16]. By identifying susceptible locations and adopting measures like slope stabilization methods, land use planning, and early warning systems, the objective is to limit the possibility and effect of mass movements on populations and ecosystems in these places. One approach used to study a failure-prone hillslope near Bonn, Germany, allows three-dimensional slope models to be used in the field investigation, which is the geological units, soil factors, and geoelectrical tracking, leading to better numerical slope stability analysis, which made it possible to create a site-specific early warning system [17]. Other than that, a study conducted at Universiti Putra Malaysia (UPM) [18] examined the impact of hydroseeded plants on slope reinforcement. The study used the Analytic Hierarchy Process model to assess the efficiency of plant roots and ground cover in landslide management.
1.2 Causes and Effects of Landslides
A landslide is a natural phenomenon that can be influenced by many factors and criteria. In many of the analyzed landslides, the hydrometeorological aspect was a key contributor to the initiation of landslides, resulting in the escalation of several landslide activities in 2013 due to a large volume of rainfall, which caused soils to become overly saturated with water [19]. The first one is the surface feature of an area. The primary features of a landscape that produce landslides are the steepness and elevation of the slopes. Due to the features, it causes a strong gravitational force acting towards the slope and also the water content that was already in the soil to flow downwards. Next is the water content of the soil that is caused either by the topographical features, such as waterfalls, rivers, and so on, or by the frequency of rainfall towards the slope. The water content of the soil causes the soil to be heavier than usual when it is dry. Due to the excessive water, the soil loses stability and is dragged down by gravity.
In addition to that, natural ecosystems, including native flora and fauna, forests, and grasslands, as well as the form of the Earth’s subaerial and undersea surfaces, are also impacted by landslides. Mass wasting and erosion are two common mechanisms that degrade surfaces, and morphological impacts are just one of them. In most instances, landslides have devastating negative impacts on flora and fauna. However, species are able to recover over time from landslide catastrophes because the damage is usually limited to a specific area. Some plant and animal ecosystems may actually benefit from landslides in the future [20].
When the cohesive forces retaining the landmass together are outweighed by the downward forces, including gravity, landslides happen, and the material that forms the slope fails. Several elements lead to the occurrence of landslides: morphological elements such as tectonic uplift, glacial rebound, and erosion of the hill slope or toe; physical factors such as heavy rainfall, quick snow melt, and earthquakes; and human factors such as mining, deforestation, and excavation of the hill slope or toe [21,22].
In another study, done by [23], the Fuzzy AHP model was used to evaluate index systems. This study includes 10 contributing elements and subclasses to create a landslide susceptibility map. Pairwise comparisons were used to calculate the weights, with triangular fuzzy numbers (TFNs) being used to quantify importance. Levels of vulnerability were used to categorize all of Kenya’s landmass, drawing attention to potential study topics that could enhance land resource management and planning. Meanwhile, [24] used the Rock Engineering System (RES) to map the Attica area of Greece’s landslide susceptibility. Using a prototype method, field verification, and historical data, the model was validated. In order to incorporate the data in future landslide risk and hazard maps, an updated geodatabase was created, and susceptibility levels were defined in the paper “Development of the Landslide Susceptibility Map of Attica Region, Greece, Based on the Method of Rock Engineering System”. In another study, Ref. [25] using five different Machine Learning systems to investigate landslide vulnerability mapping in Kerala. While the performance of Random Forest, K Nearest Neighbours, and Support Vector Machine is greatly affected by sampling method, Naïve Bayes and Logistic Regression are found to be less affected by sampling strategy and data splitting.
Although existing landslide susceptibility models and analyses available today have been developed through utilizing various methods such as AHP, Fuzzy AHP, RES, and machine learning, the majority of these models are based on old datasets and do not account for recent environmental change and human activities unique to Hulu Selangor. Moreover, the transferability of these models to Hulu Selangor’s own geology and land use is still limited. Therefore, there is a critical necessity to design a localized, validated susceptibility map that incorporates existing data, environmental settings, and human activities. This is essential for proper disaster mitigation, town planning for urban development, and resource management, fitting the current context of Hulu Selangor.
This section examines the procedures that were employed in this study to collect and analyse the data. Generally, this study is divided into five main phases, which are reviewing literature, data acquisition, data processing, data analysis, results, and discussion. Fig. 1 shows the methodology workflow for this study.
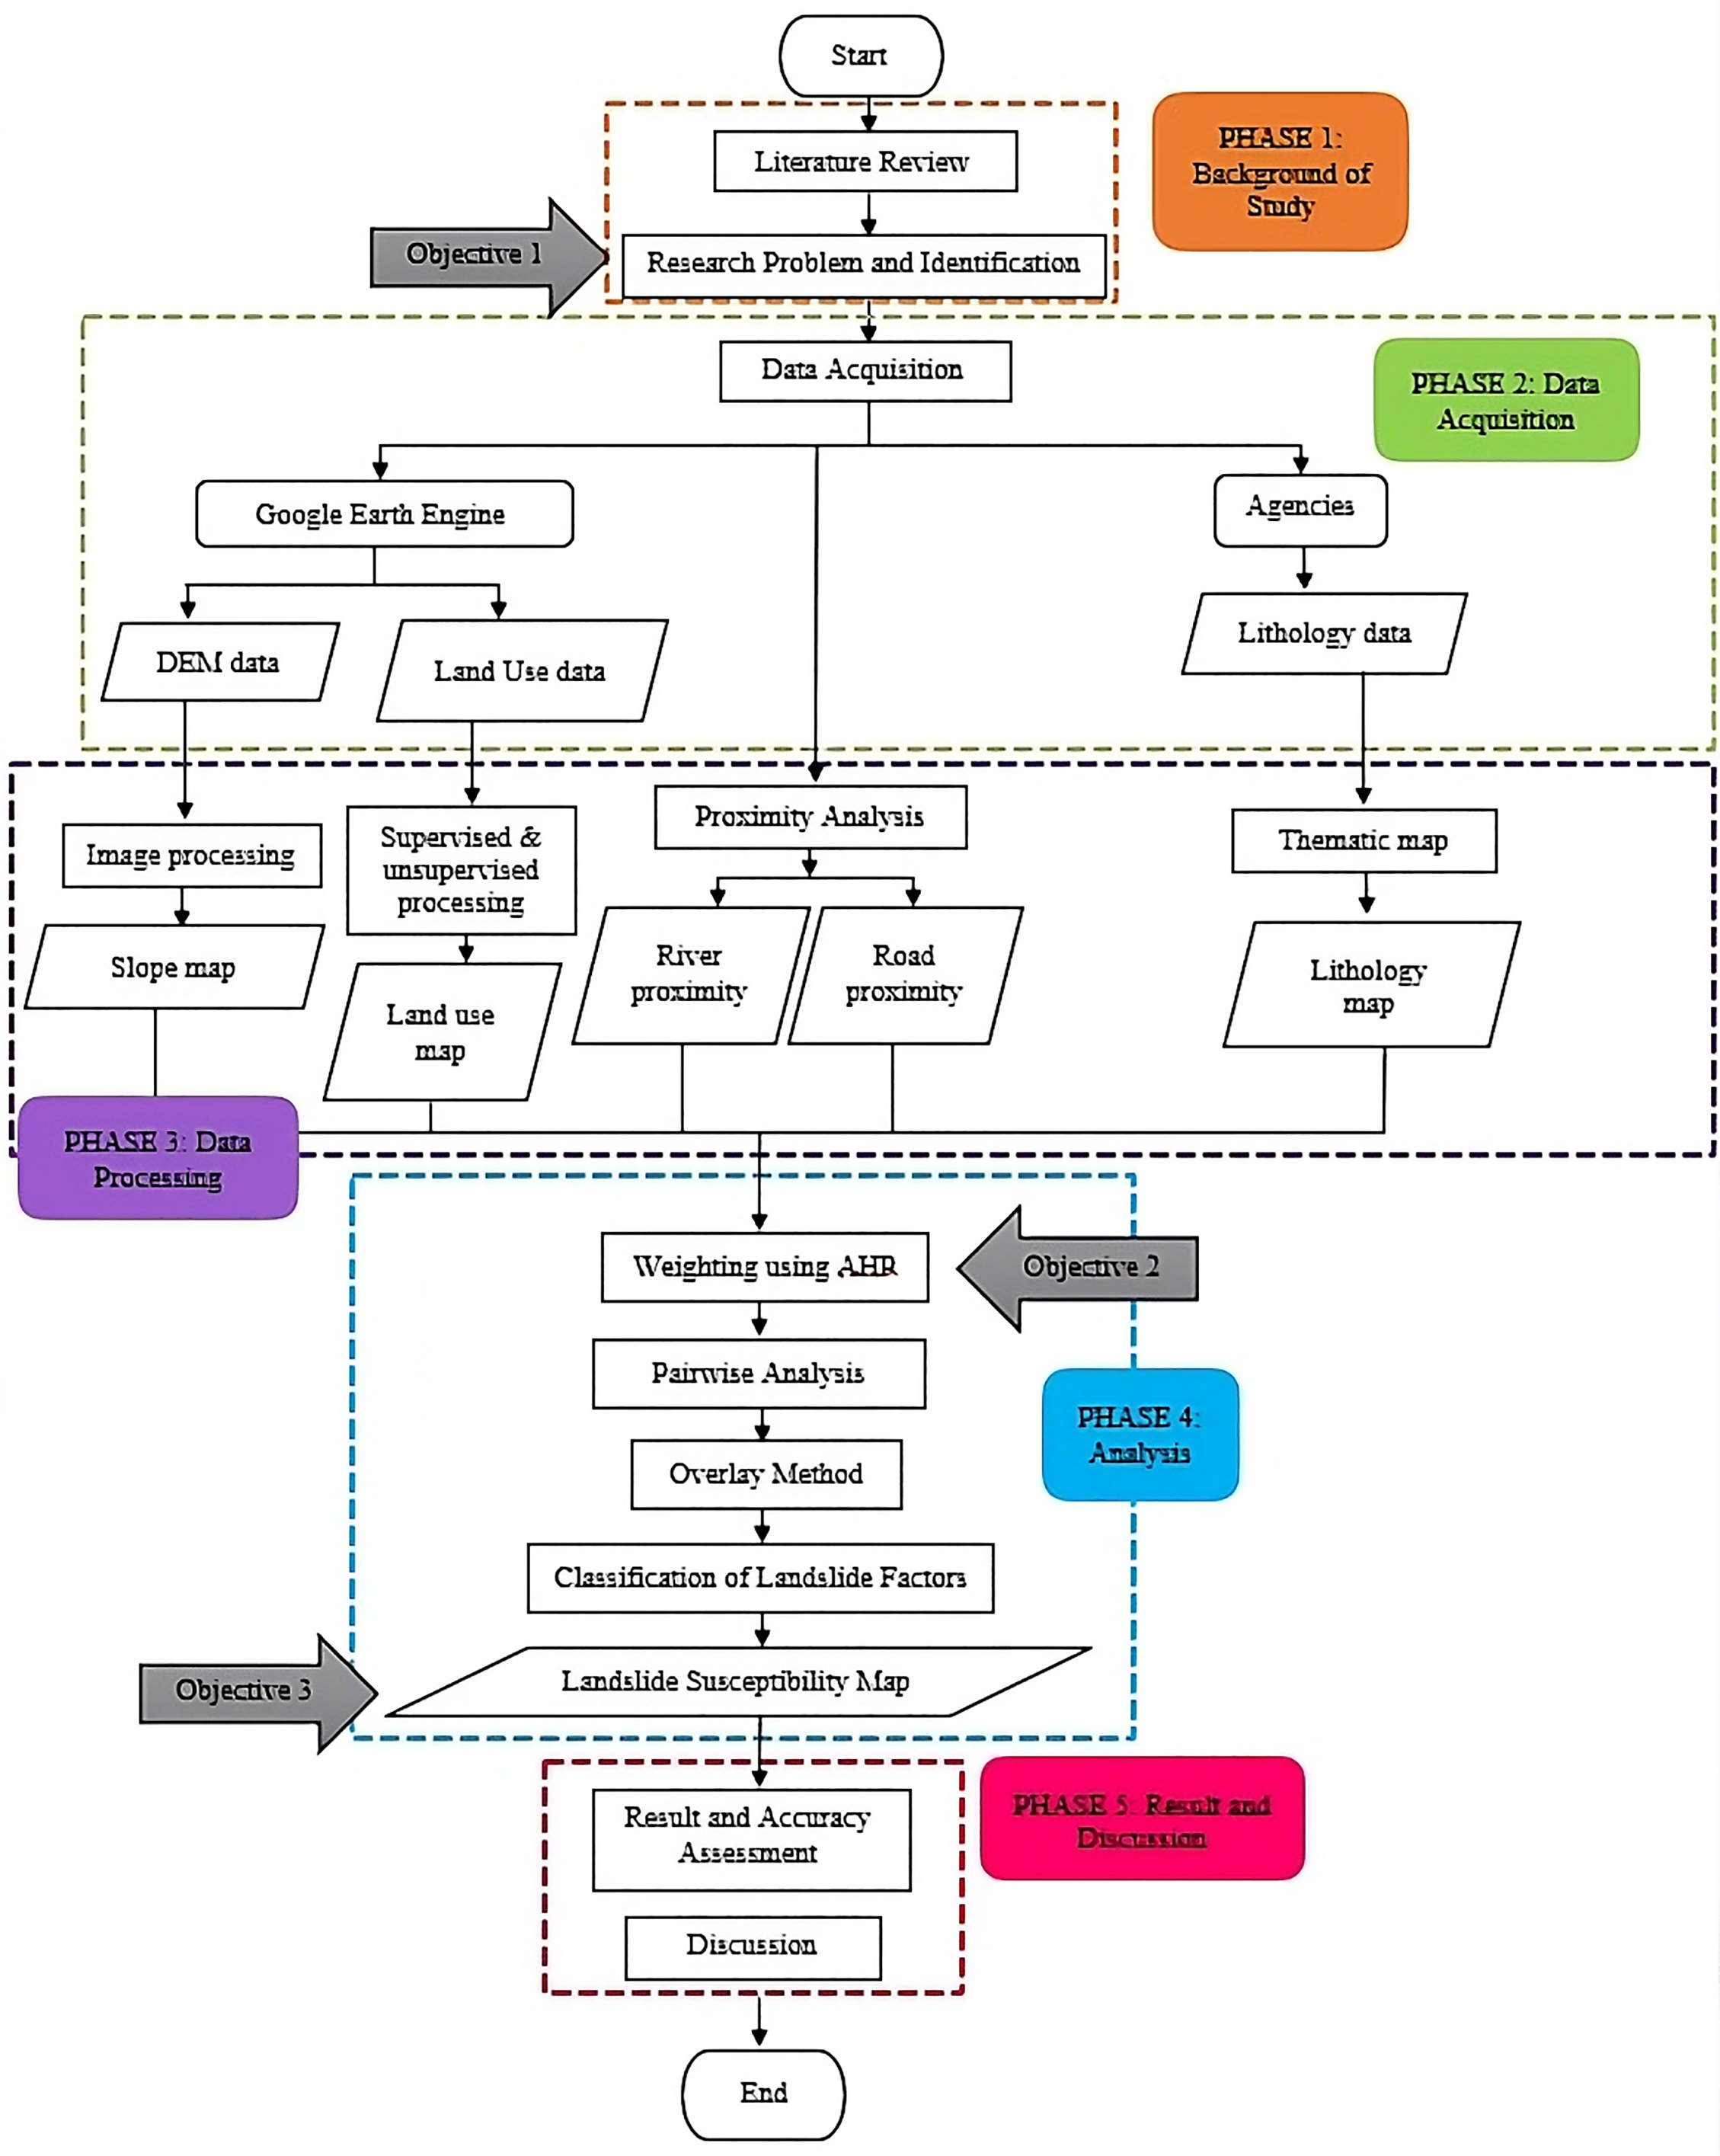
Figure 1: Overall methodology workflow
Hulu Selangor is a district located in Selangor, Malaysia. It comprises the settlements of Serendah, Batang Kali, and Kuala Kubu Bharu. The primary town is Kuala Kubu Bharu. The district is situated in the northeastern region of Selangor, adjacent to Perak to the north, Pahang to the east, Sabak Bernam district to the northwest, Kuala Selangor district to the southwest, and Gombak district to the south. The Selangor River originates from this region, therefore providing the district with its name. The district is relatively geographically large, between latitudes 3°20′ N and 3°50′ N, and longitudes 101°20′ E and 101°50′ E. It is within this range of coordinates that the study area is demarcated, with diverse topography and land use features that relate to landslide susceptibility. The Selangor River begins its journey from within this district, which has an impact on its geomorphology. Fig. 2 shows the study area which is located in the Hulu Selangor district.

Figure 2: Study area of Hulu Selangor district (Esri basemap)
2.2 Selection and Preparation of Data
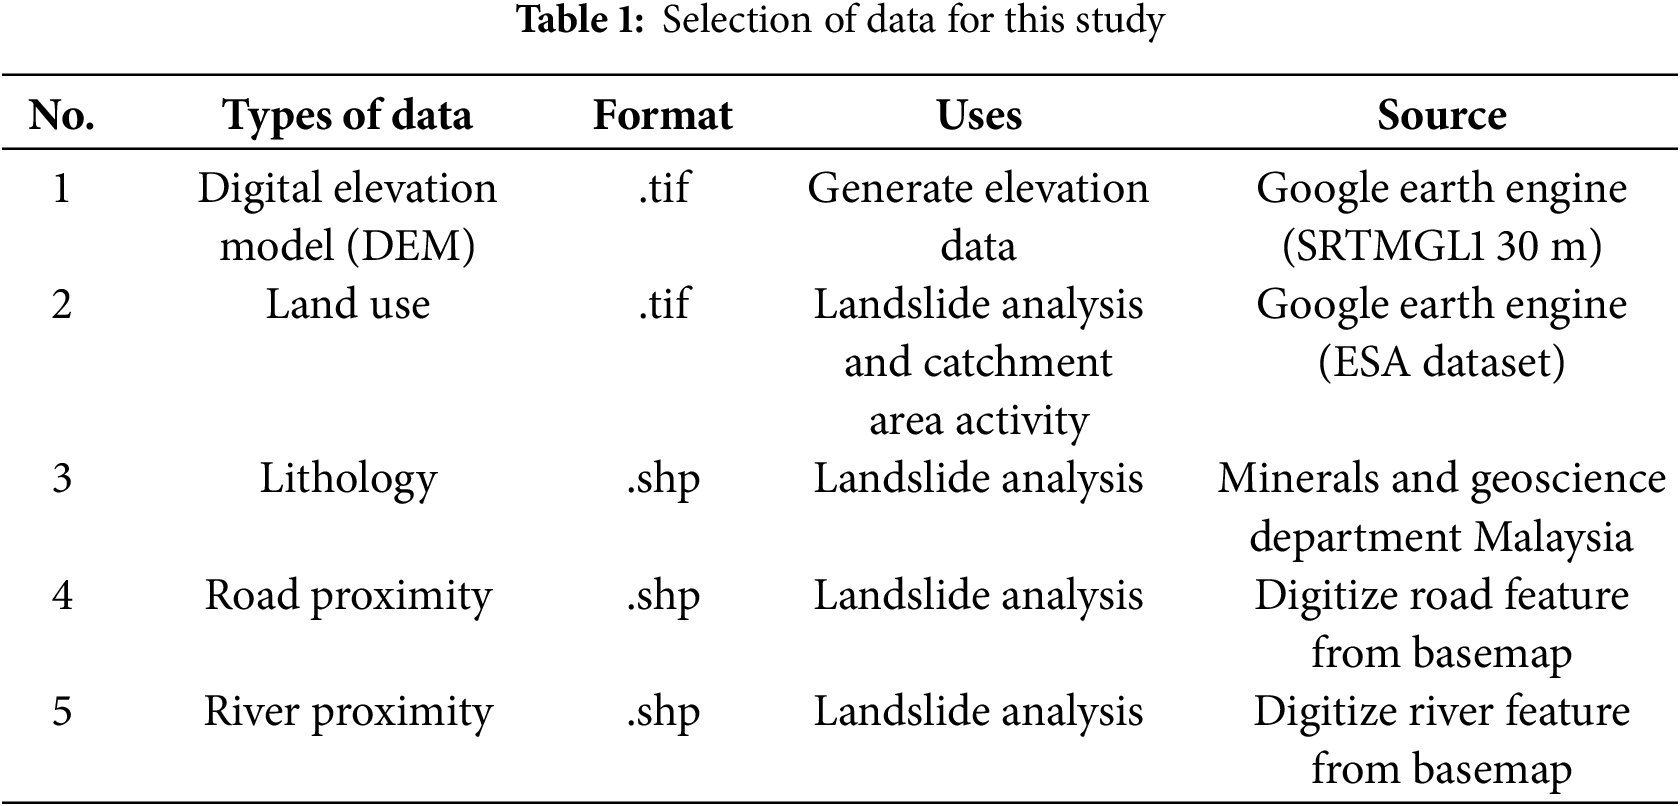
Data acquisition included some data that needed to be collected and used as input for modelling a landslide susceptibility map. The acquired data is utilized as the primary input model. The data comes from a variety of sources, including government and private sector agency; hence the data has different spatial resolutions. The data will then be employed in a pre-processing including data resampling to ensure the consistency of spatial resolution for each raster data. Here, all raster data were resampled to a common 30-m resolution using the DEM as the snap raster. Table 1 shows the selection of data for this study.
The selection of causative factors to landslide susceptibility was done depending on a systematic literature review, data availability, and their applicability within the study area. The significant factors included in consideration are road proximity, slope, Lithology, river proximity, land use, and rainfall, which are widely referred to as major landslide determinant factors.
While it is highly documented that rainfall intensity, geomorphology, and soil would influence landslide susceptibility, their exclusion from this analysis was in part due to data availability and a matter of the range of datasets that were available at regional scales. Rainfall data, for instance, was quantified into proximity and historical records that adequately simulated hydrological effects within the Geographical Information System (GIS) environment. Therefore, equally exhaustive soil type data were unavailable or in a resolution adequate for accurate spatial analysis over the entire district. Geomorphological factors, like accurate landform classification, were also excluded as the key geological and hydrological variables already accounted for the most important processes governing landslides here.
Future research can incorporate these additional variables to enhance and develop the forecast capability of landslide susceptibility models, mainly in the case of higher-resolution availability of soil and geomorphology data.
The DEM data used in this study were extracted from the Shuttle Radar Topography Mission (SRTM), which has been provided on USGS SRTMGL1_003 in Google Earth Engine (GEE). This dataset uses a spatial resolution of 30 m and provides sufficient detail in elevation data for analysing the topography. SRTM satellite elevation data is one of the best sources for elevation cover across the world, with a vertical accuracy of approximately 16 m, which can be suitable for slope study in the Hulu Selangor District. In GEE, through the use of JavaScript, the DEM was pre-processed and clipped to the research region for focused investigation of local topography features. This DEM is a key element in slope analysis and, hence, very crucial in the identification of landslide-prone areas.
Land use data for this study were retrieved from the European Space Agency WorldCover 2021 dataset using GEE. The dataset provides land use classification at 10 m globally, giving full and detailed information on different classes of land cover. The data is acquired from Sentinel-2 satellite images of the most reputable satellites for their superior geographical and temporal resolution, thus assuring reliable accuracy in land-use studies. This land-use dataset is a must when considering slope-land cover category relationships. It aids in the identification of various land use categories, such as vegetation and constructed environments, which contribute to slope stability, hence improving vulnerability assessment to landslides.
This lithology map is secondary data obtained from the Minerals and Geoscience Department of Malaysia. This data is in vector shapefile format (.shp). A lithology map is crucial for assessing landslide susceptibility as it illustrates the various types of rocks and soils in a region. The stability of slopes is affected by the different lithological units’ strength, permeability, and weathering qualities. As an example, landslides are more likely to occur in rocks that are soft, heavily worn, or fractured rather than in rocks that are firm and consolidated. Incorporating Lithology into the study is crucial for landslide influence on risk prediction because it reveals regions with geological materials that are weaker and more likely to collapse. Accurate susceptibility maps, better land use planning, and more effective hazard mitigation techniques can be achieved by first understanding the Lithology and then evaluating the underlying geological conditions that contribute to landslide risks.
Euclidean distance analysis was used to produce a distance raster showing the distance from every cell to the closest road. This distance raster measures the closeness of roads within the research region. Following creation, the distance raster should be standardized, usually by reclassifying it into a similar scale (e.g., 0 to 1), where higher susceptibility is indicated by increased proximity to highways. At last, this uniform road proximity layer is included in the overall landslide susceptibility model, frequently by means of a weighted overlay analysis, in which it is merged with other variables, including slope, soil type, rainfall, Lithology, land use, and river proximity, each of which is given the proper weights according to their relative importance. By pointing out places where the existence of roads could raise the possibility of landslides, this procedure improves the precision and dependability of the susceptibility map.
To include river proximity in a landslide susceptibility analysis, it is required to construct a river network layer for the research region. Euclidean Distance analysis was used once again to create a distance raster that determines the distance from each cell to the closest river. There will be different patterns of river closeness across the research region using this distance raster. Cells closer to rivers have higher values, indicating higher susceptibility due to factors like riverbank erosion, saturation of slopes, and changes in groundwater flow. As a result, the distance raster needs to be standardized after creation. This is usually done by reclassifying it into a common scale, such as 0 to 1.
Following standardization, this river proximity layer is included in the landslide susceptibility model by means of a weighted overlay analysis, in which it is joined with other variables, including slope, Lithology, land use, and road proximity, each of which is given the proper weights according to its respective contribution to landslide susceptibility. This integration adds to a more thorough and precise susceptibility map by pointing out places where being close to rivers may make landslides more likely.
The spatial mapping and analysis components of this study were conducted using ArcGIS Pro software, which facilitated the generation of terrain models, proximity maps, land use classification, and the development of the landslide susceptibility maps. Additionally, Microsoft Excel was employed for the calculation of weightages within the Analytical Hierarchy Process (AHP), enabling systematic pairwise comparisons and derivation of the criteria weights. The research does not specify any particular hardware requirements; thus, it is presumed that standard computing equipment capable of handling Geographical Information System (GIS) and analytical software was sufficient for executing the study.
Slope data was generated from SRTM, a spaceborne radar mapping mission carried out by NASA. The data is DEM of satellite imagery with a resolution of 30 m. By using slope analysis within Spatial Analyst in the GIS environment, a slope raster was generated. This raster depicts the gradient of the topography at each cell, where larger values indicate more pronounced inclines. Afterward, the analysis and validation were done by categorising the slope values into distinct groups to enhance interpretation. This categorization aids in comprehending the spatial distribution of slope gradient throughout the research region.
A slope map has been produced, with slope categories according to Jabatan Kerja Raya (JKR) rules. The subclasses are classified based on slope degree criteria specified in the JKR standards, guaranteeing alignment with recognised engineering and geotechnical evaluations for slope stability and hazard assessment.
2.4.2 Lithology Data Processing
The lithology data is confined to the study area to concentrate on the designated region of interest. The truncated data is subsequently reclassified according to landslide susceptibility levels, facilitating the evaluation of geological stability and danger areas. A lithology map is ultimately produced, which functions as a crucial reference for comprehending the geological attributes of the research region and assessing its vulnerability to landslides.
2.4.3 Road Proximity and River Data Processing
The process of generating a road and river proximity map starts with the digitisation of the road and river lines. After digitising the characteristics, the data is clipped to the research region to ensure that only pertinent information is handled. The Euclidean Distance tool is thereafter utilized to determine the closeness of each place within the research area to the nearest road and river. The resultant distance data is further classed into subclasses to delineate varying closeness levels. The processed data is utilized to create a road proximity map and a river proximity map, which graphically depict the distance fluctuations from roads and rivers inside the research region.
2.4.4 Land Use Data Processing
After obtaining the land use data, the classification procedure is executed to categorize various land use types. The categorized data is further improved by renaming each class in accordance with the land use codes found in the attribute table, hence assuring clarity and consistency. The land use categories are subsequently graded according to their vulnerability to landslides, facilitating the identification of high-risk zones within the research area.
2.4.5 Multi-Criteria Evaluation Using AHP
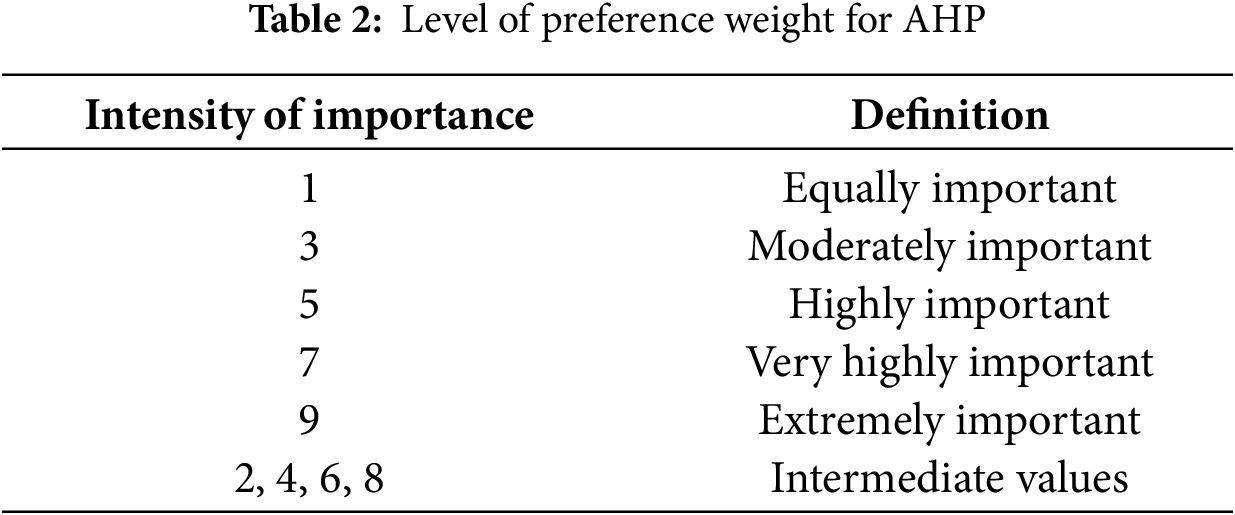
The AHP is an approach to priority ranking that relies on expert opinion and computations based on paired comparisons of several parameters [26]. A matrix-based pairwise comparison of the components contributing to landslides is included in this process. In a pairwise comparison matrix, each factor was given a rating between 1 and 9 (Table 2) for each intersecting component in this study [27]. The rating was based on the idea that the vertical axis factor was more relevant than the horizontal axis factor. When the horizontal axis factor was more essential than the vertical axis factor, the value ranged from 1/2 to 1/9. The procedure to conduct the pairwise comparison matrix and weightage calculation is listed below:
i) Define the criteria (slope, Lithology, land use, road proximity and river proximity)
ii) Create a pairwise comparison matrix where each cell represents the importance of criterion I compared to criterion j (i, j)
iii) Use a scale of 1 to 9 to rate the importance of each criterion relative to others
iv) Calculate the Normalized matrix by summing up each column and dividing each element by the sum of its column to normalize the matrix
v) Calculate the Priority Vector (weights) with average each row of the normalized matrix
vi) Check consistency by calculating the consistency index (CI) and consistency ratio (CR)
vii) Perform weighted overlay analysis
After doing the calculation of the pairwise comparison matrix, each spatial data needs to go through a reclassification process to ensure that each criterion maps were produced and weighted according to its importance values resulting from the AHP process.
2.4.7 Weighted Overlay Analaysis
The weighted overlay procedure was completed by selected expert judgement to obtain the percentage influence on each parameter using pairwise calculation. The study combines five raster images utilising the weighted overlay analysis. After the overlay, the resultant map is categorized employing two methodologies: Natural Breaks and Equal Interval. For the final susceptibility map, the Natural Breaks method was selected, as it better captures the inherent data distribution and delineates susceptibility zones more effectively for this study. Classification Methods and Geographical Information System (GIS), Software Equal Interval and Natural Breaks (Jenks) were then employed in ArcGIS to classify the final landslide susceptibility maps. Equal Interval classification divides the susceptibility scores into equal-sized classes by calculating the range of data and dividing it into equal parts, such that an even grouping throughout the entire dataset is achieved. The Natural Breaks (Jenks) method, on the other hand, segments the data into classes based on natural groupings or clusters that are identified in the data distribution and hence successfully segregates significant differences between the susceptibility zones. These segmentations were performed using the ‘Reclassify’ tool in ArcGIS, which offers flexibility for fine-tuning class ranges and groupings to suit the needs of analysis. Both methods are used to allow comparative analysis of the susceptibility zones to make it easier and more accurate to interpret the final maps. The choice of these classification methods is in harmony with landslide susceptibility mapping practices, thereby allowing meaningful interpretation of the potential risk zones.
This section presents the results obtained from the methods discussed in the previous sections by combining the AHP and geospatial analysis to generate a landslide susceptibility map that shows varying degrees of risk in the study area. The summary of landslide susceptibility assessment workflow shown in Fig. 3.
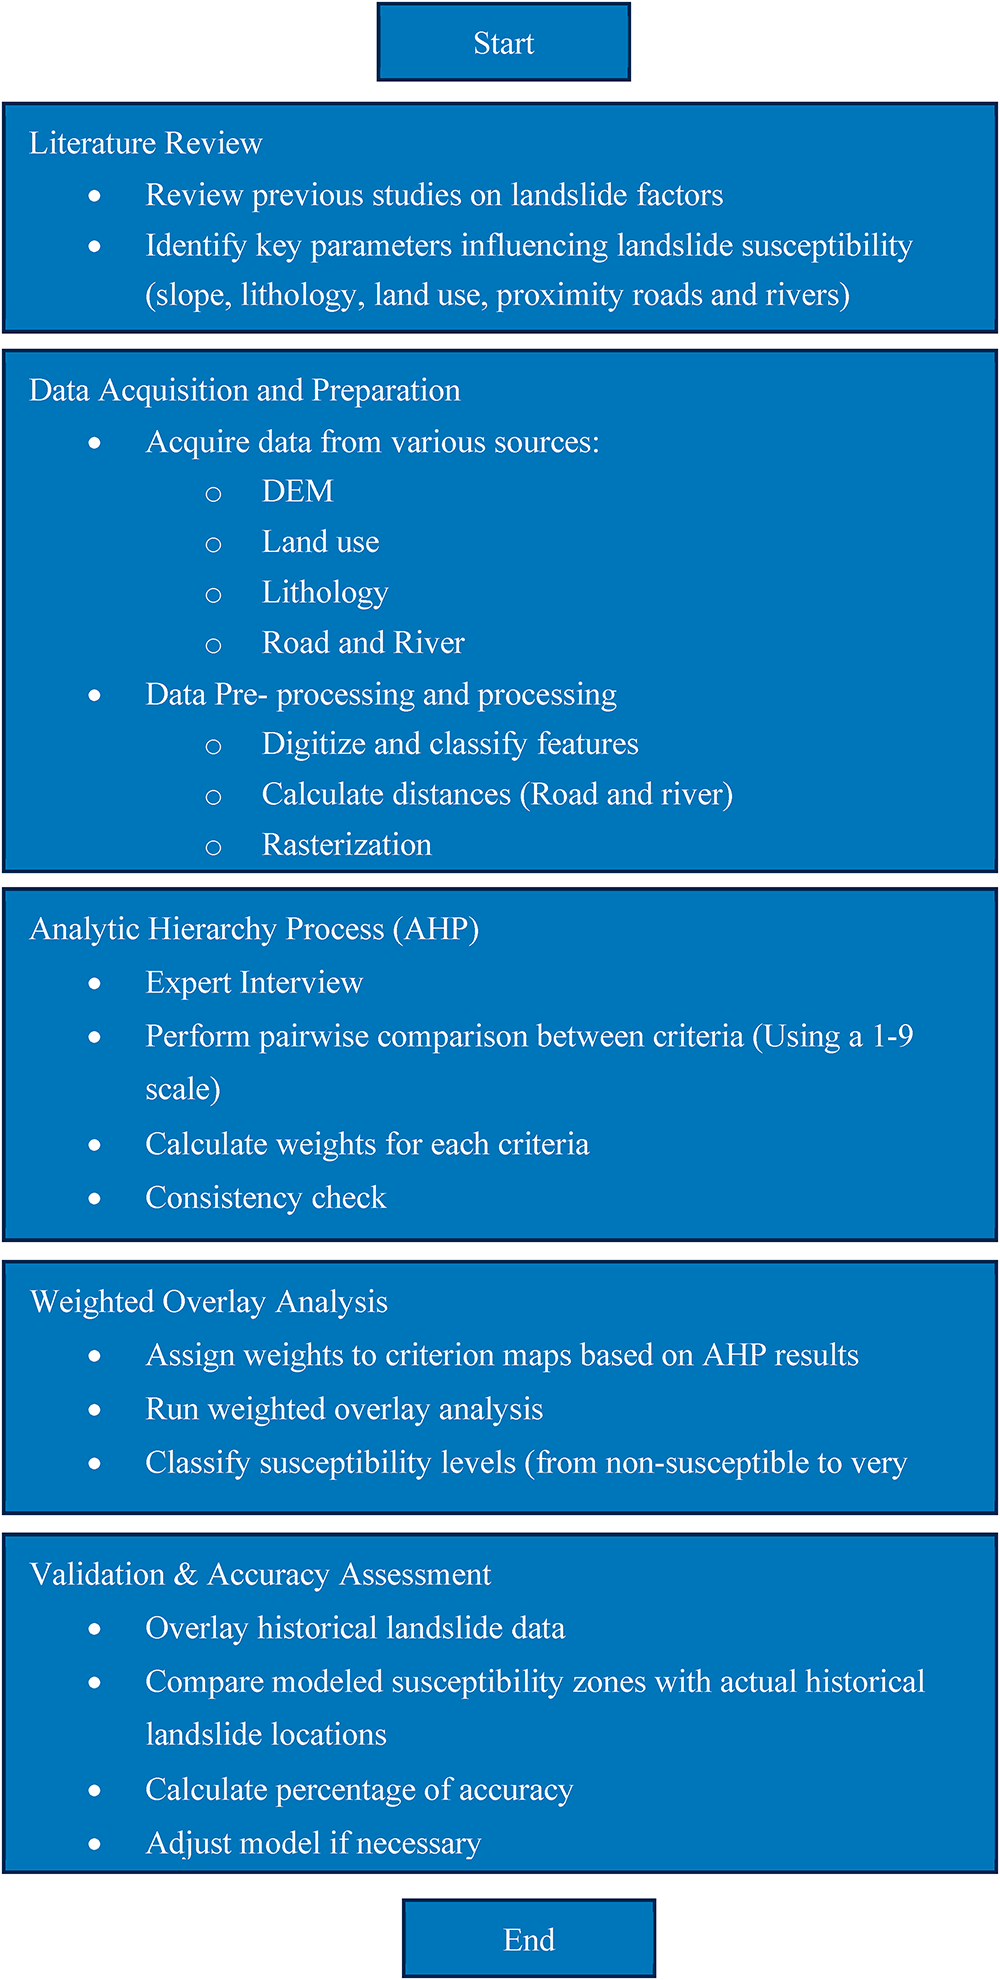
Figure 3: Summary of landslide susceptibility assessment workflow
3.1 Expert Scoring on Landslide Factors
The data was collected through a carefully designed questionnaire, tailored to gather insights on the relative importance of various criteria influencing landslide susceptibility. The expert’s extensive experience and practical knowledge provided a strong foundation for the ratings, ensuring that the judgments reflected both theoretical understanding and real-world applicability. This questionnaire was collected over the course of one month from three experts specializing in landslide assessment. The results of the questionnaire were analyzed using geometric means to calculate the average scores provided by the three experts.
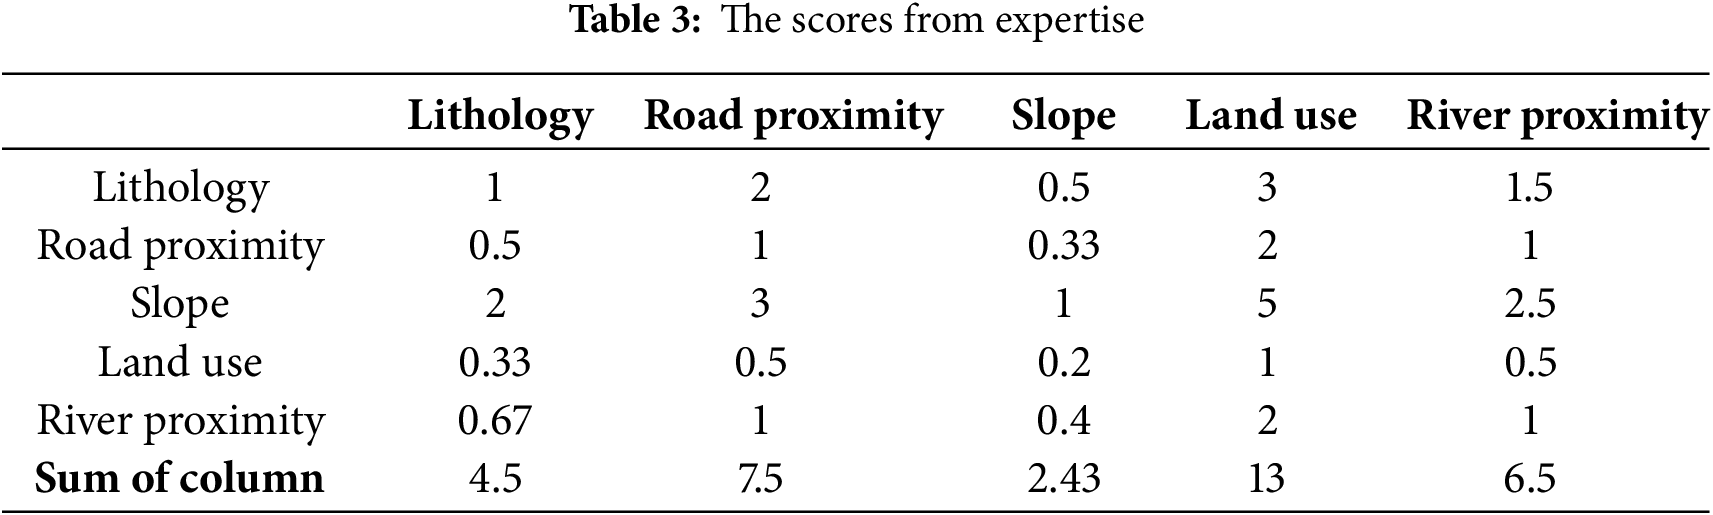
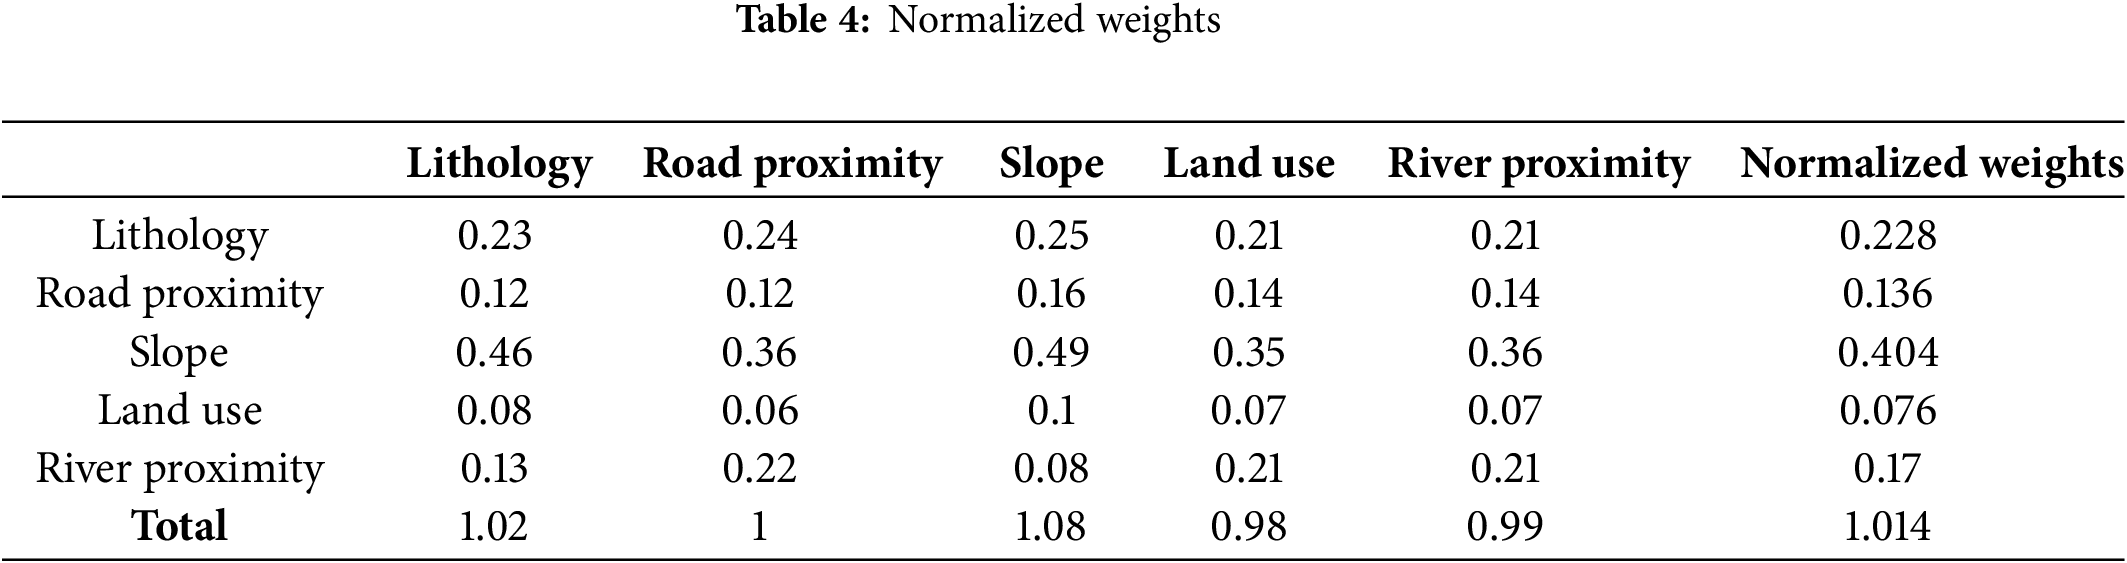
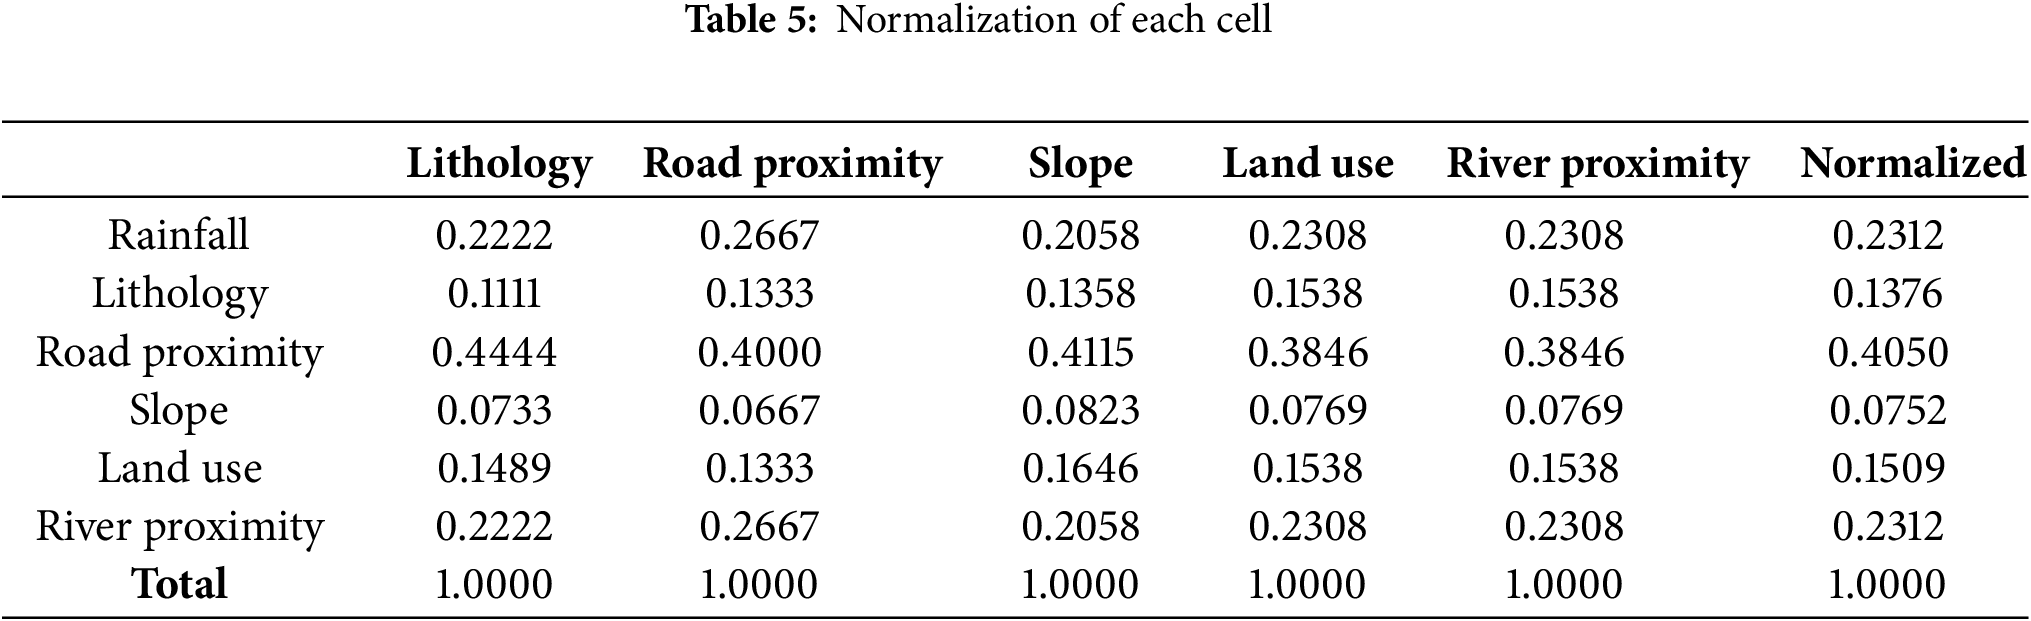
The scores presented in Table 3 were obtained from expertise in the field, highlighting the expert’s nuanced assessment of the factors and their significance in determining landslide risks. These scores were normalized by dividing each value by the sum of its respective column to ensure that each column sums to 1, allowing comparison across different criteria. Eq. (1) shows the equation to normalize the value for each cell. After normalizing, each column sums to 1.000, which verifies correctness as well as indicates the proportional importance of each criterion. The normalized weights are presented in Table 4, where each factor is obtained by computing the average value of each row, representing the final priority weightage for the factors. On the other hand, Table 5 shows the calculation of each member of the comparison matrix by its column total and determines the priority vector by computing the row averages. The weighted sum matrix is derived by multiplying the pairwise comparison matrix by the priority vector. Dividing each member of the weighted sum matrix by its corresponding element in the priority vector.
The consistency index in the AHP is a very important mathematical function that measures the level of inconsistency in the judgments made from pairwise comparisons. It is used to assess the consistency of the decision-making process by assigning every pairwise comparison matrix to a real number, expressing how consistent the comparisons are. One of the major focuses in AHP research has been the development of numerous inconsistency indices that have generated various definitions and methodologies for measuring inconsistency. It ensures that decisions are founded on logical assessments by assisting in the identification of illogical or unreasonable judgments [28,29]. Calculate the mean of this value to derive λmax. Upon computing the row averages, the consistency index is ascertained using a formula in Eq. (2) where n represents the matrix size. The geometric mean was calculated using [software] without AI algorithms, to standardize expert ratings.
where: λmax is the average consistency value from the eigenvector calculations. n is the number of criteria (in this case, 5).
From the calculations:
The Random Index (RI) for a 5 × 5 matrix is 1.12 (from AHP standard tables). The Consistency Ratio (CR) is then calculated as in Eq. (4).
since CR < 0.1, the pairwise comparison matrix is consistent, meaning the expert judgments are reliable. This confirms that the expert judgments used in the pairwise comparisons are highly consistent, ensuring the reliability and credibility of the weightage results for landslide susceptibility analysis.
3.3 Weightage Score and Percentage
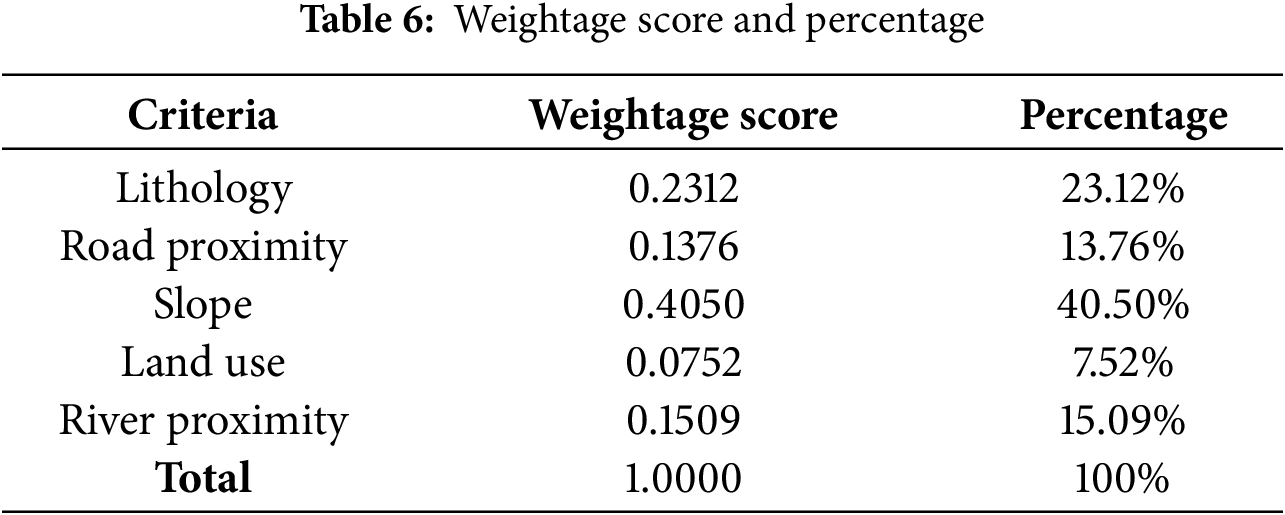
Table 6 presents the weightage score and percentage derived from the AHP for landslide susceptibility assessment. The weightage scores sum to 1.0000, ensuring a valid distribution of influence among the criteria. Slope has the highest influence with a weight of 0.4050 (40.50%), indicating its critical role in landslide occurrence due to its direct impact on terrain stability. Lithology comes next at 0.2312 (23.12%), indicative of the importance of geological make-up in slope failure. Proximity to rivers is weighted at 0.1509 (15.09%), implying that regions close to water courses are moderately prone to erosion and instability. Proximity to roads has a weightage of 0.1376 (13.76%), indicative of the influence of human infrastructure in changing natural land conditions. Finally, land use carries the least weight of 0.0752 (7.52%), which implies a lower but still significant contribution to susceptibility. The ranking of these factors gives a well-organized decision-making mechanism whereby the most contributory variables are suitably considered in landslide risk mapping.
3.4 Analysis of the Landslide Factors
In mountainous areas, a complex interaction of geological, hydrological, and human variables can cause landslides. Numerous factors affect the likelihood of landslides, and these factors might vary depending on the research region. Slope is a crucial factor in identifying danger zones for landslide susceptibility, according to earlier studies. Five components in all were chosen for this study, and the Rank Reciprocal approach was used to determine each factor’s weight. A larger weight denotes a larger landslide contribution.
Table 7 shows the weightage of landslide factors, giving percentage weights to every contributing variable depending on their impact on landslide susceptibility, while Fig. 4 shows criterion maps used for this study. Slope angle receives the highest percentage weight at 40.50%, highlighting its significance in slope stability. Steeper slopes (50°–90°) have the maximum class weight of 5, which means they are more prone to risk, whereas gentler slopes (0°–15°) are least vulnerable with a class weight of 1. This indicates how the steepness of slopes significantly increases the likelihood of landslides.
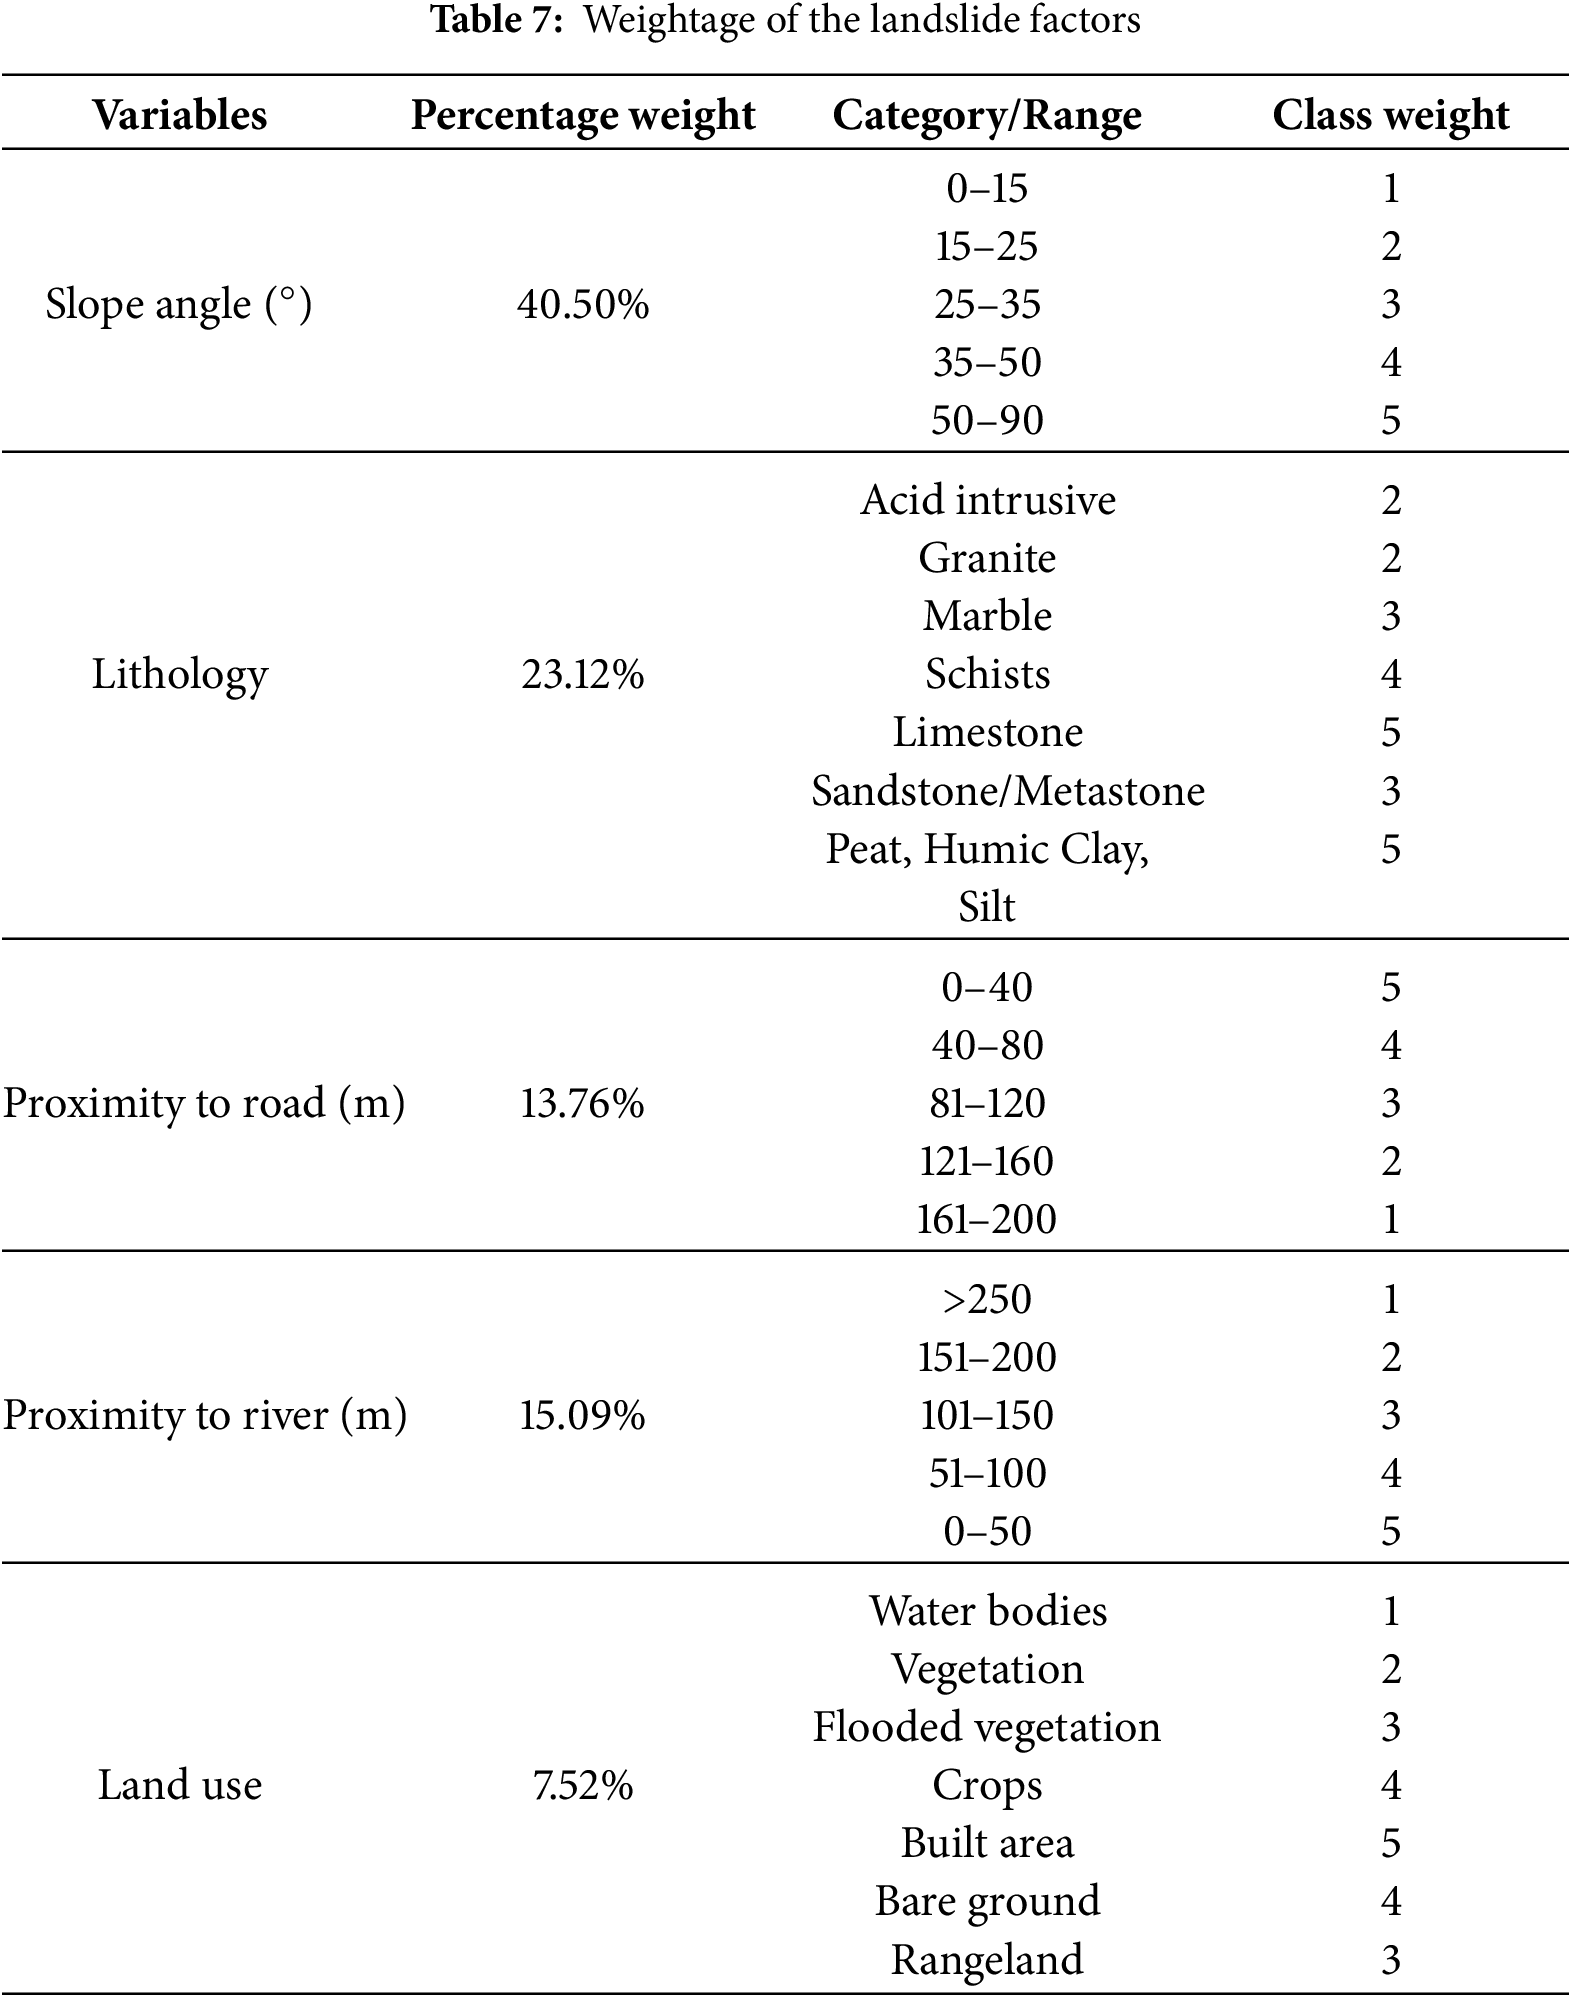
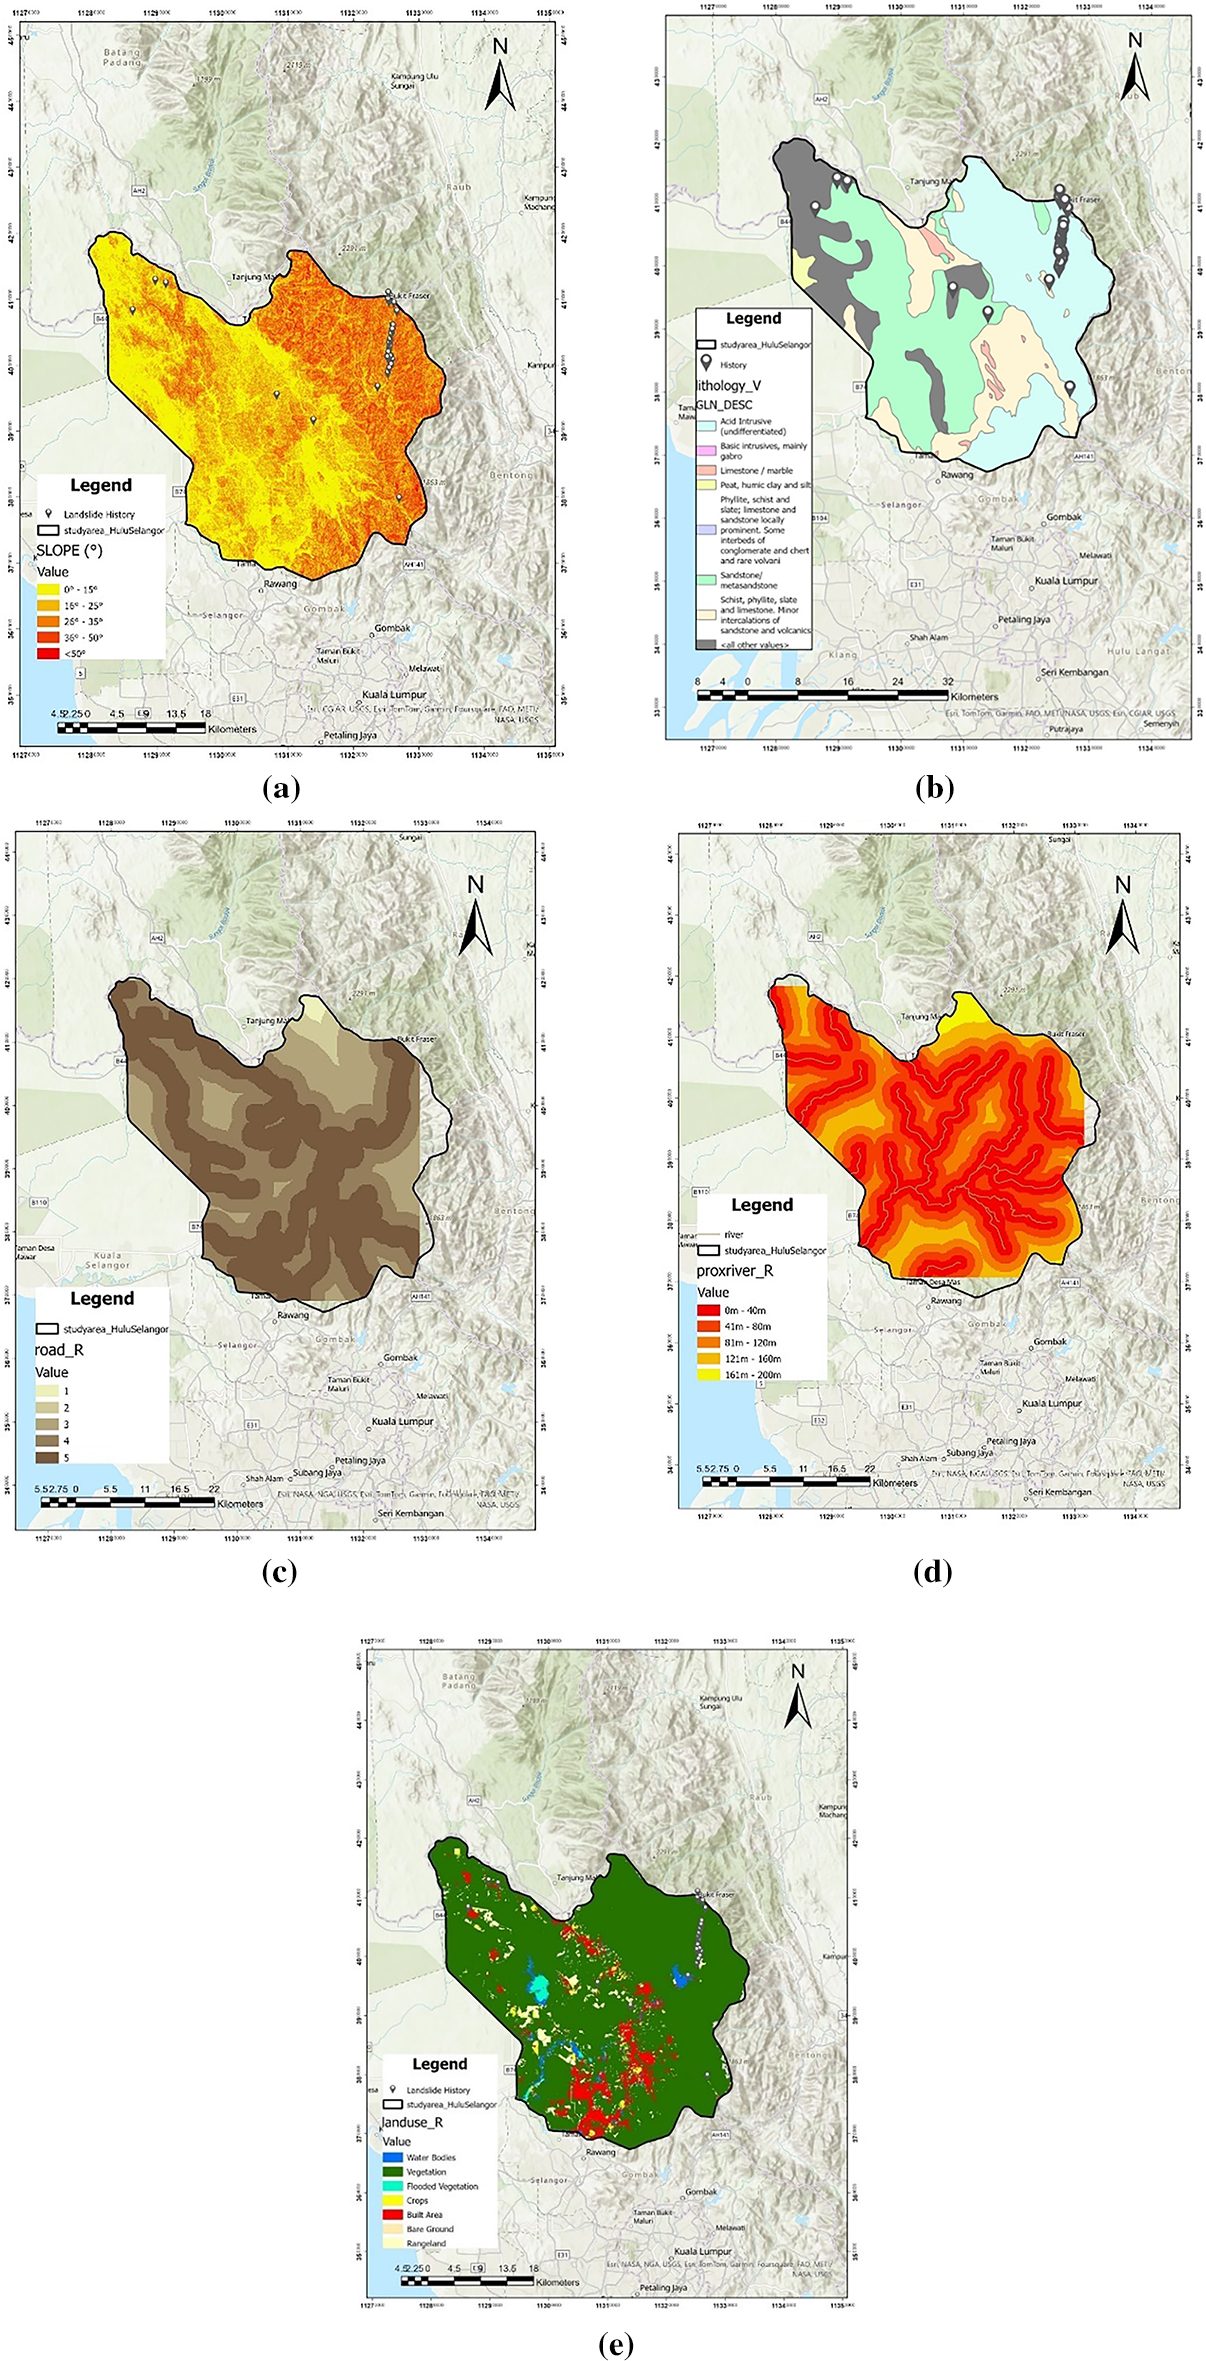
Figure 4: Criterion maps used for this study: (a) slope, (b) lithology, (c) road proximity, (d) river proximity, (e) land use
Lithology, with a weight of 23.12%, also plays a significant role, as different rock and soil types have varying resistance to erosion and failure. Weak or unconsolidated materials such as Peat, Humic Clay, and Silt receive the highest-class weight of 5 due to their susceptibility to landslides, while more resistant rock types like Acid Intrusive have a lower-class weight of 2. This classification is essential for assessing geological stability in landslide-prone areas.
Proximity to roads is assigned a weight of 13.76%, recognizing the impact of human activities on terrain stability. Areas closest to roads (0–40 m) receive the highest-class weight of 5, indicating that infrastructure development, excavation, and vibrations from traffic can contribute to instability. As the distance from roads increases, the risk decreases, with areas 161–200 m away having the lowest susceptibility (class weight of 1). This factor is particularly relevant in urban and semi-urban areas where road construction affects natural land stability.
In the same way, river proximity has a weight of 15.09%, given the potential for water bodies to erode. The greatest sensitivity is given to locations nearest the rivers (0–50 m) with a class weight of 5 due to the direct influence of water saturation and riverbank erosion on slope stability. The farther the location from the river, the lower the class weight, with places more than 250 m away being the least sensitive.
Finally, land use carries a weight of 7.52%, since varying land cover categories affect water holding capacity, erosion, and slope stability. Developed areas and exposed ground have the maximum class weight of 5 and 4, respectively, since they have lower vegetation cover and the capability of surface runoff. Water bodies and dense forests, on the other hand, have lower class weights, representing their stabilizing influence on slopes. Crops and submerged vegetation are moderately weighted since their soil-holding capacity is subject to variation with agricultural practices and seasonal conditions. In general, this table can show clearly how various environmental and anthropogenic factors are weighted in determining landslide susceptibility. The systematic classification system allows for a systematic method of risk assessment, contributing to disaster management and land-use planning through GIS-based modelling and spatial analysis.
3.5 Landslide Susceptibility Map of Hulu Selangor
Fig. 5 shows the output of the landslide susceptibility map of Hulu Selangor, which effectively delineates landslide-prone zones based on the factors influencing them, while Fig. 3 shows the criterion maps used for this study. Susceptibility ranges from non-susceptible (1) to Very High Susceptibility (5), and the dominant pattern is controlled by river proximity and road proximity. This is due to river proximity (15.09%) and road proximity (13.76%), which were both assigned medium weight values using the AHP analysis, influencing the overall susceptibility class. There are several key findings from Fig. 5.
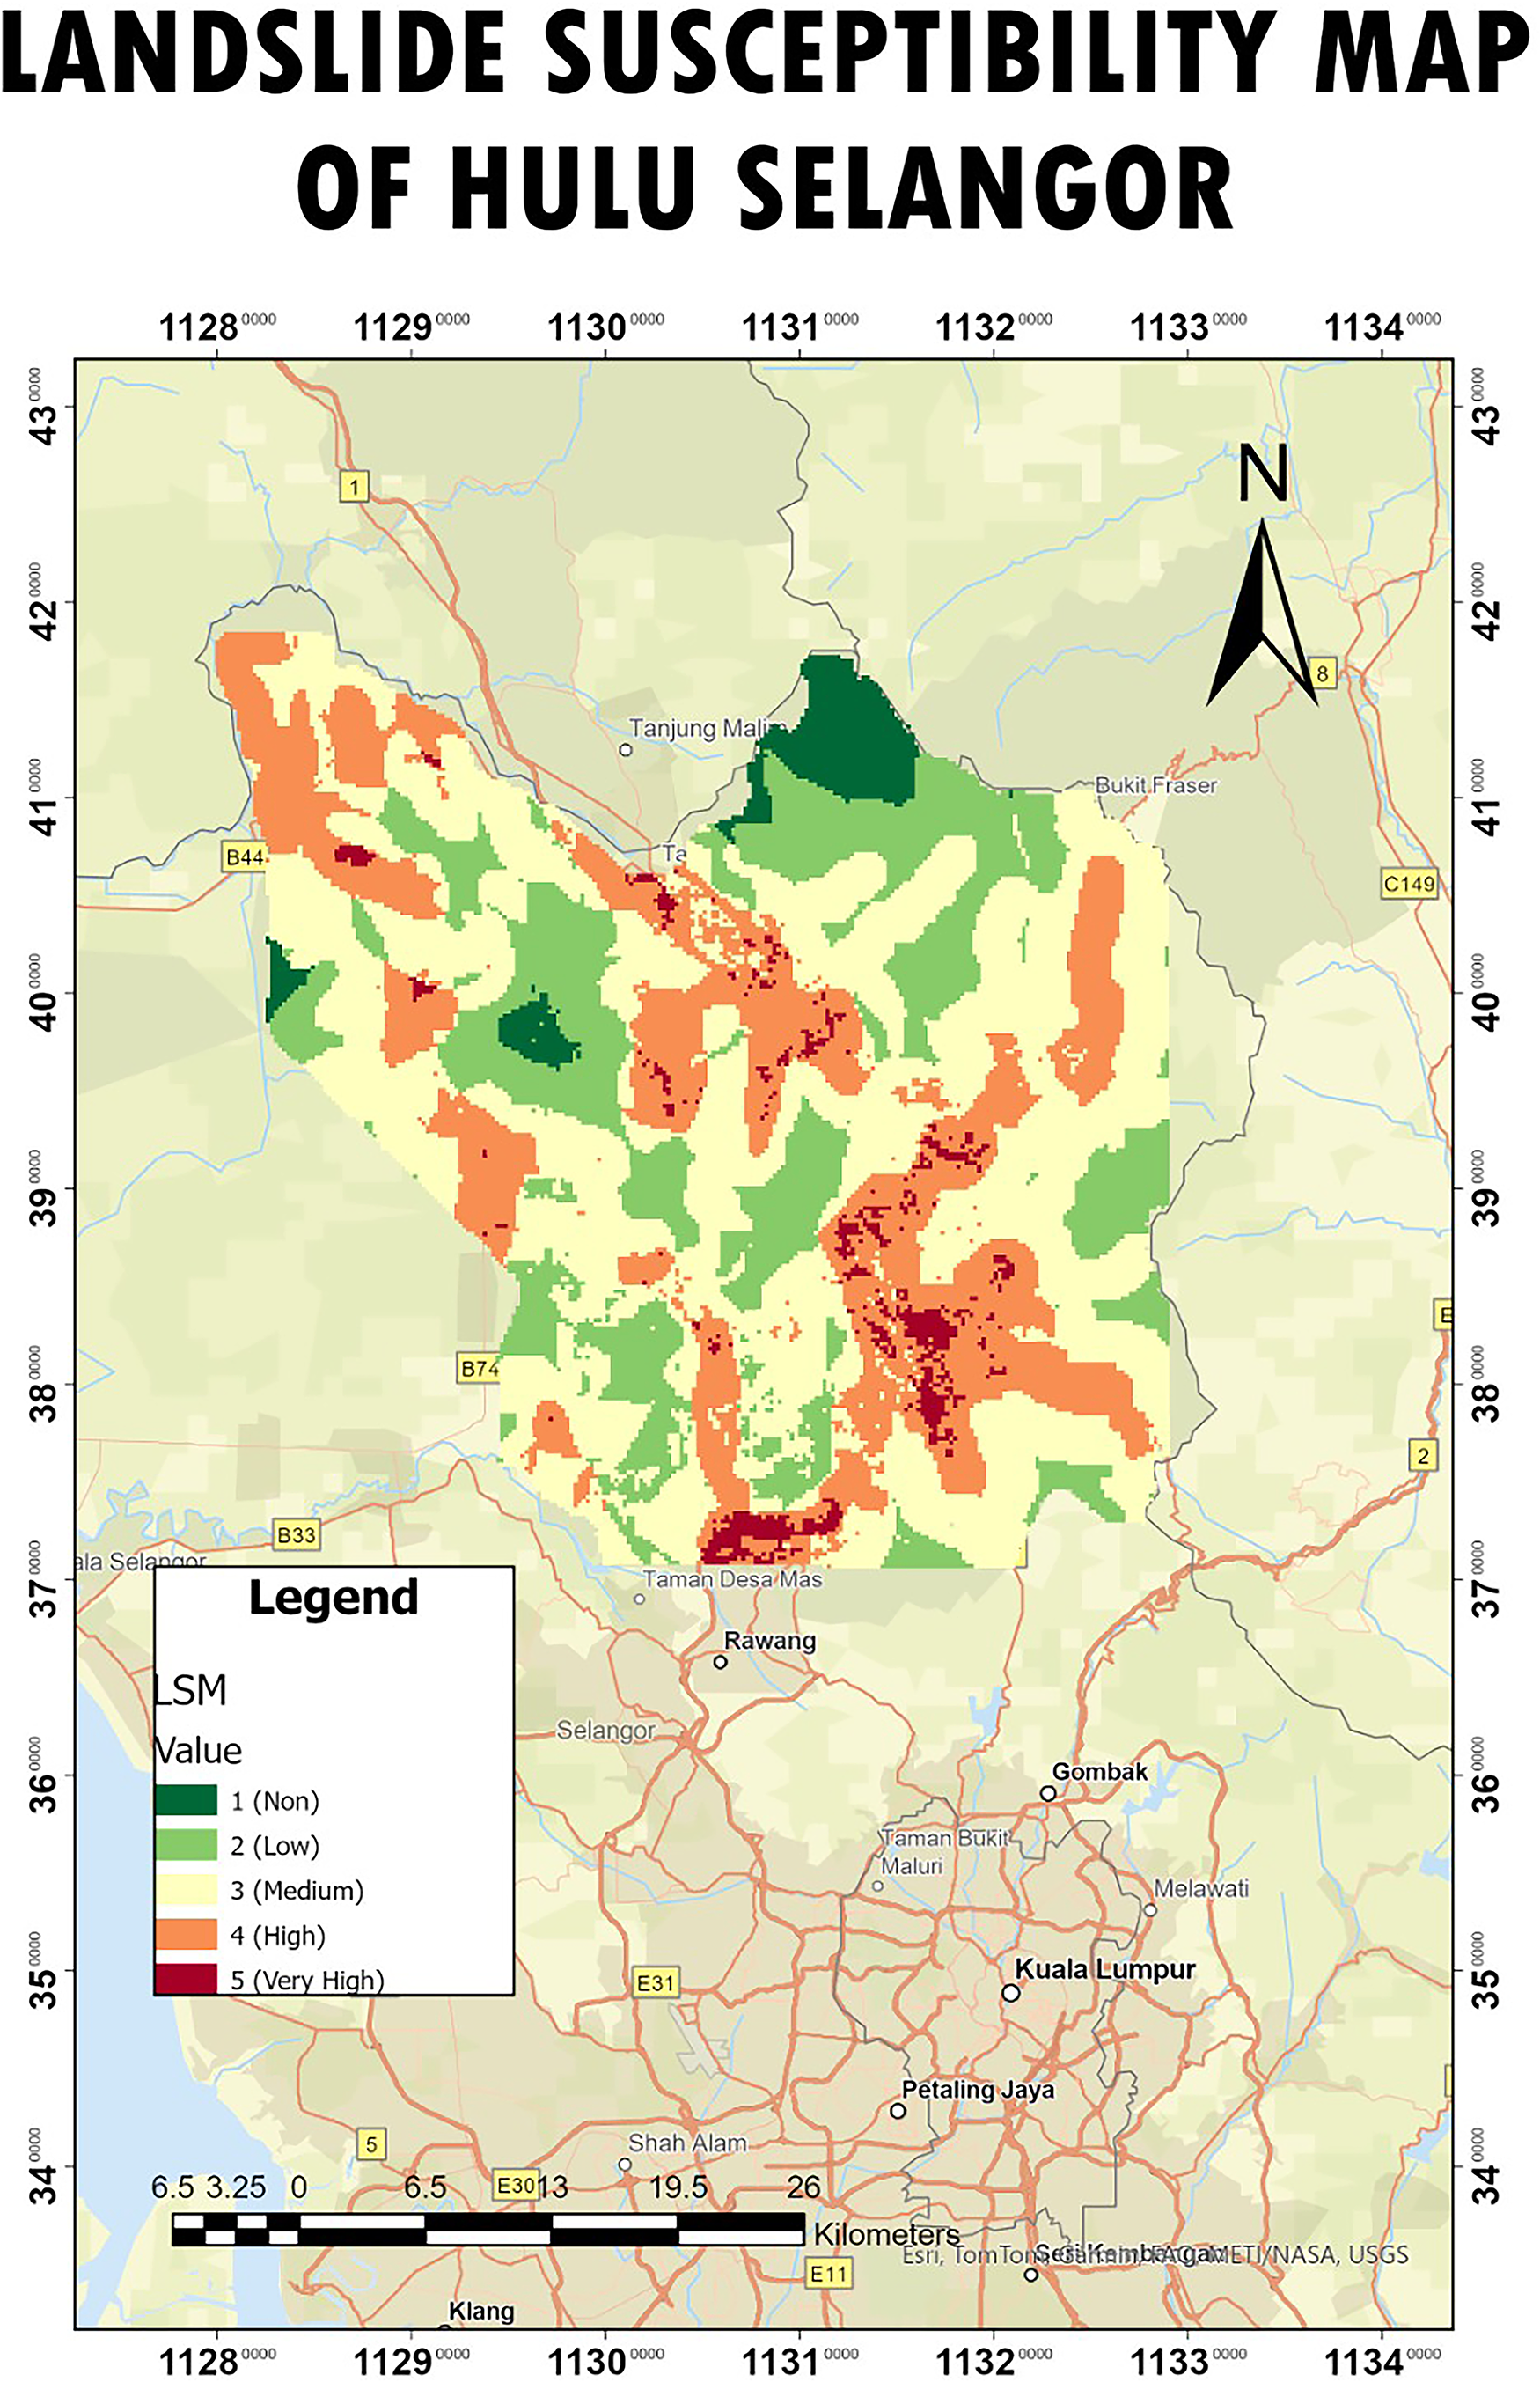
Figure 5: Landslide susceptibility map
i. Spatial Pattern Influence
The susceptibility level pattern follows river networks and road networks. This shows that human development and hydrological processes are involved in landslide susceptibility in the study area. Slope (40.50%) and Lithology (23.12%) possess the highest weights, as expected, since steep slopes and weak geological structures are significant landslide causes. Land use (7.52%), though the least, also plays a part, likely in areas where deforestation or urbanization has altered natural stability.
ii. Landslide Susceptibility Distribution
The Medium Susceptibility (3) zone covers the largest portion in the study area; thus, most areas have a high likelihood of landslides happening. Areas which are classified as High (4) and Very High (5) susceptibility areas are grouped in specific areas, representing localized landslide-prone areas which require special observation and mitigation measures.
iii. Critical Implications
Since the areas with Medium Susceptibility have a high percentage, landslide occurrence in these areas is most probable, and they may even have the potential to be hazardous to infrastructure and human settlements. Places on major rivers and roads require special attention because they are bound to be exposed to repeated landslides and disturbances. Effective mitigation efforts, such as slope stabilization, improvement of drainage, and controlled land use planning, should be considered in order to reduce hazard occurrence in vulnerable locations.
Table 8 shows the sum of counts for different levels of landslide susceptibility in the study area. The x-axis (Value) is employed to represent the classes of susceptibility, while the y-axis (Sum of Count) represents the sum of pixels (or grid cells) classified into each class. The numerical figures represent the exact number of pixels in each class. Medium Susceptibility is the most common, with 17,174 pixels; thus, most of the study area falls under this zone. High Susceptibility stands at the second position with 9125 pixels, demonstrating a large number of areas that possess a rather high potential for landslides. Low Susceptibility is comprised of 8191 pixels, showing there are still significant portions with lower landslide possibilities. Non-Susceptible contains the smallest amount (1269 pixels), suggesting very few areas are free from landslide susceptibility. Very High Susceptibility is covered by 948 pixels, showing a slim but notable portion of the area that is extremely susceptible to landslides.
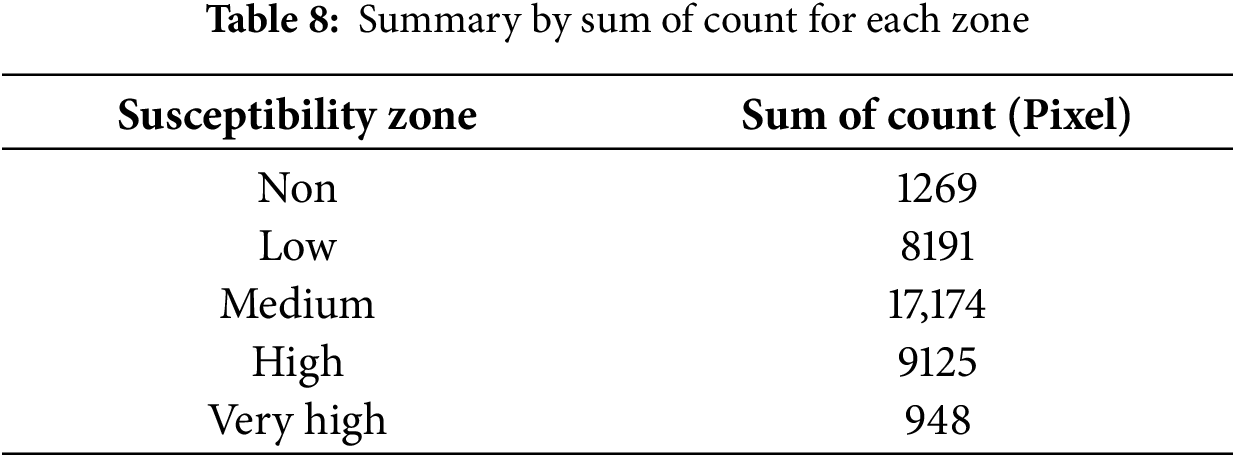
The distribution of Susceptibility levels shows that the majority of the study area falls under Medium and High Susceptibility zones, i.e., landslides pose a moderate to high degree of concern for the area. The presence of Very High Susceptibility areas, though negligible, is particularly significant because these are high-risk zones where landslides are likely to occur. Steep slopes, soil types that are unstable, land use changes, deforestation, and proximity to rivers or fault lines are some of the factors that could be responsible for this trend. The lower figure for non-susceptible areas also confirms that the study area is mostly susceptible to landslides, with only a few areas being completely safe.
To better understand the spatial pattern of the dominant Medium Susceptibility zones, further analysis of the underlying factors is essential. This involves examining whether the prevalence of these zones is primarily attributable to the natural terrain features, such as slope distribution and geological conditions, or if anthropogenic activities significantly influence their extent. Preliminary observations suggest that the medium susceptibility areas often occur on moderately steep slopes and regions with altered land use, pointing to a combination of natural and human-induced factors. By analyzing the spatial distribution of slope gradients, land use types, proximity to infrastructure like roads and rivers, and land cover changes, we can identify the key drivers behind this pattern. Such analysis can reveal whether moderate slopes, which are prevalent in the study area, inherently pose a moderate landslide risk, or if land modifications like deforestation and urbanization are amplifying susceptibility. Understanding these influences enables targeted mitigation strategies, whether by reinforcing natural stability or regulating human activities that exacerbate landslide potential in these zones.
The accuracy of landslide susceptibility maps requires validation to guarantee that the information generated through AHP and GIS analysis for this study is reliable. The landslide susceptibility map (LSM) of Hulu Selangor, as identified in this study, is applied as a predictive model to identify areas susceptible to landslides. Validation of the LSM is a critical process to determine the reliability and accuracy of the susceptibility estimation. Historical landslide events were superimposed over the LSM while validating the LSM to see if the past occurrences match with areas that are labeled as susceptible. The landslide occurrence records were accessed from Jabatan Kerja Raya Negeri Selangor (JKR Selangor), representing documented landslide occurrences in the study area. Fig. 6 shows the landslide susceptibility map with the location of the landslide history.
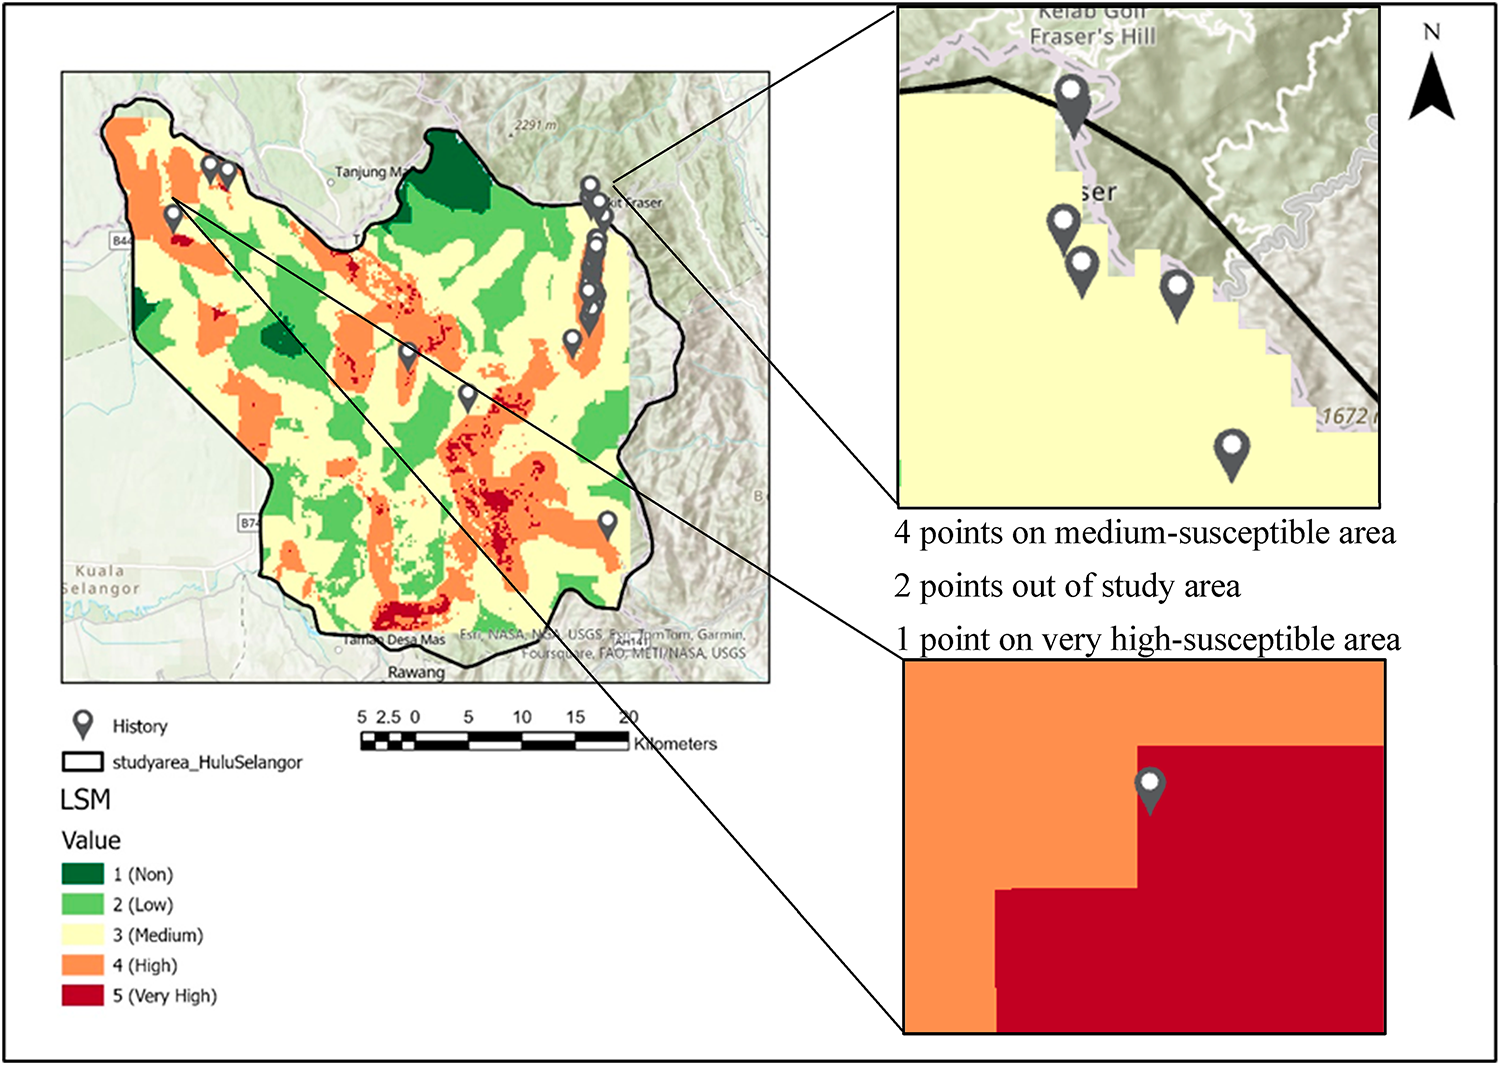
Figure 6: Landslide history location in a specific area
From Fig. 6, after validation, there are four instances of landslides in medium susceptibility, one of very high susceptibility, and two outside the study area. The distribution of the landslide locations in these areas indicates that the model performs well in delineating hazard zones because most of the landslides are in the susceptible zones. The existence of landslides in areas of medium susceptibility highlights the need for further improvement, possibly by employing other environmental factors such as soil conditions or hydrology. Overall, the validation results agree with the model’s validity in landslide susceptible area prediction but also identify areas of potential improvement in the hazard assessment.
Overall, overlay analysis between past landslide sites and the LSM provides very important validation that the obtained susceptibility zones conformed with prior experiences of landslides. The results demonstrate the importance of proactive countermeasures in areas of High and Very High Susceptibility, particularly where infrastructure and human settlement already exist. Future research may employ more sophisticated geospatial techniques and machine learning approaches to enhance the predictive capability and accuracy of landslide susceptibility maps in Hulu Selangor.
The percentage of accuracy for landslide susceptibility map was calculated using the equation as shown in Eq. (5). There is a total of 41 landslide historical locations within the study area, provided by JKR Selangor, 39 out of 41 locations fall within the susceptible zones from medium to very high zones, while another 2 locations fall outside of the study area as depicted in Fig. 6. Since 39 points out of 41 points landslide occurrences fall under the susceptibility zones, the validation of LSM by historical landslide occurrence is 95% accurate. Hence, it shows that the model could predict landslide occurrences in the study area, suggesting high reliability of susceptibility mapping
Important information that can greatly improve local disaster risk management and land-use planning is provided by the landslide susceptibility map created for Hulu, Selangor. This map can be used by authorities to prioritize targeted actions in high-risk locations, such as those categorized as High and Very High Susceptibility. For example, to avoid making landslide risks worse, land use, urbanization, and infrastructure development in these high-risk areas should be strictly restricted. Important policy actions based on these results include developing early warning systems, implementing land use regulations that limit development and deforestation in susceptible areas, and defining safe zones for vital infrastructure. In order to successfully reduce the danger of landslides, the map can also direct the creation of slope stabilization initiatives, enhanced drainage systems, and managed urban expansion. To lessen risk, protect people, and encourage sustainable development in Hulu, Selangor, local authorities may incorporate these lessons into land-use restrictions and disaster preparation strategies.
This study integrates geospatial technology and multi-criteria decision analysis, specifically AHP, to assess the landslide susceptibility in Hulu Selangor. The result shows that this study successfully achieved the aim first; it identified the key parameters contributing to landslide susceptibility in Hulu Selangor, with slope emerging as the most critical factor, holding the highest weightage (0.4050) among all criteria. Second, it analysed the slope characteristics of areas vulnerable to landslides, further reinforcing its significance in susceptibility assessment. Lastly, a comprehensive landslide susceptibility map was developed, categorizing the study area into five risk classes, which effectively highlights the regions most prone to landslides. The findings of this study provide valuable insights for disaster mitigation and land-use planning, aiding in the development of strategies to minimize landslide risks in Hulu Selangor.
Based on the study findings, proactive mitigation techniques and more research are necessary to diminish landslide hazards and safeguard at-risk populations in Hulu Selangor. The study indicated that a substantial area of the region is classified under Moderate to High Susceptibility zones, highlighting the necessity for focused risk mitigation strategies in land use planning, infrastructure development, and disaster management. Critical infrastructure, such as dwellings, roads, bridges, schools, and hospitals, situated in High and Very High Susceptibility zones, must be identified and evaluated to execute appropriate mitigation strategies. Furthermore, deforestation and urban development in Medium to High Susceptibility areas must be regulated, since the elimination of vegetation diminishes soil cohesiveness, resulting in heightened erosion and elevated landslide hazards. Hydrological variables greatly influence slope stability; hence, locations with excessive precipitation and inadequate drainage systems should be prioritised for improvement, since extended soil saturation can markedly increase landslide hazards, even in zones designated as Medium Susceptibility.
In future studies, including further geographical and environmental variables will improve the precision of landslide susceptibility evaluations. Rainfall intensity and historical precipitation data must be integrated to examine the impact of severe weather patterns on landslide occurrences. Evaluations of seismic activity are essential, as earthquakes may substantially induce landslides, especially in tectonically active regions. Subsequent research should investigate geological and soil characteristics to enhance understanding of terrain stability and subsurface conditions. Furthermore, anthropogenic factors, such as accelerated urbanisation, deforestation, and infrastructure development, must be evaluated to ascertain the impact of human activities on landslide susceptibility over time. Advanced machine learning models, such as Random Forest and Support Vector Machine, may enhance landslide forecasting by integrating with conventional AHP-based approaches.
Acknowledgement: Authors would like to thank all agencies that provide sufficient data in completing this research.
Funding Statement: The authors received no specific funding for this study.
Author Contributions: The authors confirm contribution to the paper as follows: study conception and design: Ainon Nisa Othman, Izzah Liyanamadihah Ibrahim; data collection: Noorfatekah Talib, Sarah Shaharuddin; analysis and interpretation of results: Izzah Liyanamadihah Ibrahim, Ainon Nisa Othman, Nurhanisah Hashim; draft manuscript preparation: Izzah Liyanamadihah Ibrahim, Nurhanisah Hashim, Ainon Nisa Othman. All authors reviewed the results and approved the final version of the manuscript.
Availability of Data and Materials: All data used in this study provided by several public agency in Malaysia. Application from university is needed upon applications.
Ethics Approval: Not applicable.
Conflicts of Interest: The authors declare no conflicts of interest to report regarding the present study.
References
1. Majid NA, Taha M, Selamat S. Historical landslide events in Malaysia 1993–2019. Indian J Sci Technol. 2020;13(33):3387–99. doi:10.17485/ijst/v13i33.884. [Google Scholar] [CrossRef]
2. Li Y, Wang X, Mao H. Influence of human activity on landslide susceptibility development in the three gorges area. Nat Hazards. 2020;104(3):2115–51. doi:10.1007/s11069-020-04264-6. [Google Scholar] [CrossRef]
3. Benz SA, Blum P. Global detection of rainfall-triggered landslide clusters. Nat Hazards Earth Syst Sci. 2019;19(7):1433–44. doi:10.5194/nhess-19-1433-2019. [Google Scholar] [CrossRef]
4. Lee JU, Cho YC, Kim M, Jang SJ, Lee J, Kim S. The effects of different geological conditions on landslide-triggering rainfall conditions in south Korea. Water. 2051 2022;14(13):2051. doi:10.3390/w14132051. [Google Scholar] [CrossRef]
5. Zhang D, Jindal D, Roy N, Vangla P, Frost JD. Enhancing landslide susceptibility mapping using a positive-unlabeled machine learning approach: a case study in Chamoli, India. Geoenviron Disasters. 2024;11(1):21. doi:10.1186/s40677-024-00281-w. [Google Scholar] [CrossRef]
6. Jabatan Ukur dan Pemetaan Malaysia (JUPEM). Info hulu selangor [Internet]; 2007 [cited 2025 Oct 27]. Available from: https://mphs.gov.my/ms/mphs/info-hulu-selangor. [Google Scholar]
7. Bui QD, Luu C, Mai SH, Ha HT, Ta HT, Pham BT. Flood risk mapping and analysis using an integrated framework of machine learning models and analytic hierarchy process. Risk Anal. 2023;43(7):1478–95. doi:10.1111/risa.14018. [Google Scholar] [PubMed] [CrossRef]
8. Setiausaha Kerajaan Negeri Selangor. Rancangan selangor pertama. mid term review [Internet]; [cited 2025 Oct 27]. Available from: https://www.selangor.gov.my/selangor/resources/user_87/Dokumen%20KSP%20RS-1/RS1_MTR_(ENG).pdf. [Google Scholar]
9. Naceur HA, Abdo HG, Igmoullan B, Namous M, Almohamad H, Al Dughairi AA, et al. Performance assessment of the landslide susceptibility modelling using the support vector machine, radial basis function network, and weight of evidence models in the N’fis river basin, Morocco. Geosci Lett. 2022;9(1):39. doi:10.1186/s40562-022-00249-4. [Google Scholar] [CrossRef]
10. Kakavas MP, Nikolakopoulos KG. Digital elevation models of rockfalls and landslides: a review and meta-analysis. Geosciences. 2021;11(6):256. doi:10.3390/geosciences11060256. [Google Scholar] [CrossRef]
11. Bi R, Gan S, Yuan X, Li R, Gao S, Yang M, et al. Multi-view analysis of high-resolution geomorphic features in complex mountains based on UAV-LiDAR and SfM-MVS: a case study of the northern pit rim structure of the mountains of Lufeng. China Appl Sci. 2023;13(2):738. doi:10.3390/app13020738. [Google Scholar] [CrossRef]
12. Saygin F, Şişman Y, Dengiz O, Şişman A. Spatial assessment of landslide susceptibility mapping generated by fuzzy-AHP and decision tree approaches. Adv Space Res. 2023;71(12):5218–35. doi:10.1016/j.asr.2023.01.057. [Google Scholar] [CrossRef]
13. Alahakoon AMRNK, Thisara Sathsara KL, Arachchige USPR, Subasinghea S, Alam E. Land-Use/ land-cover changing trends and their relation to landslides: a case study of Hali-Ela in Badulla District, Sri Lanka. Ecol Environ Conserv Pap. 2022;28:S6–S13. doi:10.53550/EEC.2022.v28i02s.002. [Google Scholar] [CrossRef]
14. Nor Diana MI, Muhamad N, Taha MR, Osman A, Ala MM. Social vulnerability assessment for landslide hazards in Malaysia: a systematic review study. Land. 2021;10(3):315. doi:10.3390/land10030315. [Google Scholar] [CrossRef]
15. Capobianco V, Choi CE, Crosta G, Hutchinson DJ, Jaboyedoff M, Lacasse S, et al. Effective landslide risk management in era of climate change, demographic change, and evolving societal priorities. Landslides. 2025;22(9):2915–33. doi:10.1007/s10346-024-02418-2. [Google Scholar] [CrossRef]
16. Sim KB, Lee ML, Wong SY. A review of landslide acceptable risk and tolerable risk. Geoenviron Disasters. 2022;9(1):3. doi:10.1186/s40677-022-00205-6. [Google Scholar] [CrossRef]
17. Moradi S, Heinze T, Budler J, Gunatilake T, Kemna A, Huisman JA. Combining site characterization, monitoring and hydromechanical modeling for assessing slope stability. Land. 2021;10(4):423. doi:10.3390/land10040423. [Google Scholar] [CrossRef]
18. Emeka OJ, Nahazanan H, Kalantar B, Khuzaimah Z, Sani OS. Evaluation of the effect of hydroseeded vegetation for slope reinforcement. Land. 2021;10(10):995. doi:10.3390/land10100995. [Google Scholar] [CrossRef]
19. Ivanik OM, Kravchenko DV, Tustanovska LV, Mazko AE, Hadiatska KP. The main causes of landslide hazards in Kyiv region, Ukraine. In: Proceedings of the XIV International Scientific Conference Monitoring of Geological Processes and Ecological Condition of the Environment; 2020 Nov 10–13; Kyiv, Ukraine. Utrecht, the Netherlands: European Association of Geoscientists & Engineers; 2020. p. 1–5. doi:10.3997/2214-4609.202056070. [Google Scholar] [CrossRef]
20. Schuster RL, Highland LM. Impact of landslides and innovative landslide-mitigation measures on the natural environment. Int Conf Slope Eng Hong Kong China. 2003;8(10):46. [Google Scholar]
21. Rotaru A, Bejan F, Almohamad D. Sustainable slope stability analysis: a critical study on methods. Sustainability. 2022;14(14):8847. doi:10.3390/su14148847. [Google Scholar] [CrossRef]
22. Yang Y, Yang Z, Xu W, Fayou A, Guo Y, Zheng J. Research on the failure mechanism and treatment technology of landslides in typical accumulation bodies along highways in Qinghai Province. Water. 2025;17(1):34. doi:10.3390/w17010034. [Google Scholar] [CrossRef]
23. Zhou S, Zhou S, Tan X. Nationwide susceptibility mapping of landslides in Kenya using the fuzzy analytic hierarchy process model. Land. 2020;9(12):535. doi:10.3390/land9120535. [Google Scholar] [CrossRef]
24. Tavoularis N, Papathanassiou G, Ganas A, Argyrakis P. Development of the landslide susceptibility map of Attica Region, Greece, based on the method of rock engineering system. Land. 2021;10(2):148. doi:10.3390/land10020148. [Google Scholar] [CrossRef]
25. Abraham MT, Satyam N, Lokesh R, Pradhan B, Alamri A. Factors affecting landslide susceptibility mapping: assessing the influence of different machine learning approaches, sampling strategies and data splitting. Land. 2021;10(9):989. doi:10.3390/land10090989. [Google Scholar] [CrossRef]
26. Xu K, Xu J. A direct consistency test and improvement method for the analytic hierarchy process. Fuzzy Optim Decis Mak. 2020;19(3):359–88. doi:10.1007/s10700-020-09323-y. [Google Scholar] [CrossRef]
27. Saaty TL. How to make a decision: the analytic hierarchy process. Eur J Oper Res. 1990;48(1):9–26. doi:10.1016/0377-2217(90)90057-I. [Google Scholar] [CrossRef]
28. Saaty TL. Rank from comparisons and from ratings in the analytic hierarchy/network processes. Eur J Oper Res. 2006;168(2):557–70. doi:10.1016/j.ejor.2004.04.032. [Google Scholar] [CrossRef]
29. Sato Y, Tan KH. Inconsistency indices in pairwise comparisons: an improvement of the Consistency Index. Ann Oper Res. 2023;326(2):809–30. doi:10.1007/s10479-021-04431-3. [Google Scholar] [CrossRef]
Cite This Article
 Copyright © 2025 The Author(s). Published by Tech Science Press.
This work is licensed under a Creative Commons Attribution 4.0 International License , which permits unrestricted use, distribution, and reproduction in any medium, provided the original work is properly cited.
 Downloads
 Citation Tools