
 Submit a Paper
 Propose a Special lssue
 Open Access
ARTICLE
Identification of Air Cavities Using GPR under Different Soil Compaction Conditions Related to Sinkhole Formation
1 Centre of Studies for Surveying Science and Geomatics, Faculty of Built Environment, Universiti Teknologi MARA, Shah Alam, 40450, Malaysia
2 Department of Survey and Mapping Malaysia, Jalan Sultan Yahya Petra, Kuala Lumpur, 50578, Malaysia
* Corresponding Authors: Ainon Nisa Othman. Email: ; Mohamad Hezri Razali. Email:
(This article belongs to the Special Issue: Advancements in Geospatial Methods and Technologies for Sustainable Built Environment and Engineering)
Revue Internationale de Géomatique 2025, 34, 973-985. https://doi.org/10.32604/RIG.2025.071917
Received 15 August 2025; Accepted 28 November 2025; Issue published 24 December 2025
 View Full Text
 Download PDF
Abstract
Ground Penetrating Radar (GPR) is a widely used method that is non-destructive for underground or subsurface detection. It is used in various fields and has proved to be reliable and effective. This research focuses on detecting the presence of air cavities using GPR and analyzing the radargram output based on the compactness of soil and different frequencies. The compactness is used to illustrate the presence of cavities underground artificially. The research examines how variations in the compactness of soil affect the radargram response in showing the presence of cavities using different frequencies. Experimental results demonstrate that lower permittivity materials enhance signal penetration but reduce reflection contrast, whereas higher permittivity materials result in stronger reflections, improving cavity detection. The findings highlight the importance of frequency selection and material properties in optimizing GPR surveys for subsurface anomaly detection, and by having artificially created cavities, the results can be studied to see the changes.Keywords
Ground Penetrating Radar (GPR) operates by transmitting high-frequency electromagnetic (EM) waves into the ground and records the energy reflected from the subsurface components. The travel time of the reflected signal is used to estimate depth using the relationship
As a result, the radar reflections are stronger at interfaces where the dielectric constant is large, such as between dense soil and air-filled voids. It makes the GPR a valuable method in detecting sinkholes and subsurface voids where the dielectric discontinuities exist [2].
With the rapid urban development and growing infrastructure, the limited space the ground can provide is limited, causing the increased use of the underground areas, such as transportation, utilities, and more. As underground infrastructure grows, accurately mapping utility locations is crucial to maintaining up-to-date data and preventing issues [3].
In recent years, the GPR has gained a lot of attention due to its ability to image both metallic and non-metallic targets, which is an important aspect in multiple applications such as archaeological survey [4], landmines [5], agriculture, monitoring moisture content [6], or cavities underground, to name a few. It shows just how much potential the GPR has and its usability for many purposes. Research by [7] done in Morocco also talks about detecting cavities existing underground.
With increasing underground utilities in urban areas, space has become densely packed with pipes for water, energy, and communication [8]. According to [9], previous research has delved into the origins of road defects, where over 80% is related to underground utilities leakage and contributions from metro and activities. This study aims to identify underground air cavities and analyze soil compactness using B-scan, which provides clear subsurface visualization and the best results for this research. The problems identified before the continuance of this study are undetected underground hazards, lack of early detection, inadequate soil compaction, and radargram analysis. The analysis of the radargram is crucial during searching for and identifying the potential of sinkholes. On the internet, less research is done on radargram output regarding sinkholes. The research question that may arise is on how the parabola will look when it encounters cavities underground, does adjusting the frequency in GPR makes it easier to identify the cavities, and does the level of compactness of soil differs when displayed in the radargram. GPR B-scan data is important in detecting cavities, potential sinkholes, or areas prone to land depression [10]. C-scan is also mentioned as one of the ways to detect changes underground, such as leakage and cavities, because in reality, everything is constantly changing, and sometimes, there are hidden dangers caused by the changes [11].
This research aims to analyze the radargram output of air cavities underground from the GPR in different compactnesses of soil and its relation to the soil structure and depth accuracy, while the objectives are to identify the presence and absence of air cavity, to observe the difference on the GPR reading in different frequency and compactness of soil and to compare the real depth and GPR depth.
The experiment employed a ground-coupled GPR system equipped with 250, 500 MHz, and 1 GHz antennas to represent low, medium, and high frequencies, respectively. Using only a single line profile with multiple runs for data collection ensures the credibility of the data obtained and the consistency of the radargram output.
This section presents the flowchart process of this study, as shown in Fig. 1. The process begins with a preliminary study in Phase 1, followed by data acquisition in Phase 2, Phase 3 for data processing, and finally the data analysis in Phase 4. The flowchart has been developed to clarify the primary objective of this research. This study used GPR raw data on different compactnesses of soil with different frequencies.
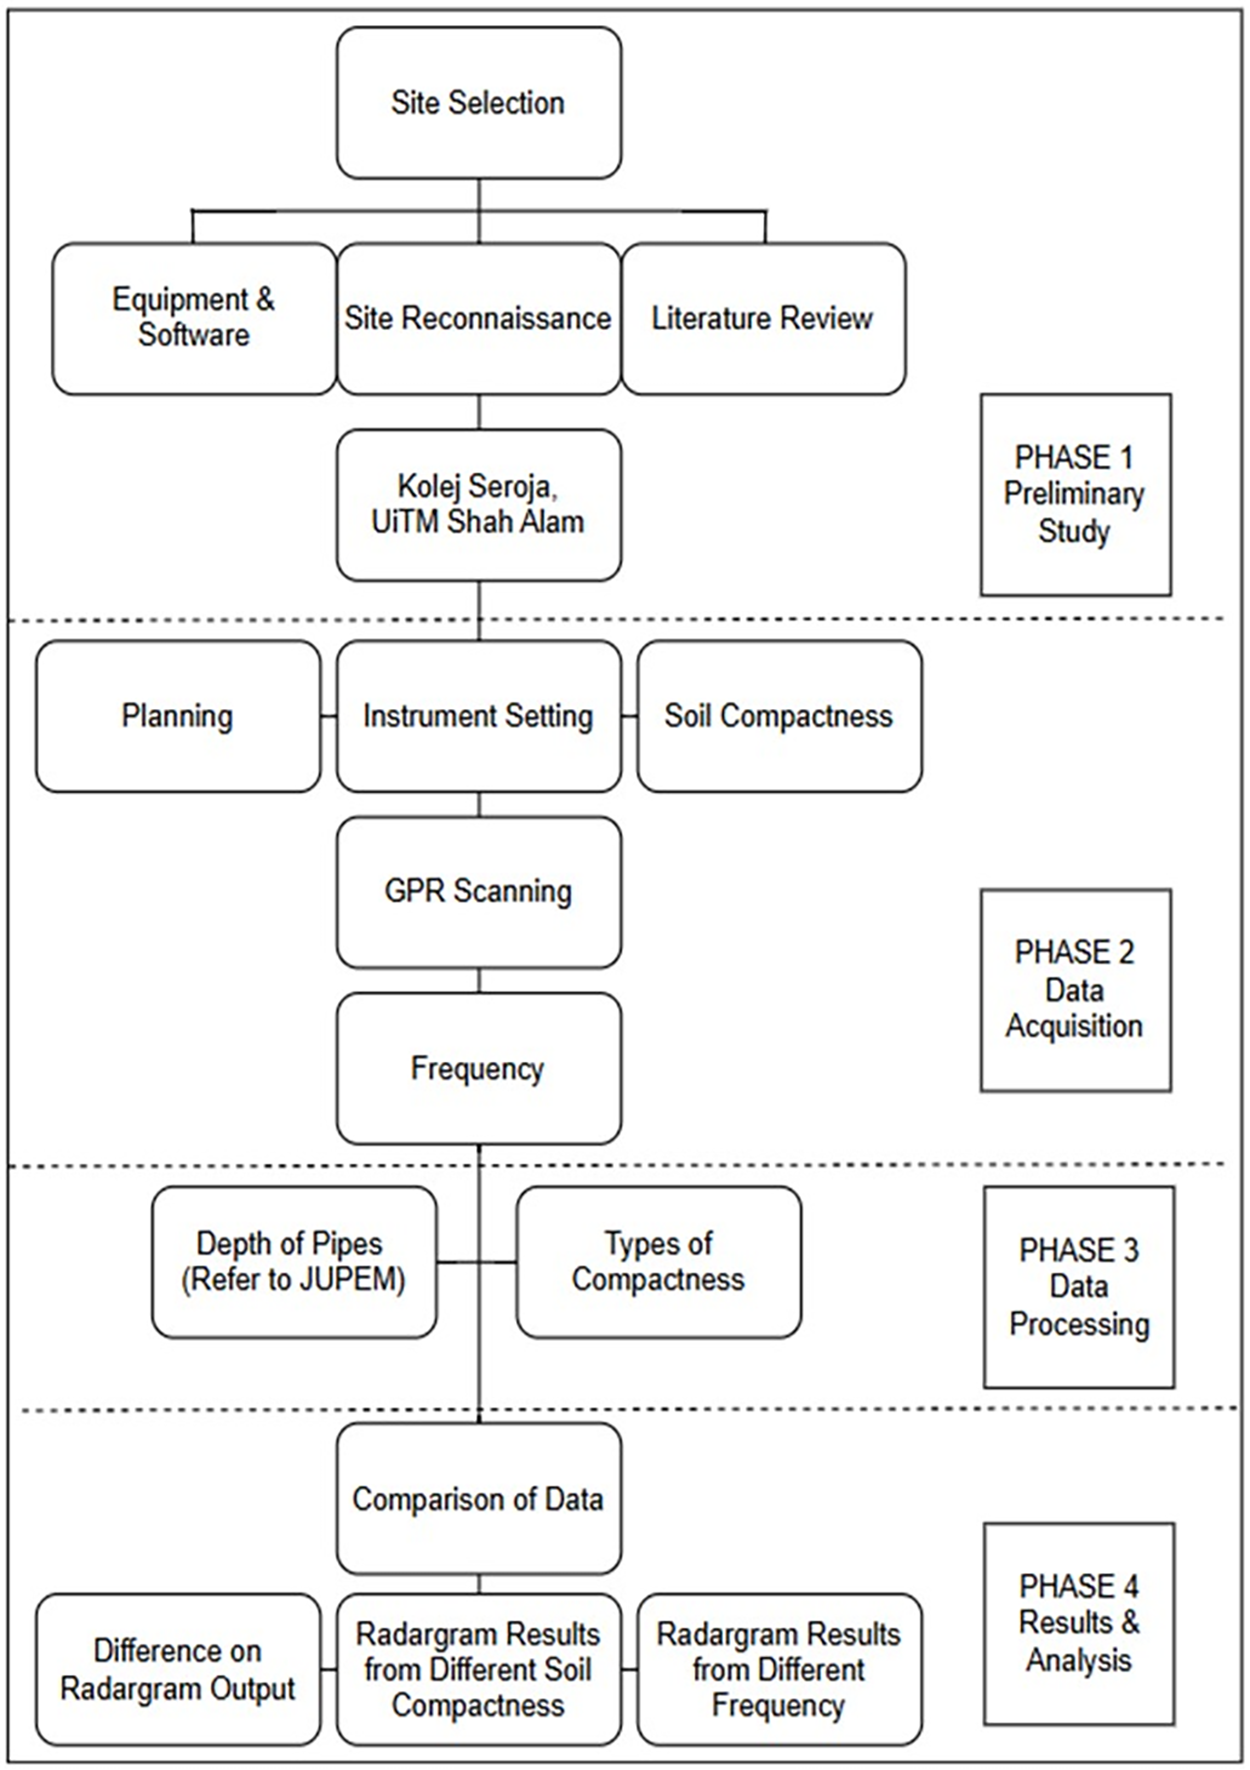
Figure 1: Overall methodology
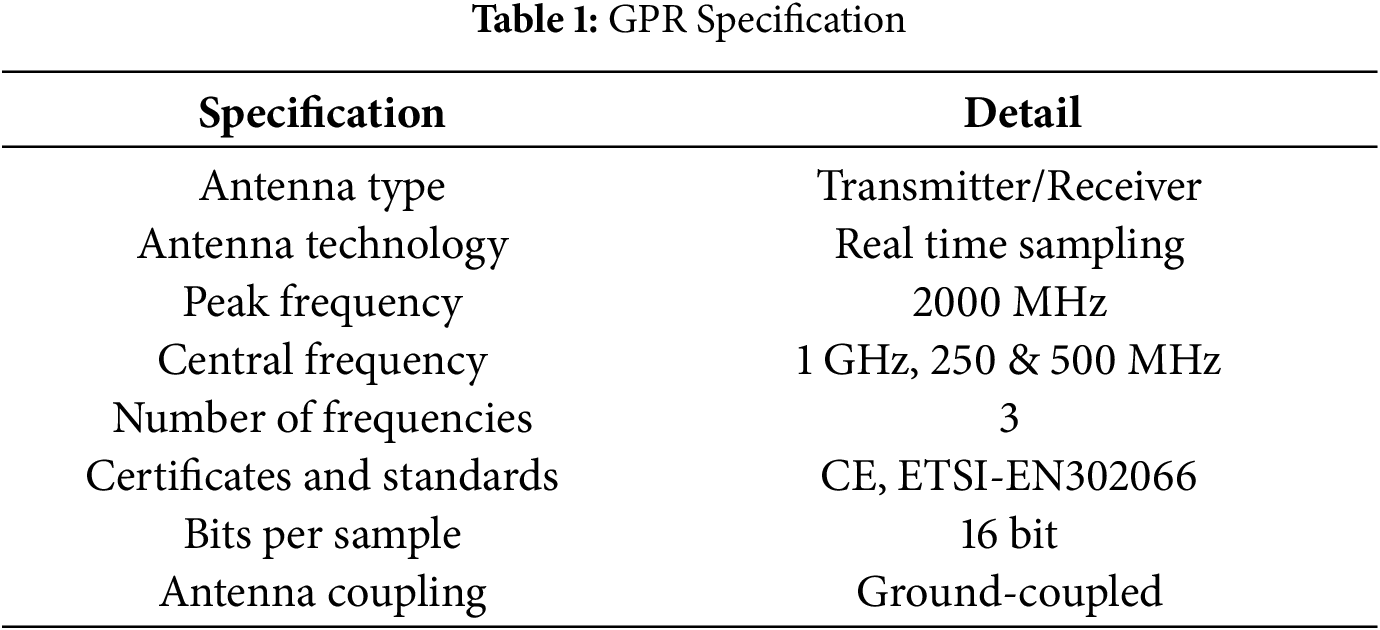
For Phase 2, the study area chosen is at Kolej Seroja, UiTM Shah Alam. It is chosen because of the surrounding area, which is far from the noisy traffic and residential area. It also has a flat ground surface, making it suitable for this study. A large and flat area is needed because, when conducting this study, the soil needed to be dug out based on the compactness of the soil. By following the requirements and preparing three types of compactness in the study area, the results can be studied to come up with a conclusion regarding the air cavities. Table 1 shows the instrument antenna specification used in this study.
The soil on site will be dug out to the preferred depth in Fig. 2. In this research, the dimension of the experiment is 1 m × 0.4 m × 0.5 m. Then, following the dimension, the soil is dug, and a pipe is planted following the specific types of compactness, which are the compact, semi-compact, and void soil. This is done in order to control the variable during this research. The time to do this experiment is really limited, as it needs to take into consideration the availability of the instrument, other classes, and weather conditions, causing the time to do the data collection to be limited.
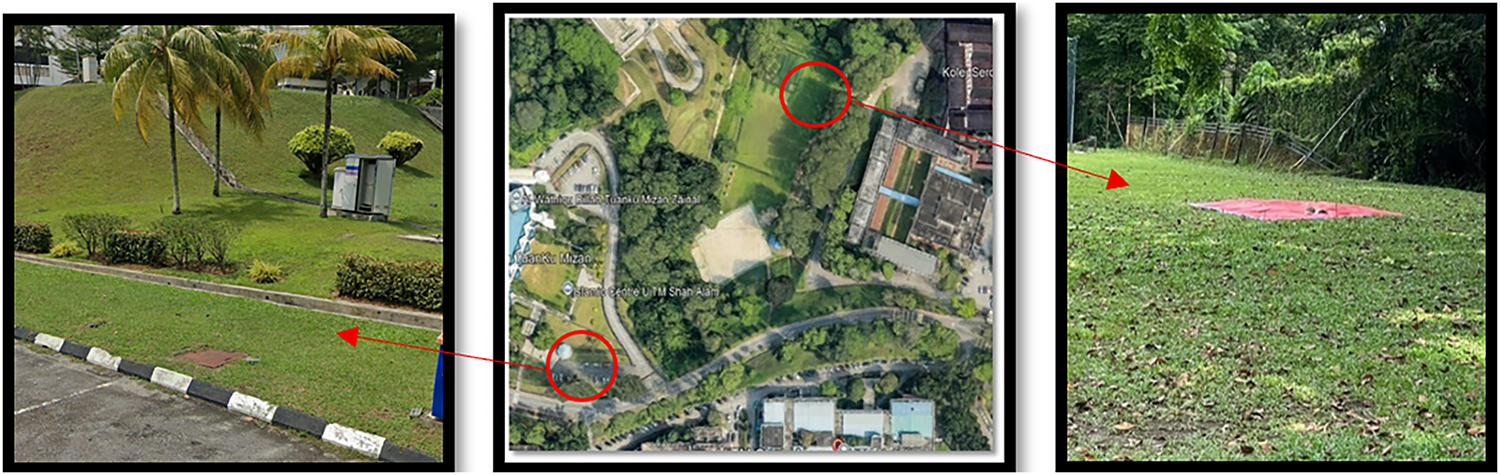
Figure 2: Study area of UiTM Shah Alam
For the void soil, the data is acquired by laying plywood over the hole to illustrate the absence of soil in the radargram. While for the semi-compact soil, the data is acquired by pushing in the dug out soil without compacting it, and when the soil is filled, the hole is once again covered with plywood to avoid the soil being compacted during observation. For the compact soil, the data is acquired by running the GPR as in Fig. 3 on an existing utility to observe the soil structure and radargram output. The data collection is done eight times for each type of compactness to see the consistency of the results in one day.
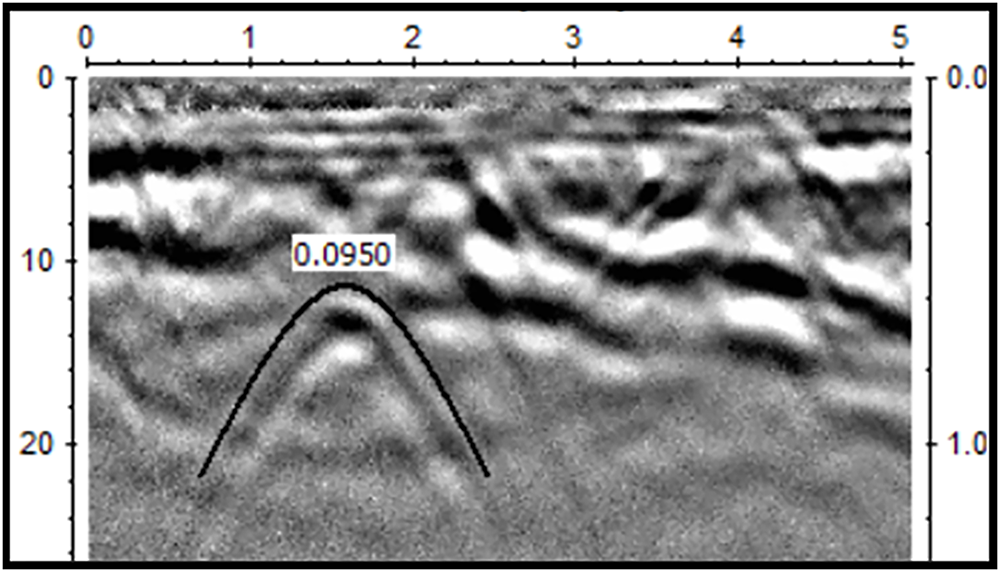
Figure 3: Compact soil in medium low frequency
This research involves simulating the presence and absence of an air cavity using GPR by artificially creating three different compactnesses of soil. By conducting analysis based on the results, a valuable finding can be made, such as the depth measurement and radargram output of each compactness of soil. The simulation-based approach helps in understanding radargram output. If a cavity exists underground, the surveyor can identify it.
The data processing is being done using the software Reflex2D and ReflexW to enhance the image for easier interpretation. It is a common software used to visualize the GPR data into a two-dimensional or three-dimensional view. This software provides efficient data visualization, data processing, and data interpretation for underground imaging. The output from the data processing is to provide efficient data visualization, data processing, and data interpretation for underground imaging [12]. The geophysical method has been developed to primarily investigate the shallow subsurface of the earth, building materials, and infrastructure [13].
GPR in radargram is widely used in fields such as archeology, utility mapping, engineering, and geology for interpretation and understanding the subsurface condition [14]. Before the hyperbola can truly be pinpointed, the radargram data needs to go through a series of filtration and enhancements such as move start time, dynamic correction, background removal, gain, and curve fitting. This series of filtration and enhancements is done to elevate the radargram output for better identification. After the enhancement process is done, the radargram output results will be collected. Based on the results shown the identification is based on the manipulation of the compactness of soil. Research by [15] also shows the study related to the presence of a cavity appearing between the joints of tiles and bricks.
Data analysis was done by comparing the data in terms of depth between the direct measurement and the GPR measurement. Furthermore, the radargram output from the different types of compactness will act as guidance. The different frequencies will also be analyzed to observe their relevance in detecting air cavities underground because each low and high frequency has its pros and cons. By identifying its reliability in this study, further development can be made.
The location for this study is at Kolej Seroja UiTM Shah Alam and Pusat Islam. The area at Kolej Seroja is large, and the surface is flat, making it suitable for this study, while Pusat Islam has an existing utility route, making it suitable for this data collection. Fig. 2 shows its location, as referred to the Google Maps and from a real picture captured using a handphone.
Table 2 shows the result of GPR readings from the visual of the radargram to identify the presence and absence of an air cavity.
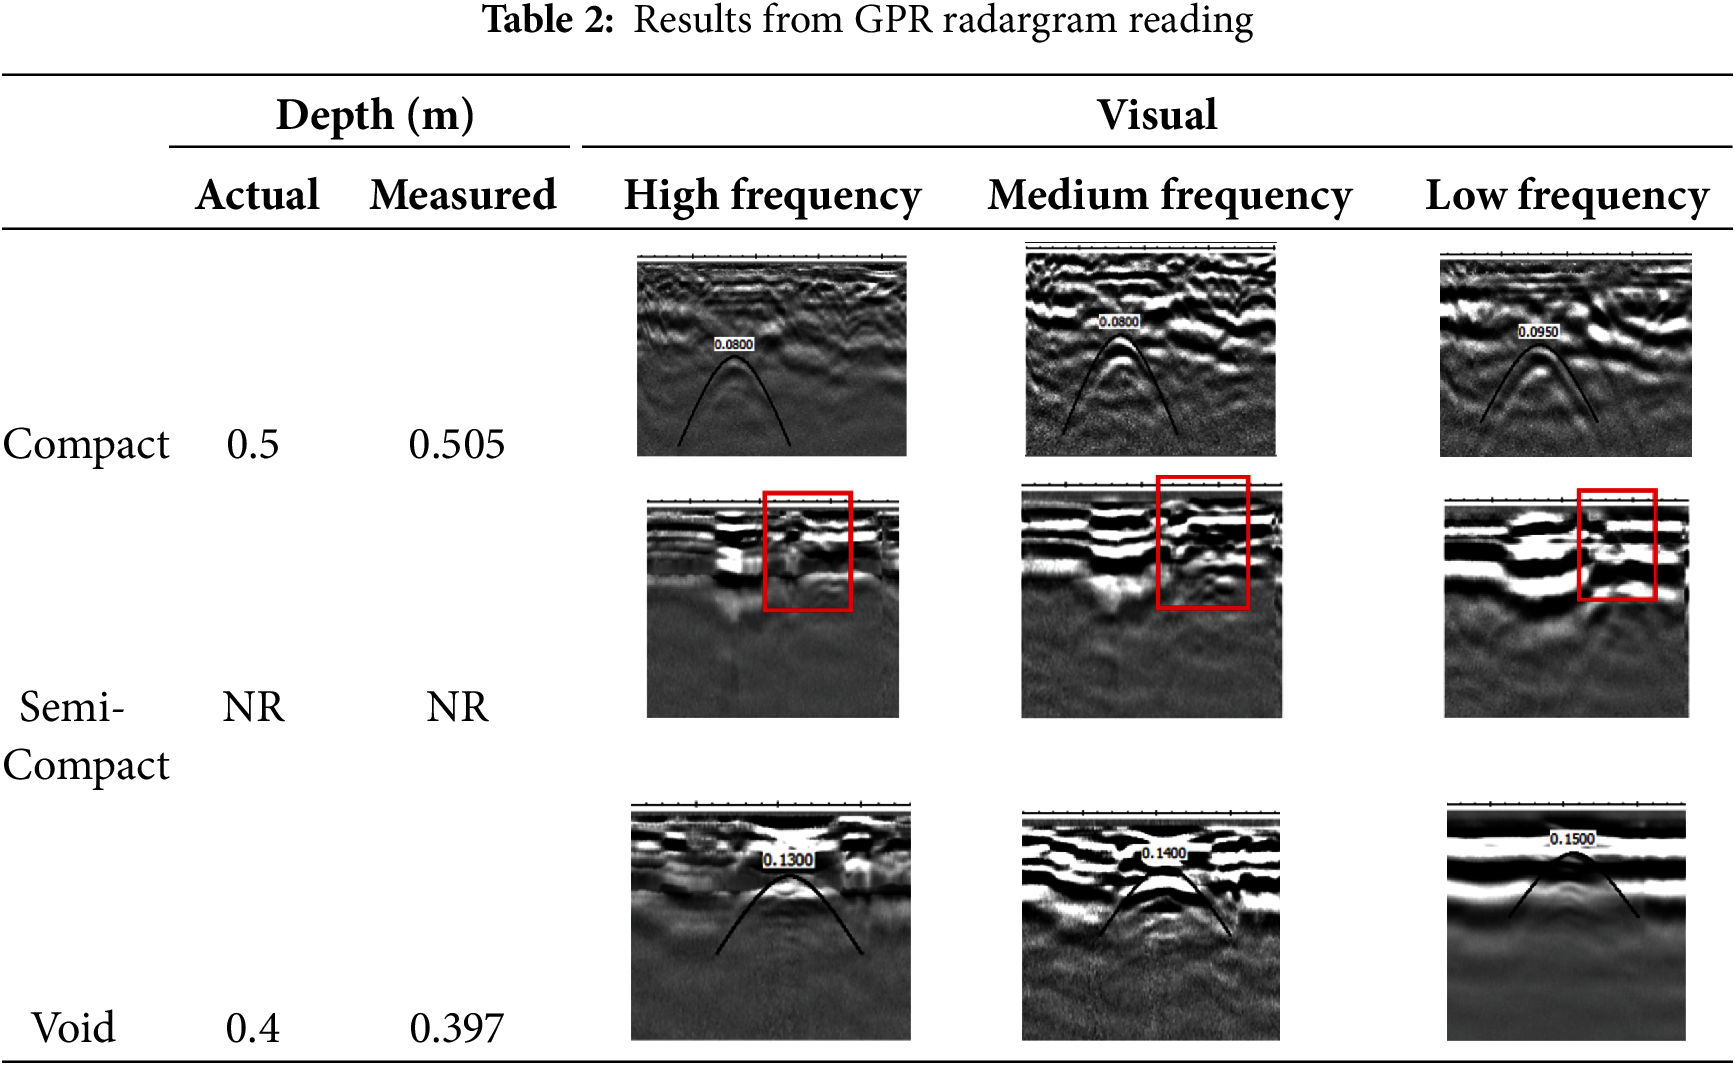
The results shown in Table 2 show how different compactnesses of soil reacted to the radar, where the condition of the soil is the same throughout the data collection process. The low-frequency (250 MHz) data achieved greater penetration but lower resolution, consistent with previous GPR soil studies. Medium-frequency (500 MHz) results balanced penetration and resolution, allowing clearer distinction of the buried pipe in void and compact soils. High-frequency (1 GHz) data enhanced detail near the surface but suffered rapid attenuation below 0.5 m.
Based on Table 2, high frequency provides shorter wavelengths and faster oscillations in the radar signal, while lower frequency provides longer wavelengths and slower oscillations. The resolutions of the radargram output show how the higher frequency provides a more detailed result, while the lower frequency the result will be vaguer result. The data acquisition of compact soil is done on an existing utility, while the void and semi-compact soil data acquisition is done by digging a hole to visualize it. For the void and semi-compact soil, a distortion in the radargram output shows how the signal reacts to different conditions of soil. For the semi-compact soil, the soil structure can be seen as the area where the loose soil is consistent, while the area with the loose soil shows inconsistencies. For the void soil, at the high and medium frequencies, there are additional radar waves added in the void area, showing the existence of a void in the area.
The measured depth is calculated using the formula d = vt/2, while the no reading (NR) in the table cannot be identified why is it like that. Even after multiple runs on the semi-compact soil, the result is still the same, where the parabola cannot be seen, thus making the depth NR.
One of the objectives is to observe the difference in the GPR reading in different frequencies and compactness of soil, as shown below. Refer to Fig. 3, which shows that in the compact soil, the signal for low frequency, which is 250 Hz, has a wider gap in between the signals and can propagate deeper into the soil, causing deeper penetration but lower resolution, just like in the radargram. It is useful in identifying the utility because of its longer wavelength and slower oscillation, ignoring the surrounding detail. The pipe underground can still be seen as a metal that has high permittivity, making it clear when identified. Compact soil can increase the load-bearing capacity and make it ideal for construction because of its great support [16].
Based on Fig. 4, the result of medium-high frequency for the compact soil, which is 500 Hz, shows that the gap between the signals is smaller than that of low frequency because of its faster oscillation, and the detail it captures is more than that of low frequency. It can also be seen that when the radar is entering the soil, the radargram shows a lot of detail even after the filtration and enhancement process. The radargram output before the enhancement process shows the signal clearly, but after the enhancement process, the output shows a rugged shape radargram.
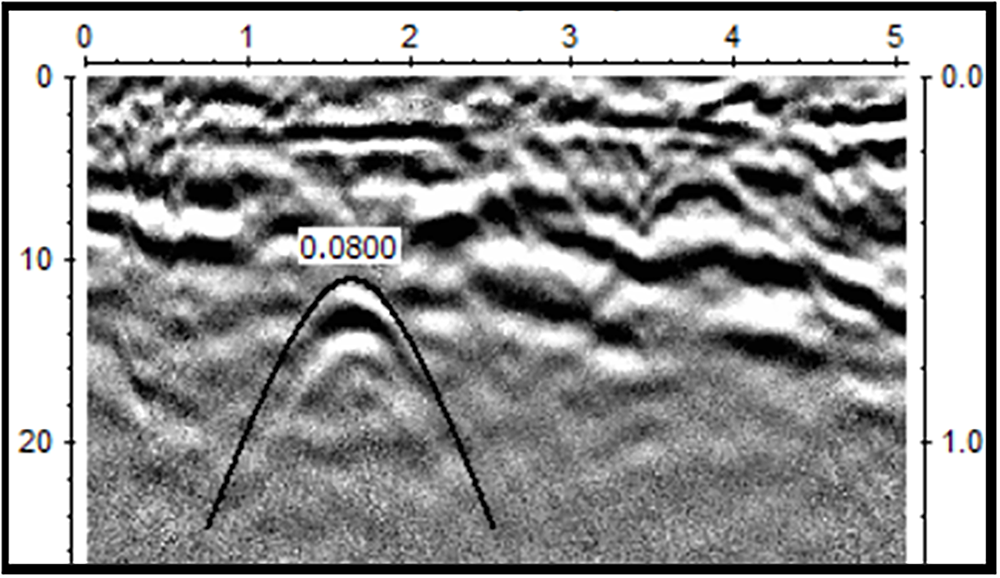
Figure 4: Compact Soil in medium high frequency
As referred to Fig. 5, the result of high frequency, which is 1 GHz in compact soil, shows the greatest detail compared to the other frequencies, but lesser depth penetration, because it can be seen clearly that below the 1-m mark, the radargram shape almost completely disappears. After the filtration and enhancement process, the radargram shows the narrow gap between the signal and the diffusing particle, which shows the soil structure clearly in the radargram.
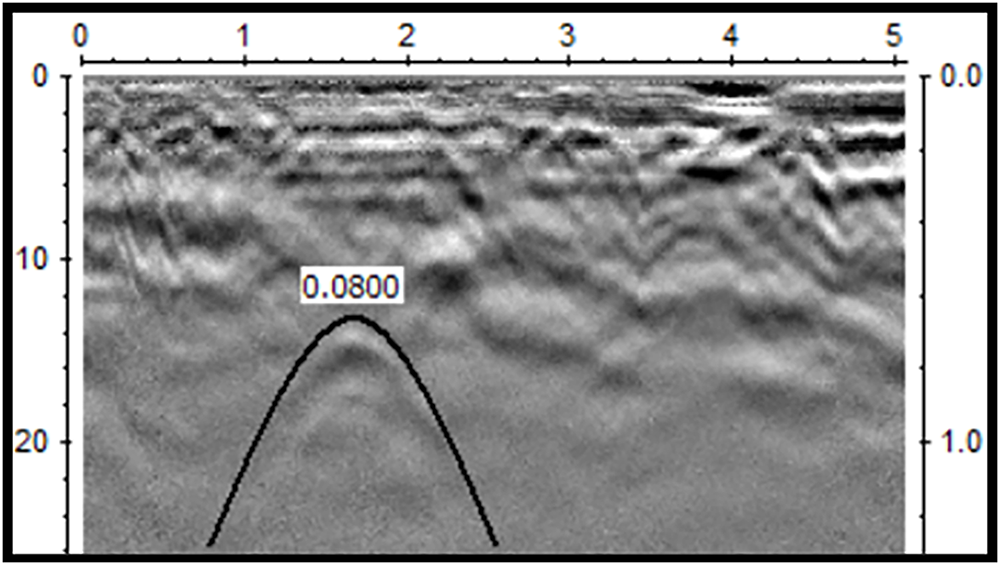
Figure 5: Compact soil in high frequency
4.2 Analysis of Semi-Compact Soil
Based on Fig. 6, using the low frequency on semi-compact soil, the radargram shows a distortion happening as the signal enters the soil in the highlighted area. It proved that as the signal came in contact with loose soil, the radargram output would be inconsistent, and because it is collected using low frequency, the result has a lower resolution. The pipe planted underground cannot be seen clearly because of variables such as the rainy season, types of soil, which is clay soil, and diffusion happening underground. But as the low frequency provides a longer wavelength and slower oscillation, a silhouette of the pipe can still be seen in the radargram, but a true depth cannot be measured accurately.
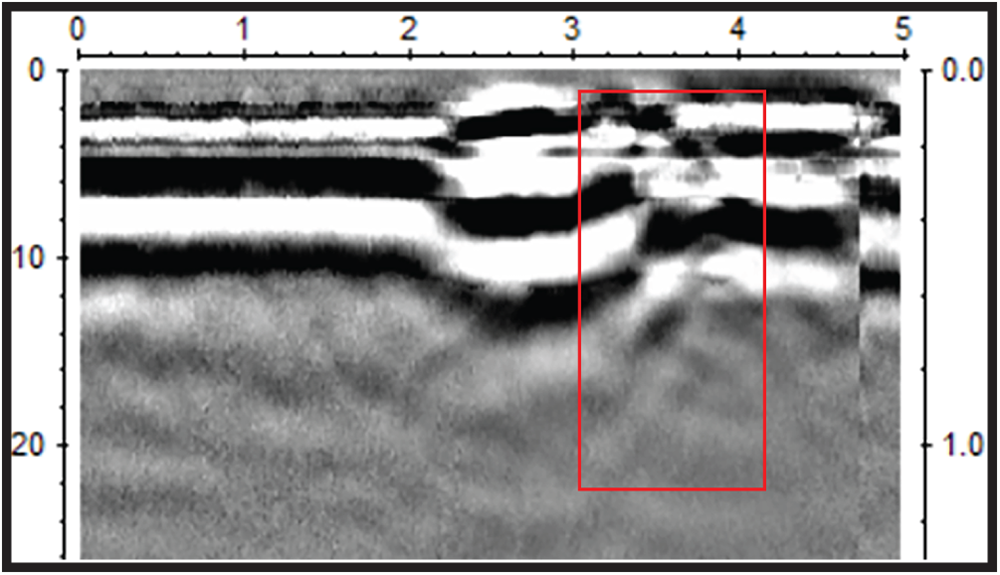
Figure 6: Semi-compact soil in medium low frequency
Referring to Fig. 7, using medium frequency, the distortion shown in the results is more noticeable, and the inconsistency of the signal is easier to identify. The pipe planted underground is even harder to identify, as the damp clay soil surrounding the pipe interferes with the GPR signal. The diffusion particle happens where the surrounding material diffuses the signal sent by the GPR and produces the radargram distortion. It means that when the signal travels underground and meets the soil while it descends, the signal is being reflected, showing the resulting distortion in the radargram output. The medium frequency shows the best result in showing the distortion and inconsistency of the radargram output for the semi-compact soil. But while the identification of the semi-compact or loose soil is easier, the position and depth of the soil are hard to identify.
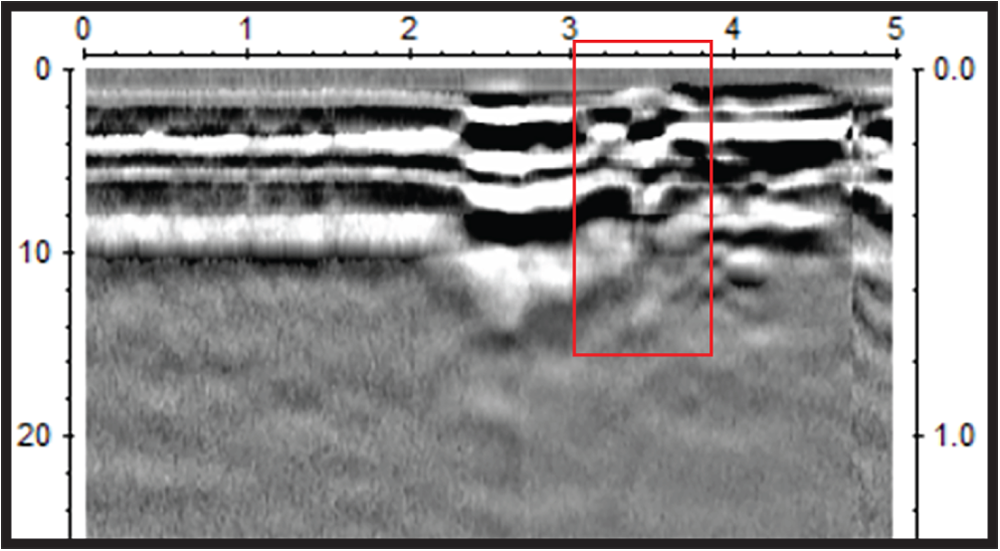
Figure 7: Semi-compact soil in medium high frequency
Based on Fig. 8, the higher frequency gives a higher resolution, making the distortion or loose soil area easier to identify. But, as a higher oscillation occurs on a higher frequency, the diffusion particle also increases, making it a lot harder to identify the pipe underground. This can be seen in that on the mark 0.4 m, where the pipe should be, there is no hyperbole. The high frequency, which is suitable for identifying shallow utilities, still cannot find the pipe buried underground, showing that the soil structure affects the radargram output. It can be because of the diffusion reflection of the signal received from the soil, making the pipe hard to find in the radargram output. The result from the semi-compact soil also shows how land subsidence in the radargram output is presented.

Figure 8: Semi-compact soil in high frequency
Based on Fig. 9, the radargram output from low frequency in void soil manages to identify the pipe clearly. The radargram also shows that when the signal encountered the void area, the signal concaved a little as it had no material in the ground to diffuse its energy before it arrived at the pipe. The radargram also shows the addition of a radar line between the radar forming. As a result of using the low frequency, it cannot show how the radargram reacted to void soil. But, because the study area is a little small, the representation of void soil cannot be seen as clearly as intended. From the radargram below, it can be seen that there are a lot of reflections of signals as they enter the soil because of the condition of the soil, which is damp due to the rainy season.
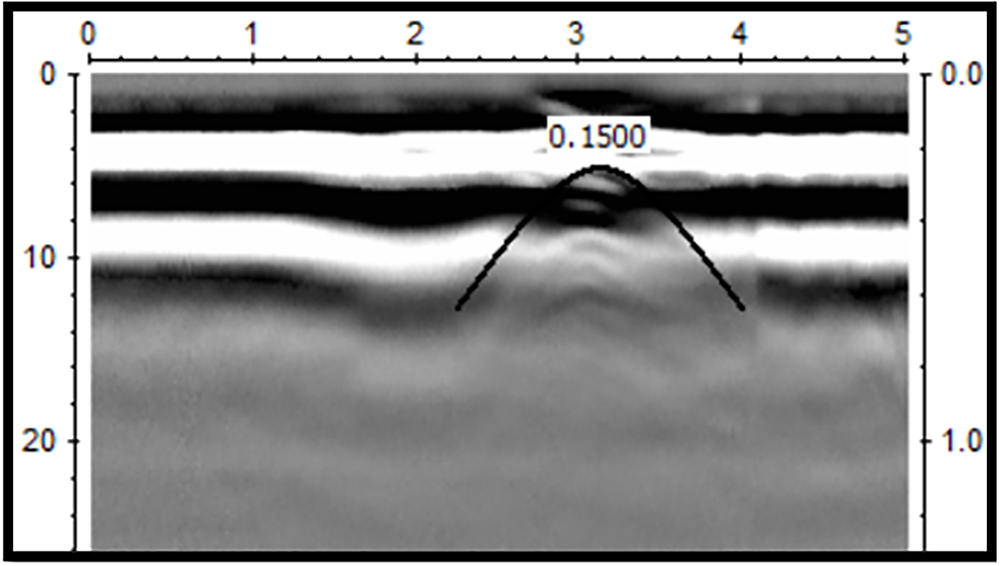
Figure 9: Void soil in medium low frequency
Based on Fig. 10, the medium frequency shows the best representation of the void soil. When the signal enters the soil, the signal concaves a little and seems to distort in a uniform way before it comes into contact with the pipe. The additional radar in the radargram output can also be seen in the void area where the consistent radar suddenly concaves uniformly. The medium frequency shows the best visualization of the void underground when checking for land subsidence in the area. The frequency is also able to identify the pipe buried underground clearly. From the results, it can be said that if a test is done on real situations in the city, the void area surrounding the utilities underground can be detected using GPR, and a precaution can be made earlier. It shows a great representation of the absence of soil underground.

Figure 10: Void soil in medium high frequency
Based on Fig. 11, the high frequency also represents the void soil clearly as it provides a higher detail radargram. As the signal enters the soil, a distortion can be seen in the radargram, and as it penetrates the void area, the signal concaves a little before coming in contact with the pipe underground. Refer to Fig. 11, the radargram can be seen to be consistent, and when it arrives at the study area, the signal widens a little and tightens back as it comes onto compact soil outside the study area, showing the presence of a cavity or void in the area. From the void soil result, it can be concluded that in the void area, the GPR can show the soil structure.
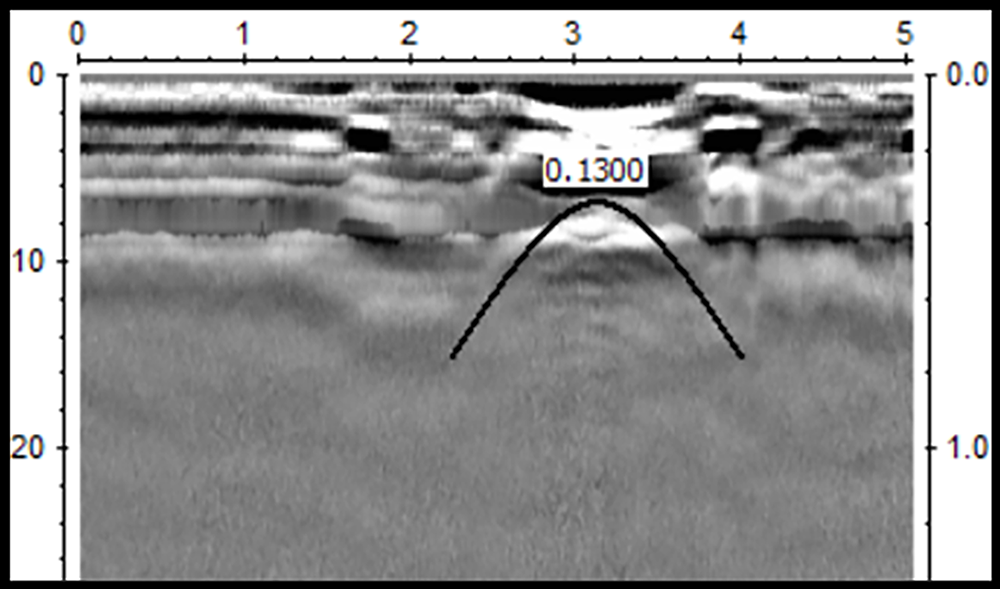
Figure 11: Void soil in high frequency
Table 3 shows the depth of the pipe collected by the GPR in different types of compactness and frequencies. From the reading shown, the depth collected in every run is similar, and all of them are below the tolerance stated, which is 0.1 m. Some of the readings are similar except for the semi-compact soil because of the diffusion in the soil and the inability to pinpoint the metal pipe underground. Using the calculation for depth, which is d = (1/2) vt, where d is depth, v is velocity, and t is time, the depth is calculated, and the table is the result of it. It can be seen in the radargram that the results for the void and semi-compact soil, the signal for each frequency is almost the same for its size, but for the compact soil, it is different because of its different location. As there are many variables not being included during tests, the results are satisfactory because the main objective, which is to observe the cavity reading in the radargram output, has been achieved.
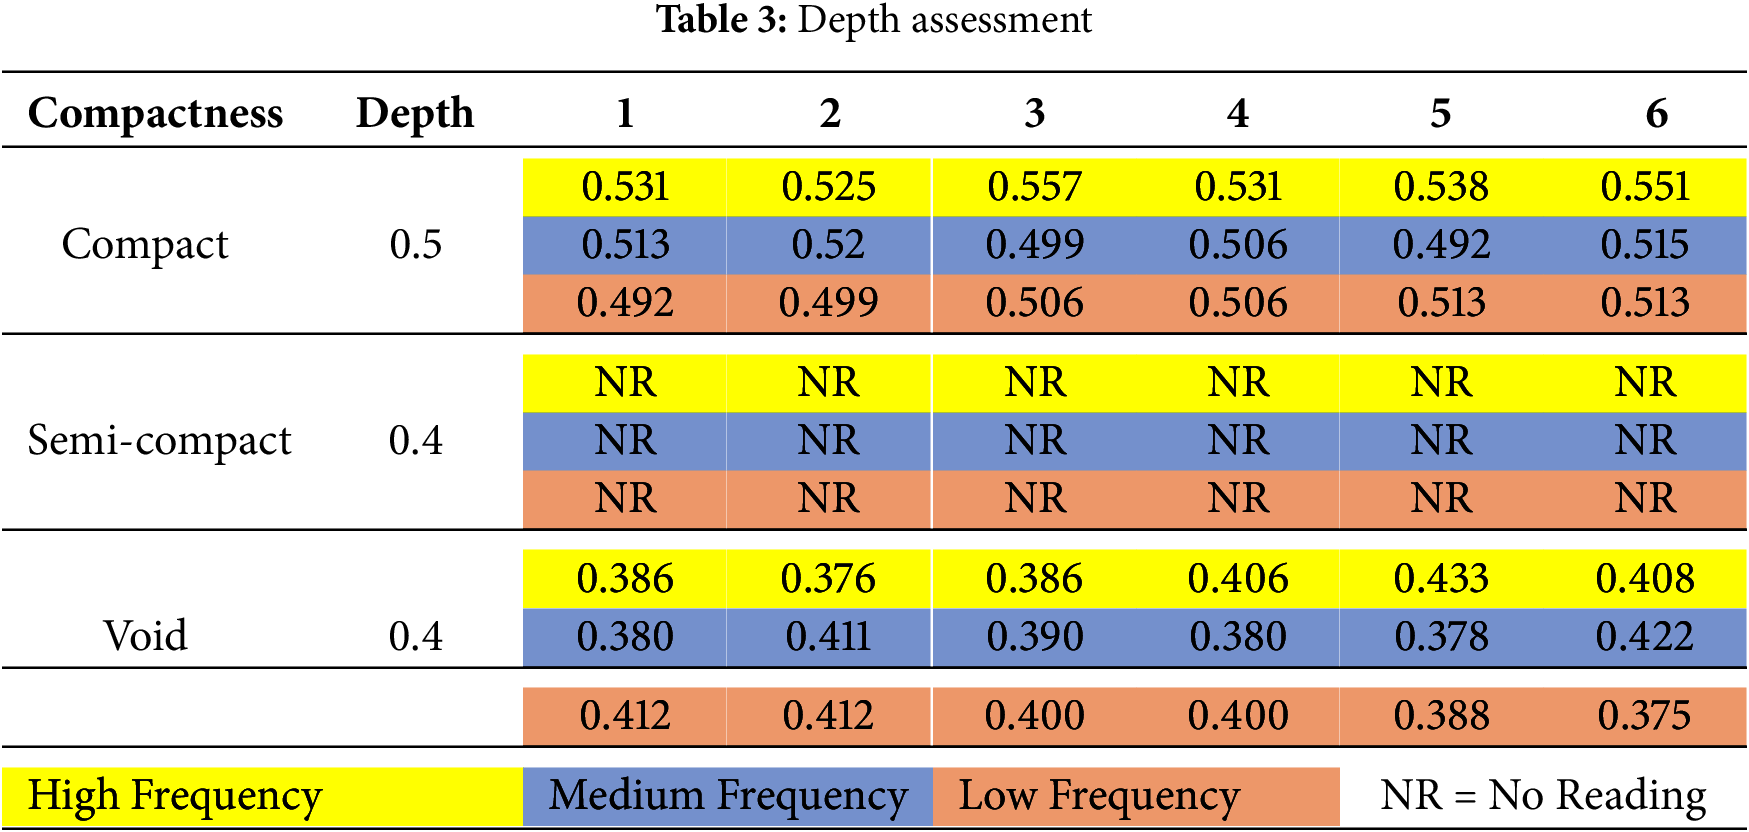
The NR in the reading is where the depth cannot be identified because of the lack of a parabola shown on the radargram output. To calculate the measured depth, a parabola is needed for the calculation to proceed. Because of the absence of a parabola in the radargram, the measured depth using GPR cannot be determined, thus making it NR.
This research sets out to examine the visualization of the pipe underground when it encounters the cavity, or in this case, the different compactness of soil. Through a combination of different frequencies and compactness of soil, the study demonstrated the results of radargram output, which differ according to each type of compactness. Compact soil shows how the normal radargram outputs when the signal encounters it. While the semi-compact and void soil shows an interference happening. The void soil resulted in the radargram having a little concave to it, caused by the absence of soil in the surrounding area, and for the semi-compact, the radargram shows the inconsistency happening, caused by a diffusion particle and reflection of the signal.
These findings show the importance of soil identification and radargram reading when utility mapping is done because land subsidence can happen anytime, especially with the soil structure of Malaysia, which is mainly limestone. The research also contributes to society, where it can be a guide or reference as a precaution when doing utility work. It is important to take note of land subsidence happening underground so that a sinkhole can be detected earlier, because the land subsidence does not appear out of nowhere, it occurs gradually.
As a conclusion, based on all the analysis done on the results, medium frequency shows the best results in identifying the void and semi-compact or loose soil. It is because it has a good resolution, and penetration gives it the advantage in identifying the cavity underground. The research also further proves the results of medium frequency in identifying and visualizing the cavity underground. The soil structure is important, especially in Malaysia, where the development is advancing rapidly, to avoid any unwanted disasters.
Acknowledgement: We would like to acknowledge all individuals, directly or indirectly, who have contributed in any way to the completion of this research.
Funding Statement: The authors received no specific funding for this study.
Author Contributions: The authors confirm contribution to the paper as follows: Harith Iman Othman Kalam carried out the research together with Ainon Nisa Othman; Ainon Nisa Othman and Mohamad Hezri Razali provided the idea, wrote, revised the article, supervised the research progress, and approved the article submission; Ainon Nisa Othman and Pauziyah Mohammad Salim designed the research and monitored the progress of the research; Akhbaaruddin Abd Hamid is together with Ainon Nisa Othman in providing and giving an idea for the research. All authors reviewed the results and approved the final version of the manuscript.
Availability of Data and Materials: The data used in this study can be accessed from the author by email.
Ethics Approval: Not applicable.
Conflicts of Interest: The authors declare no conflicts of interest to report regarding the present study.
References
1. Jol HM. Ground penetrating radar theory and applications. Amsterdam, The Netherlands: Elsevier; 2008. [Google Scholar]
2. Perez-Gracia V. GPR tests in agricultural soils. In: Proceedings of the 2023 12th International Workshop on Advanced Ground Penetrating Radar (IWAGPR); 2023 Jul 5–7; Lisbon, Portugal. p. 1–4. doi:10.1109/iwagpr57138.2023.10329176. [Google Scholar] [CrossRef]
3. Mohd Rosdi MAH, Othman AN, Latif ZA, Yusoff ZM. GIS based probabilistic method in sinkhole susceptibility hazard zones. Indones J Electr Eng Comput Sci. 2019;16(3):1539. doi:10.11591/ijeecs.v16.i3.pp1539-1546. [Google Scholar] [CrossRef]
4. Garcia-Fernandez M, Alvarez-Narciandi G, Yurduseven O. GPR imaging relying on frequency-diverse compressive antennas. In: Proceedings of the 2024 18th European Conference on Antennas and Propagation (EuCAP); 2024 Mar 17–22; Glasgow, UK. p. 1–5. doi:10.23919/eucap60739.2024.10501538. [Google Scholar] [CrossRef]
5. Yarovoy AG, Savelyev TG, Aubry PJ, Lys PE, Ligthart LP. UWB array-based sensor for near-field imaging. IEEE Trans Microwave Theory Techn. 2007;55(6):1288–95. doi:10.1109/tmtt.2007.896791. [Google Scholar] [CrossRef]
6. Cao Q, Al-Qadi IL, Abufares L. Pavement moisture content prediction: a deep residual neural network approach for analyzing ground penetrating radar. IEEE Trans Geosci Remote Sensing. 2022;60:1–11. doi:10.1109/tgrs.2022.3224159. [Google Scholar] [CrossRef]
7. Alsharahi G, Faize A, Maftei C, Bayjja M, Louzazni M, Driouach A, et al. Analysis and modeling of GPR signals to detect cavities: case studies in Morocco. J Electromagn Eng Sci. 2019;19(3):177–87. doi:10.26866/jees.2019.19.3.177. [Google Scholar] [CrossRef]
8. Broere W. Urban underground space: solving the problems of today’s cities. Tunn Undergr Space Technol. 2016;55:245–8. doi:10.1016/j.tust.2015.11.012. [Google Scholar] [CrossRef]
9. He J, Lin P, Zhu J, Luo T. Feasibility analysis of road defect inspection using laser deflection based on spatial correlations. In: Bandrova T, Konečný M, Marinova S, editors. Proceedings of the 9th International Conference on Cartography and GIS; 2024 Jun 16–21; Nessebar, Bulgaria. Sofia, Bulgaria: Bulgarian Cartographic Association; 2024. p. 467–74. [Google Scholar]
10. Zhang Y, Xiao K, Liu K, Ge B, Chen H, Li D. GPR B-scan data classification through deep learning approach. In: Proceedings of the 2023 9th International Conference on Big Data and Information Analytics (BigDIA); 2023 Dec 15–17; Haikou, China. p. 100–4. doi:10.1109/bigdia60676.2023.10429577. [Google Scholar] [CrossRef]
11. Zhou Y, Lai WWL. Leakage detection using ground penetrating radar C-scan based on 3D fuzzy C-means clustering. In: Proceedings of the 2023 12th International Workshop on Advanced Ground Penetrating Radar (IWAGPR); 2023 Jul 5–7; Lisbon, Portugal. p. 1–4. doi:10.1109/IWAGPR57138.2023.10329148. [Google Scholar] [CrossRef]
12. Sandmeier. Manual ReflexW 7.0 [Internet]. Karlsruhe, Germany: Sandmeier Geophysical Software; 2012 [cited 2025 Nov 27]. Available from: https://www.sandmeier-geo.de/Download/news_7_0.pdf. [Google Scholar]
13. Wang ML, Birken R. Sensor technologies for civil infrastructures. 2nd ed. Vol. 2. Cambridge, UK: Woodhead Publishing; 2022. [Google Scholar]
14. Conyers LB. Interpreting ground-penetrating radar for archaeology. London, UK: Routledge; 2016. doi:10.4324/9781315426334. [Google Scholar] [CrossRef]
15. Holtz RD, Kovacs WD, Sheahan TC. An introduction to geotechnical engineering. Noida, India: Pearson India Education Pvt. Ltd.; 2013. 872 p. [Google Scholar]
16. Mota R, Pereira M, Coelho MJ, Costa D, Pais A, Senos N, et al. In the width of the walls, in the depth of the soil—research project LAYERS (results from first sensitivity tests). In: Proceedings of the 2023 12th International Workshop on Advanced Ground Penetrating Radar (IWAGPR); 2023 Jul 5–7; Lisbon, Portugal. p. 1–4. doi:10.1109/iwagpr57138.2023.10329039. [Google Scholar] [CrossRef]
Cite This Article
 Copyright © 2025 The Author(s). Published by Tech Science Press.
This work is licensed under a Creative Commons Attribution 4.0 International License , which permits unrestricted use, distribution, and reproduction in any medium, provided the original work is properly cited.
 Downloads
 Citation Tools