
 Submit a Paper
 Propose a Special lssue
 Open Access
ARTICLE
Analysis of Annual Rainfall and Annual Number of Rainy Days in the Research for Indices of Climate Change in the Zambezian Phytogeographic Region
1 Department of Geographic Engineering, Faculty of Natural Sciences, Agostinho Neto University, Luanda, Republic of Angola
2 Department of Geography and Environmental Sciences, Faculty of Sciences and Technology, University of Lubumbashi, Lubumbashi, Democratic Republic of the Congo
3 A Department of Geosciences, Faculty of Sciences and Technology, University of Kinshasa, Kinshasa, Democratic Republic of the Congo
* Corresponding Author: N’Landu Dikumbwa. Email:
Revue Internationale de Géomatique 2026, 35, 13-30. https://doi.org/10.32604/rig.2026.068019
Received 19 May 2025; Accepted 22 December 2025; Issue published 05 February 2026
 View Full Text
 Download PDF
Abstract
Rainfall data from four weather stations, quite far from each other, but located in the Zambezian phytogeographic region, were analysed for the research for indices of climate change. Two variables, rainfall and the annual number of rainy days, were considered. The rainfall data examined are 114 years for Luanda (1901–2014), 106 years for Lubumbashi (1916–2021), respectively, 54 and 41 years for Huambo (1961–2014) and Boma (1981–2021); 100 years (1921–2021) for the annual number of rainy days for only the Lubumbashi weather station. The results were a widespread decline in rainfall at all weather stations. Despite the general decrease in rainfall, the Mann Kendall trend test, except for Huambo only, within the space-time limits of the present study, does not confirm it in the other three weather stations, corroborating the conclusion of Nicholson’s work in the Congo Basin. The declines described in this study would therefore only be episodes in the current climate. Moreover, there would be no causal links between the decline in rainfall and in annual number of rainy days. Indeed, on the one hand, although the decrease in the annual number of rainy days, the annual rainfall totals recorded at weather stations remain very close to the usual annual averages. On the other hand, the association of these two parameters gives a correlation coefficient r = 0.45; that of determination r2 = 0.2012. The decrease in the annual number of rainy days would therefore only explain 20% of the decrease in rainfall. In reality, the concomitant decreases in two parameters have harmful effects on exopercolation and endopercolation in the feeding of groundwater, water retention basins for electricity production and crop irrigation.Keywords
In agreement with some researchers [1], the current global warming of the planet Earth, resulting from the presence of greenhouse gases in the atmosphere, is believed to have been underway since 1840. For others, the ongoing global warming should be linked to the advent of industrialization in the 1760s [2]. For still others, the oldest known vestiges would date back to 20,000 BP [3]. This warming is expected to lead to disruptions in climatic factors, nominally temperature and rainfall. The long-term unsettled state of climatic factors is what we call climate change. However, although a global phenomenon, it is not experienced in the same way everywhere in the world.
In the West, the ongoing thawing of permafrost and ice in Polar Regions [1,4], high mountains, and in periglacial regions, no longer raises doubts about its thermal origin.
Unlike in the West, where the temperature is the primary factor, in the tropics, particularly in sub-Saharan Africa, rainfall, which determines the seasons, seems to be a determining factor. The evidence of climate change is not yet clearly established in our environment. In fact, the definition of this change seems largely influenced by Western data, particularly that transmitted via the media. However, apparently proven facts, such as the progressive drying up of Lake Chad, the drought in the Sahelian zones, in the south of Angola and in the countries of southern Africa in general, appear trivial and only concern informed scientists and the indigenous populations who are directly affected by them.
And yet, in the Congo Basin (Zaire), climatological data on temperature, rainfall, and number of rainy days, provided by METTELSAT for 7 stations in the Democratic Republic of Congo over the period 1960–1992, showed, in the long term, a marked decrease in rainfall and the number of rainy days, as well as an increase in temperature [5]. Similarly, Crowhurst et al. [6], evaluating evaporation for Congo Basin wet seasons in 11 global climate models, came to the conclusion of the permanent decrease in air humidity, as it is known, that generates rain.
Assani [7], over a period of 81 years (from 1916 to 1996), described three major periods of temporal variability of dry episodes in the rainy season. The first is marked by a number of dry days higher than the average of the series which would have started before 1921 and which ended around 1950. The second was a decrease in dry days of approximately 23.6%, which ended around 1980. Finally, the third is the one where the author reported an increase of 36.2% in the frequency of dry days over the last 15 years.
Ndehedehe et al. [8] investigated evolutionary drought patterns over the Sahel and their teleconnection with low frequency climate oscillations, stating that “the intensity of the well-known large-scale extreme droughts of the 1980s, is less and is not as widespread in the Congo Basin compared to other African sub-regions where drought-affected areas ranged from 70 to more than 90%”.
In a recent study on the climate of the Congo Basin and surrounding regions, Nicholson [9] highlighted the widespread drier conditions during the period from 1970 to 1979. Similarly, Mupepi et al. [10] in Zimbabwe, working on wetland inundation and moisture dynamics in Tugwi-Zibagwe and Shashe, observed that between 2017 and 2023 the total area of flooded wetland decreased by 0.1% in the Tugwi-Zibagwe and 0.2% in the Shashe.
Do these various studies conducted in the African tropical region demonstrate signs of climate change or are we only facing episodes of the current climate? The spatio-temporal study of rainfall, which is based on series, some of which are about a hundred years old, aims to understand diachronic fluctuations in order to determine the direction of their evolution. The particular interest given to the central high plateau of Angola, where the Huambo site is located, lies in the fact that, with the exception of the Congo and Zambezi Rivers, all the other rivers that feed Angola, the south eastern part of the Democratic Republic of Congo (RDC) and all the countries bordering southern Angola, have their source on this plateau. It is therefore a place of strategic and economic importance for all the countries of the Southern African Development Community (SADC). This is why this central plateau has always been considered the water tower of southern Africa.
The relief of Angola is presented in successive steps whose elevations gradually rise from the coast to the central high plateau, where they reach 1800 m above sea level in the central part. It is also observed that, whichever slope we consider, the main watercourses and all the rivers of the region (Fig. 1), except the Congo and the Zambezi, either originate from this high plateau, or from the slopes. This stepped relief has allowed Angola to build a series of eight hydroelectric dams (Fig. 2) on the Kwanza River, the largest in the country, with an average flow of 825 m3·s−1 and a length of 960 km.
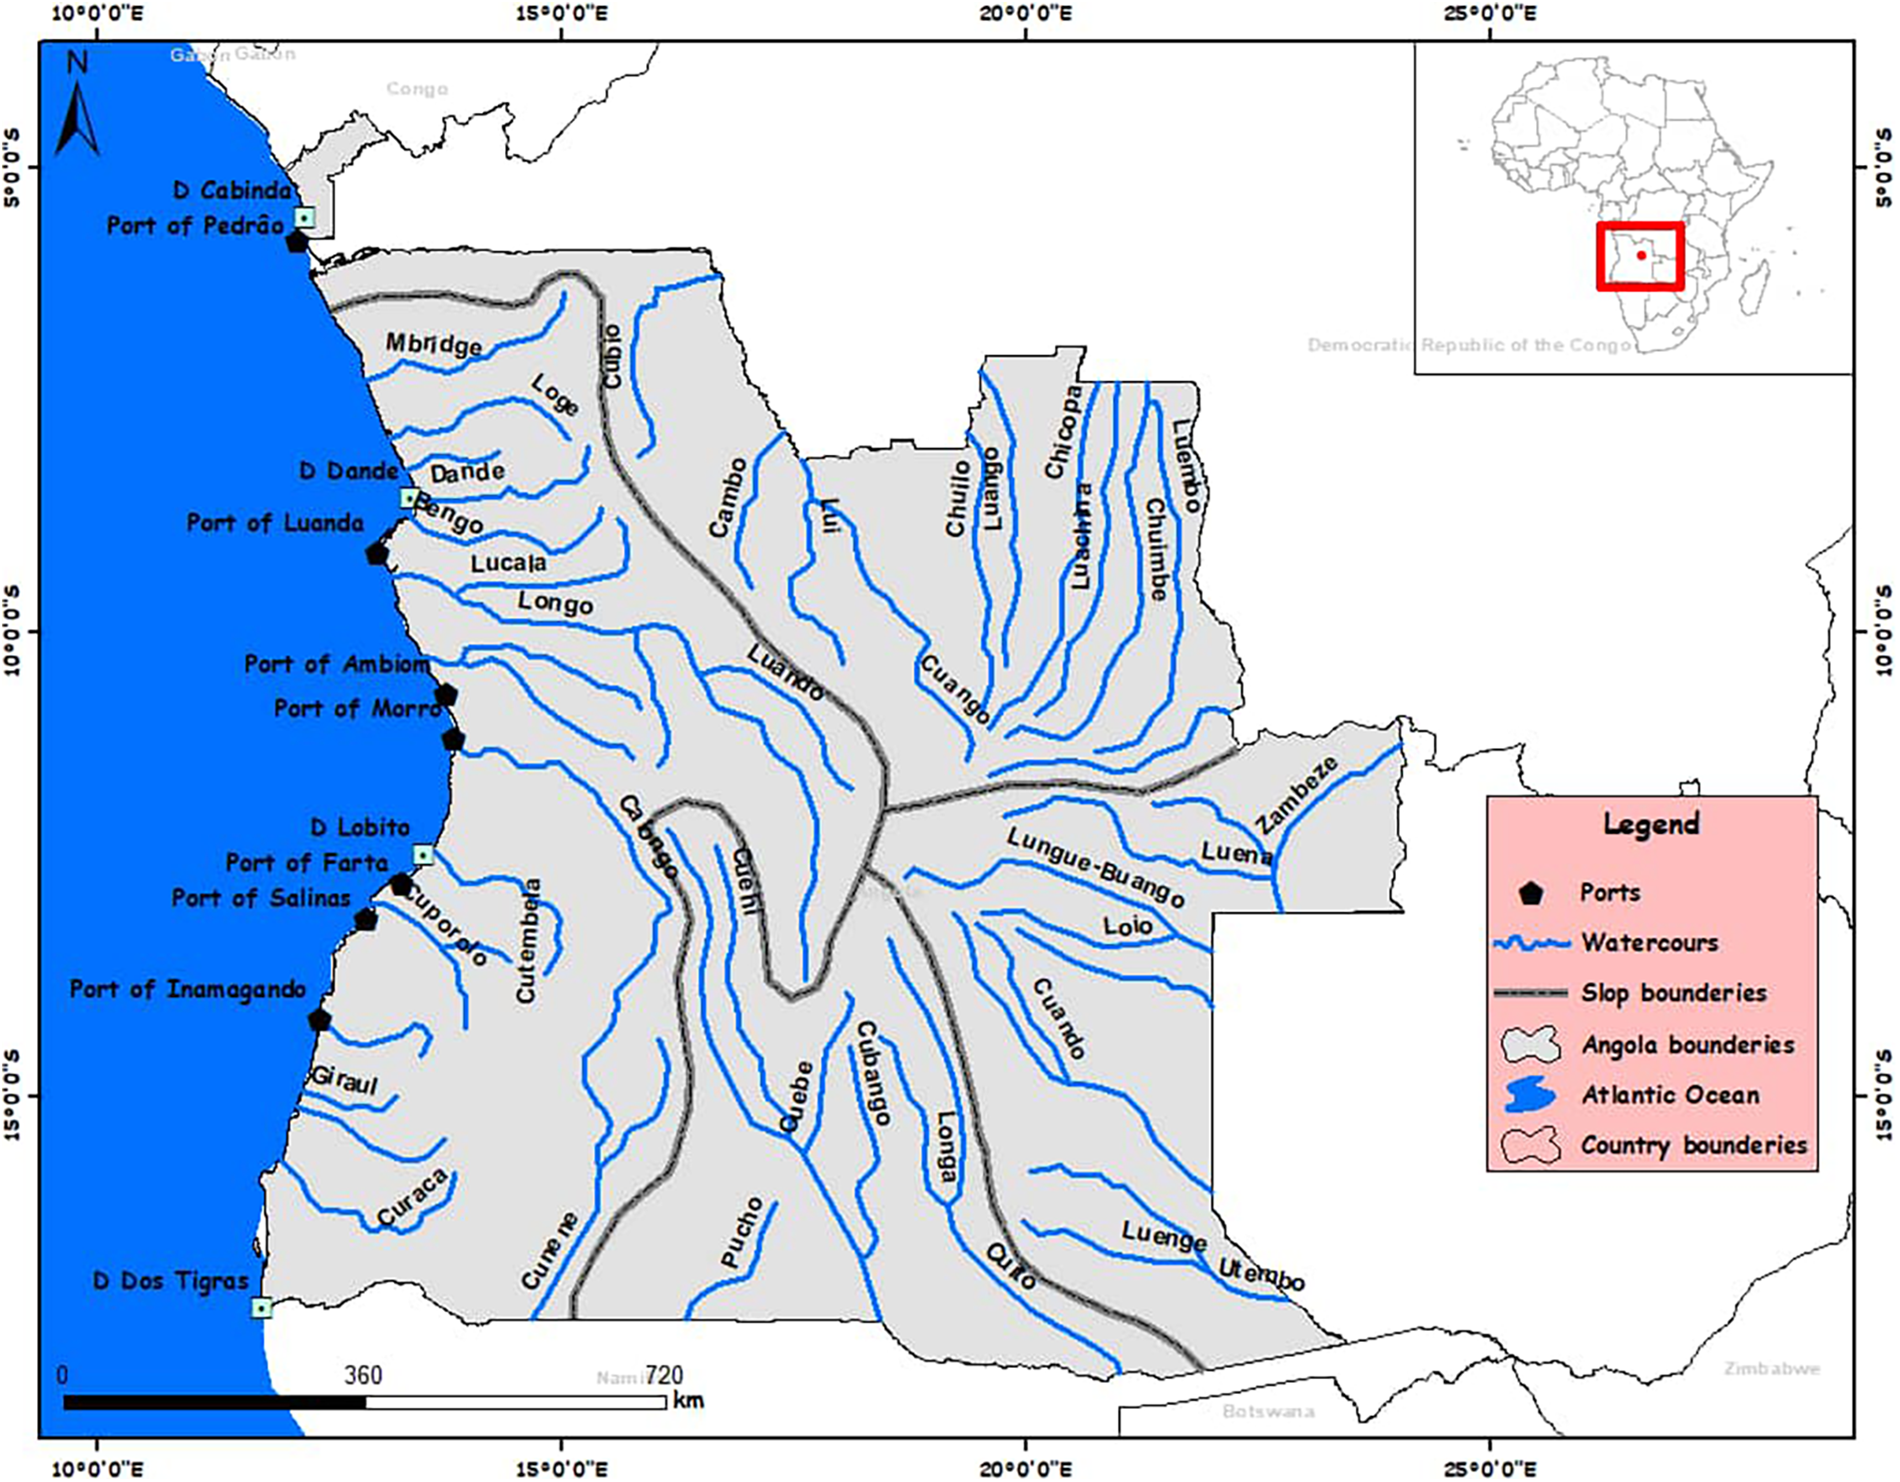
Figure 1: Main rivers and watercourses of Angola INIDE-MED [11]
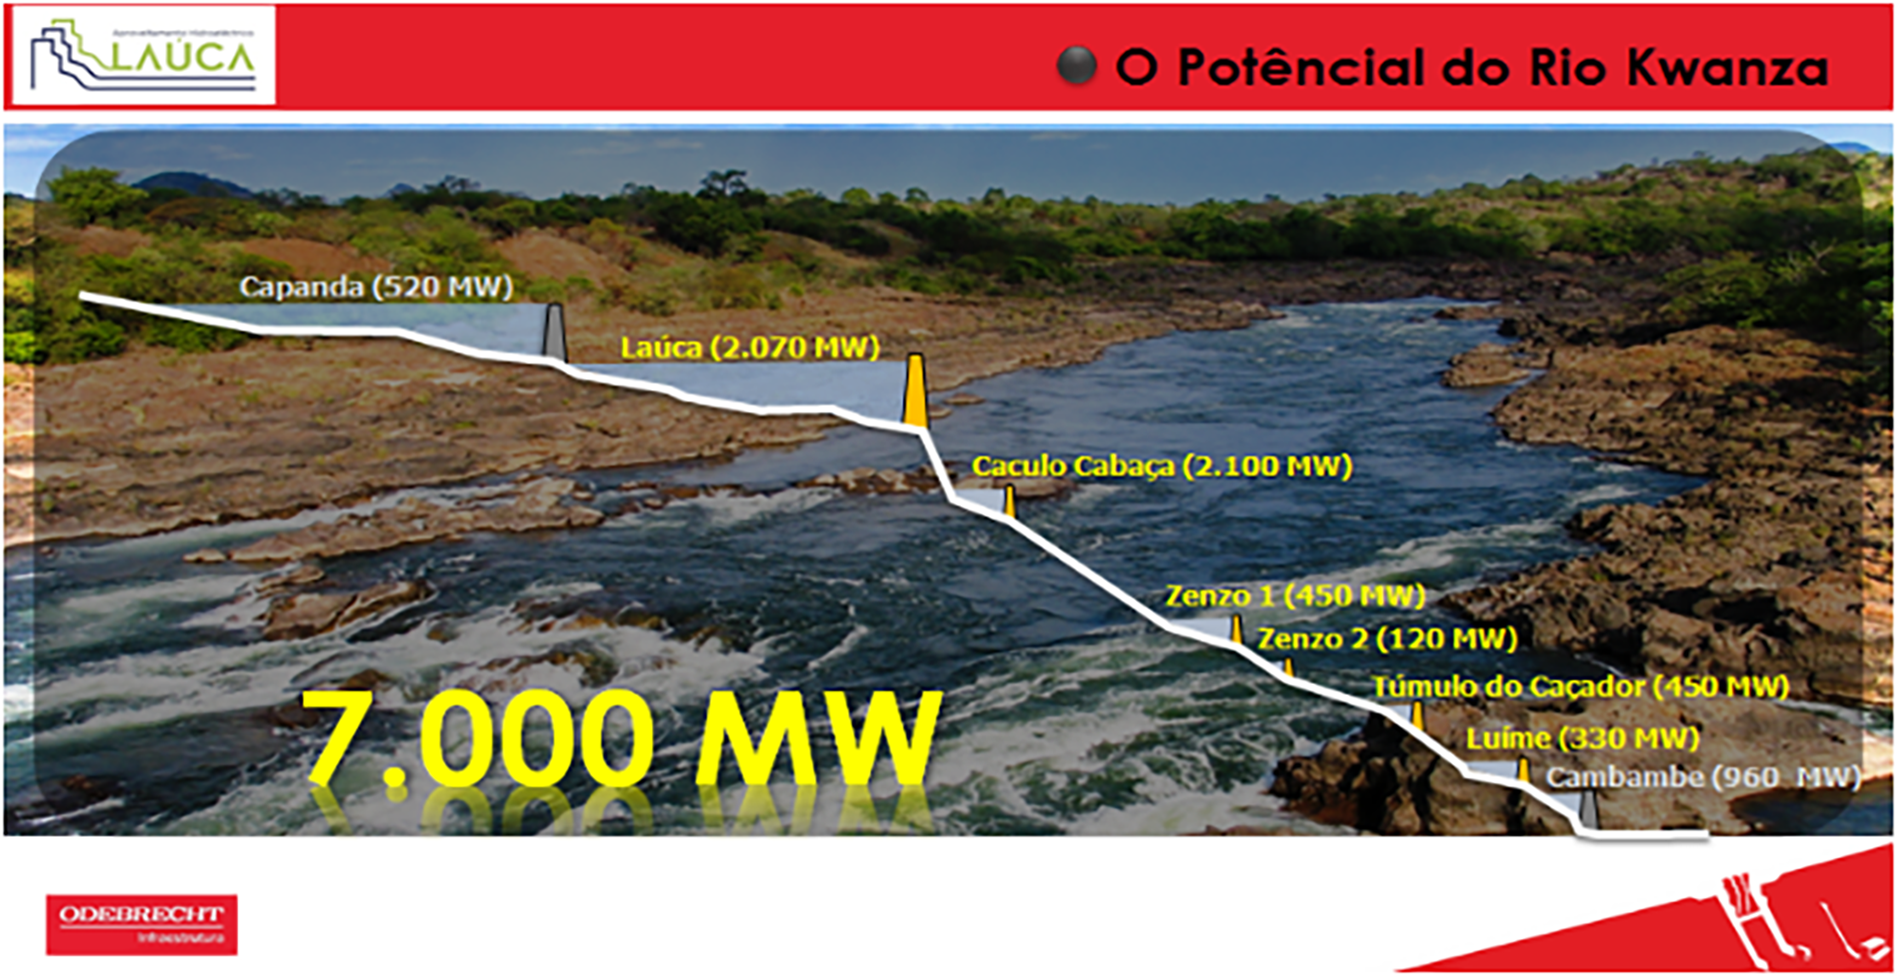
Figure 2: Kwanza river development (Oderbrecht advertising document)
The study sites (Fig. 3) are a network of four weather stations located in the southern hemisphere of the African continent, in the Zambezian phytogeographic region. This area extends from 3 to 26° south, from the Atlantic Ocean to the edges of the Indian Ocean and covers approximately 12% of Africa [12]. The privileged positioning of the four weather stations in the same phytogeographic region generates synchronous seasons and allows for comparisons.
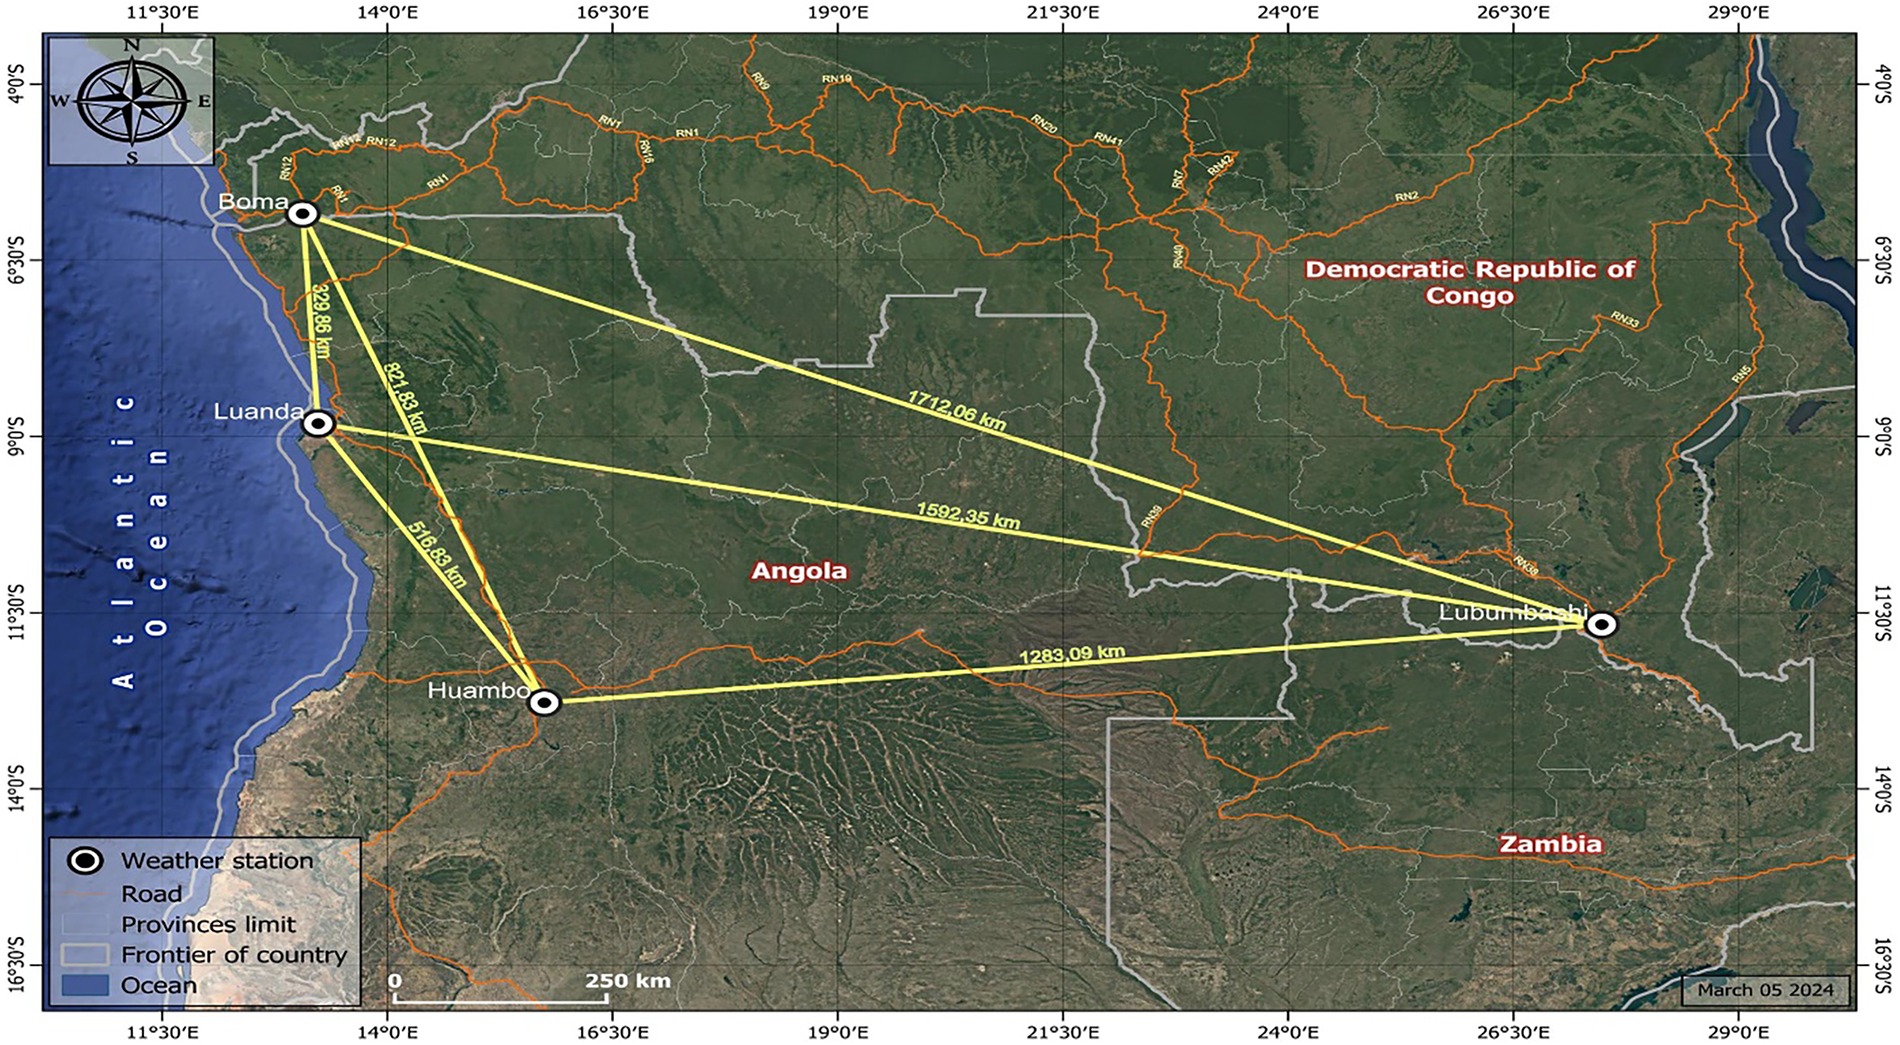
Figure 3: Weather stations
Two weather stations, Luanda and Huambo, are located in Angola, and the other two, Lubumbashi and Boma, in the Democratic Republic of Congo. Regarding the distances between weather stations, the furthest from each other are Lubumbashi and Boma (1712 km), Lubumbashi and Luanda (1592 km) and Lubumbashi and Huambo (1283 km). The closest distances are Boma and Luanda (320 km), Luanda and Huambo (517 km) and Boma and Huambo (822 km).
This geographical positioning of the weather stations delineates a pyramid whose triangular base is formed by the stations of Luanda, Boma and Huambo and Lubumbashi being the apex.
The Boma weather station (5°50′55″ S, 13°03′22″ E, and 61 m above sea level) is situated 320 km north of Luanda city, on the right bank of the Congo River. Its proximity to the Equator produces a more humid tropical climate of the Aw4 type, according to the connotations of Köppen [13]. The available rainfall data covers a period of 41 years, from 1981 to 2021.
The João Capelo weather station (08°48′48″ S, 13°13′15″ E, and 45.8 m above sea level) is located in Luanda, on the eastern coast of the Atlantic Ocean. It benefits from the cold and dry Benguela current, which plays a decisive role in reducing the rainfall throughout the entire extension of this cold and dry current corridor. The observation of rainfall was spread over 114 years, from 1901 to 2014.
The Lubumbashi weather station (11°40′57″ S, 27°28′25″ E and 1223 m above sea level) is situated on the Upper-Katanga plateau, which culminates at an average altitude of 1298 m. Towards the West, this plateau extends in successive stages to reach 1760 m, or even 1800 to 2000 m at the level of the central plateau of Angola. The observed rainfall data are 105 years (from 1916 to 2021); the annual number of rainy days is 100 years, from 1921 to 2021.
Finally, the Huambo weather station (12°45′54″ S, 15°44′06″ E and 1700 m above sea level) is located on the central plateau of Angola. It is one of the regions most devastated by the Angolan Civil War, from 1975 to 2002. The weather stations were completely destroyed. Huambo is the only one to have a 53-year continuous rainfall data series, from 1961 to 2014.
All rainfall data and the annual number of rainy days from the Lubumbashi weather station were obtained from the ad hoc services of the “Société Générale des Carrières et des Mines” (GCM), a Congolese State company, the former Belgian company “Union Minière du Haut-Katanga”. This station is the only one to have provided data for the second parameter (annual rainy days). From Luanda and Huambo weather stations, rainfall data were supplied by the National Institute of Meteorology and Geophysics of Angola (INAMET), while that of Boma was supplied by the METTELSAT weather station, located in Kinshasa, the capital of the RDC.
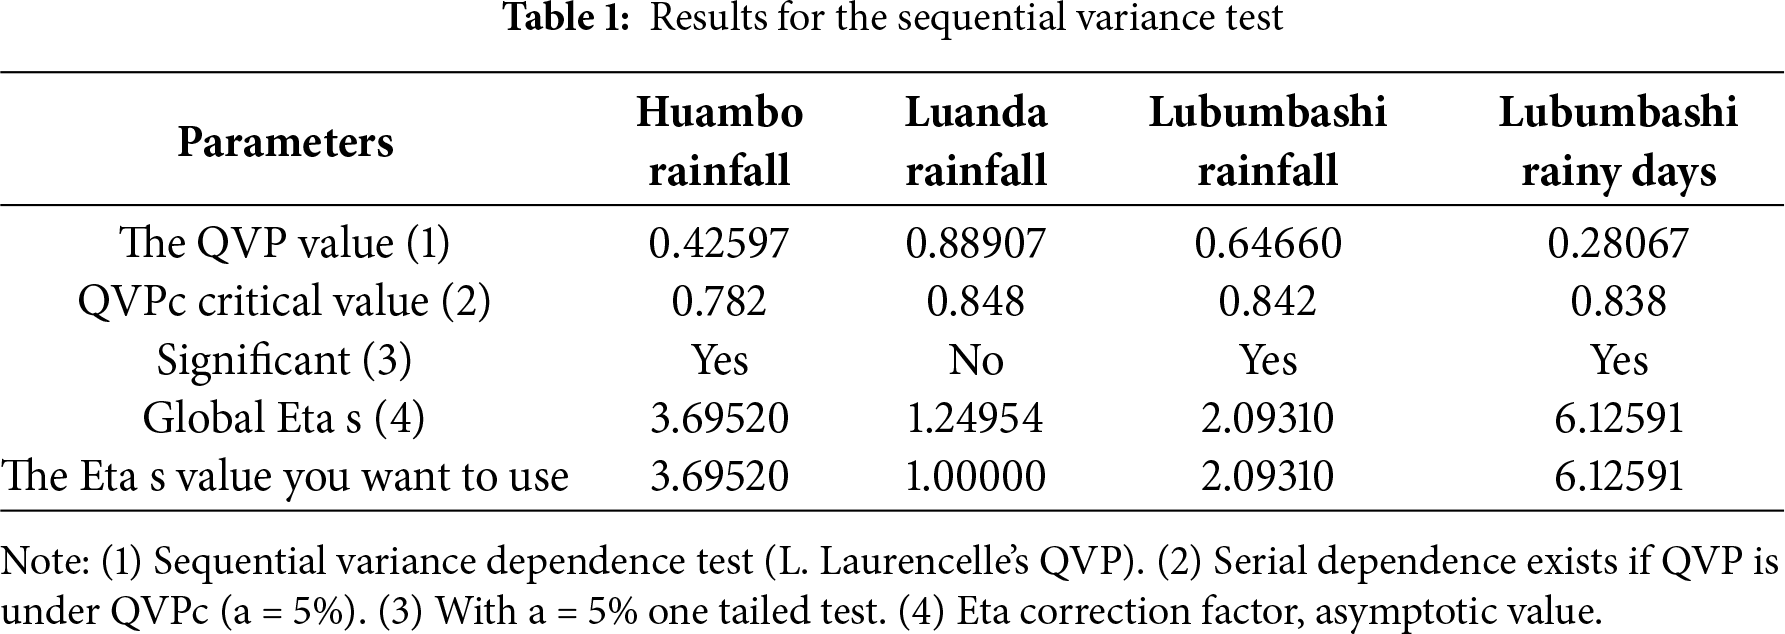
To determine the changing trend of rainfall over time, the Mann-Kendall test for trend detection, by Marc Laurencelle, UQTR, version 3.2 of January 17th, 2008 [14], was used. This test has the advantage of looking for a trend, its onset and its direction of change. The trend research only concerns three sites, namely Luanda (João Capelo), Lubumbashi and Huambo, which have long rainfall series. Here are the results for the Sequential variance test (Table 1).
The map of the main watercourses of Angola (Fig. 1) was redrawn at the Geomatics Laboratory of the University of Kinshasa from a book published in 1996 by the Ministry of National Education of Angola, while the location map of weather stations (Fig. 3) was produced at the Geomatics Laboratory of the University of Lubumbashi, from a Google Earth image.
The digital processing used computer and software, notably Excel, QGIS 3.40, Envi 5.1 for image processing, QGIS 3. After the statistical processing of the data, the exposure of the results used a graph, which allows easier visualization of the information.
The analysis of rainfall graphs from four weather stations makes it possible to understand the spatio-temporal fluctuations of rainfall, the key factor in the intertropical climate, and therefore in the Zambezian phytogeographic region.
3.1 Lubumbashi Weather Station
From 1916 to 2021, the average annual rainfall was 1195.8 ± 179.7 mm. Two episodes of temporal fluctuation can be distinguished (Fig. 4): a 63-year episode (from 1916 to 1978), which showed an average annual rainfall fluctuating around 1216.6 ± 43.1 mm. This episode includes both the minimum of 716.4 mm and the maximum of 1807.6 mm occurring successively in 1917 and 1978. Referring to the work of Assani [7], the first reference appeared when the number of dry days in the rainy season is higher than the average of the series, while the second occurred when the number of dry days had undergone a reduction of about 23.5%.
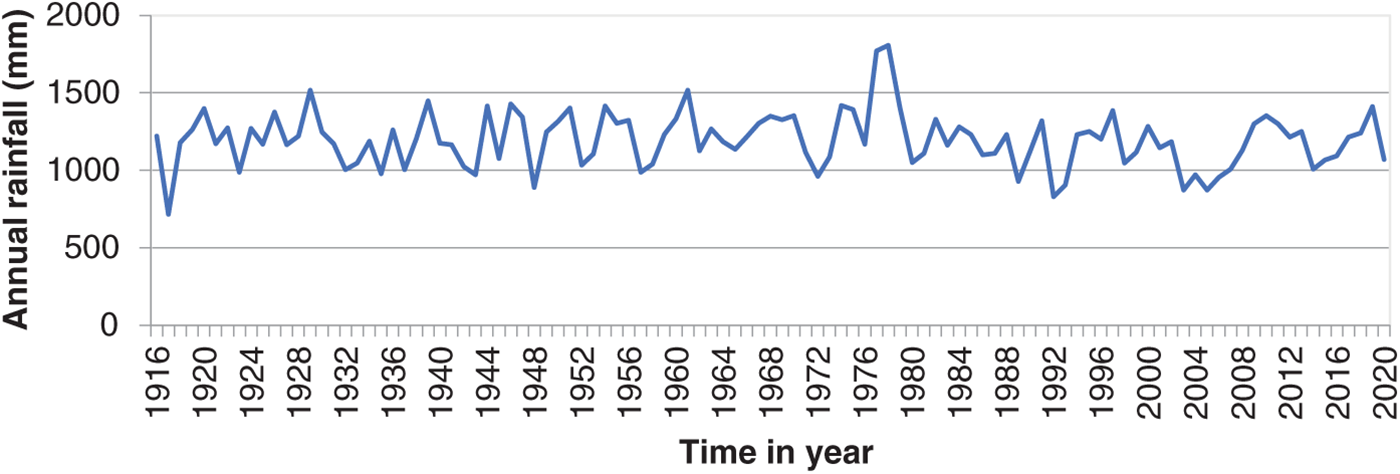
Figure 4: Lubumbashi: annual rainfall (from 1916 to 2021)
The other 43-year (from 1979 to 2021), although the discrimination in the temporal fluctuation with the first episode is not clearly distinctive, the mean of 1143.8 ± 108.3 mm suggests not only reduced rainfall and annual average, but above all a high standard deviation that indicates a wide dispersion around this average.
The annual precipitations, arranged in decadal groups (Fig. 5), dissociate two intervals distinct from those specified in Fig. 4. The first interval, from 1916 to 1985, includes 7 decades during which rainfall fluctuated around 1225.8 ± 184.7 mm; the second interval, from 1986 to 2021, gathers only 4 with an average rainfall around 1135.6 ± 154.8 mm.
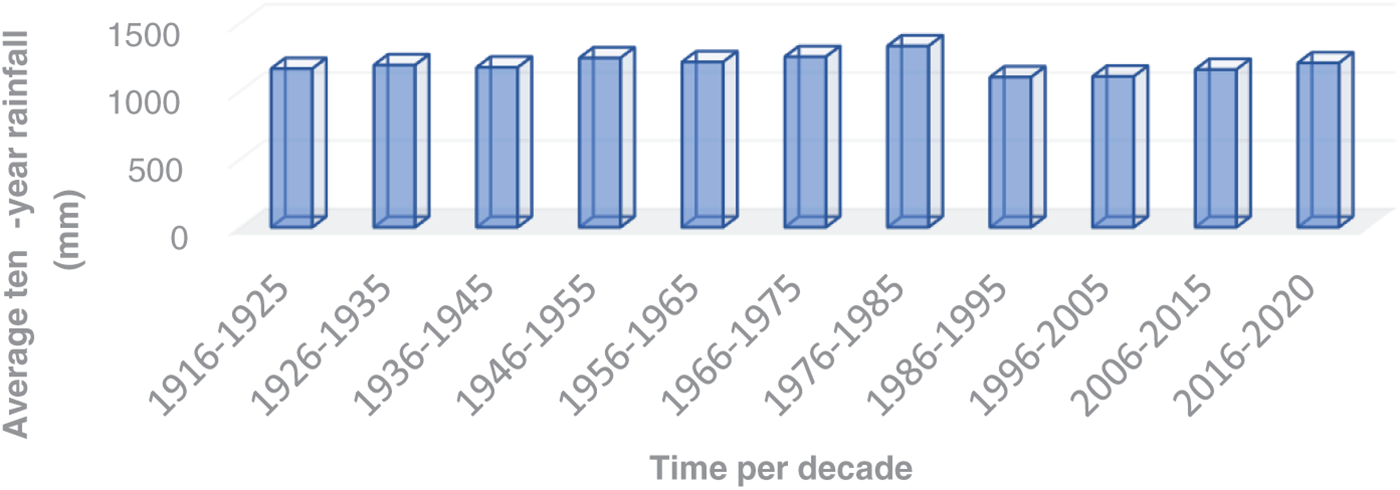
Figure 5: Average ten-year rainfall (from 1916 to 2021)
Analysing the monthly ten-year rainfall (Fig. 6), it appears, excluding, the decade 2011–2020 and the months of November and April, that rainfall has gradually decreased in recent decades (1981–1990, 1991–2000, 2001–2010), with however, a slight increase for the last decade (2011–2020). Nicholson [9] had previously observed such an abrupt interruption of drought in the Congo Basin.
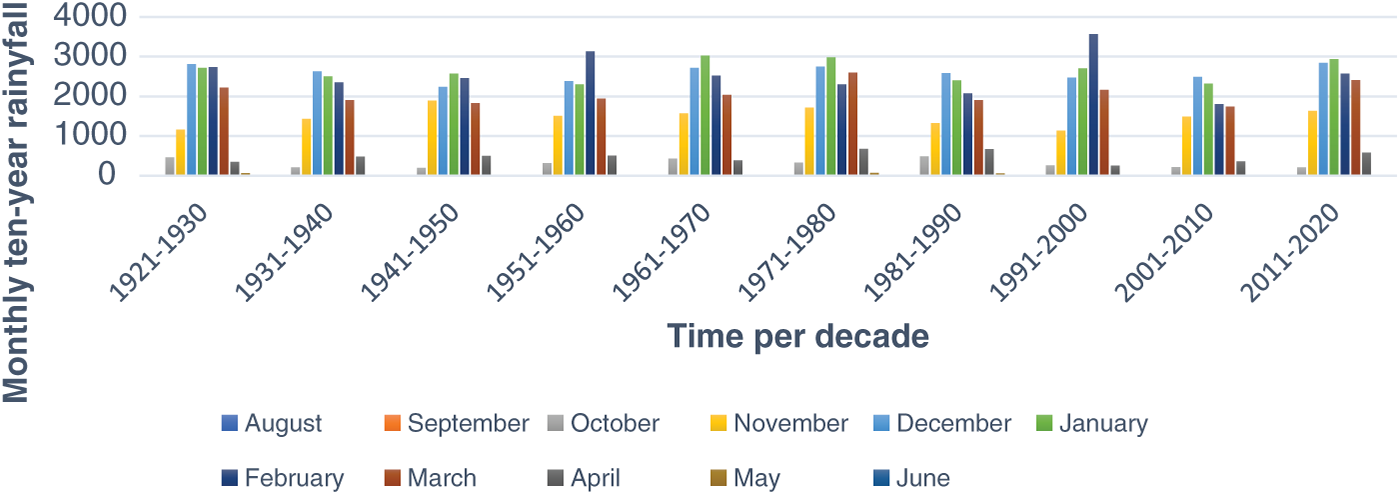
Figure 6: Monthly ten-year rainfall
Considering these data on rainfall variability from 1916 to 2021, we can conclude that 1978 was the cardinal year that forms the boundary between the two referenced episodes.
3.1.2 The Annual Number of Rainy Days
A second parameter, more expressive of a possible climatic alteration, is the annual number of rainy days (Fig. 7). Indeed, if the decrease in annual rainfall did not lead us to an irrefutable distinction between two intervals specified in Fig. 4, the analyse of the temporal changing of the annual number of rainy days leaves no doubt as to the discrimination of two intervals and demonstrates a progressive deterioration of this parameter.
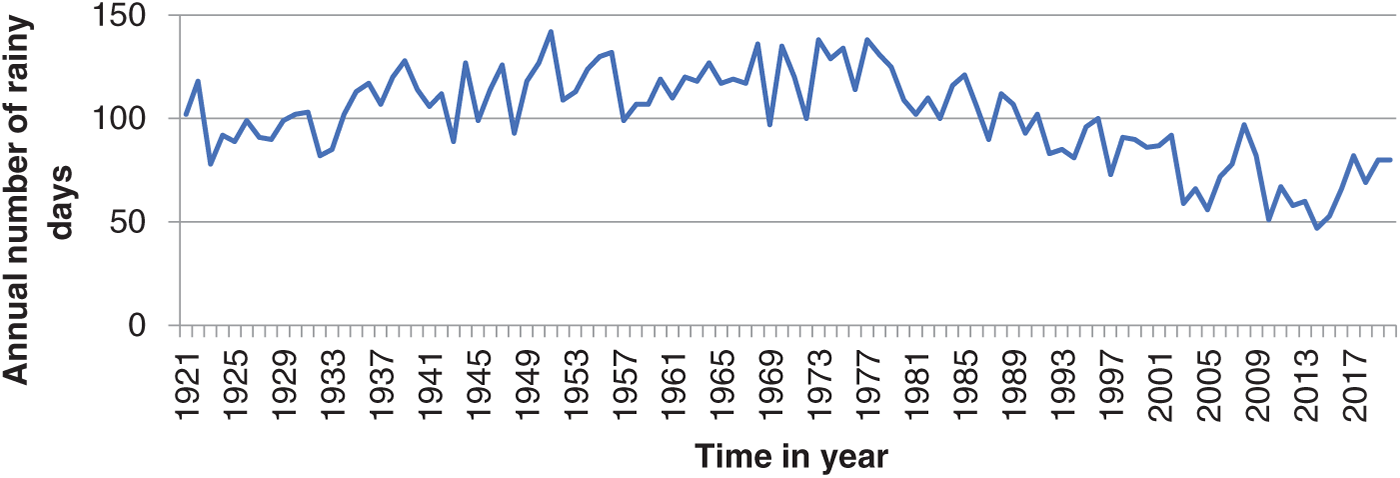
Figure 7: Variability of the annual number of rainy days in Lubumbashi
Indeed, while from 1921 to 1978, the average annual number of rainy days was 112.2 ± 15.6, from 1979 to 2021, a reduction of 23.06% was noticed to reach only 86.3 ± 21.0 rainy days. A minimum of 47 days was observed in 2014, or less than two months of rain. It can be seen that from 1978 onwards, the temporal evolution is an uninterrupted decline towards annual values of less than three months of rainfall. Referring again to Assani’s study [7], this decrease is synchronized with the third episode, characterized by an increase in the frequencies of dry days.
Furthermore, synchronism in annual decreases in rainfall and the annual number of rainy days is noted. Regarding rainfall, just as 1978 divides the period from 1916 to 2021 into two intervals, one of high precipitation (1916–1978) and the other of low precipitation (1979–2021), similar data were ascertained for the annual number of rainy days. The year 1978 also divides the period from 1921 to 2021 into two intervals: one with a high annual number of rainy days (1921–1978), the other with a reduced annual number of rainy days (1979–2021).
Table 2 exhibits the ten-year trajectory of the number of rainy days. Six consecutive decades of abundant rainfall (1931–1940, 1941–1950, 1951–1960, 1961–1970, 1971–1980 and 1981–1990), comprising 67.85% of ten-year annual rainy days, stand out in relief. The decadal average of the annual number of rainy days of 11.30 ± 0.73% shows both a low dispersion around it and also a low temporal variability. On the other hand, after the decade 1981–1990, the annual number of rainy days has been decreasing continuously, the last decade (2011–2020), having reached only 6.55%.
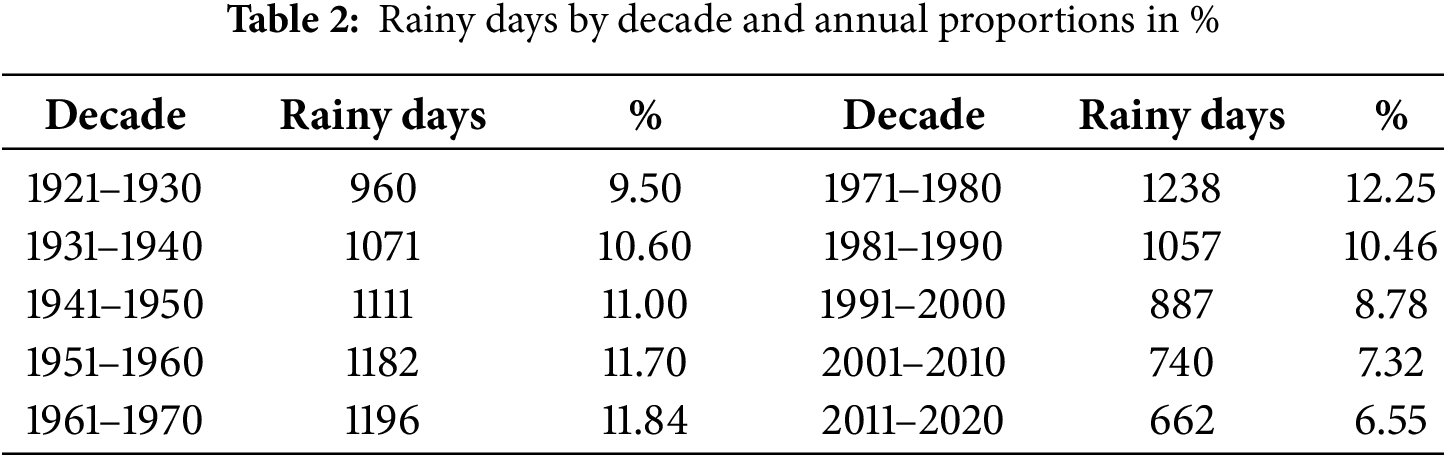
We can see, regardless of the month considered, with the exception of October and November (Fig. 8), as in the previously rainy days per decade (Table 2), that the number of rainy days gradually decreases as we approach the last four decades (1981–1990, 1991–2000, 2001–2010, 2011–2020). These observations confirm a decrease in rainfall at the Lubumbashi weather station since 1978. At the same time, from this year onwards, the annual or ten-year number of rainy days has decreased even more markedly.
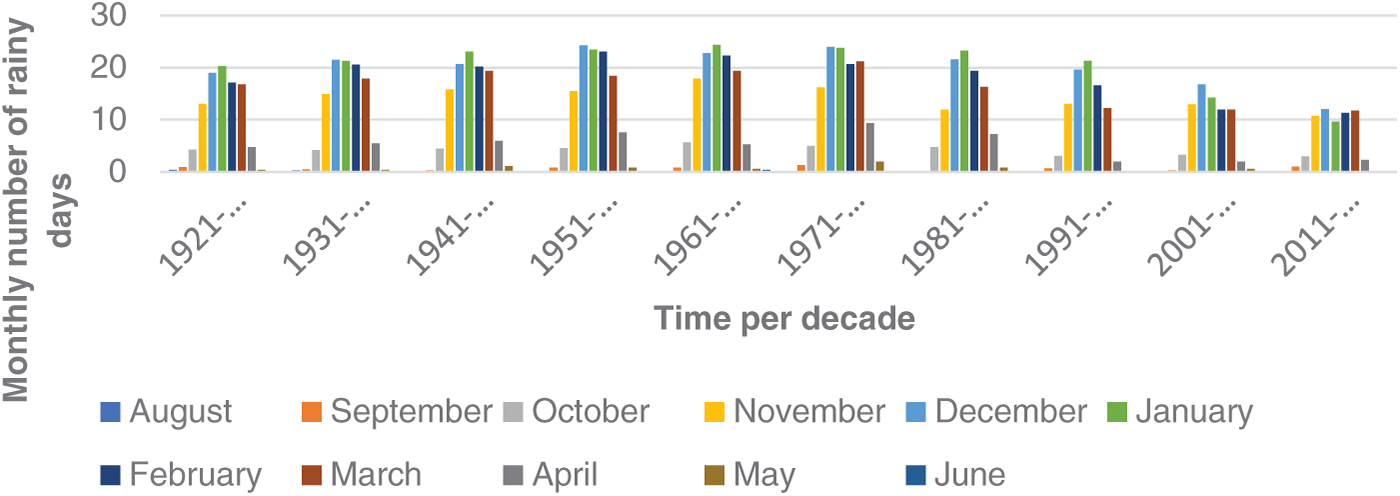
Figure 8: The monthly number of rainy days per decade
3.2 João Capelo Weather Station in Luanda
The geographical location of the João Capelo weather station in the Benguela cold and dry current corridor, which induces a semi-arid climate, is the cause of a very significant reduction in rainfall. The annual average evaluated over 114 years (1901–2014) is 343.19 ± 179.01 mm, more than three times lower than the annual average calculated at each of the other three weather stations.
However, being situated in the same phytogeographic region, as the Lubumbashi weather station and despite its semi-arid climate, the results of the analysis of rainfall data from the João Capelo weather station corroborate those acquired at the Lubumbashi weather station. Indeed, the study period, from 1901 to 2014, was also divided into two intervals (Fig. 9), during which temporal fluctuations also appeared very random.
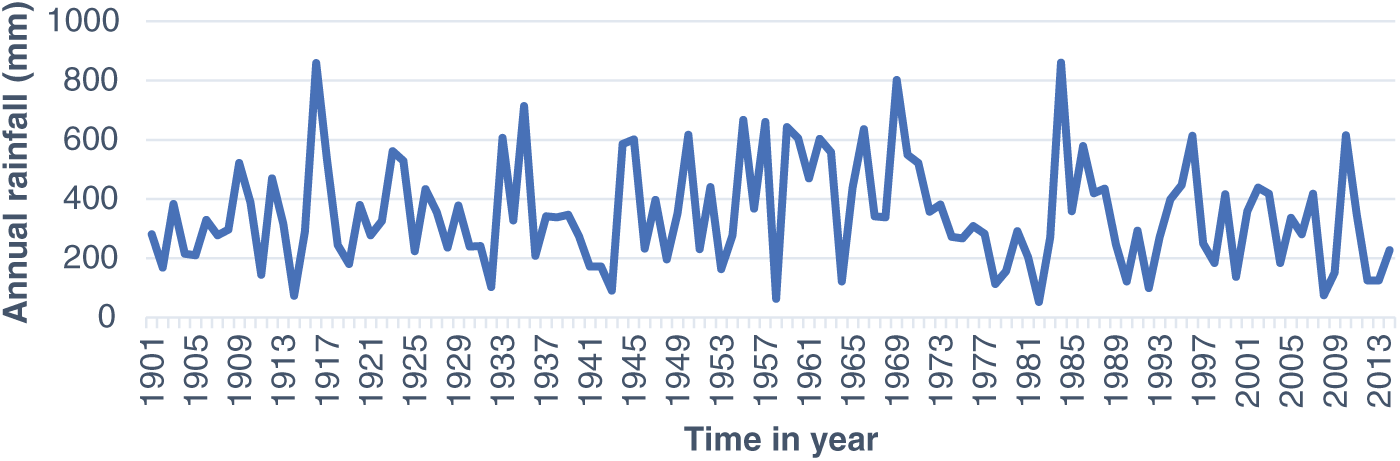
Figure 9: Rainfall in Luanda (1901–2014), Capela weather station
The first period, with an average annual rainfall of 368.8 ± 184.4 mm, spread over 69 years (from 1901 to 1969), is comparable to that described at the Lubumbashi weather station in a period of 63 years (1916 to 1978). Compared to the Lubumbashi weather station, the standard deviation at the Luanda weather station marks greater interannual variability.
The second period, lasting 45 years, ran from 1970 to 2014 and could still continue today, as 2014 is the last authorized access to the INAMET archives. The average annual rainfall was 316.6 ± 167.5 mm. Referring to the standard deviations, the temporal evolution shows interannual variability as in the first interval. It is in this second period that the minimum (52.1 mm) and maximum (860.3 mm) are located, in 1982 and in 1984, respectively. Confronted to the first interval, the rainfall in the second suffered a slight average decrease of 14.15%.
The analysis of the ten-year averages of annual rainfall shows the emergence of two intervals (Fig. 10): the first interval presents an increasing temporal evolution with a very low growth rate reaching its maximum of 485.63 mm in the decade 1961–1970; the second interval shews an average decrease of 13.35%. From these data, it can be deduced, on the one hand, that 1961–1970 is a pivotal decade, and on the other hand, that the precipitation data obtained in Luanda and Lubumbashi, two weather stations from the same phytogeographic region, follow similar chronological patterns.
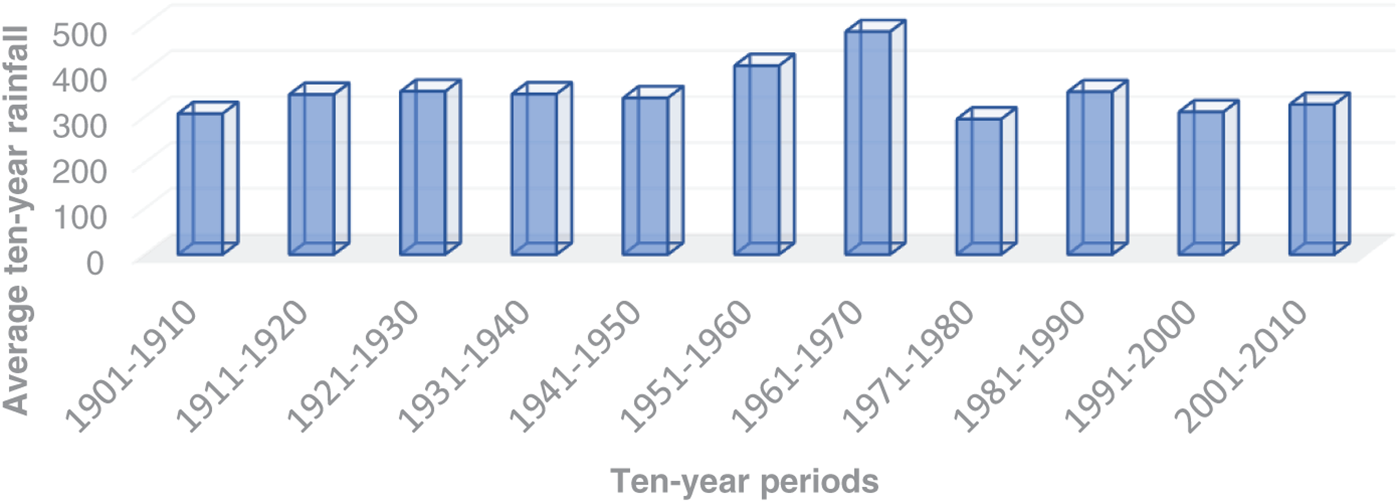
Figure 10: Average ten-year rainfall (1901–2010)
3.3 Huambo and Boma Weather Stations
After analysing a first long set of rainfall data from Lubumbashi (106 years) and Luanda (114 years), here is now a second relatively short set of rainfall data from Huambo (53 years) and Boma (41 years).
Diachronic analysis of rainfall data from the Huambo weather station (Fig. 11), on the central plateau of Angola, over the period from 1961 to 2014, provided an annual average of 1123.5 ± 266.9 mm. This one brings to light, on the one hand, a high standard deviation, indicating a wide dispersion of rainfall over time; and on the other hand, from Fig. 11, we notice a continuous decrease in rainfall throughout the observation period. In 1990, the decrease reached the minimum of 591.5 mm, a reduction of 30%. The maximum of 1969.4 mm is at the very beginning of the observations (perhaps the true maximum is elsewhere), while the last value of 837.2 mm in 2014 presents a decrease of 42.51%.
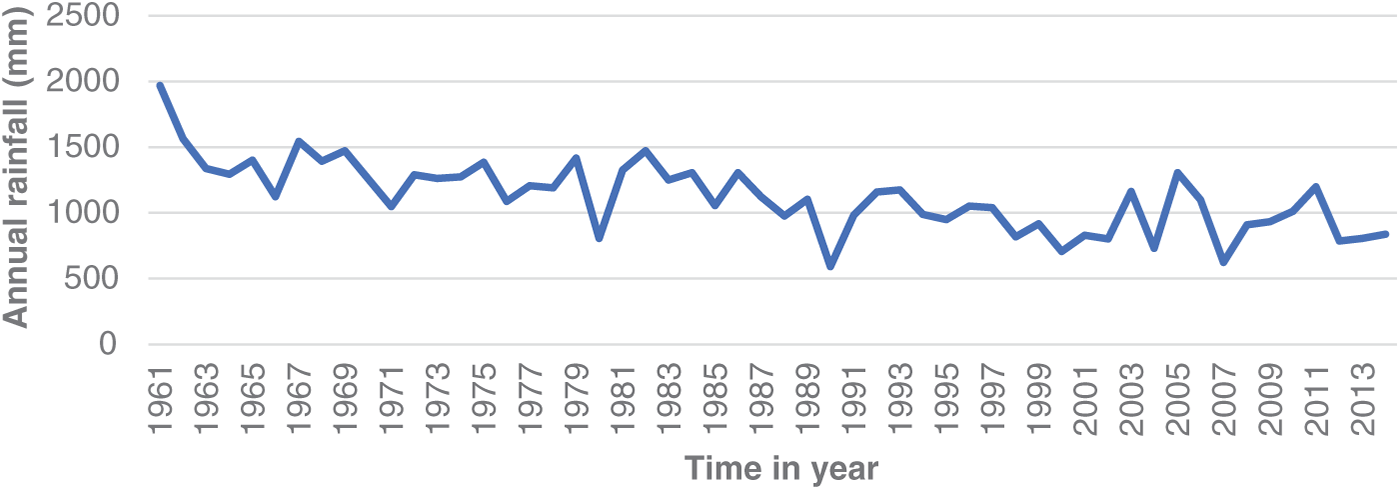
Figure 11: Rainfall at Huambo weather station (from 1961 to 2014)
Expressed by decade, the uninterrupted decrease in rainfall is even more marked (Table 3). The decrease that can occur from one decade to the next does not change the general trend. This is noted between the decades 1971–1980 and 1981–1990, 1991–2000, and 2001–2010. Thus, the diachronic variation, remains a continuous decrease.
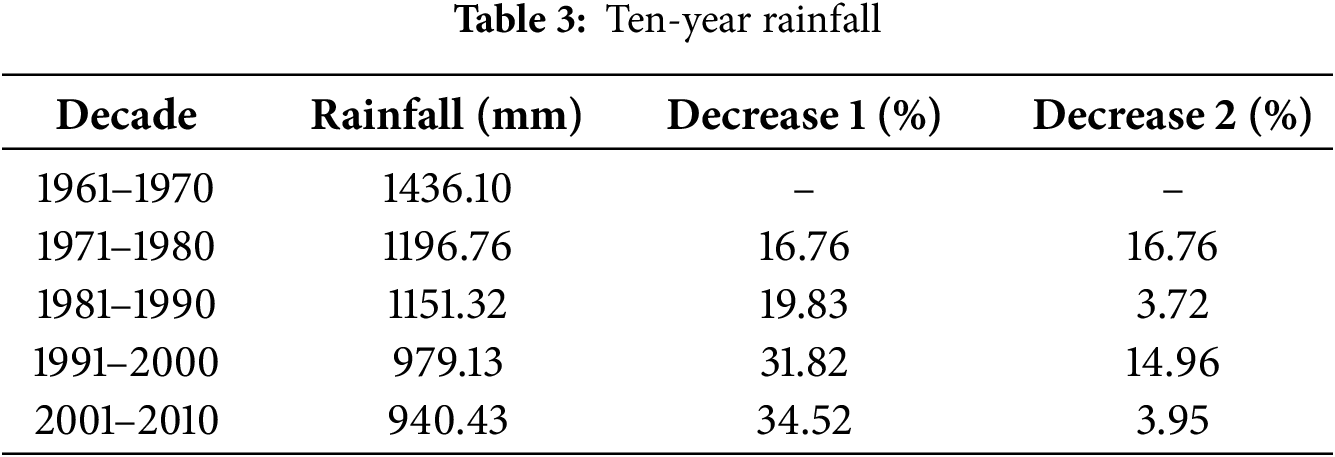
The third column of Table 3 indicates the magnitude of the successive declines. Thus, from 16.76% for the decades 1961–1970 and 1971–1980, the declines gradually increased to reach 35%, double, in the decade 2001–2010. The fourth column lists the consecutive declines in reference to each previous decade. Stabilization or settlements in the decline in rainfall can be observed. This is the case for the decades 1971–1980 and 1981–1990, where the reduction is only 3.72% compared to the previous period (16.74%); and 3.95% for the decade 2001–2010 compared to the decade 1991–2000.
3.3.2 The Boma Weather Station
Although close to the humid equatorial climate, Boma is sometimes watered by the spray of the cold and dry Benguela current, even if very weak. The average annual rainfall of 1095.5 ± 328.3 mm is within the same range as that recorded at the Huambo weather station (1123.5 ± 266.9 mm). The maximum of 1692.77 and the minimum of 506.25 mm were recorded in 1982 and 1999, respectively (Fig. 12).
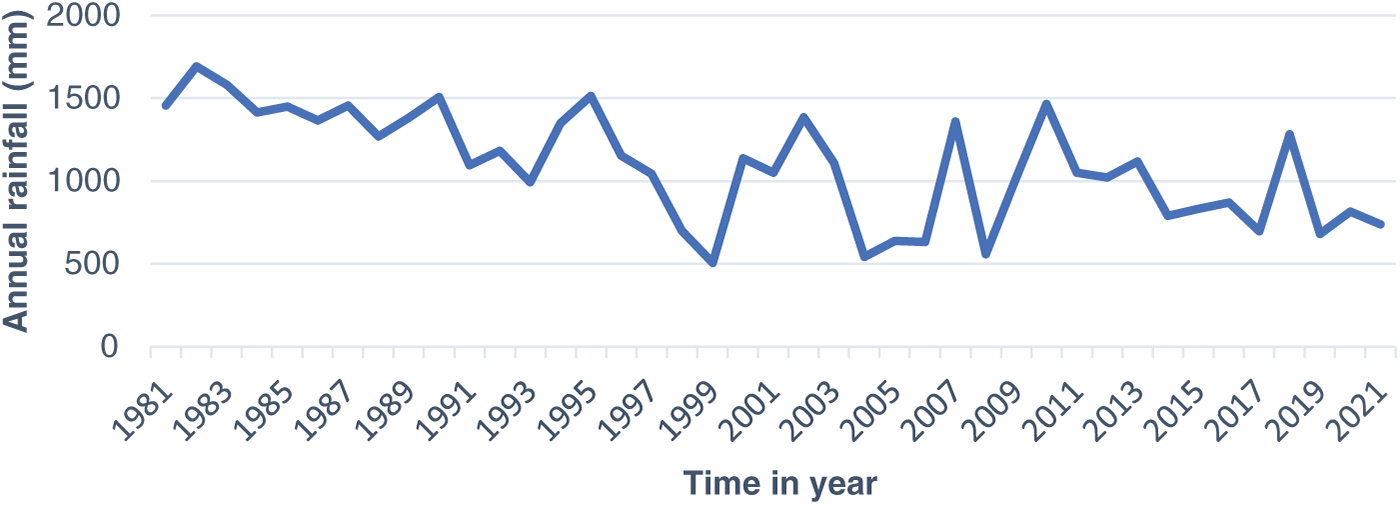
Figure 12: Annual rainfall at Boma weather station
From 1981 to 2021, the rainfall of 1455.47 mm in 1981 decreased by half (1.97) to 739.43 mm in 2021, a reduction of 56.32%. As for the minimum of 506.25 mm, located in 1999, it represents a decrease of 65.22% compared to the starting point. As in the case of Huambo, the uninterrupted decline in rainfall would probably be due to the shortness of the observation period, which would not have allowed the appearance of distinct intervals.
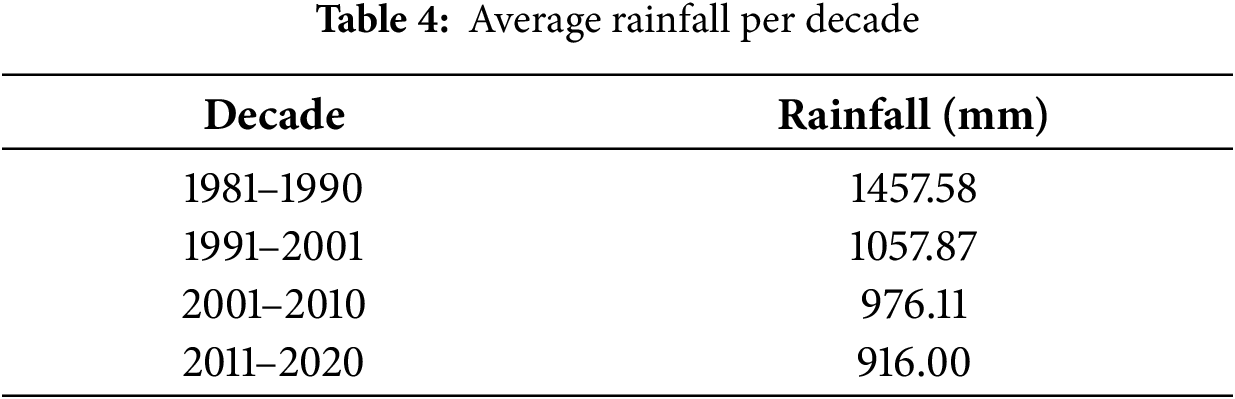
The evaluation by decade of rainfall at the Boma weather station, as in the previous cases, highlights the progression towards increasingly lower values in temporal variability (Table 4). From the first to the last decade, rainfall decreased by 37.16%.
The study of rainfall data from four weather stations, in well-distanced spatial positions from each other, all located in the southern hemisphere and in the same Zambezian phytogeographic region, highlighted fluctuations evolving towards increasingly decreasing values, both in rainfall and in the annual number of rainy days. This latter factor has only been studied at the Lubumbashi weather station. The decrease in rainfall is not limited to the study area of this research, but is widespread throughout southern Africa, according to the observations of the Goddard Institute for Space Studies, cited by the World Bank [15].
The general decline in rainfall raises the key question of whether this decline is just an episode in the history of regional climate evolution, as Nicholson [9] seems to be saying about the Congo Basin, or a trend towards further alteration of current climate parameters, notably rainfall? And in this last hypothesis, what would be the impact on the hydrological regime of the watercourses and rivers that arise from the central plateau of Angola, the water tower of southern Africa, or from its flanks and which supply the hydroelectric dams? This is particularly the case of the Kwanza River, the pillar of the Angolan economy, which also descends from this central plateau and on the route of which eight hydroelectric dams are built (Fig. 2); the same problem could arise for the watercourses of the south and south-east of the Democratic Republic of Congo, which too have their source on the Angolan high plateau or on its slopes, tributaries of the Congo River and likewise contribute to the supply of the Inga hydroelectric dam.
Using the Mann-Kendall statistic test, a trend appears when the curves u(t) and u(t′) evolve without crossing. On the other hand, the entanglement of one in the other denotes its absence. Thus, the application of this test to the data from Lubumbashi (Figs. 13 and 14), Luanda (Fig. 15) and Huambo (Fig. 16) establishes that there is no trend in the space-time taken into account, with regard to Figs. 13 and 15 relating to rainfall in Lubumbashi and in Luanda, respectively.
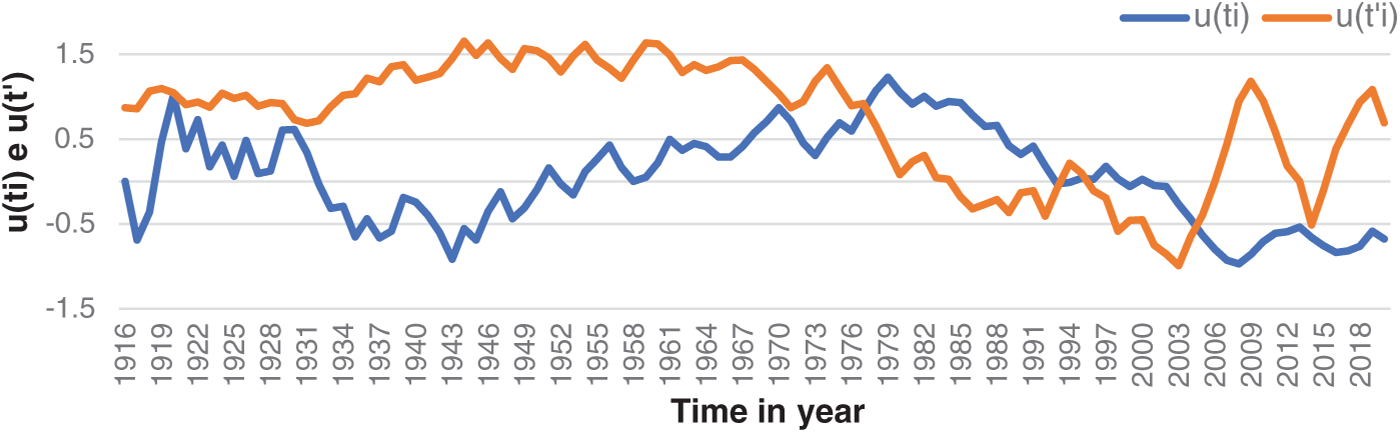
Figure 13: Annual rainfall in Lubumbashi weather station, Mann-Kendall test
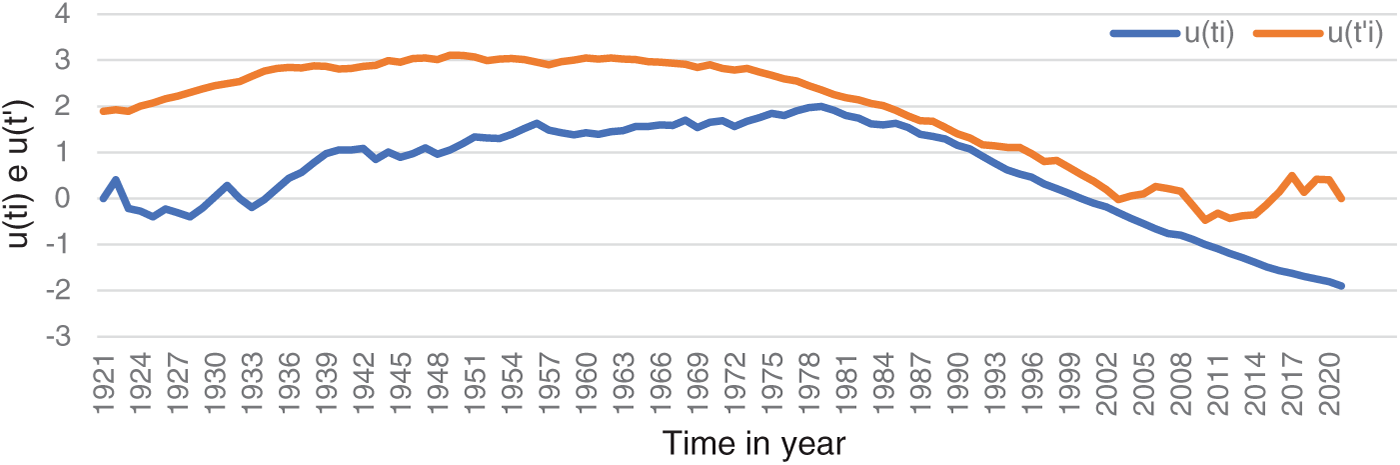
Figure 14: Annual number of rainy days in the Lubumbashi weather station, Mann Kendall test
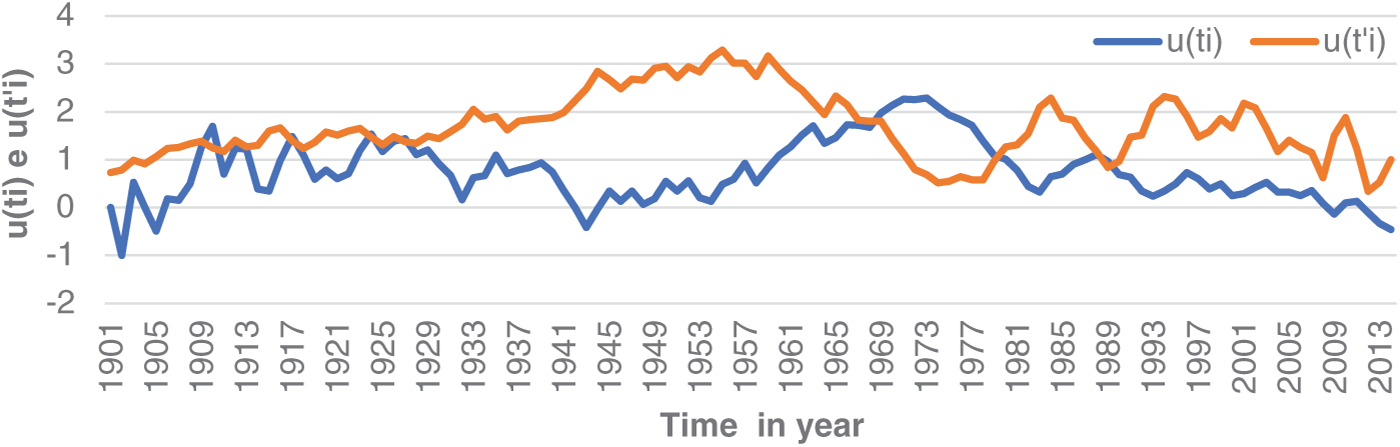
Figure 15: Annual rainfall in João Capelo weather station (Luanda), Mann-Kendall test
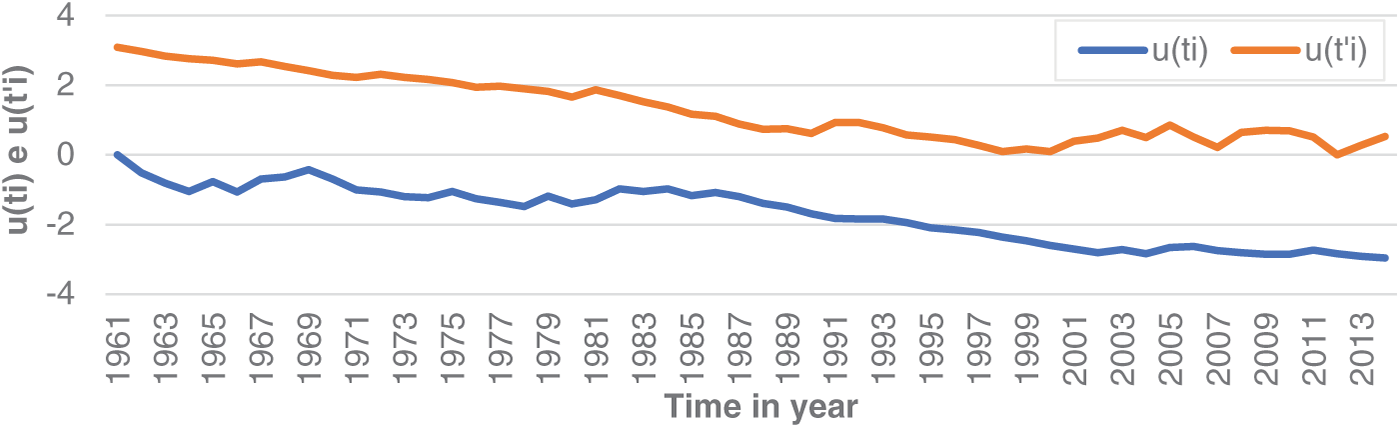
Figure 16: Rainfall in Huambo, Mann-Kendall test
Considering the annual number of rainy days at the Lubumbashi weather station (Fig. 14), there appears to be a downward trend. But this trend would not be strongly linked to the decrease in rainfall, as will soon be deduced below from the research for causal relationships.
Regarding the Huambo weather station (Fig. 16), the continuous decline in annual rainfall in the central plateau of Angola requires special attention, given the vital and strategic role of water in human life and the economies of countries, especially of Angola and the Democratic Republic of Congo. Indeed, as stated in the Mann-Kendall trend test, the parallel decreasing progression of the u(t) and u(t′) curves indicates a downward trend in rainfall.
Research comparing the evolutionary trends of the regional climates of Luanda (Fig. 15) and of Lubumbashi (Fig. 13) led to notice that they have the same number of episodes (Table 5), resulting from the intertwining of the curves u(t) and u(t′). Although of different durations over time, this implies that despite the 1592 km separating Luanda from Lubumbashi, the two sites of the same Zambezian phytogeographical region are subject to similar climatic influences.
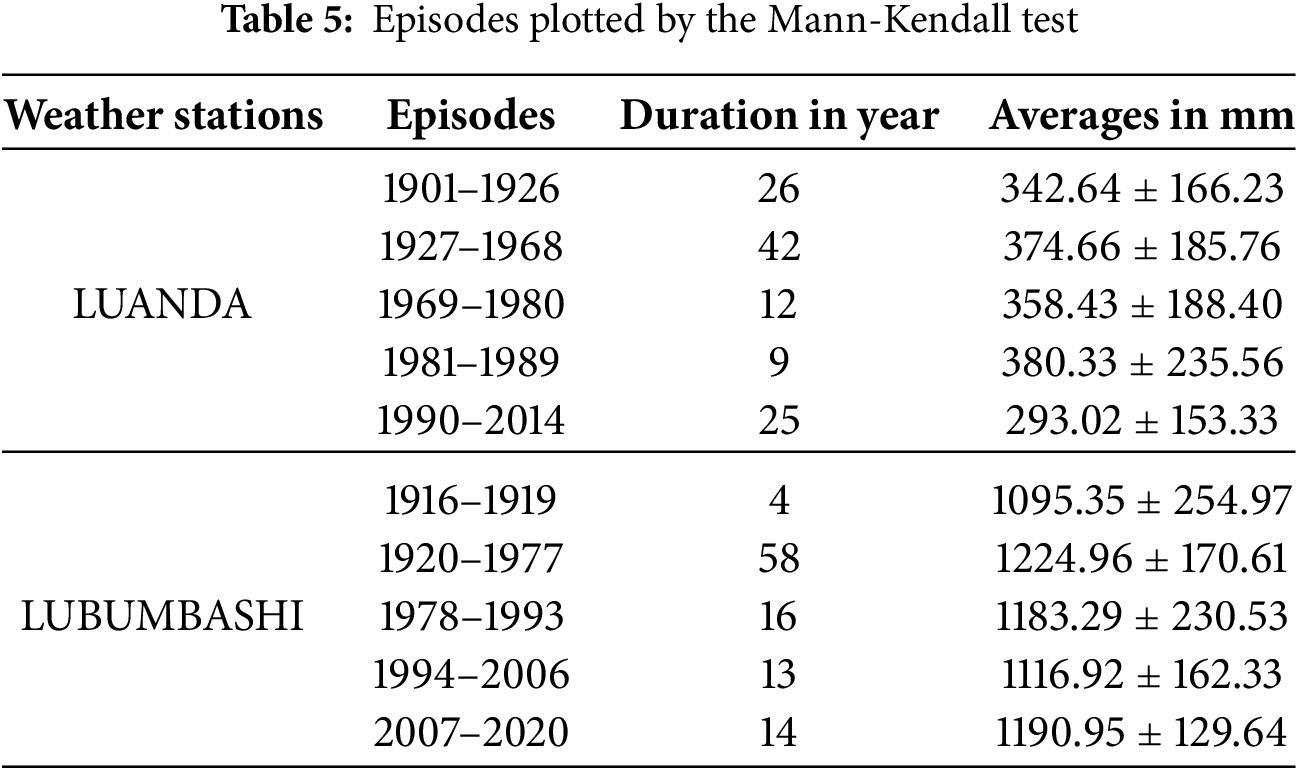
The boundaries of the episodes, as they actually appear in Table 5, only concern the periods from 1901 to 1989 for Luanda, and from 1916 to 2006 for Lubumbashi. After these limits, the decline in rainfall being still continuous, it is no longer possible to predict the subsequent stages of climate development; only future research will clarify the tendencies.
Re-examining Table 5 again, a period of relative rainfall stability emerges; this one occupies the same position in both weather stations. It is 42 years for the Luanda weather station, extending from 1927 to 1968, around 374.66 ± 185.76 mm; it is 58 years for the Lubumbashi weather station, a little more extended and ranging from 1920 to 1977, around 1224.96 ± 170.76 mm. Considering only the 42-year common space, the average annual rainfall for Lubumbashi was 1209.52 ± 158.93 mm.
Several factors can be suggested to understand the gap that arose between the beginning and the end of the period of rainfall stability, while the climatic event is taking place in the same phytogeographic region. One of the most likely is the cold and dry Benguela Current, which blows off along the Western coast of Angola and influences or even controls rainfall there.
Let us now come back to the case of Lubumbashi. The year 1978 marked the beginning of the simultaneous decline in rainfall and the annual number of rainy days. The research for the causal links of this evolution between these two parameters resulted in a correlation coefficient r = 0.45. This value in reality only expresses the strength of association of two parameters that the standards defined in Carvalho [16] qualify as moderate.
Statistically, the coefficient of determination r2 = 0.2012 specifies that the variability of precipitation recorded at Lubumbashi weather station as a function of time is explained by only 20% of the variability of the annual number of rainy days. This would therefore not be the predominant causal factor. Indeed, it is observed that, despite the reduction in the annual number of rainy days, the average annual rainfall is within the fluctuation range of the annual maximum and minimum.
In reality, the adverse effects of the continuous decline in rainfall and the annual number of rainy days lie, on the one hand, in reducing the duration of the rainy season from 7 months, under normal conditions, to only two to three months, accompanied by long interruptions. On the other hand, contrary to the weak links of association of the two factors taken into account, and as the coefficients of correlation and of the determination may suggest, if we refer for example to the climatic year 2010–2011 alone, and assume that the rains fell uniformly, within the same fluctuation range, with 1251.5 mm of rain over 53 days, the average per rainy day would be only 23.6 mm.
From a pedological and hydrological point of view, in agreement with Hillel [17], exopercolation, the loss by evaporation of this tiny amount of water in the surface layers, would prevail over endopercolation, infiltration, and surface flow. This would result in a deficit in regional hydrological regimes. In addition, this deficit would cause a lack of groundwater supply and water retention for electricity production and crops irrigation. Nguimalet et al. [18] introducing their study related to “Hydroclimatic dynamics of the upper Oubangui River in Mobaye, Central Africa Republic: comparative study of the role of the savannah and the equatorial forest”, assert “that the rainfall breakdown of the 1970s was less marked in Central Africa than in West Africa. It nevertheless had a large impact on the hydrological regimes of the major watercourses of the region”.
In view of the results obtained, it is established, within the spatial and temporal limits of the present study, that the decreases in rainfall would only be an episode whose duration will be defined by future research. Nicholson [9] had already estimated that the aridity trends are generally not significant and that they will not continue to occur. Imwangana et al. [19], studying the recent evolution and determination of the rainy season in Kinshasa and its surroundings in the time interval from 1961 to 2010, concluded that, despite the decrease in the frequency of precipitation, none of the analysed rainfall indices presented an evolutionary trend statistically significant enough to induce changes in rainfall in the region.
However, the uninterrupted decline in rainfall since the 1970s, or even earlier, is a real fact. Moreover, the determining role of global warming cannot be denied, despite a decline not exceeding the range between the maximum and minimum value of rainfall fluctuation. The Mann-Kendall statistical test translates this rainfall decline into episodes and not into a confirmed statistical trend, except for the Huambo weather station.
We recognized the role of global warming in the decline in rainfall and the annual number of rainy days, and this decline is an indicator of climate change. Moreover, at the Lubumbashi weather station, where both parameters were studied, their pattern to decrease is similar. This is also an indicator of climate change. According to the Mann-Kendall test, the decline in the annual number of rainy days would reflect a statistical trend.
On the central Angolan plateau, the declining trend is also confirmed. Although the observation period is too short to be conclusive, it deserves special attention, given the economic implications for the countries of the region, particularly for water supply for agriculture and hydroelectric dams.
We conclude that the decrease in rainfall is a result of current atmospheric conditions and that the aridity trend is temporary. However, it is important to remain attentive to future developments, this is which brings out the Mann-Kendall test applied to the rainfall in Lubumbashi (Fig. 13) and Luanda (Fig. 14).
In fact, in Angola, the presence of eight hydroelectric dams on the Kwanza River, producing 7000 MW, makes this River a vital axis of the national economy and the dams control the variability of freshwater storage in the water retention basins [20]. Consequently, the downward trend in annual rainfall on the Angolan central plateau is alarming. Any change in the hydrological regime, resulting in a reduction in flow, would have negative economic consequences.
The same is true of the Democratic Republic of Congo, a country straddling the Equator, the Congo River (also straddling the Equator), on which the Inga dam is located and which, in its final phase, is expected to produce 40,000 MW, has the Kasai river as its main tributary. Its source is on the eastern flank of the Angolan central plateau. Its flow varies between 9800 and 12,000 m3·s−1. Adding only the most important tributaries that also originate on the eastern slope of this same central plateau, namely the Kwango (2700 m3·s−1) and the Lubilash-Sankuru (2500 m3·s−1), these discharge significant quantities of water into the Congo River. For that matter, during the dry season in the southern hemisphere, while it rains in the northern hemisphere, the Congo River, in its southern part, is at its lowest water level between Kinshasa and Brazzaville, and therefore also downstream and in the water retention basin of the Inga Dam. This testifies to the decisive role of the tributaries of the Congo River that come from the central plateau of Angola or its flanks.
The temporal evolution of the annual rainfall recorded in all the weather stations studied indicated that, since the 1970s, there has been a continuous decline. To confirm or disprove what appears to be a downward trend, Mann Kendall’s test was used on the rainfall data from the Luanda (114 years), Lubumbashi (106 years) and Huambo (54 years) weather stations, the three located in the Zambezian phytogeographic region. For the first two, the test shows that the general decline in rainfall is just an episode in the history of current regional climate evolution, as Nicholson [9] seems to be saying about the Congo Basin. However, we can’t project into the coming time what’s going to happen. In contrast to what is happening in the first weather stations, for the Huambo weather station (1721 m altitude), Mann Kendall’s test showed a downward tendency (Fig. 16).
The comparison between the evolutionary trends of the regional climates of Luanda (Fig. 15) and of Lubumbashi (Fig. 13) leads to the notice that they have the same number of episodes (Table 5), resulting from the intertwining of the curves u(t) and u(t′). Although of different durations over time, this implies that despite the 1592 km separating the two sites of the same Zambezian phytogeographic region, they are subject to similar climatic influences.
With regard to the annual number of rainy days, the application of the same test by Mann Kendall to the data collected at Lubumbashi weather station (100 years), resulted in a downward trend (Fig. 14). From a statistical point of view, however, we note that the links of association between a decrease in rainfall and a decrease in the annual number of rainy days are weak. Indeed, the correlation coefficients r and that of determination r2 between the two parameters are respectively 0.45 and 0.20.
Contrary to the weak links of association between the rainfall and annual number of rainy days, as the coefficients of correlation and of the determination may suggest, if we refer especially to the climatic year 2010–2011 alone, and assume that the rains fell uniformly, within the same fluctuation range, with 1251.5 mm of rain over 53 days, the average per rainy day would be only 23.6 mm. As a result, exopercolation, loss by evaporation of this tiny amount of water in the surface layers, would prevail over endopercolation, infiltration, and surface flow. This should lead to a deficit in regional hydrological regimes and to all the consequences in feeding groundwater and water reservoirs for dams and irrigation.
The uninterrupted decline in rainfall and annual number of rainy days since the 1970s, or even earlier, is a real and irrefutable fact; despite this decline, it does not yet exceed the range between the maximum and minimum value of rainfall fluctuation. At the Lubumbashi weather station, where both parameters were studied, their pattern to decrease is similar. This is an indicator, an index of climate change whose common detonating factor is global warming, which is evidenced by the similarity of the decline in rainfall and the annual number of rainy days.
At the level of the Angolan central plateau, the continuous decline in rainfall may, sooner or later, lead to disastrous economic implications for Angola and the Democratic Republic of Congo. For Angola, the Kwanza River, along which eight hydroelectric dams have been installed, is the economic lung. For the Democratic Republic of Congo, the Kasai tributary contributes enormously to the flow of the Congo River on which the Inga Dam, the only large dam in the country, is set up. The two watercourses, having their source on the central plateau of Angola or on its slopes, any consequent fluctuation in their flows necessarily has negative consequences on the economies of the two countries.
Given the crucial role of rainfall in feeding watercourses, such as the Kwanza River, along which 8 hydroelectric dams are installed, the Kasai river in feeding the flow of the Congo River and therefore the Inga dam, planned and extended studies of rainfall, especially at the central plateau of Angola, the water tower of southern Africa, must continue to delineate the direction of the evolution of regional climate and plan accordingly the measures necessary to provide against economic disasters.
Acknowledgement: Not applicable.
Funding Statement: The authors received no specific funding for this study.
Author Contributions: The authors’ contributions are as follows: the project design, data processing, the collection of rainfall data from Luanda and Huambo and text writing were carried out by N’Landu Dikumbwa, field collection of meteorological data from Lubumbashi, by assistants Scott Tshibang Nawej and Gabriel Mutundo Teteka, while those of Boma and the supervision of the text, by Jules Aloni Komanda. The updating of the map of the main rivers and watercourses of Angola and the location of weather stations were respectively carried out by Benjamin Mayaka Kibwila and Scott Tshibang Nawej. All authors reviewed and approved the final version of the manuscript.
Availability of Data and Materials: The rainfall data obtained from INAMET and METTELSAT, as well as all other documents used in this study, are in the personal archives of N’Landu Dikumbwa.
Ethics Approval: Not applicable.
Conflicts of Interest: The authors declare no conflicts of interest.
References
1. Curran M. La mer de glace d’Antarctique en déclin constant depuis 50 ans [Internet]. 2003 [cited 2025 May 1]. Available from: http://LAD01EX0001/Agences/DAB/hkj75715.htm. (In French). [Google Scholar]
2. Pastel B. 8 mythes courants sur le changement climatique. 2023 [cited 2025 Sep 3]. Available from: https://aseq-ehaq.ca/pdf/Climate-Change-Fact-Sheet_FR.pdf. (In French). [Google Scholar]
3. Sciama Y. Il y a 20000 ans la terre se réchauffait. Le film reconstitué. Sci Vie. 2012;1138:84–9. (In French). [Google Scholar]
4. Santini JL. La fonte des glaciers s’accélère, signe de réchauffement du globe. 2004 [cited 2025 May 1]. Available from: http://LAD01EX0001/Agences/DAB/sfe32648.htm. (In French). [Google Scholar]
5. Kazadi SN, Kaoru F. Interannual and long-term climate variability over the Zaire River Basin during the last 30 years. J Geophys Res Atmos. 1996;101(D16):21351–60. doi:10.1029/96JD01869. [Google Scholar] [CrossRef]
6. Crowhurst DM, Dadson SJ, Washington R. Evaluation of evaporation climatology for the Congo Basin wet seasons in 11 global climate models. J Geophys Res Atmos. 2020;125(6):1–16. doi:10.1029/2019jd030619. [Google Scholar] [CrossRef]
7. Assani A. Variabilité temporelle e persistance des épisodes secs en saison des pluies à Lubumbashi. Sècheresse. 1999;10(1):45–53. (In French). [Google Scholar]
8. Ndehedehe CE, Agutu NO, Ferreira VG, Getirana A. Evolutionary drought patterns over the Sahel and their teleconnections with low frequency climate oscillations. Atmos Res. 2020;233:104700. doi:10.1016/j.atmosres.2019.104700. [Google Scholar] [CrossRef]
9. Nicholson SE. Le régime pluviométrique et convectif sur l’Afrique équatoriale, en particulier sur le bassin du Congo. In: Hydrologie, climat et biogéochimie du bassin du Congo. Hoboken, NJ, USA: John Wiley & Sons, Inc.; 2022. p. 43–68. (In French). [Google Scholar]
10. Mupepi O, Marambanyika T, Matsa M, Dube T. Wetland inundation and moisture dynamics in Tugwi-Zibagwe and Shashe sub-catchments, Zimbabwe: insights from 2017 to 2023. Hydrol Sci J. 2025;70(7):1021–37. doi:10.1080/02626667.2025.2468303. [Google Scholar] [CrossRef]
11. INIDE-MED. Geografia, Ensino de base. 8a classe. Luanda, Angola: INIDE-MED; 1996. (In Portuguese). [Google Scholar]
12. Frank W. La végétation de l’Afrique. Mémoire accompagnant la carte de végétation de l’Afrique. Paris, France: UNESCO/AETFAT/UNSO; 1986. (In French). [Google Scholar]
13. Michel MB. Contribution des fermes agroforestières locales à la gestion durable de la Re-serve de Biosphère de Luki en République Démocratique du Congo [master’s thesis]. Kinshasa, Congo: Université de Kinshasa; 2003. (In French). [Google Scholar]
14. Marc L. Mann-Kendall test for trend detection, UQTR, version 3.1. In: Hasard, nombres aléatoires et méthode Monte Carlo. Québec, QC, Canada: PUQ; 2001. p. 19–34. [Google Scholar]
15. Mundial B. Relatório sobre o desenvolvimento mundial. desenvolvimento & mudança climática. São Paulo, Brazil: Editora UNESP; 2010. (In Portuguese). [Google Scholar]
16. José EC. Metodologia do trabalho científico. “Saber-Fazer” da investigação para dissertações e teses. Lisbon, Portugal: Escolar Editora; 2009. (In Portuguese). [Google Scholar]
17. Hillel D, De Backer LW. L’eau et le sol: principes et processus physiques. Louvain-La-Neuve, Belgium: CABAY; 1984. (In French). [Google Scholar]
18. Nguimalet CR, Orange D, Waterendji JP, Yambele A. Dynamique hydroclimatique de la rivière Oubangui amont à Mobaye, République centrafricaine: étude comparée du rôle de la savane et de la forêt équatoriale. In: Hydrologie, climat et biogéochimie du bassin du Congo. Hoboken, NJ, USA: John Wiley & Sons, Inc.; 2022. p. 104–18. (In French). [Google Scholar]
19. Imwangana FM, Zola BK, Nyami BL, Iyabidila MM, Kabeya MNM, Phuati GP, et al. Évolution récente et détermination de la sais on de pluies dans la région de Kinshasa (RDC) de 1961 et 2010. Rev Afr Environ Agric. 2023;6(2):48–62. doi:10.4314/rafea.v6i2.7. [Google Scholar] [CrossRef]
20. Getirana A, Hoeck JV, Ndehedehe CE. L’exploitation des barrages hydroélectriques contrôle fortement la variabilité du stockage d’eau douce du lac Victoria. Sci Total Environ. 2020;726:138343. (In French). [Google Scholar]
Cite This Article
 Copyright © 2026 The Author(s). Published by Tech Science Press.
This work is licensed under a Creative Commons Attribution 4.0 International License , which permits unrestricted use, distribution, and reproduction in any medium, provided the original work is properly cited.
 Downloads
 Citation Tools