
 Submit a Paper
 Propose a Special lssue
 Open Access
ARTICLE
Spatio-Temporal Monitoring and Assessment of Groundwater Quality for Domestic and Agricultural Use in Kurukshetra District, Haryana, India
Department of Geophysics, Kurukshetra University, Kurukshetra, Haryana, India
* Corresponding Author: Aakash Deep. Email:
(This article belongs to the Special Issue: Geospatial Techniques for Precision Agriculture and Water Resources Sustainability)
Revue Internationale de Géomatique 2026, 35, 79-100. https://doi.org/10.32604/rig.2026.074969
Received 22 October 2025; Accepted 14 January 2026; Issue published 05 February 2026
 View Full Text
 Download PDF
Abstract
The assessment of groundwater quality is crucial for ensuring its safe and sustainable use for domestic and agricultural purposes. The Kurukshetra district in the Indian state of Haryana relies heavily on groundwater to meet household and agricultural needs. Sustainable groundwater management must be assessed in terms of suitability for domestic and agricultural needs in a region. The current study analyzed pre-monsoon geochemical data from groundwater samples in the study area for 1991, 2000, 2010, and 2020. A Geographic Information System (GIS) was used to create spatial distribution maps for hydrogen ion concentration, total hardness, total dissolved solids, electrical conductivity, sodium adsorption ratio, percent sodium, and residual sodium carbonate. The study area was divided into different groundwater quality zones for domestic and agricultural use as per Bureau of Indian Standards and World Health Organization norms. The integrated maps for agriculture and domestic use were prepared by weighted overlays of these parameters in GIS for 2020, highlighting spatial variations across the district. In 2020, approximately 0.52% of the district’s area fell under the good class, while 94.41% was classified as permissible, and 5.07% as the doubtful class in terms of groundwater quality for domestic use. This indicates that the majority of the district falls under the permissible category for domestic water consumption. An area of 51.18% was found as good class, 48.43% as permissible class, and 0.39% as doubtful class for agricultural suitability, which indicates that almost the entire district’s water is suitable for agricultural use. These results suggest that a significant portion of the district’s groundwater is of acceptable quality for both domestic and agricultural purposes, although certain areas may require closer monitoring and management due to water quality issues. This study offers valuable insights into local water resource management and the promotion of sustainable agricultural practices at the district level.Keywords
Groundwater is a vital resource for sustaining human life and agricultural activities, particularly in regions with limited surface water availability, and plays an important role in supporting human life, serving as a primary source for both drinking water and agricultural irrigation [1–3]. Consequently, any deterioration in its quality poses significant risks to both food security and public health. The current studies indicate that approximately half of the global population depends on groundwater resources to satisfy essential daily requirements [4–6]. The global demand for freshwater has increased significantly due to population growth, socioeconomic development, technological advancements, and climate change [7–11]. As a renewable and widely exploited natural resource, groundwater plays a critical role in meeting domestic, agricultural, and industrial water demands. Its suitability for such applications is intrinsically governed by its quality, which is primarily influenced by the concentration of dissolved solutes, entrapped gases, and suspended particulate matter [12–15]. Deterioration in irrigation water quality remains a persistent threat to agricultural productivity and soil integrity, undermining long-term sustainability of agro-ecosystems [3,15,16]. Globally, approximately one-third of the population depends on groundwater as a primary source of drinking water, underscoring the imperative of safeguarding its quality [6,10]. Groundwater quality is a pivotal factor in water resource planning and management, with far-reaching implications for public health and environmental sustainability [17]. Groundwater quality is frequently compromised by both human actions and natural processes across various countries [18]. Several studies have highlighted that groundwater is vulnerable to contamination from both natural geogenic processes and anthropogenic activities [19–21]. In India, groundwater quality has deteriorated due to over-exploitation, excessive pesticide use in agriculture, and the discharge of untreated industrial and domestic effluents [22–24]. Evaluating and analyzing groundwater chemistry is crucial for determining its suitability for different uses. Recent classifications for groundwater quality assessment rely on parameters such as hydrogen ion concentration (pH), total dissolved solids (TDS), total hardness (TH), and major ions [25]. Several studies have focused on assessing irrigation water suitability using sodium adsorption ratio (SAR), residual sodium carbonate (RSC), electrical conductivity (EC), and percent sodium (PS or %Na) [26–28]. The geochemical characteristics of groundwater are increasingly influenced by both natural processes and human-induced activities [29,30]. Rapid agricultural intensification, industrial expansion, and the accelerating pace of urbanization have collectively placed unprecedented pressure on groundwater systems [31,32]. The extensive application of agrochemicals, along with the release of untreated municipal and industrial wastewater, has significantly altered the chemical profile of surface and subsurface water bodies. Additionally, intrinsic geological factors such as the presence of fluoride-bearing lithology further contribute to the deterioration of water quality in various regions [33,34].
Kurukshetra district predominantly depends on groundwater resources to meet its drinking water and agricultural irrigation requirements. However, increasing urbanization, agricultural intensification, and industrial activities have significantly impacted groundwater quality. This study focuses on monitoring the spatio-temporal variations in groundwater quality and assessing its suitability for diverse utilitarian purposes, including domestic and agricultural applications. In the Kurukshetra district, groundwater is extracted from unconfined to semi-confined aquifers. Groundwater for domestic and agricultural use is extracted via tube wells in unconfined environments. Both shallow and deep tube wells access the semi-confined and confined aquifers in alluvial deposits where groundwater is under hydrostatic pressure. Precipitation serves as the principal source of groundwater recharge, supplemented by lateral subsurface inflows, canal seepage, recharge wells, and percolation from village ponds. The field observations indicated that a decline in the groundwater table leads to deterioration in groundwater quality in some parts of the district [27]. GIS is an effective tool for spatial mapping and data integration for earth resource management, particularly for addressing spatial data variability. It is widely used to evaluate water quality and develop solutions to water-related issues. Hydrochemical analysis revealed marked fluctuations in key parameters, including pH, electrical conductivity, total hardness, and the concentrations of major cations (
The district is located in the upper Ghaggar basin, a part of the extensive Indo-Gangetic alluvial plain, covering an area of 1684 km2 in the northern part of Haryana, India. It is bounded by 29°53′00″ to 30°15′02″ N latitude and 76°26′27″ to 77°07′57″ E longitude geographic coordinates. The district is administratively divided into seven blocks: Ladwa, Pehowa, Shahabad, Thanesar, Babain, Pipli, and Ismailabad. The location map of the study area is depicted in Fig. 1. The topography of the area exhibits a gentle descent from the northeast towards the southwest, with elevations ranging from 274 to 241 m above mean sea level. The district experiences an average annual rainfall of 582 mm, with over 80% of this precipitation occurring during the monsoon season. The climate of the district is characterized as a subtropical monsoon type, marked by intensely hot summers and notably cold winters, with maximum temperatures reaching up to 45°C and minimum temperatures dropping to 7°C [37].
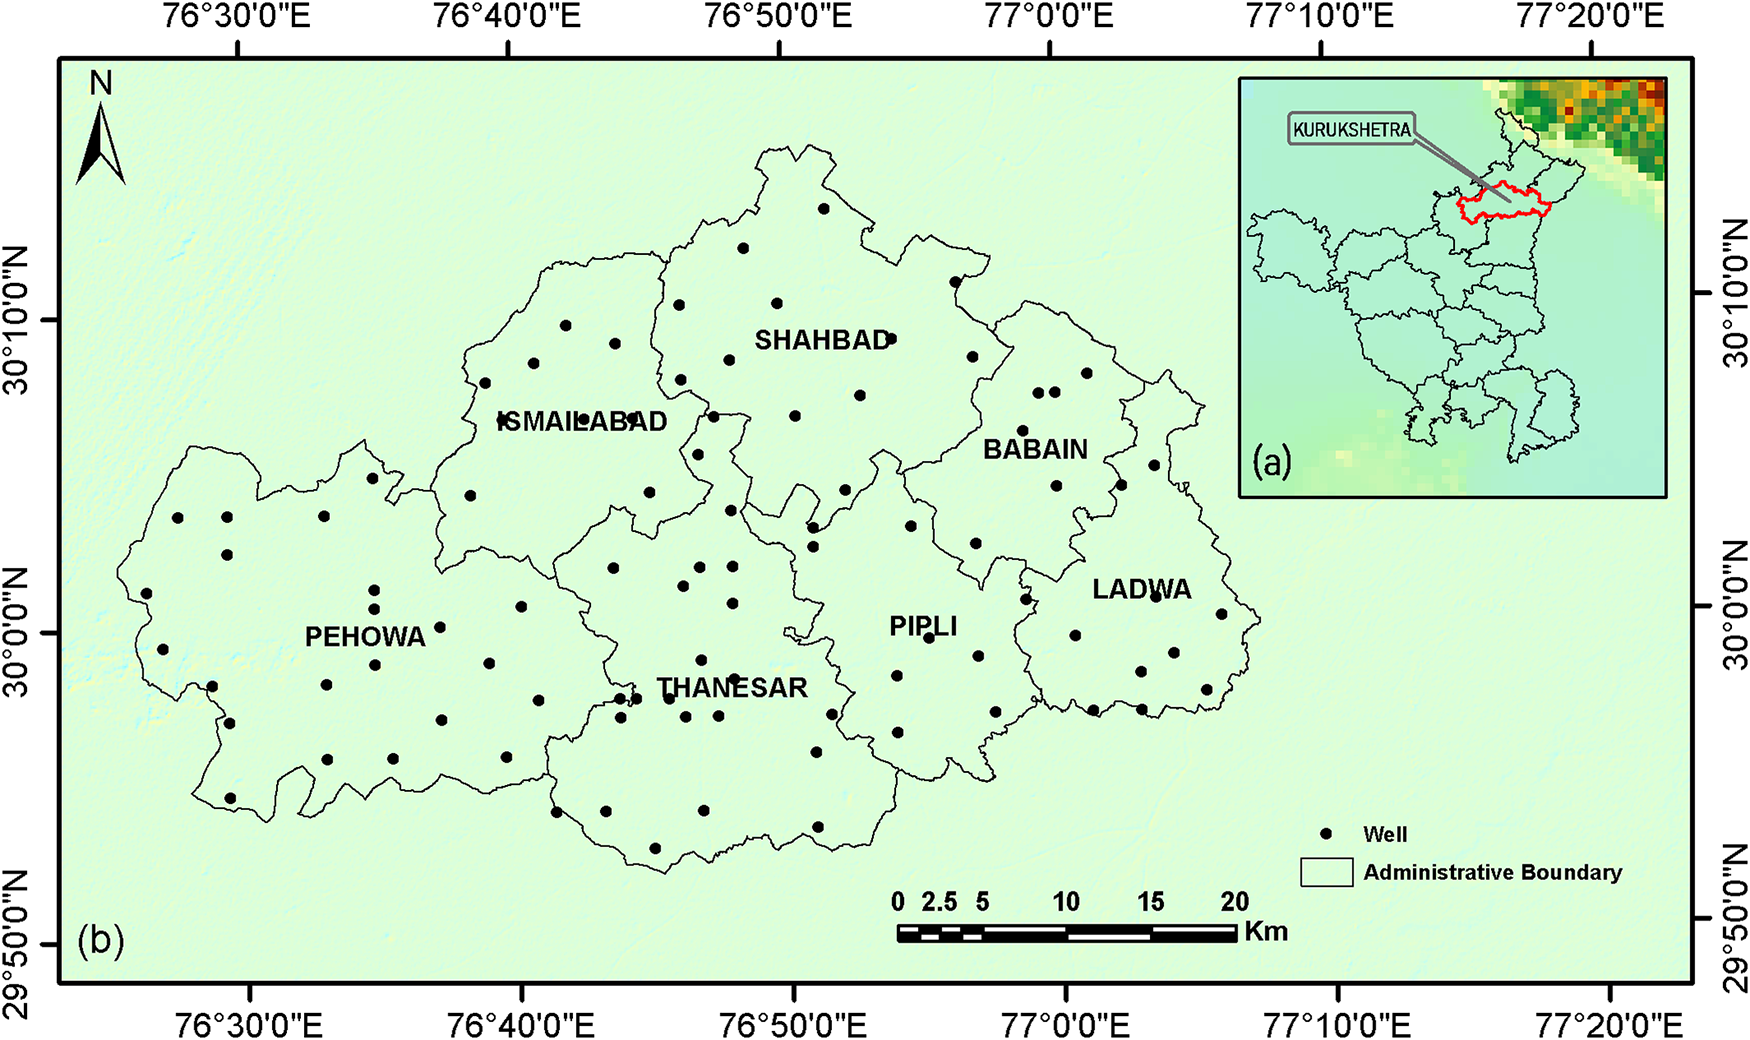
Figure 1: Location map of the study area (a) Digital elevation map of Haryana showing Kurukshetra district, (b) Map of Kurukshetra district showing different blocks and location of observation wells.
Survey of India Toposheets, numbered H43K8, H43K12, H43K16, H43L4, H43Q5, H43Q9, H43Q13, and H43R1 on a 1:50,000 scale, were utilized to create a digitized spatial database of the district for precise delineation of the district boundaries. Groundwater quality data from 80 locations was obtained from the Groundwater Cell, Kurukshetra District, Irrigation & Water Resources Department, Haryana. They followed a procedure in which each sample was collected in a pre-cleaned 1-L polyethylene container. Before filling, the bottles were thoroughly rinsed with the corresponding groundwater to reduce any risk of external contamination. All procedures for sample collection, preservation, and laboratory analysis followed the guidelines recommended by the American Public Health Association.
In-situ measurements of rapidly varying parameters—including pH, EC, and TDS, were conducted using calibrated portable instruments such as a pH meter, EC meter, and TDS meter (Hanna Instruments, Ann Arbor, MI, USA). Major cations (Na+, K+, Mg2+, and Ca2+) were quantified using atomic absorption spectrophotometry (AAS). Bicarbonate (
Different water quality parameters, pH, TH, TDS, EC, SAR, RSC, and PS were calculated from ionic concentrations of
The suitability of groundwater for domestic use was assessed using pH, TDS, and TH parameters, and these results were compared with benchmark guidelines prescribed by the BIS and WHO. Spatial distribution maps illustrating well locations and various groundwater quality parameters across 80 sampling sites were generated using spatial interpolation techniques within the GIS environment. In this study, the Inverse Distance Weightage (IDW) technique was employed as the interpolation method, wherein the estimated cell values are derived as a weighted average of surrounding sample points. In this approach, spatial proximity governs influence, with closer points exerting greater weight in the estimation process [41].
This interpolation method assigns varying weights to observation points based on their distance from the location being estimated. The closer a point is to the interpolation location, the greater its influence on the computed value, while distant points contribute less. A weighting exponent controls how rapidly the influence diminishes with distance. When the weighting power is increased, nearby points dominate the estimation, causing the predicted value to approach that of the closest sample. Different interpolation techniques like Krigging, Spline, and Inverse Distance Weightage (IDW) were used, but IDW was found to be best both in terms of spatial distribution representation and also from an accuracy point of view. Similar findings have been reported by other researchers also [27,42]. IDW is a method of interpolation that estimates cell values by averaging the values of sample data points in the neighborhood of each processing cell [42].
In the IDW method, the attribute value Z(X0), Z(Xi) at an unsampled location is determined as a weighted average of the values at surrounding sampled points within a defined neighborhood [43]. The general form of the IDW equation is:
where N is the number of scattered observation points in the set.
where
This technique was applied to map the spatial distribution of various water quality parameters for the years 1991, 2000, 2010, and 2020 using ArcGIS software. Spatio-temporal distribution maps of groundwater quality were developed using key parameters such as pH, EC, SAR, TDS, RSC, and TH. In order to assess groundwater suitability for domestic use in the year 2020, a weighted overlay analysis was performed, by incorporating three key water quality parameters with the following assigned weights: pH (30%), TDS (40%), and TH (30%) in accordance with the existing literature. Concurrently, groundwater suitability for agricultural purposes was evaluated by assigning equal weights (25% each) to EC, SAR, RSC, and PS, in alignment with the guidelines prescribed by the BIS. Integrated groundwater quality maps for both domestic and agricultural suitability were also generated.
4.1 Spatial-Temporal Variation
The spatial analysis revealed pronounced variability in groundwater quality across different parts of the Kurukshetra district over the period from 1991 to 2020. The spatio-temporal variation in groundwater quality parameters serves as a critical tool for understanding the evolving trends and spatial heterogeneity of groundwater conditions within the district. The results corresponding to various groundwater quality indicators are illustrated in Figs. 2–8, while the associated area-wise statistical summaries are presented in Tables 1–7.
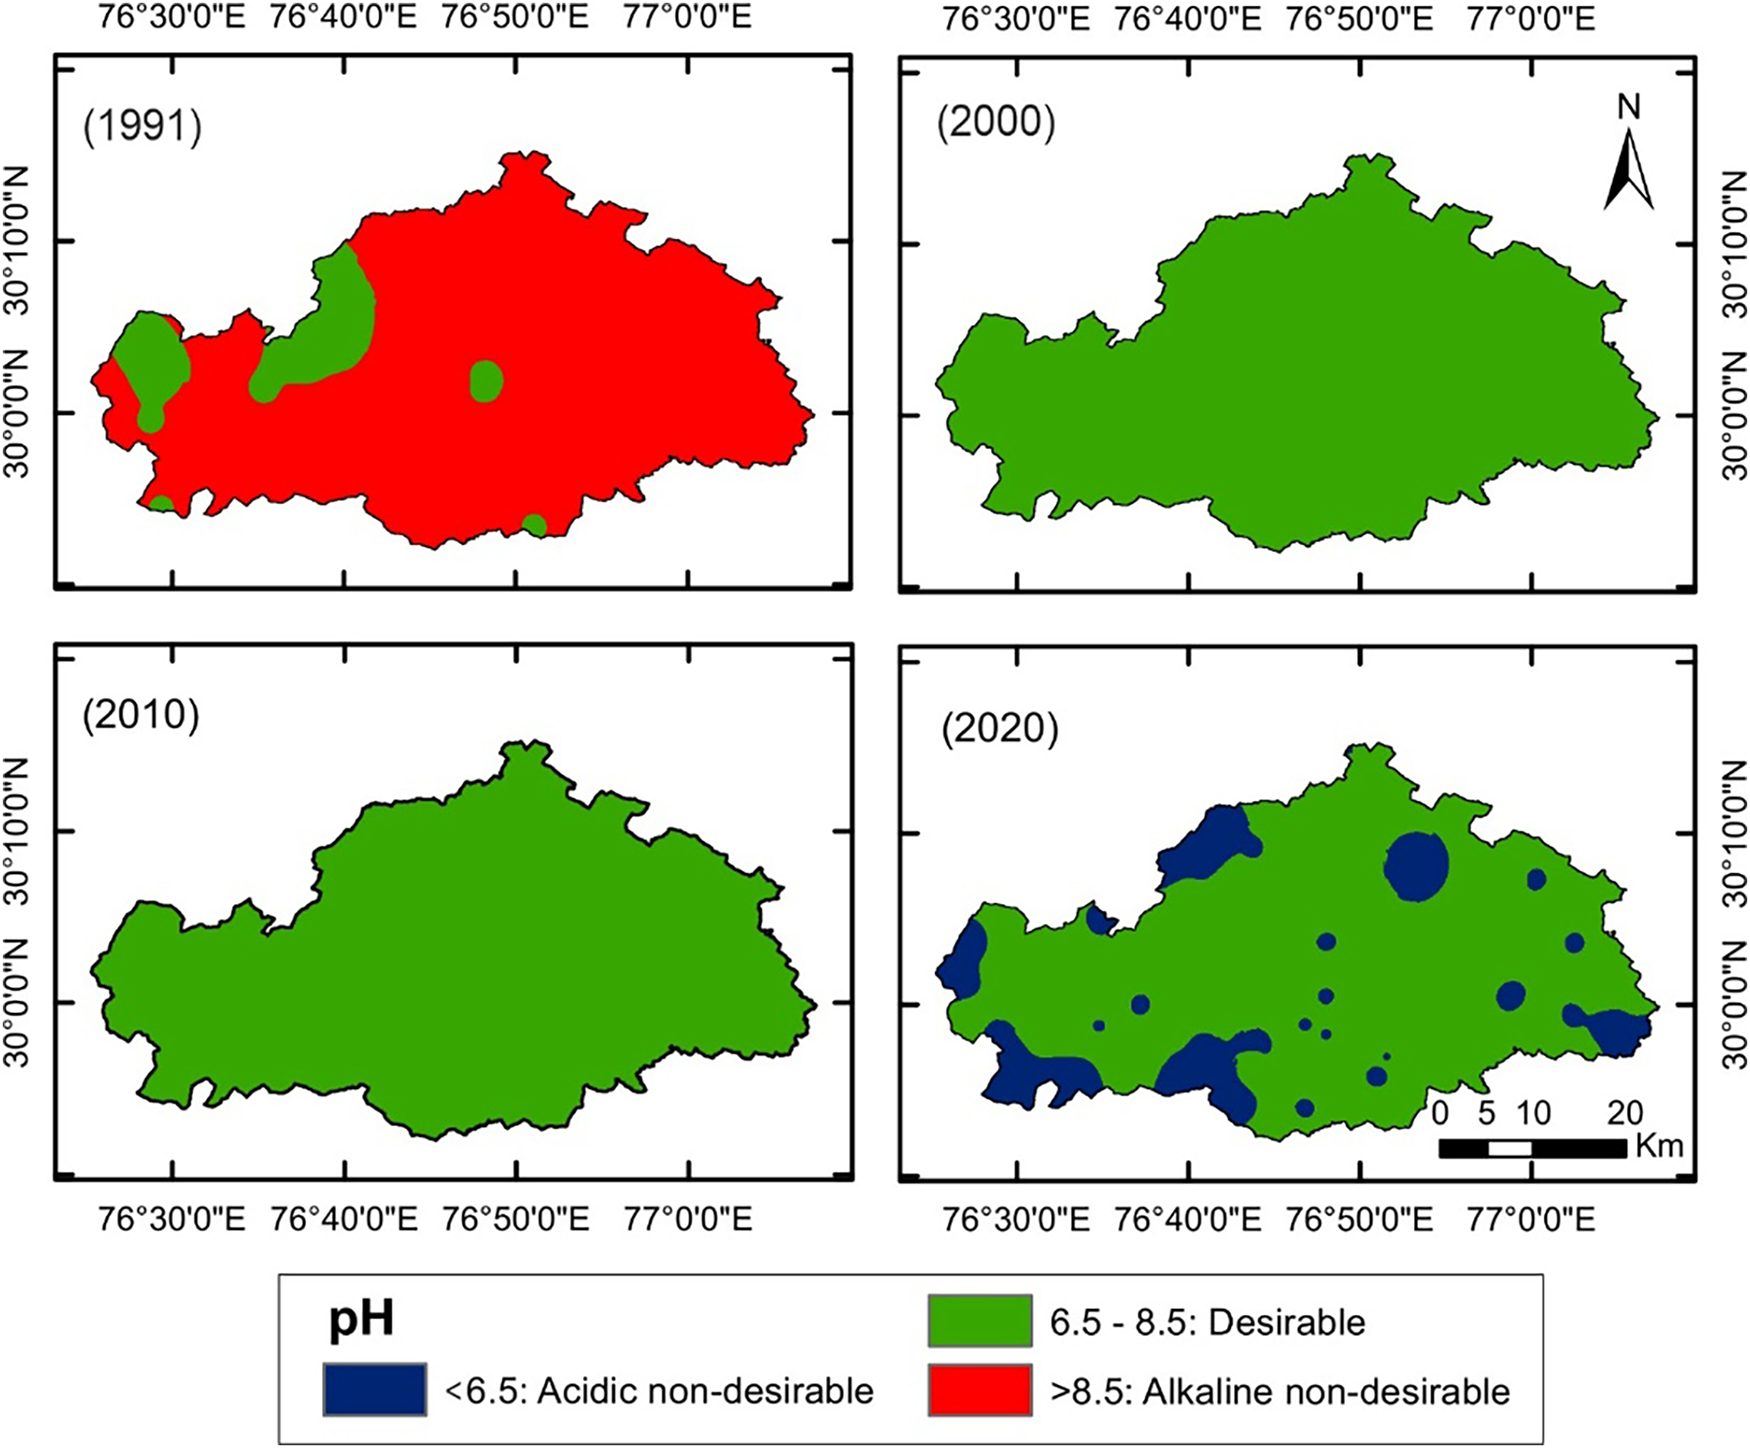
Figure 2: Spatio-temporal variation of pH from 1991 to 2020 in Kurukshetra district.
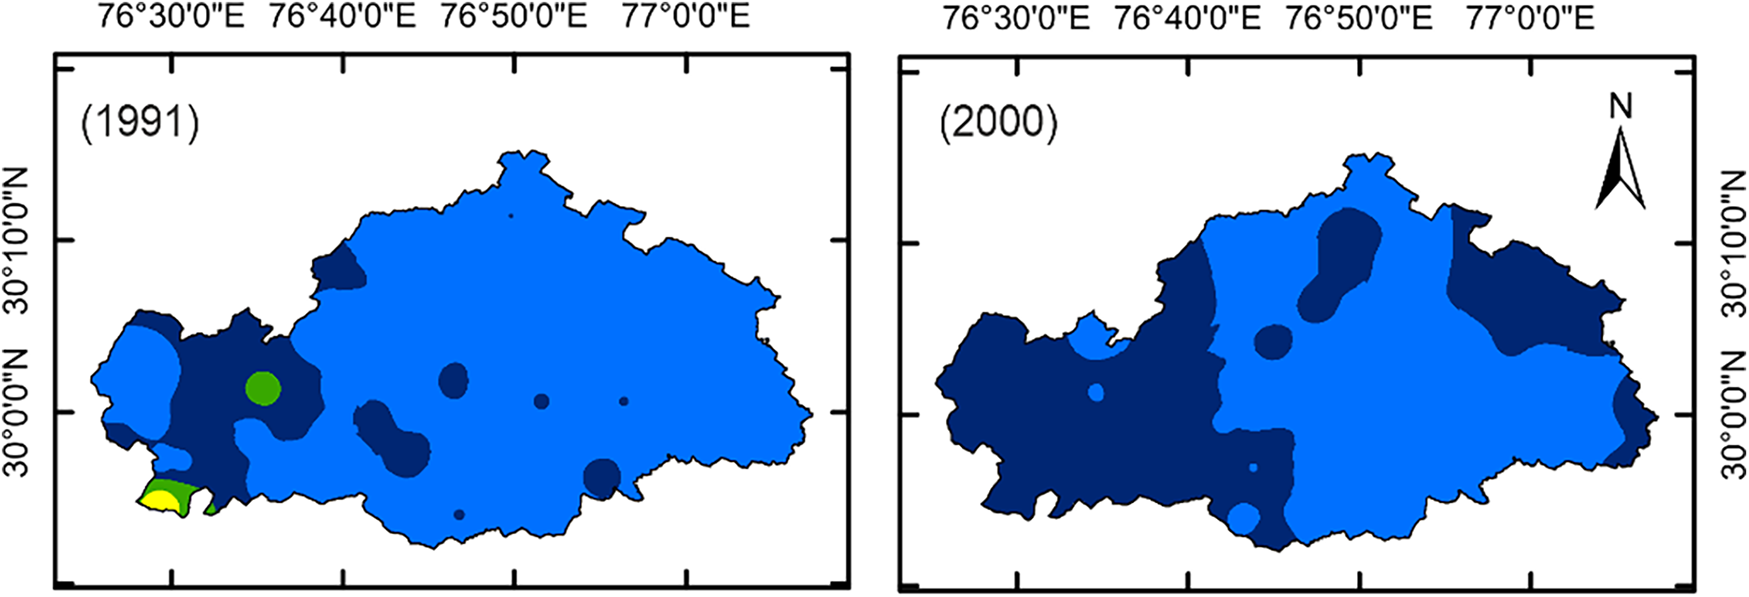
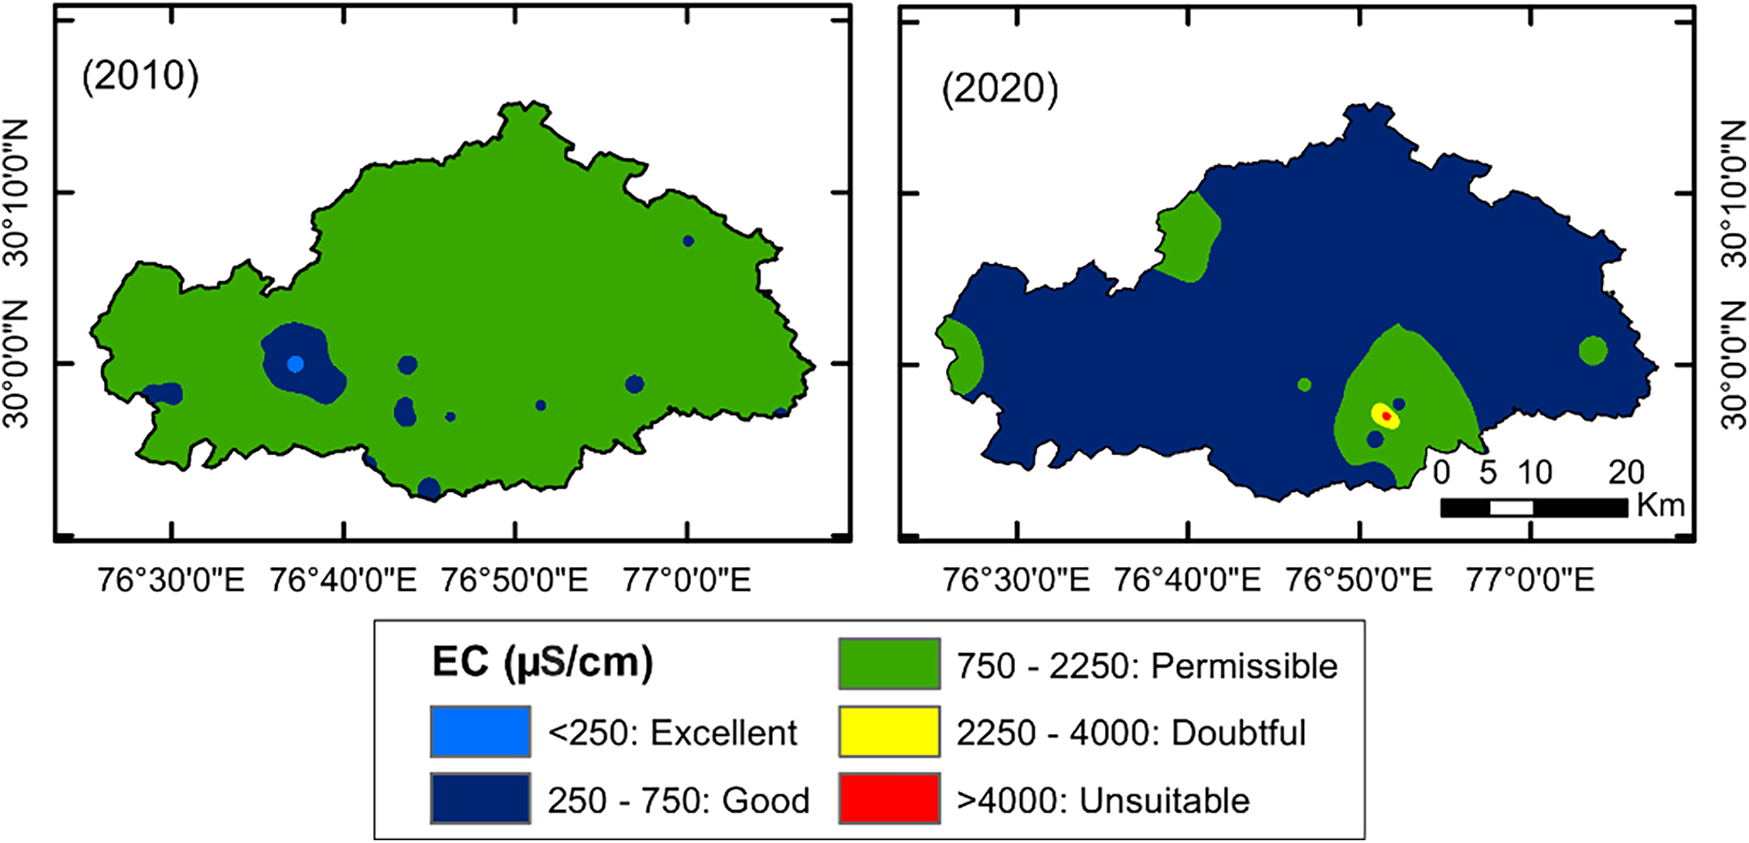
Figure 3: Spatial distribution of EC from 1991 to 2020 in the Kurukshetra district.
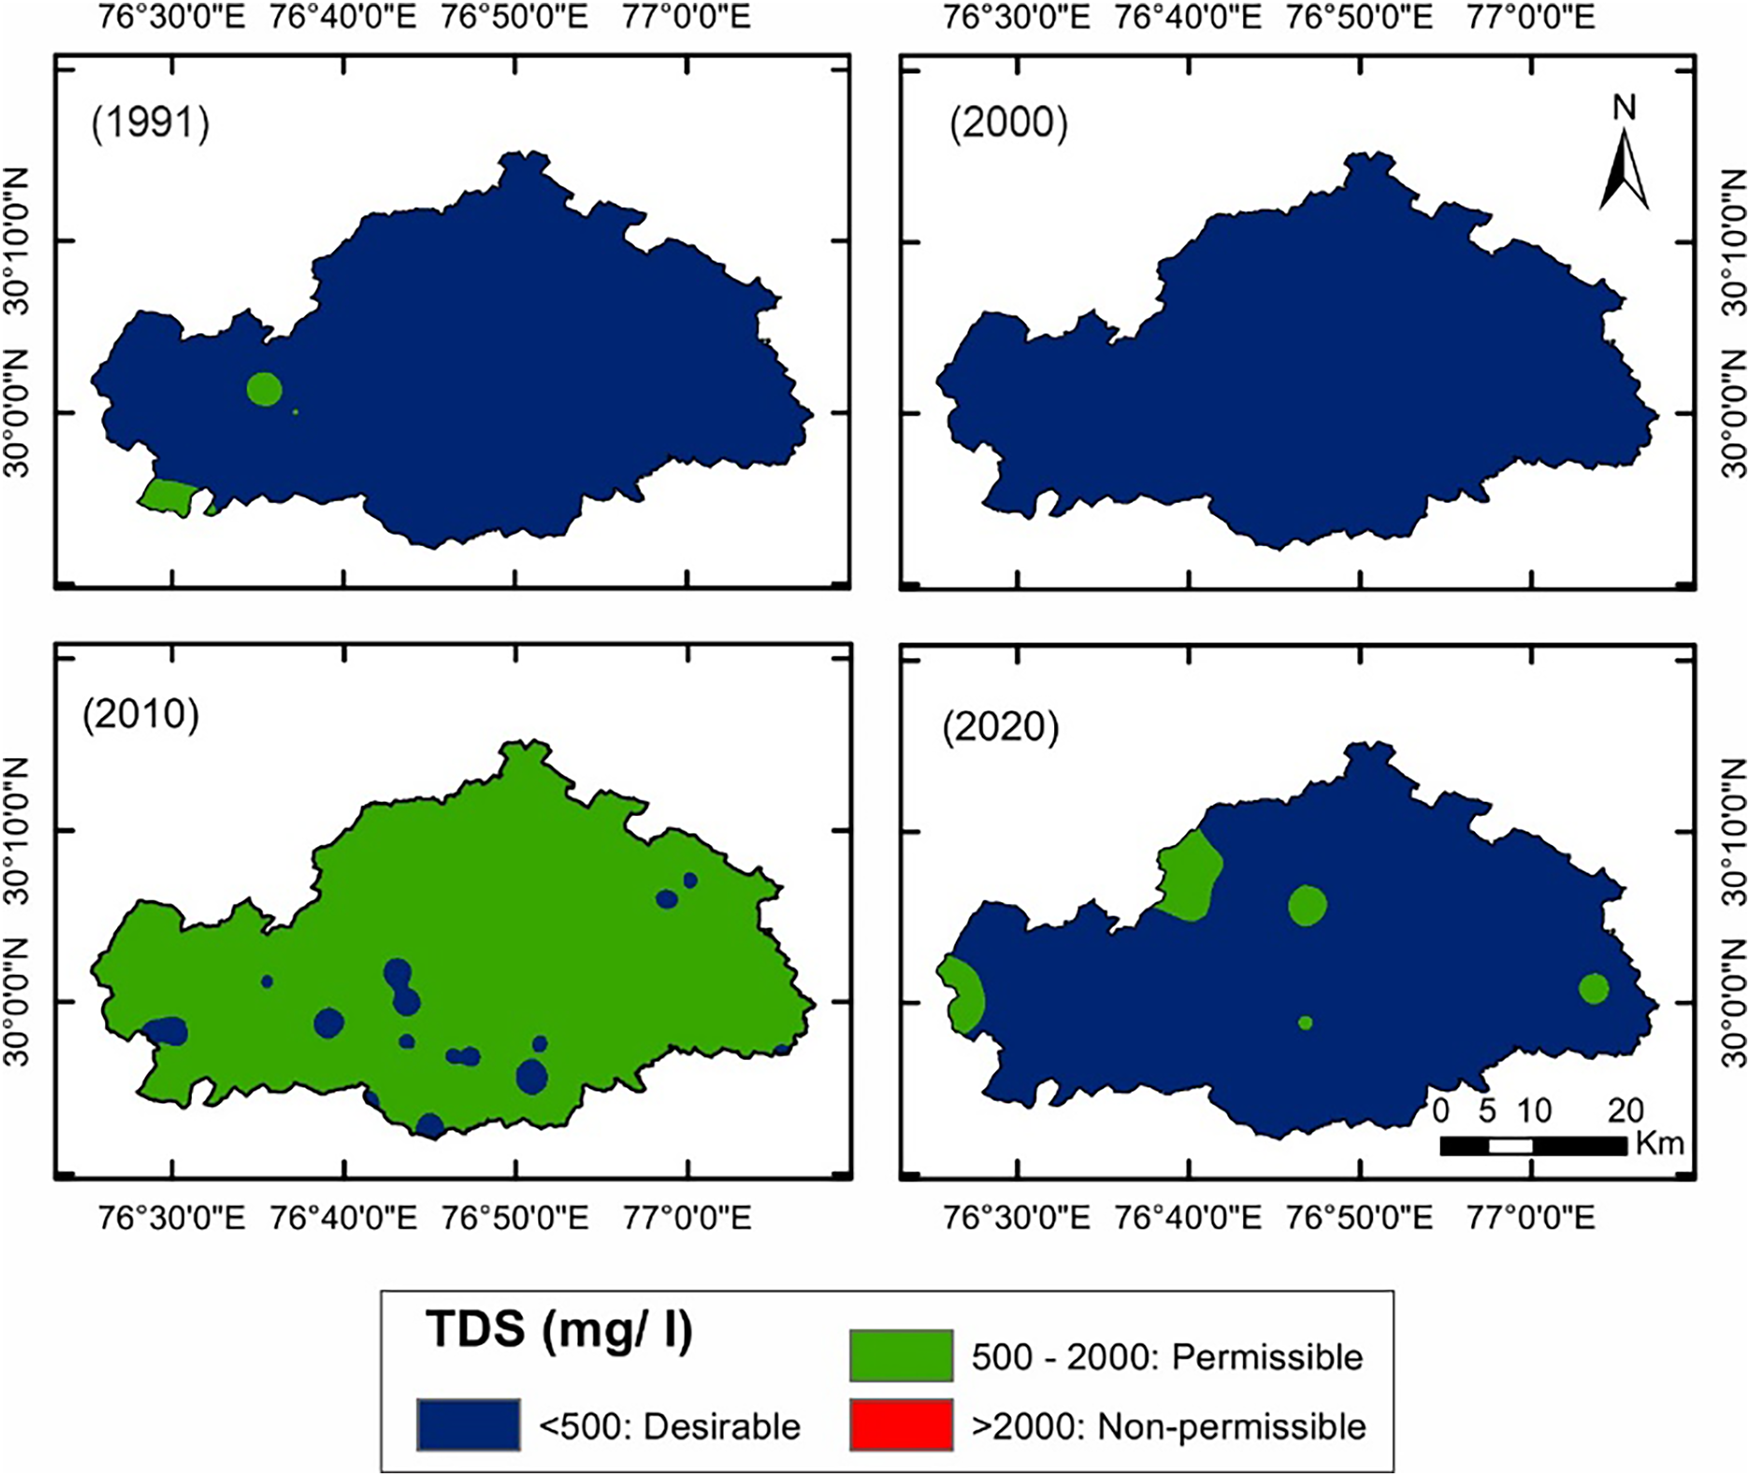
Figure 4: Spatio-temporal variation in TDS maps from 1991 to 2020.
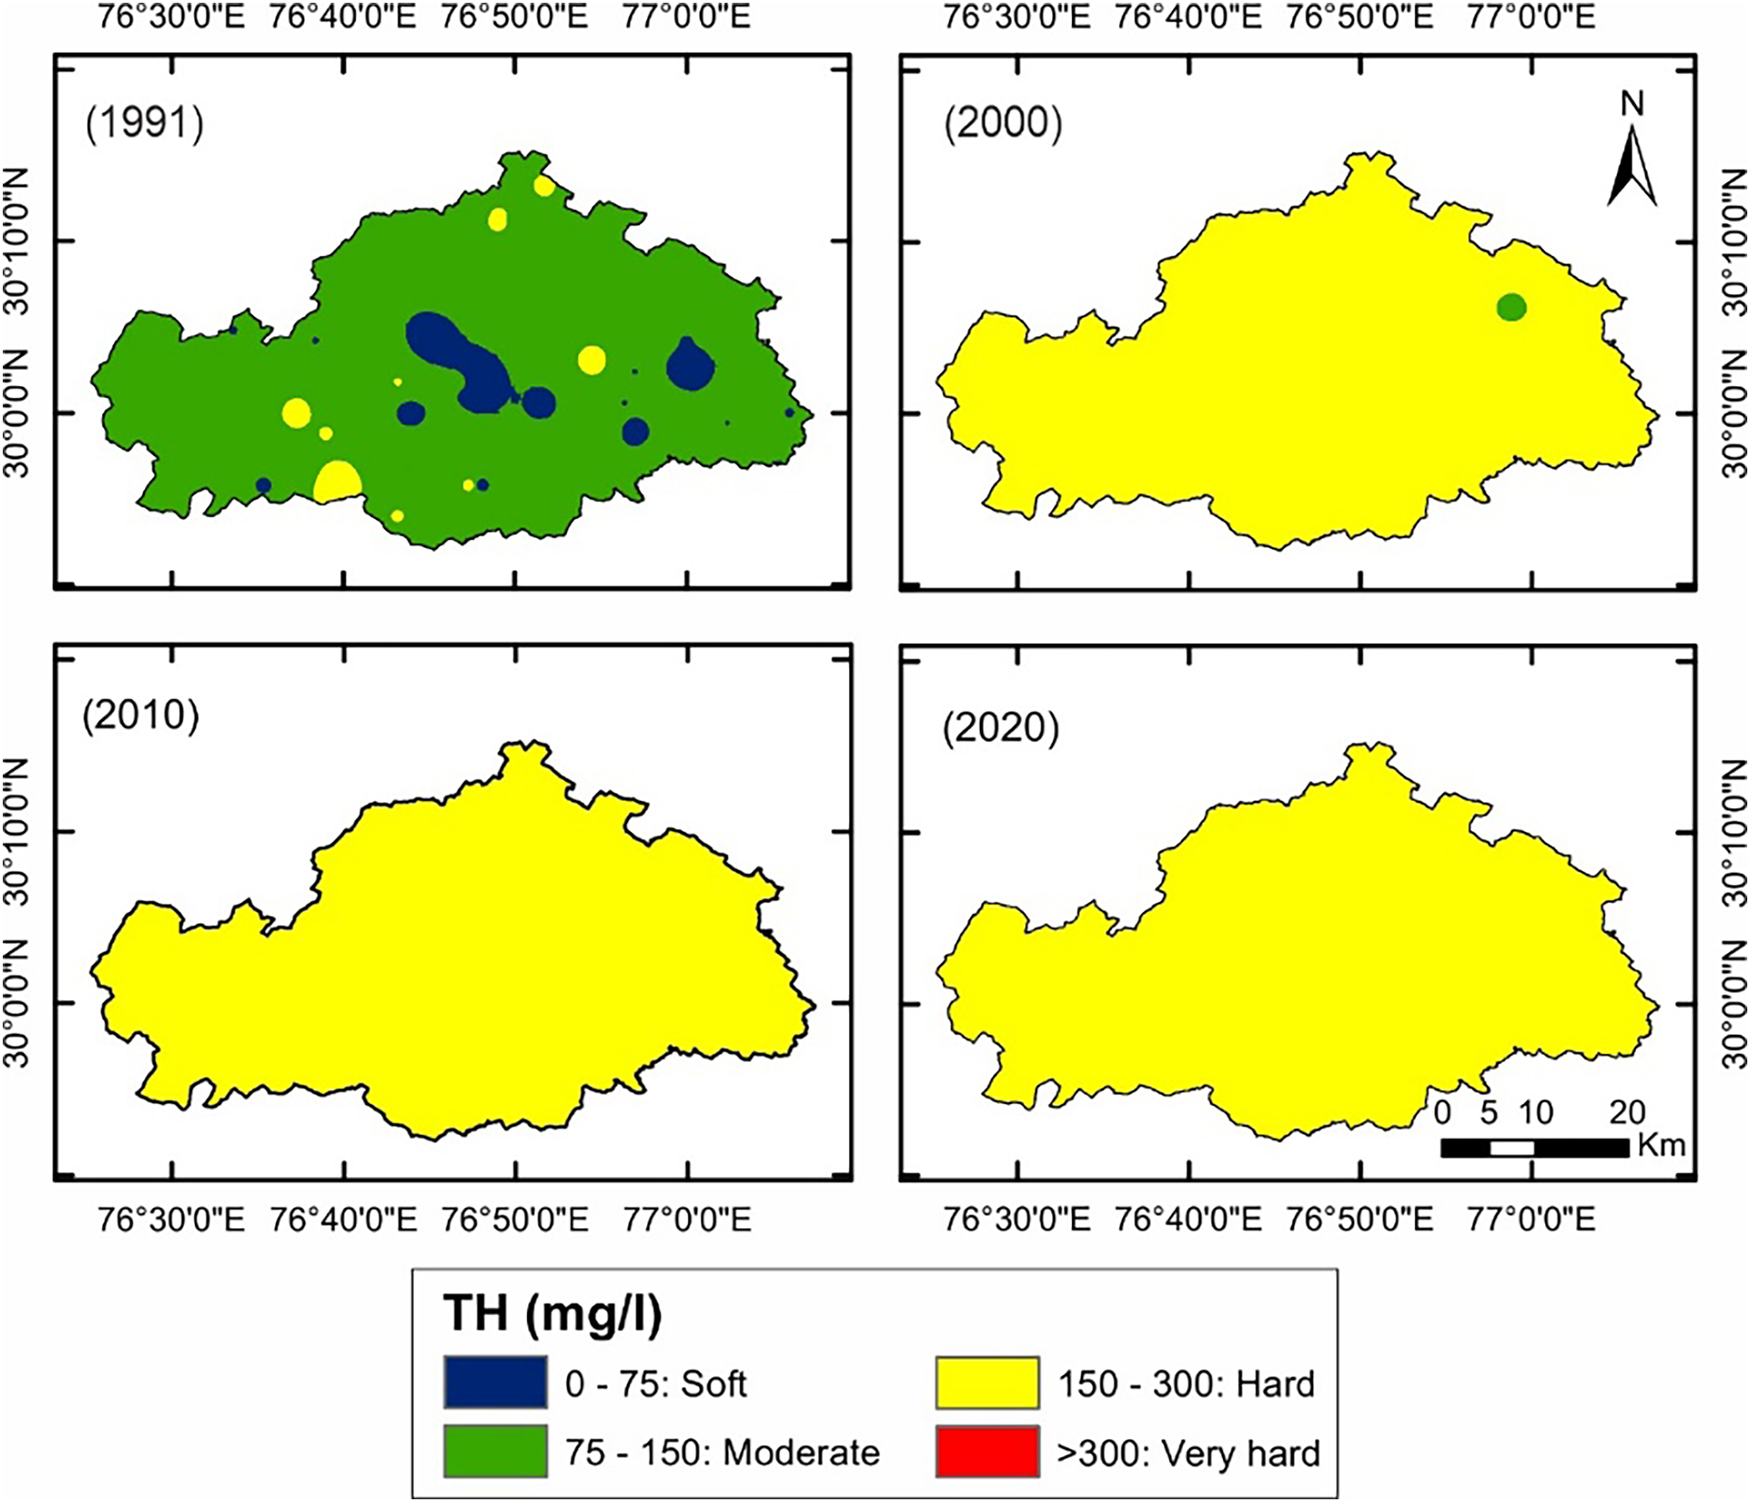
Figure 5: Spatio-temporal distribution of TH from 1991 to 2020.
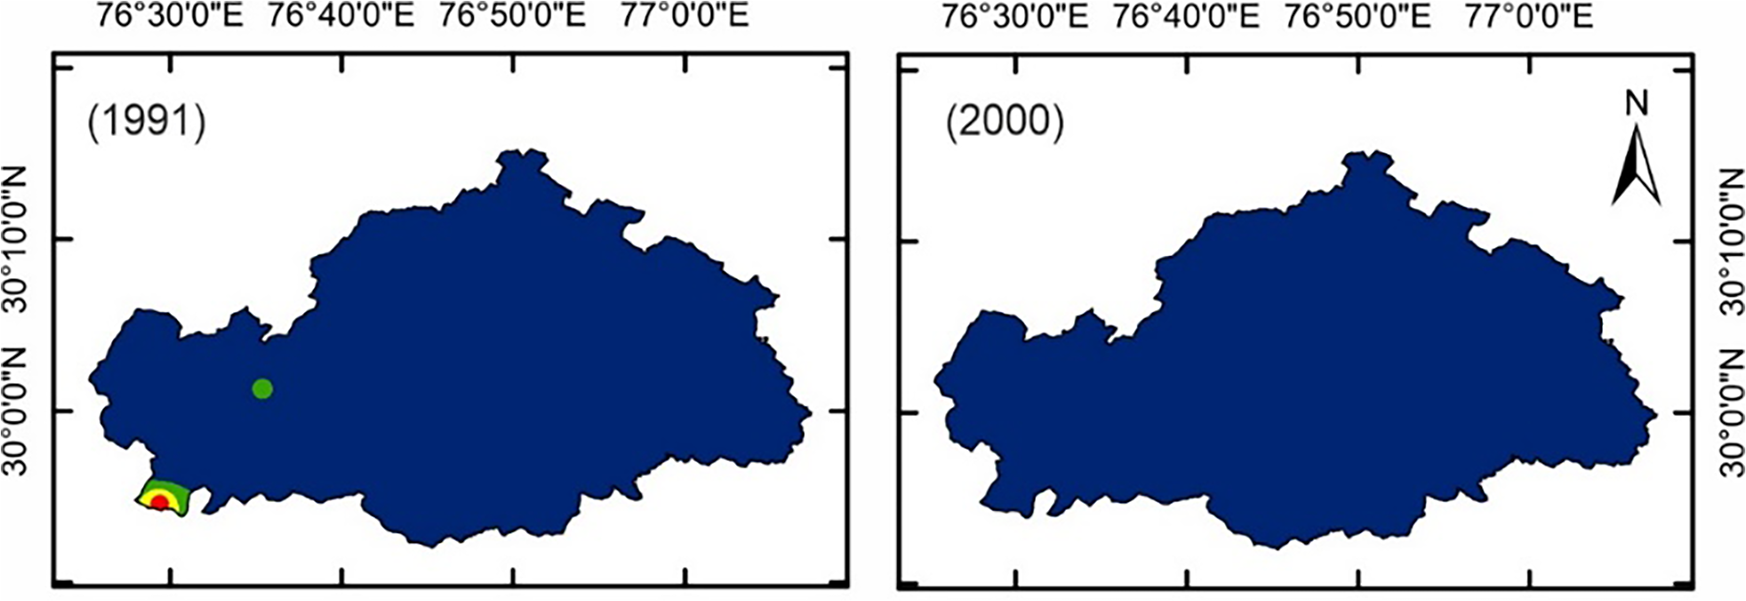
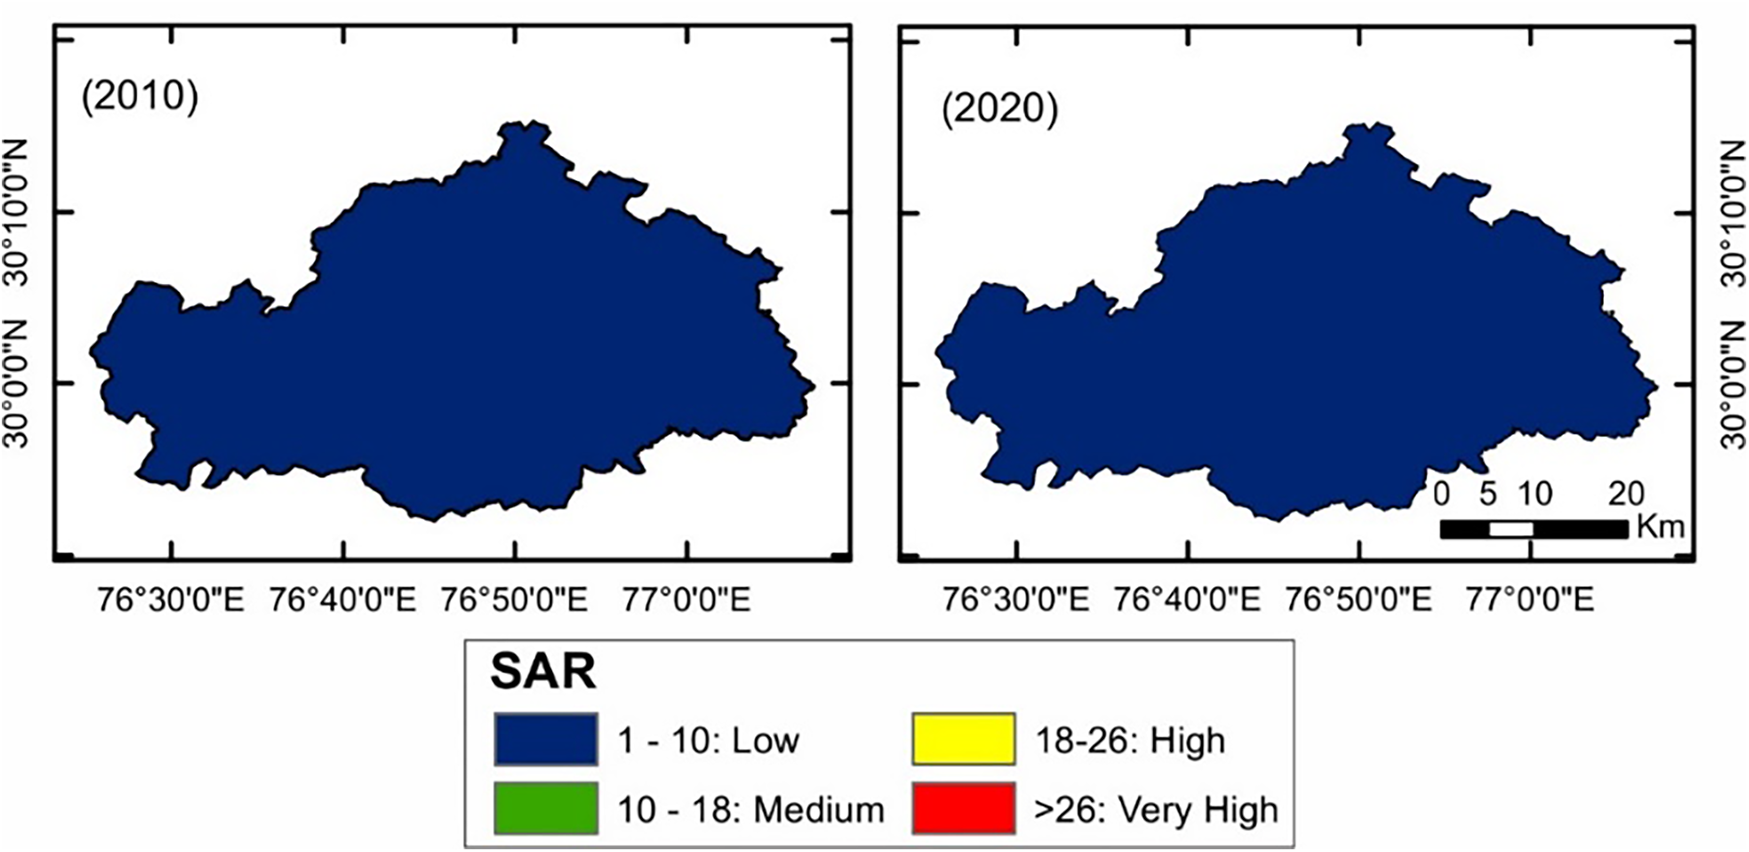
Figure 6: Spatio-temporal variation in SAR from 1991 to 2020.
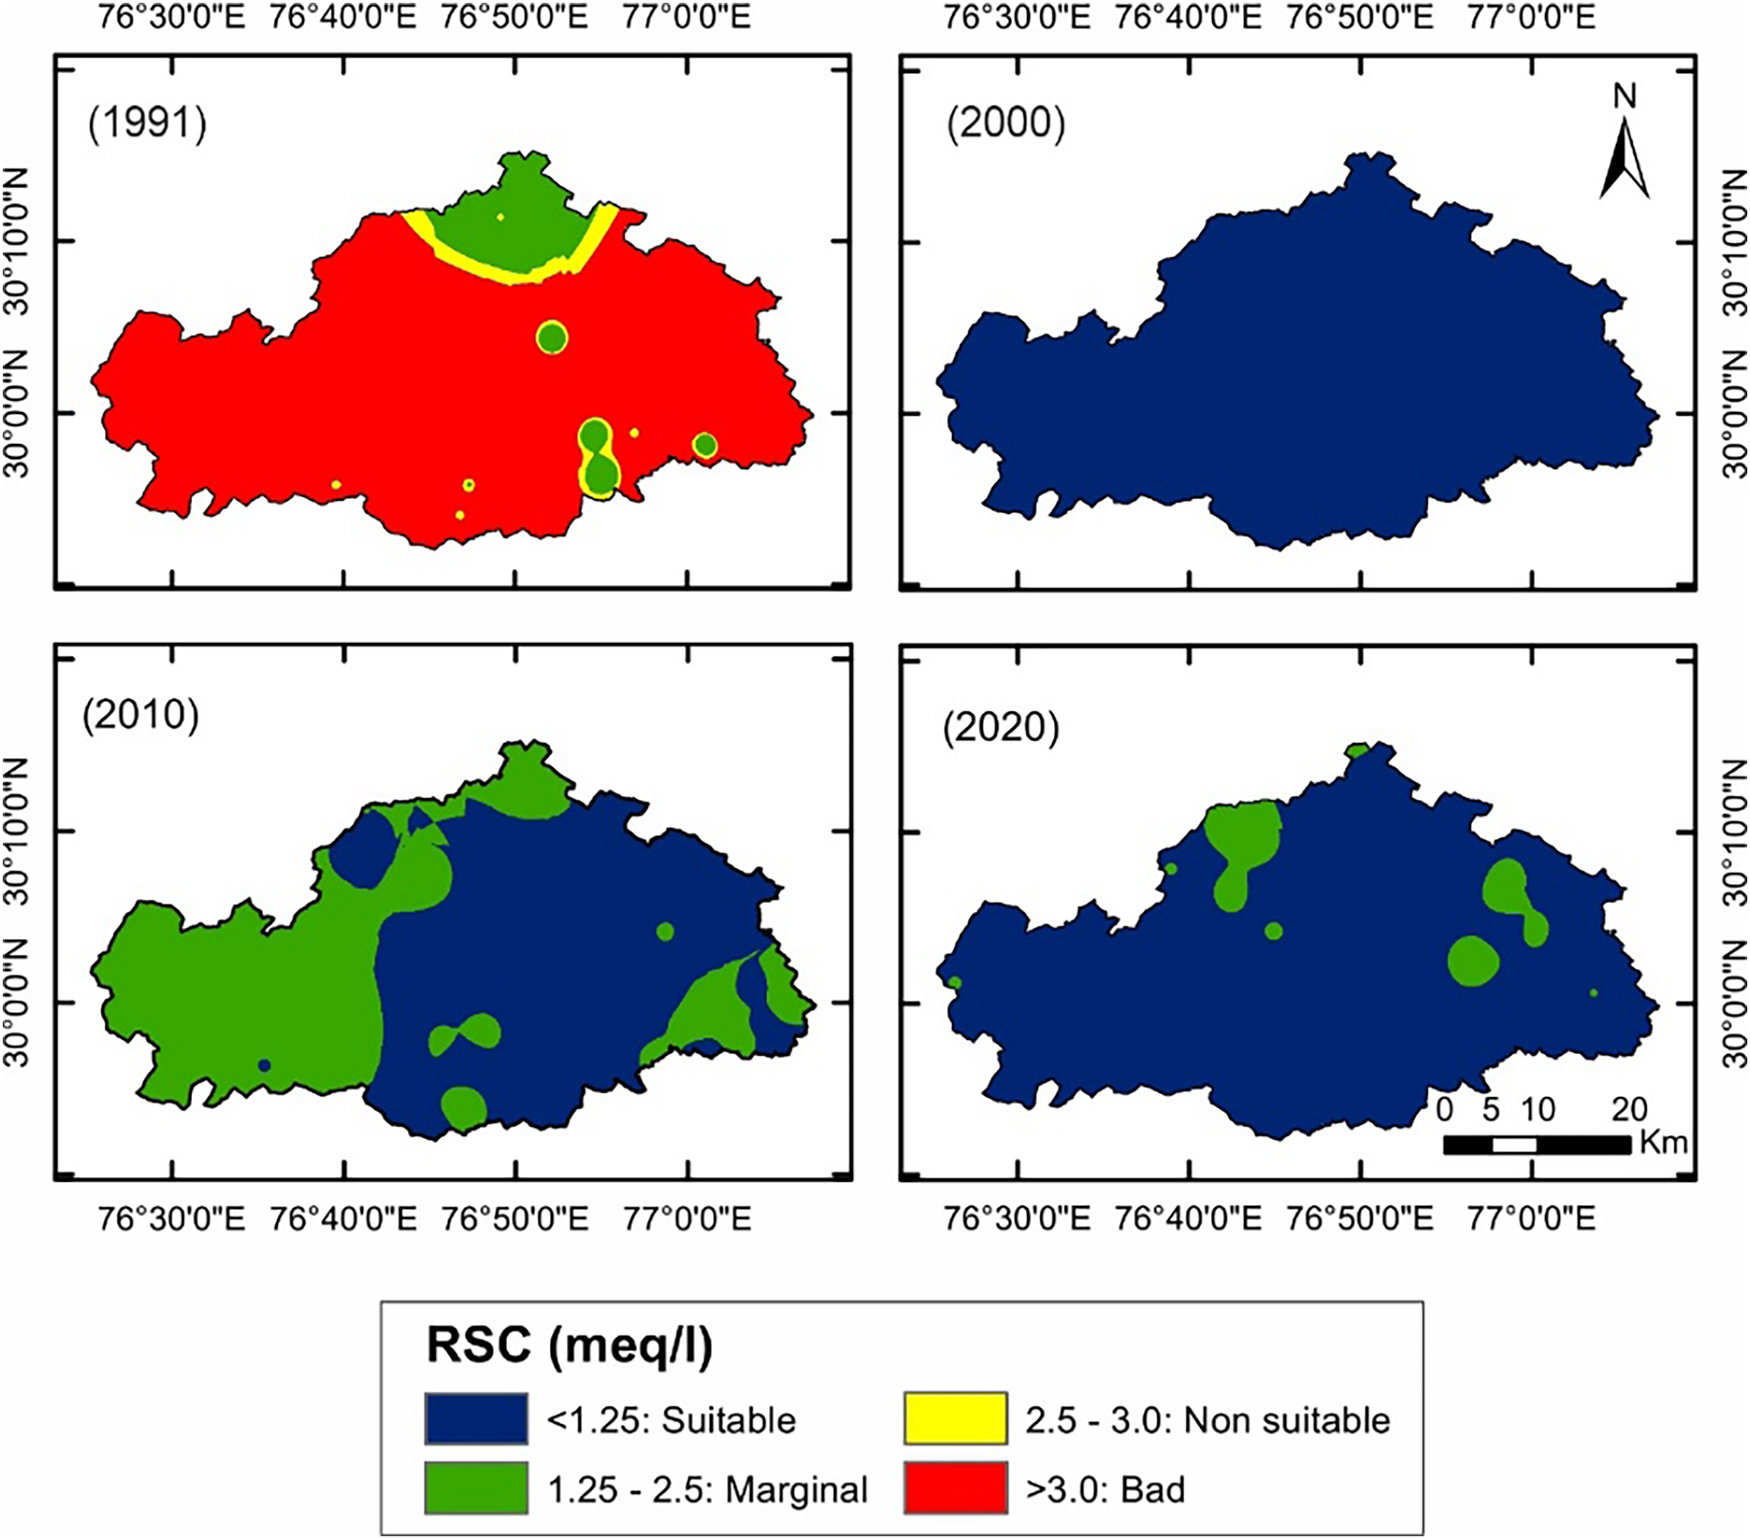
Figure 7: Spatio-temporal distribution map of RSC from 1991 to 2020.
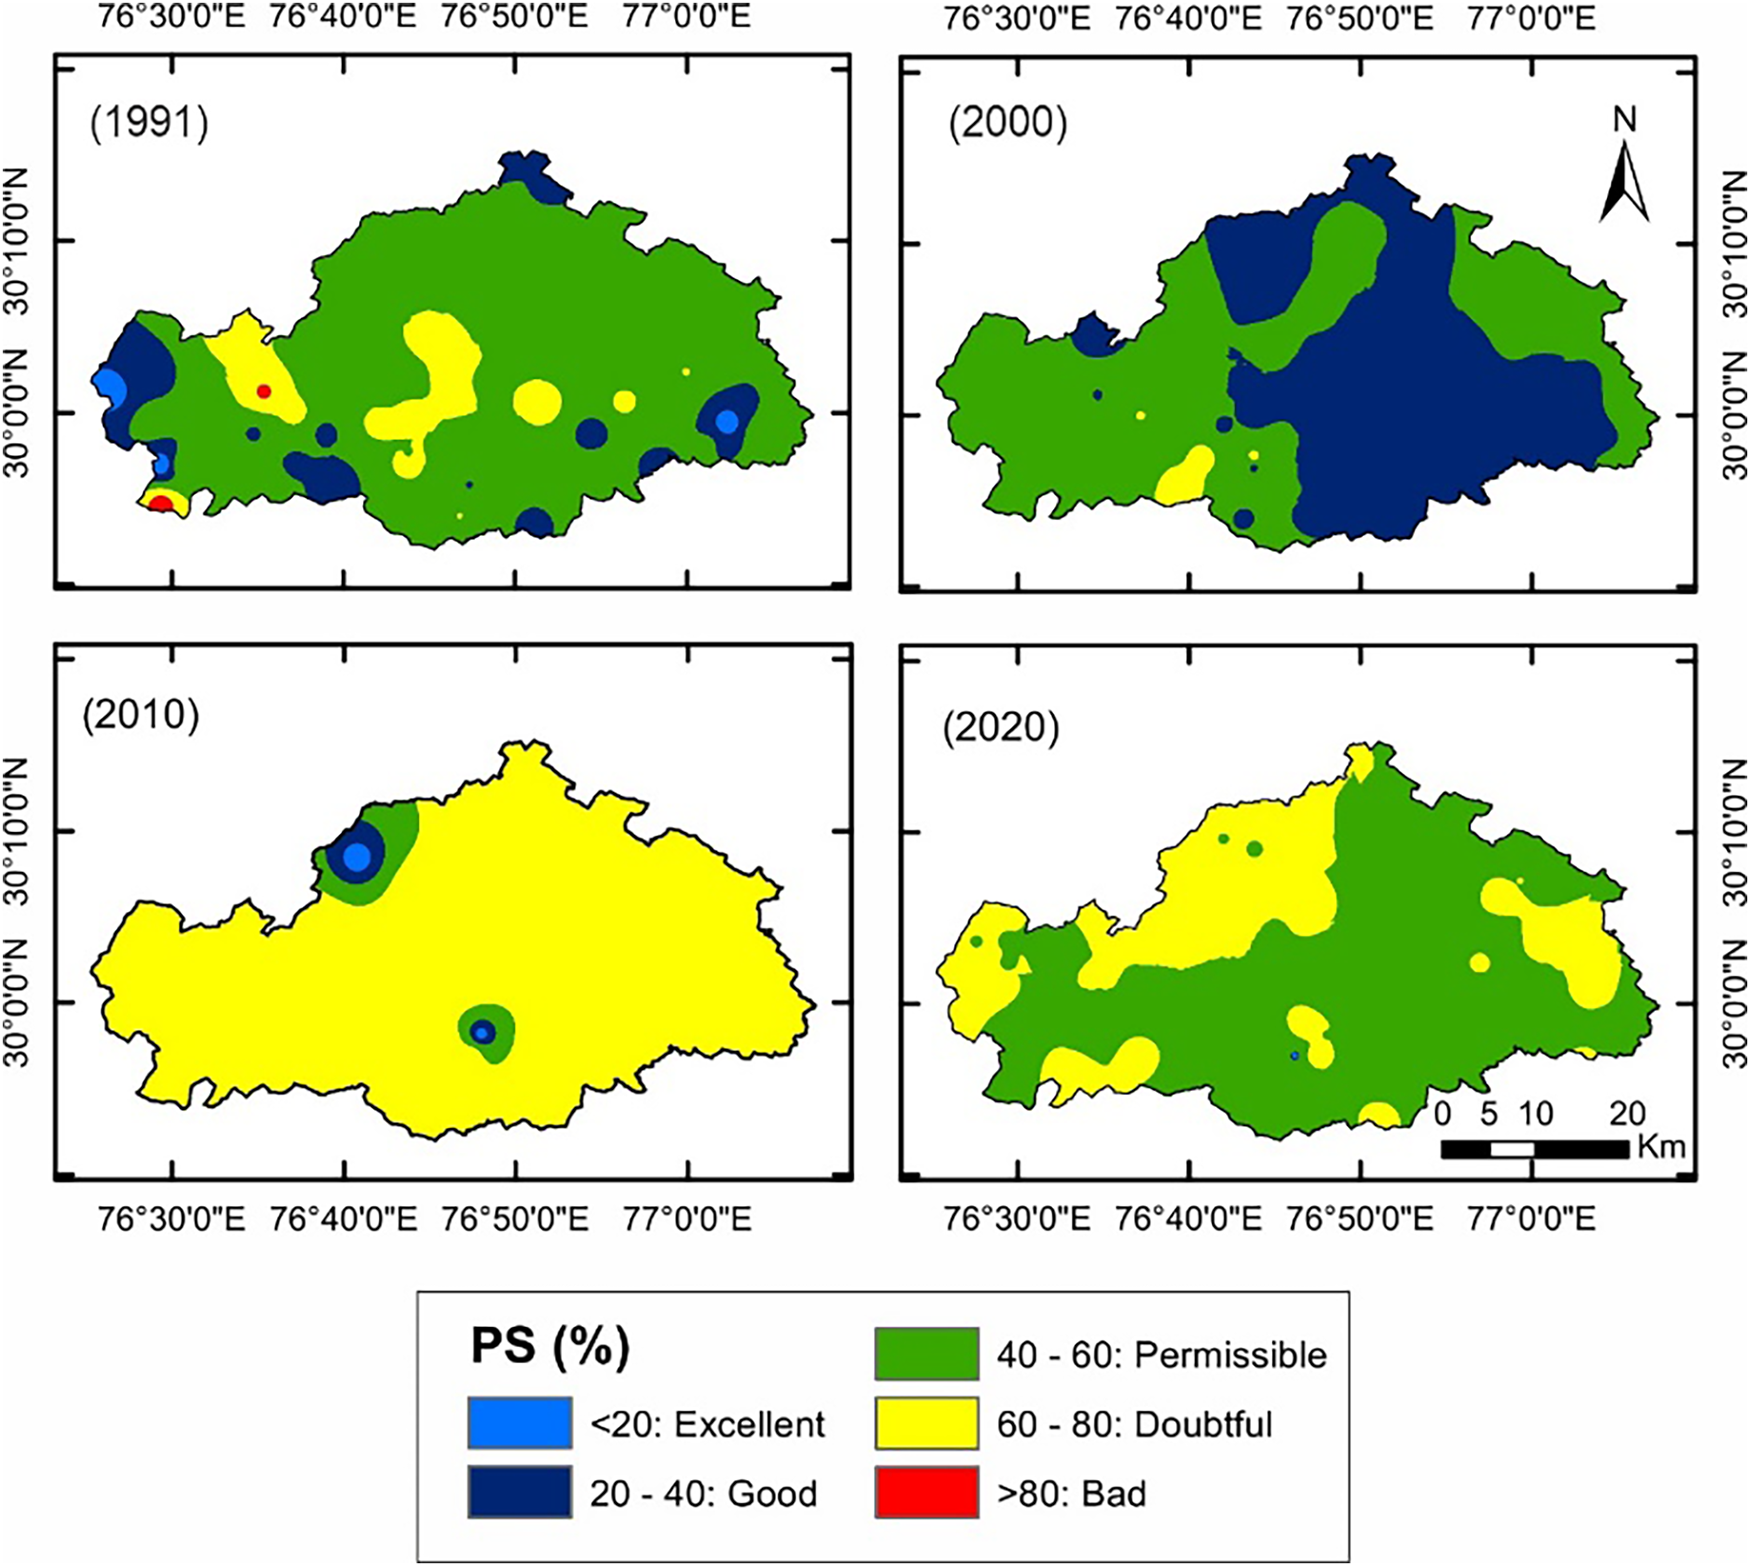
Figure 8: Spatio-temporal distribution of Percent Sodium from 1991 to 2020.
4.1.1 Potential of Hydrogen Ion (pH)
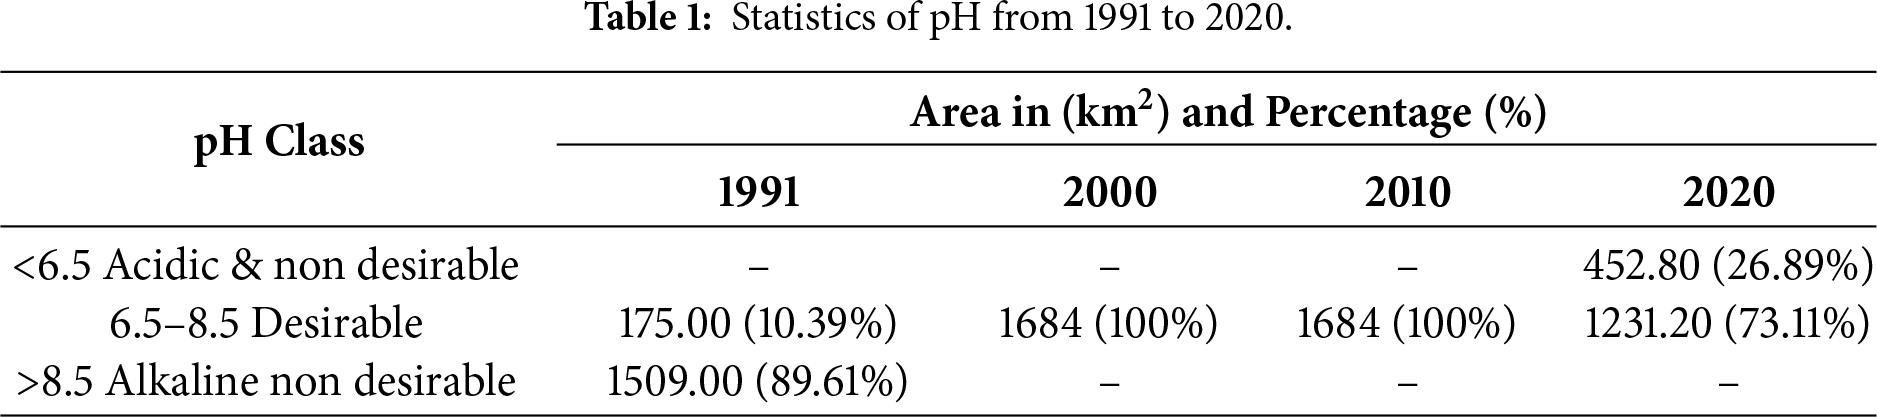
The pH scale quantifies the acidity and alkalinity of an aqueous solution and is a fundamental parameter in fields such as chemistry, biology, and environmental science, influencing numerous chemical reactions and biological processes. In environmental monitoring, pH serves as a pivotal indicator of water quality, impacting the solubility and bioavailability of various chemical constituents, including nutrients and heavy metals. In agricultural contexts, the pH of both soil and irrigation water directly affects nutrient availability to plants and the activity of soil microorganisms. Furthermore, maintaining optimal pH levels in domestic water supplies is essential not only for ensuring water safety for human consumption but also for mitigating the risk of plumbing system corrosion. Spatio-temporal variation in pH is shown in Fig. 2. In 1991, it was observed that over 1509.00 km2 (89.61% of the area) had pH values greater than 8.5, indicating that the groundwater quality across the entire district was alkaline, i.e., under a non-desirable class. Analysis of the spatial distribution maps for the years 2000 and 2010 indicates a trend toward improved groundwater quality in the district, as reflected in pH values ranging from 6.5 to 8.5. These values fall within the desirable class for drinking water, suggesting a shift toward slightly alkaline. In 2020, a substantial portion of the district, approximately 1231.20 km2 (73.11%), maintained pH values between 6.5 and 8.5, though about one-fourth of the area, i.e., 452.80 km2 (26.89%), had pH values below 6.5, indicating acidic, non-desirable groundwater quality, and the statistics are shown in Table 1.
4.1.2 Electrical Conductance (EC)
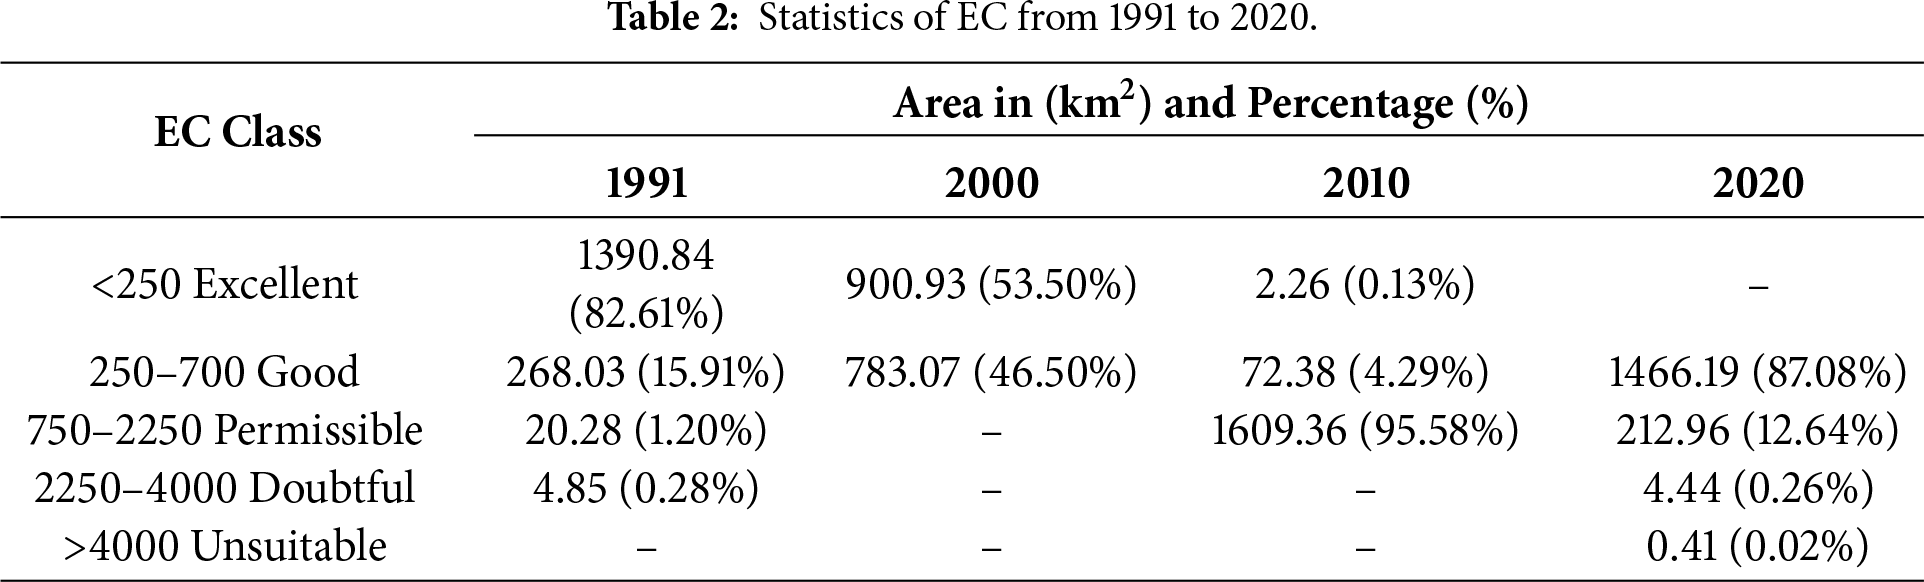
Electrical Conductance, also known as conductivity, is an essential parameter for assessing groundwater quality. It quantifies the ability of water to conduct electrical current, which is influenced by the concentration of dissolved ions, such as salts, minerals, and other inorganic compounds. EC serves as a key indicator of groundwater suitability for various applications, aids in the detection of contamination, and enhances the understanding of hydrogeological processes. Consistent monitoring and management of EC are crucial for maintaining the sustainability and safety of groundwater resources. Spatio-temporal variation of EC from 1991 to 2020 is shown in Fig. 3. In 1991, the EC values ranged from less than 250 μS/cm to a maximum of 4000 μS/cm in the district. A major part of the district covering an area of 1390.84 km2 (82.61%) was found in the excellent class, 268.03 km2 (15.91%) in good class, 20.28 km2 (1.20%) under permissible class, whereas only 4.85 km2 (0.28%) in doubtful class. In the year 2000, groundwater quality showed notable improvement, with EC values ranging from less than 250 to 750 μS/cm. The western region of the district, covering approximately 900.93 km2 (53.50%), was found in good class, with EC values ranging from 250 to 750 μS/cm. The central region, characterized by EC values less than 250 μS/cm, encompassed around 783.07 km2 (46.50%) and was found in excellent class. In 2010, it was observed that the quality of groundwater had deteriorated, as evidenced by EC values ranging from 750 to 2250 μS/cm. This marks a discernible increase in EC values when compared to data from 1991 and 2000, indicating a concerning trend in the deterioration of groundwater quality over the intervening years. In 2010, most part of the district, covering an area of 1609.36 km2 (95.58%), was found in the permissible class, though some patches remained in the good and excellent classes. The change in EC values over this interval (2000–2010) clearly indicated a trend of groundwater quality deterioration. A reverse trend was observed in EC values from 2010 to 2020, as almost the entire district area of 1466.19 km2 (87.08%) was found in the good class. However, a small portion in the southern part of the district, covering an area of 212.96 km2 (12.64%), was found in the permissible class. A very small portion of the district was found under the doubtful to unsuitable class. The detailed statistics are shown in Table 2.
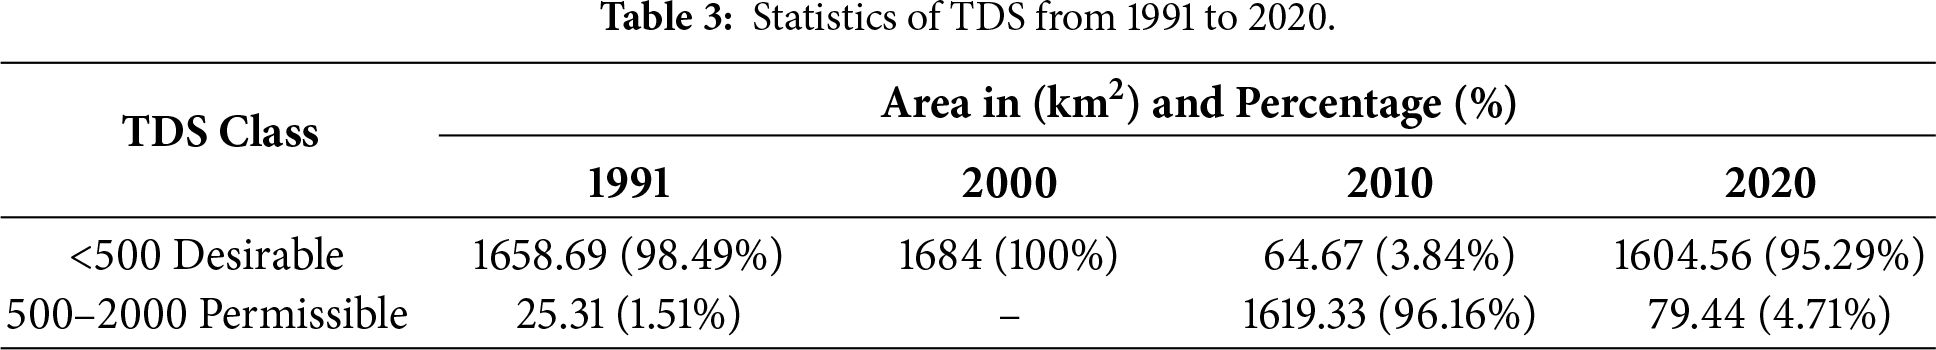
4.1.3 Total Dissolved Solids (TDS)
TDS constitutes a fundamental indicator in the evaluation of groundwater quality, representing the aggregate concentration of both inorganic and organic constituents dissolved in water-comprising minerals, salts, trace metals, and diverse chemical compounds. These dissolved constituents may derive from both natural geochemical processes and anthropogenic influences, including agricultural runoff, industrial effluents, and domestic wastewater discharge. Elevated concentrations of TDS are often symptomatic of deteriorating water quality and may pose significant health risks, especially when contaminants such as nitrates or fluoride surpass permissible thresholds. Moreover, high TDS levels can lead to soil salinization, thereby impairing agricultural productivity by inhibiting plant development and diminishing crop yields. The continuous monitoring of TDS is essential for the effective management of groundwater quality, particularly in areas susceptible to contamination from both natural and anthropogenic sources. The spatiotemporal variation in TDS across the district for the period 1991 to 2020 is shown in Fig. 4. In 1991, TDS concentrations were predominantly below 500 mg/L, indicating groundwater quality in the permissible class, with approximately 1658.69 km2 (98.49%) of the district classified within the desirable class. However, isolated areas in the eastern part of the district recorded TDS levels between 500 and 2000 mg/L. In the year 2000, groundwater quality had improved further, with TDS values across the entire district were observed below 500 mg/L exhibiting a desirable class. In 2010, TDS values remained below 2000 mg/L throughout the district. An area of 1619.33 km2 (96.16%) fell within the permissible class, while 64.67 km2 (3.84%) retained the desirable class. These values indicate a gradual transition of groundwater quality from fresh to slightly brackish conditions. In 2020, TDS concentrations ranged between less than 500 and 2000 mg/L. There was a remarkable change in TDS values from 2010 to 2020, as in 2020, the dominant portion of the district covering an area of 1604.56 km2 (95.29%) was found in the desirable class, whereas only a very small portion of the district in the eastern and north-east part was observed with the permissible class. The detailed statistics are shown in Table 3.
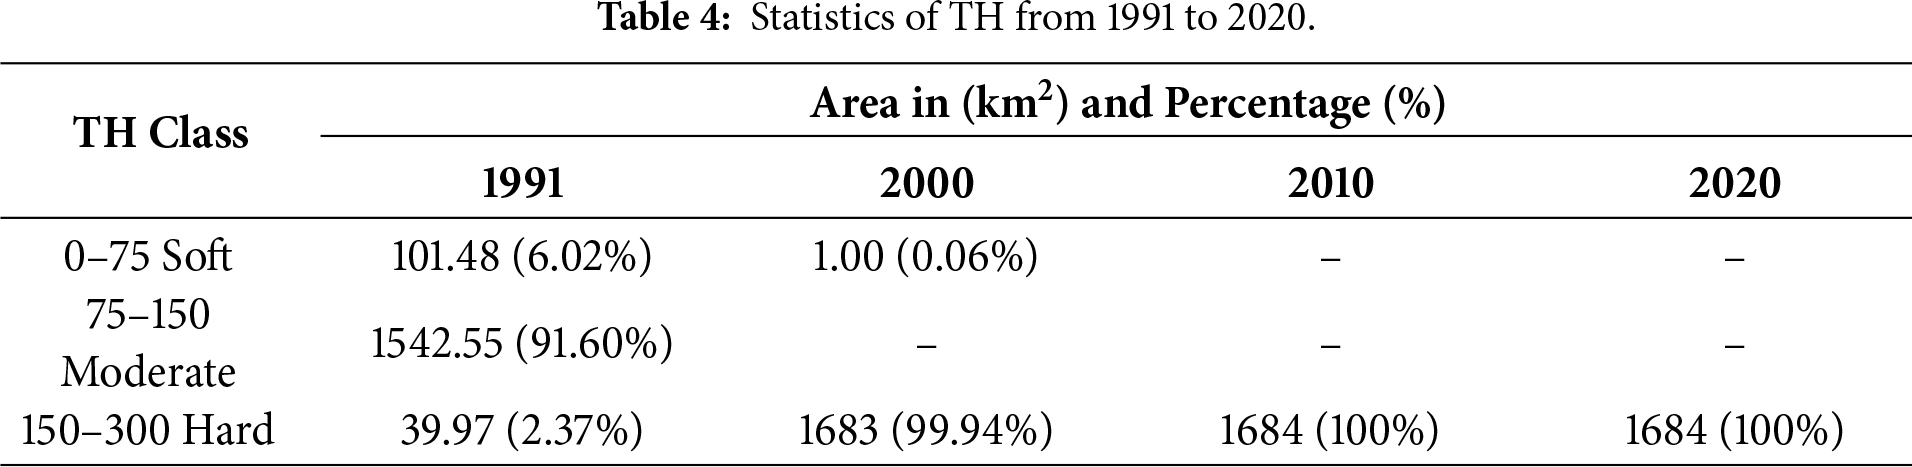
The TH in groundwater refers to the concentration of divalent metal ions, predominantly calcium (
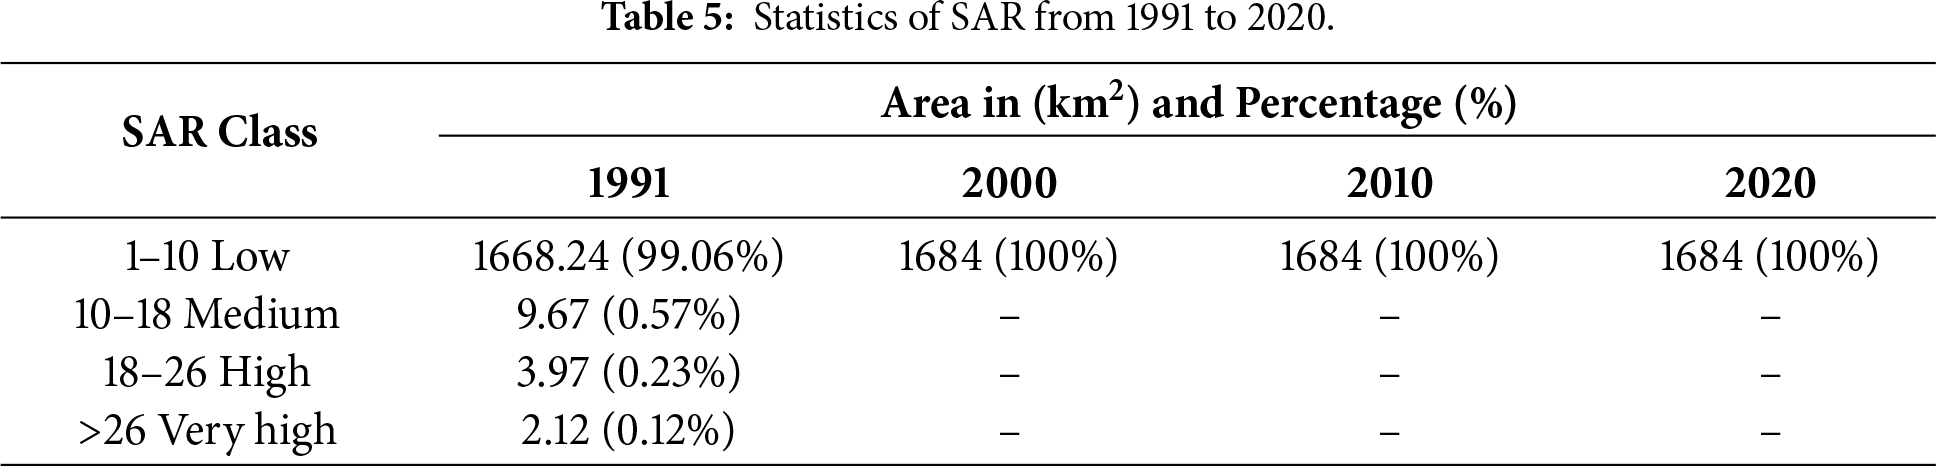
4.1.5 Sodium Adsorption Ratio (SAR)
The SAR serves as a vital parameter for assessing groundwater quality, particularly in relation to its suitability for irrigation. SAR measures the proportion of sodium ions relative to calcium and magnesium ions in water, providing insight into the potential for sodium-induced degradation of soil structure. The elevated SAR levels can lead to soil dispersion, reduced permeability, and diminished water infiltration and aeration, thereby adversely affecting plant growth and agricultural productivity. The Fig. 6 illustrates the spatiotemporal distribution of SAR across the district from 1991 to 2020. In 1991, a substantial portion of the district, approximately 1668.24 km2 (99.06%), exhibited SAR values between 1 and 10, corresponding to the low hazard class, which is considered safe for irrigation. However, approximately 0.94% of the area recorded SAR values between 10 and 26, falling within the medium to very high classes, suggesting localized zones of potential concern. In the years from 2000 to 2020, the entire district consistently displayed SAR values within the low class, indicating that groundwater quality during this period remained suitable for agricultural use. This sustained trend reflects a stable and favorable SAR profile for irrigation purposes in the Kurukshetra district. The detailed statistics are shown in Table 5.
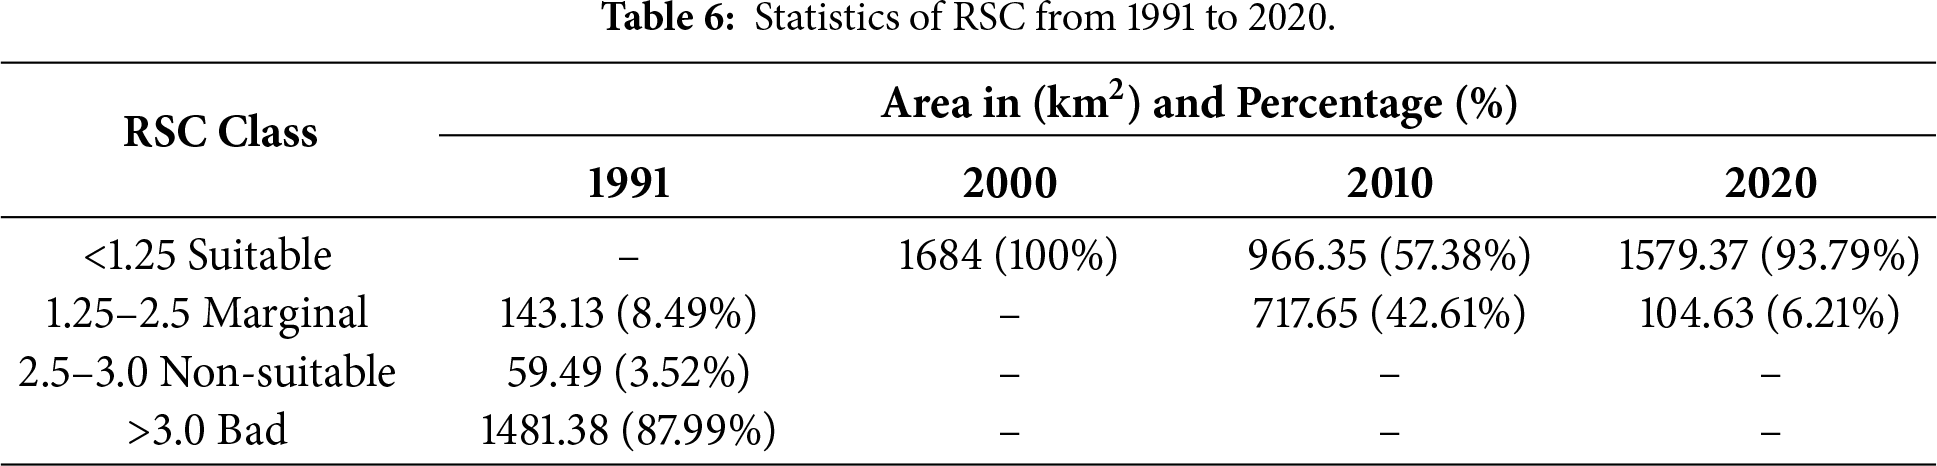
4.1.6 Residual Sodium Carbonate (RSC)
The RSC serves as a critical parameter for assessing the potential impact of carbonate and bicarbonate ions on soil integrity and agricultural viability. It measures the surplus of carbonate (
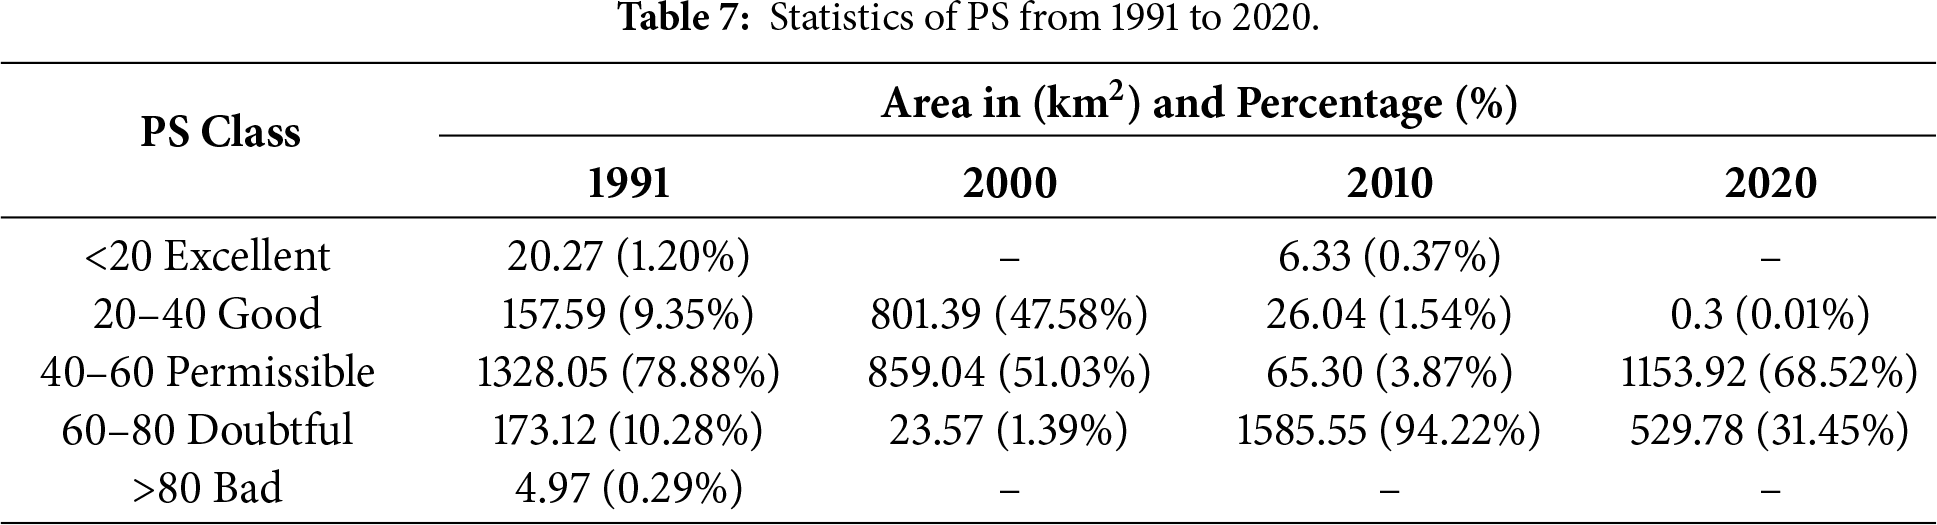
4.1.7 Percent Sodium (PS or %Na)
The PS is a vital hydrochemical parameter for evaluating the suitability of groundwater for both agricultural and domestic applications. It reflects the relative concentration of sodium (
4.2.1 Assessment of Groundwater Quality for Domestic Use
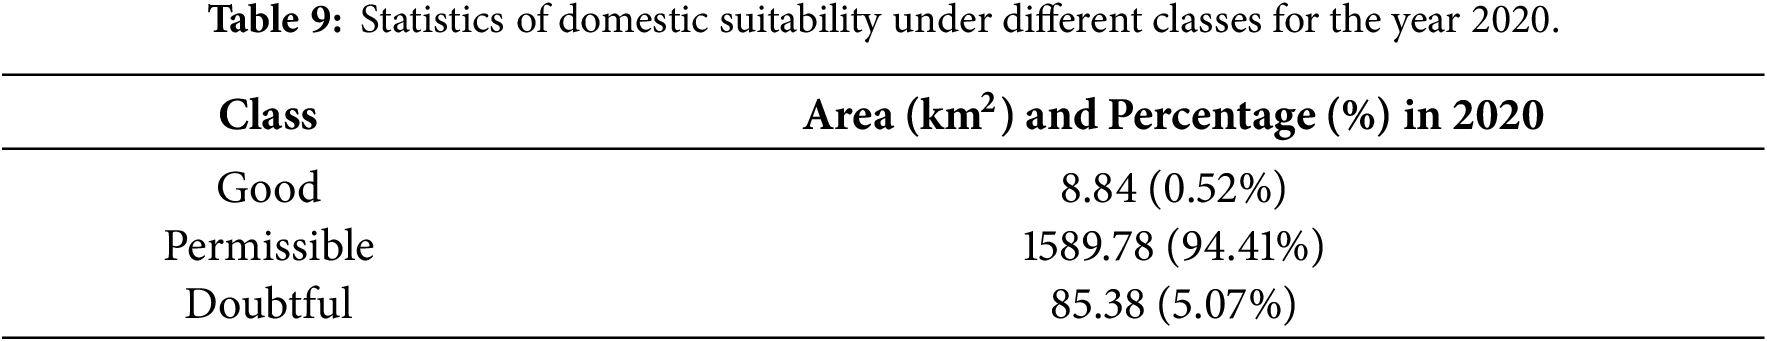
The suitability analysis of groundwater for domestic use has been evaluated as per the guidelines set by BIS and WHO for drinking water quality. The evaluation of groundwater quality involves examining a range of physical, chemical, and biological parameters, including pH, TDS, and TH, to determine its appropriateness for household use. The geochemical composition of aquifer materials, determined by the mineralogical characteristics of rocks and soils, along with the intensity of weathering processes, plays a fundamental role in influencing the chemical profile of groundwater. In addition to natural geogenic factors, anthropogenic activities significantly contribute to groundwater contamination. The excessive application of agrochemicals, improper disposal of solid and liquid wastes, unregulated industrial effluents, and rapid urban expansion collectively exacerbate groundwater pollution. These activities lead to elevated concentrations of hazardous substances, including heavy metals and other toxicants, thereby posing substantial risks to human health and environmental sustainability. The spatial distribution map for domestic water suitability is generated using groundwater quality parameters such as pH, TDS, and TH only, as the biological parameters have not been considered here due to paucity of analysis facilities. A weighted overlay analysis was employed, assigning relative importance to each parameter as pH (30%), TDS (40%), and TH (30%), based on their influence on water quality and human health. These weightages were applied to generate an integrated map indicating suitability for domestic use as per BIS, and the weightage analysis is shown in Table 8. The integrated spatial distribution map for the year 2020 (Fig. 9), and the detailed statistics are shown in Table 9. This indicated that approximately 8.84 km2 (0.52%) of the district falls within the good class for groundwater suitability for domestic use. Whereas 1589.78 km2 (94.41%) is classified under the permissible class, while only 85.38 km2 (5.07%) was categorized as the doubtful class. To ensure the safe utilization of groundwater for domestic purposes, systematic monitoring and appropriate treatment interventions such as filtration, disinfection, and desalination are imperative, particularly in regions exhibiting substandard water quality. In addition, the promotion of responsible water management practices, such as minimizing excessive fertilizer application and enhancing waste disposal infrastructure, plays a vital role in the long-term protection of groundwater resources. The systematic assessment of groundwater quality for domestic usage is essential for safeguarding public health. Through continuous monitoring of critical physicochemical parameters and proactive mitigation of contamination risks, groundwater can be preserved as a safe and dependable resource for household consumption. Moreover, sustainable management and conservation strategies are imperative to ensure the resilience and quality of groundwater for future generations.
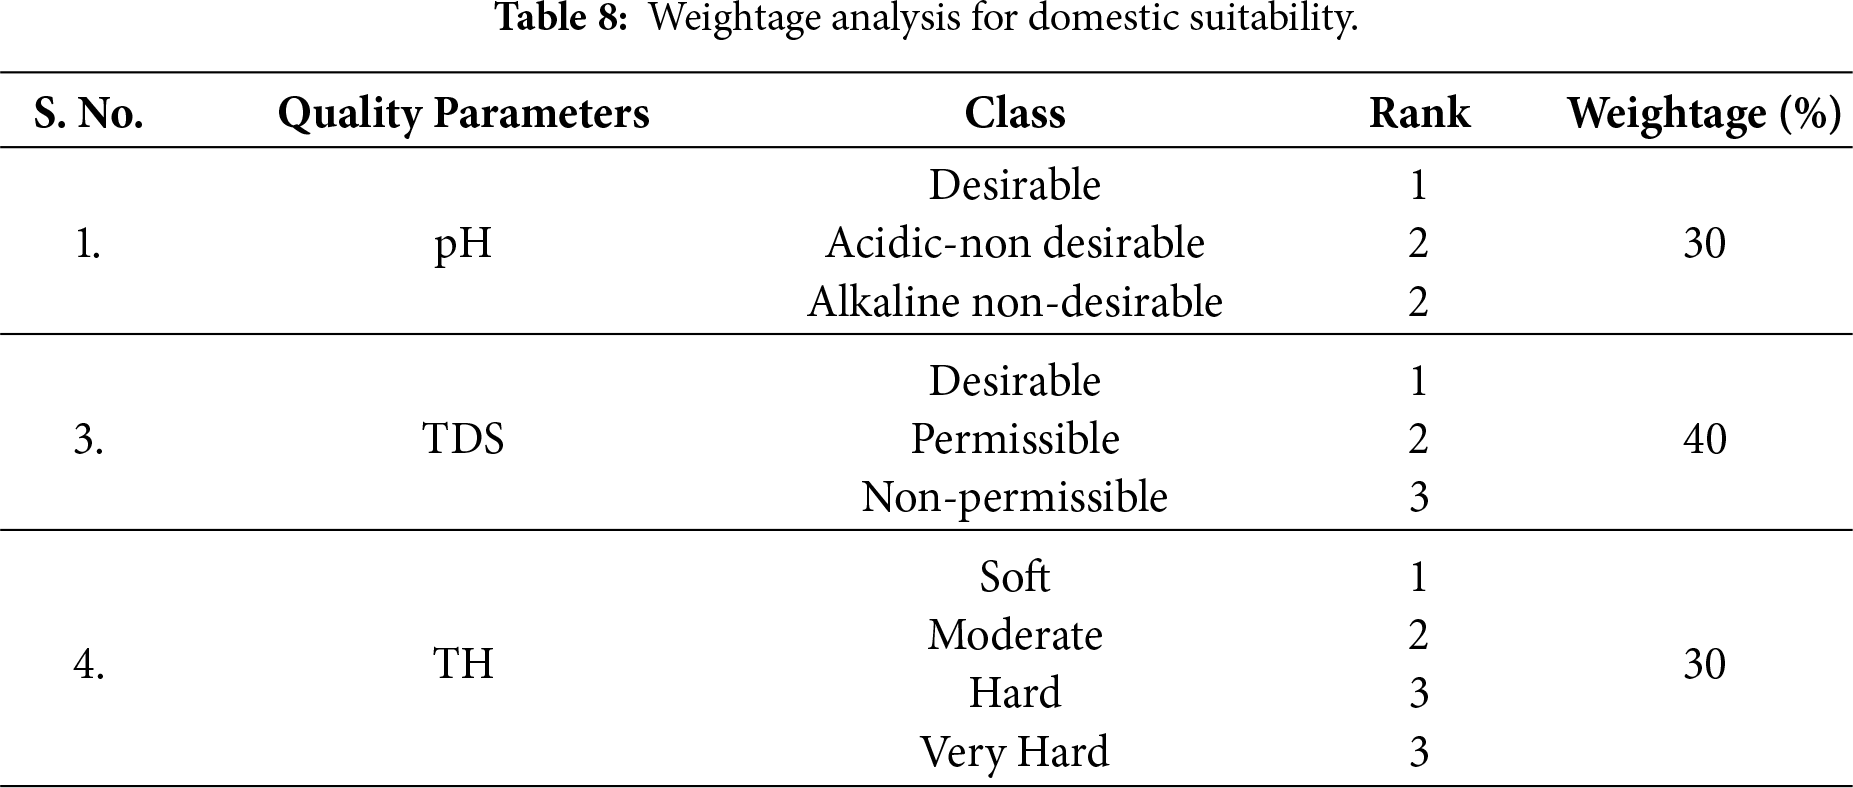
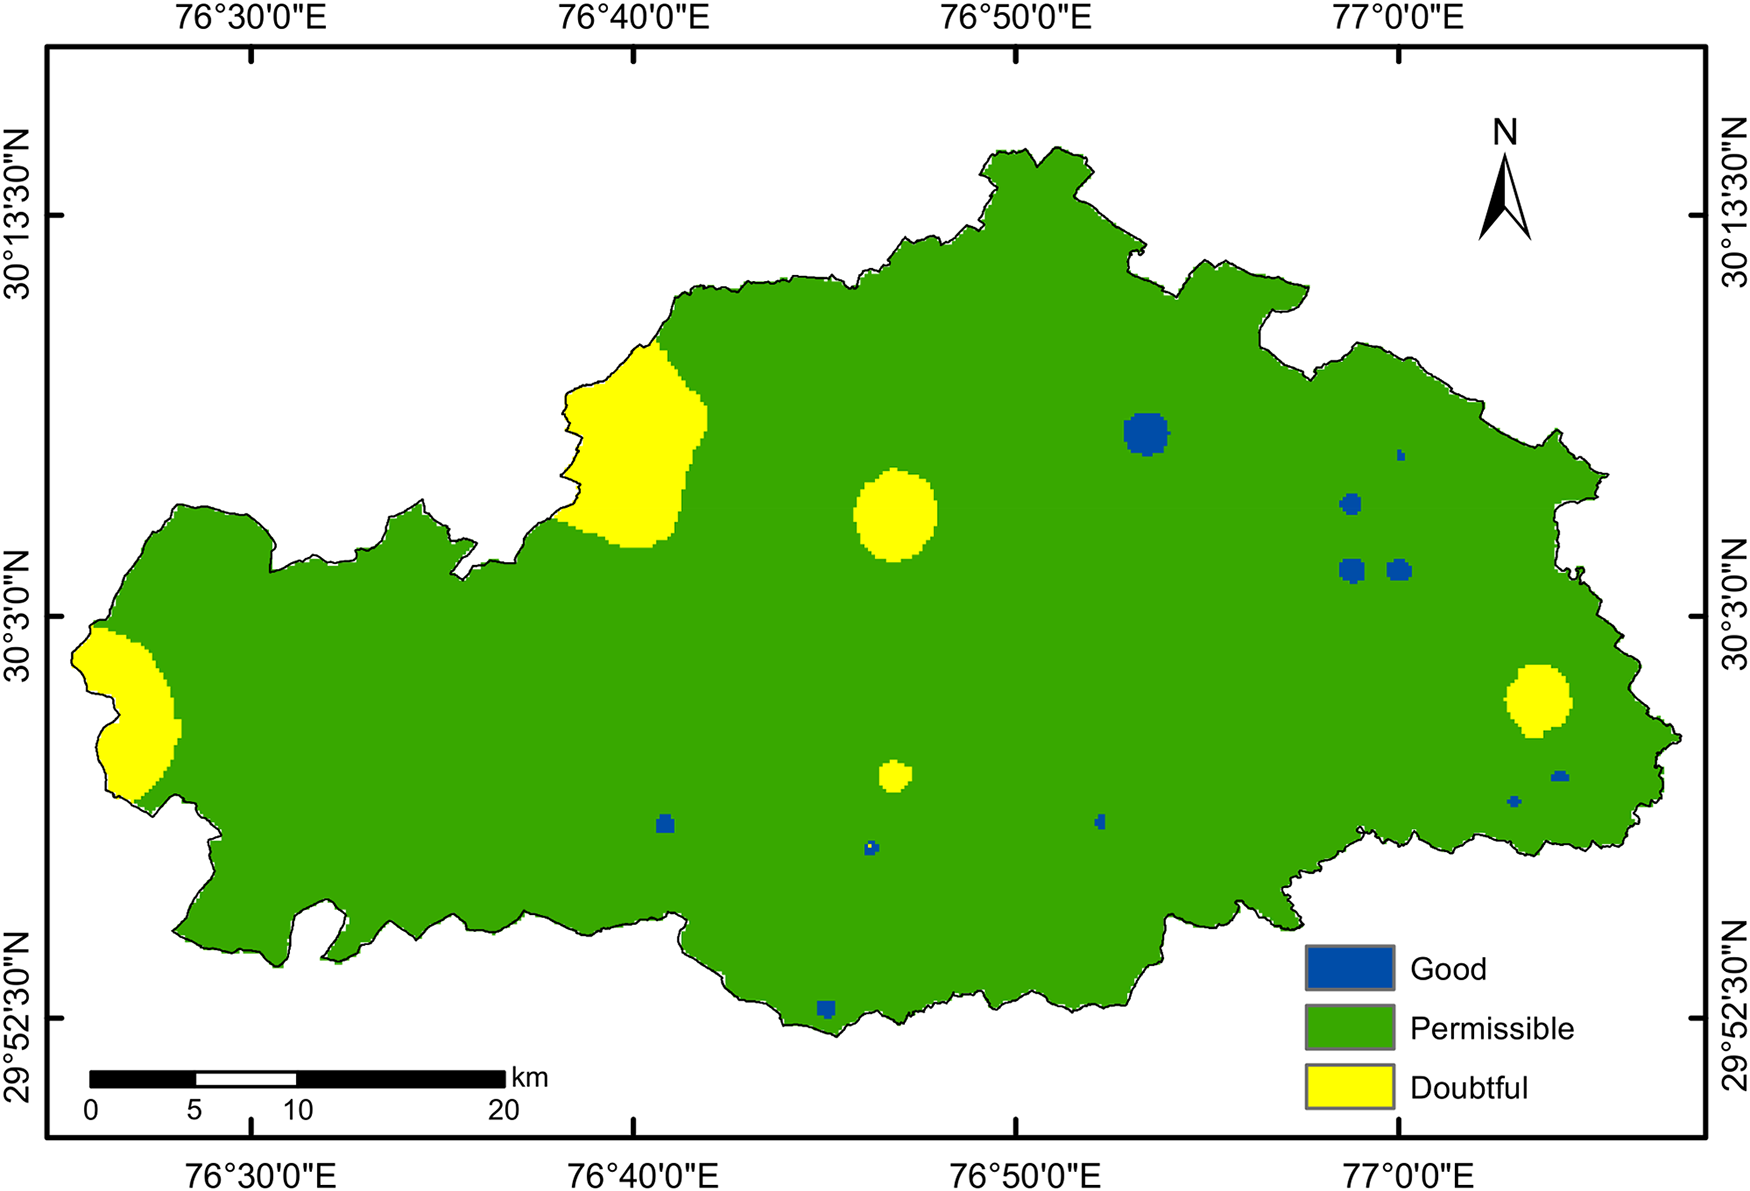
Figure 9: Integrated spatial distribution map for the domestic suitability of Kurukshetra district in 2020.
4.2.2 Assessment of Groundwater Quality for Agricultural Use
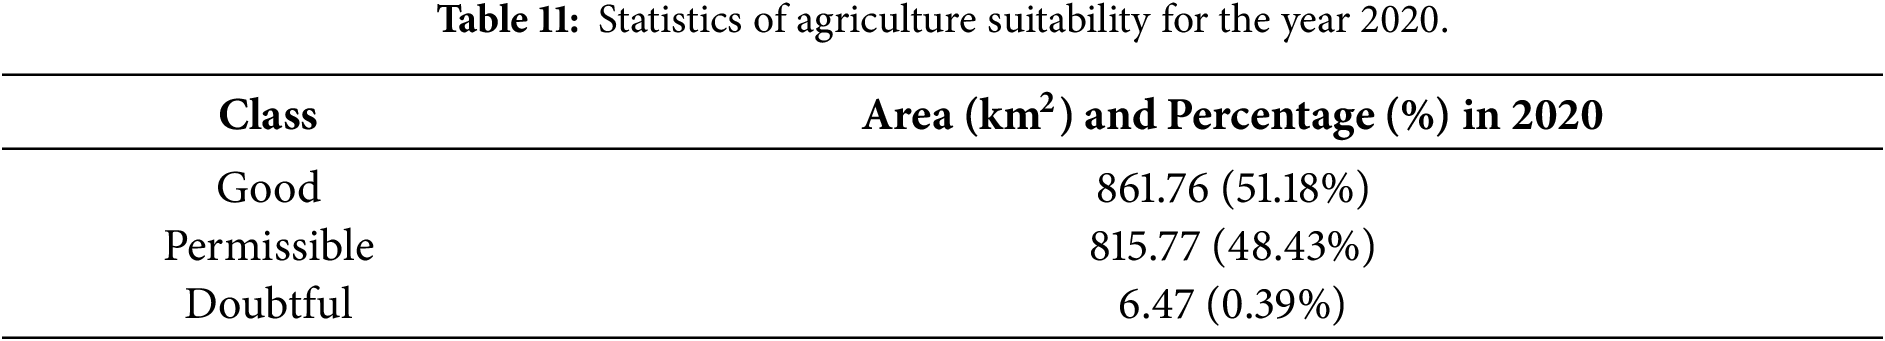
Evaluating groundwater quality is critical for determining its suitability for agricultural applications, as parameters such as salinity, sodium concentration, and the presence of dissolved minerals directly influence soil health and crop productivity. Core indicators commonly employed in such assessments include EC, SAR, PS, and RSC. These parameters are essential in evaluating the potential risks associated with irrigation-induced soil degradation, salinity accumulation, and adverse effects on plant physiology. Regular monitoring and analysis of these factors are vital to promoting sustainable agricultural practices and effective water resource management. In accordance with BIS guidelines, an integrated groundwater quality map was developed by assigning equal weightage (25%) to each parameter: EC, SAR, PS, and RSC. The rank and weightage assigned to various parameters are shown in Table 10. The spatial analysis for the year 2020, illustrated in Fig. 10, indicates that an area 861.76 km2 (51.18%) of the district is classified under the good class, an area of district 815.77 km2 (48.43%) falls within the permissible class, and remaining area of 6.47 km2 (0.39%) is categorized as doubtful class with respect to groundwater suitability for agricultural use. The detailed statistics are shown in Table 11.
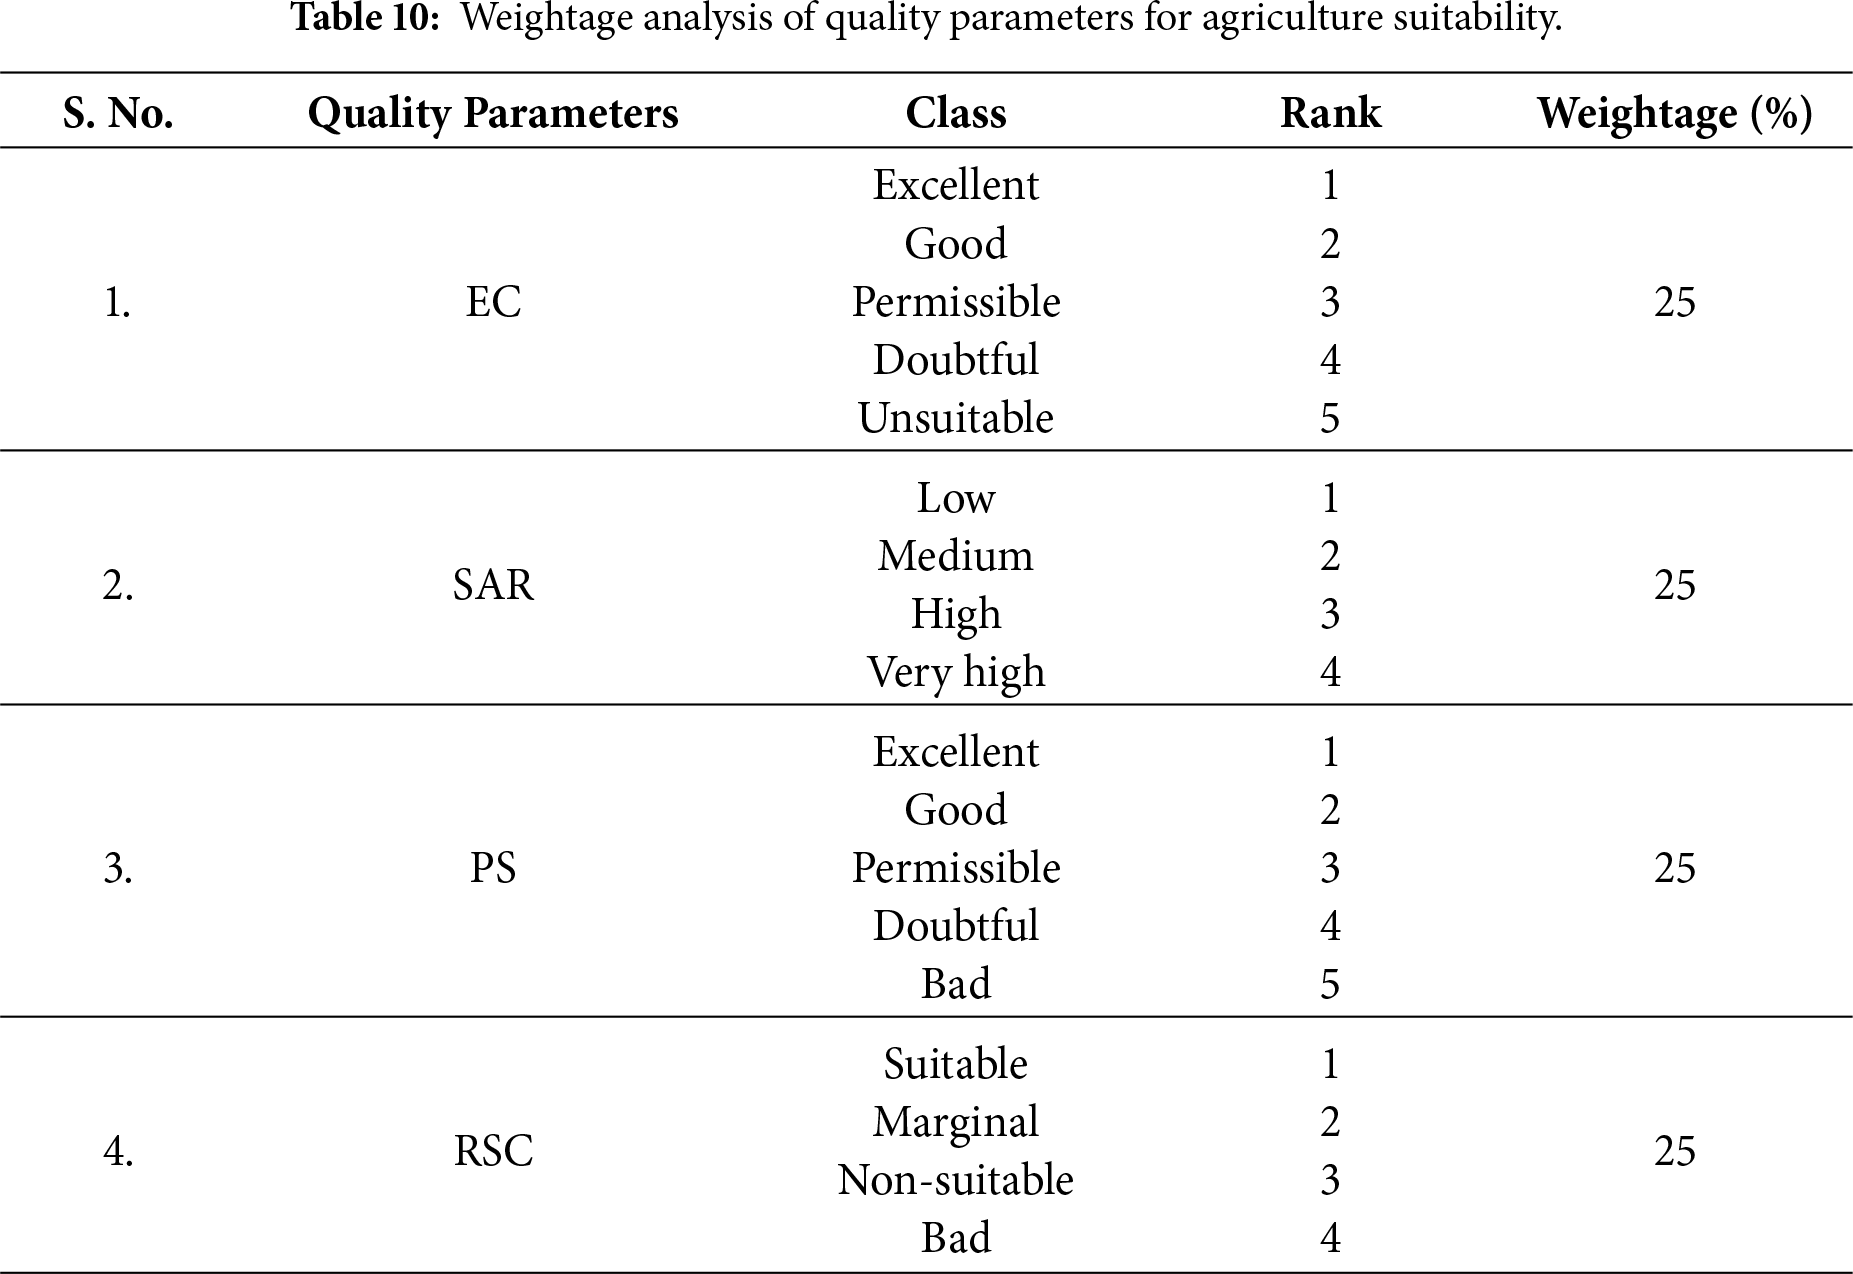
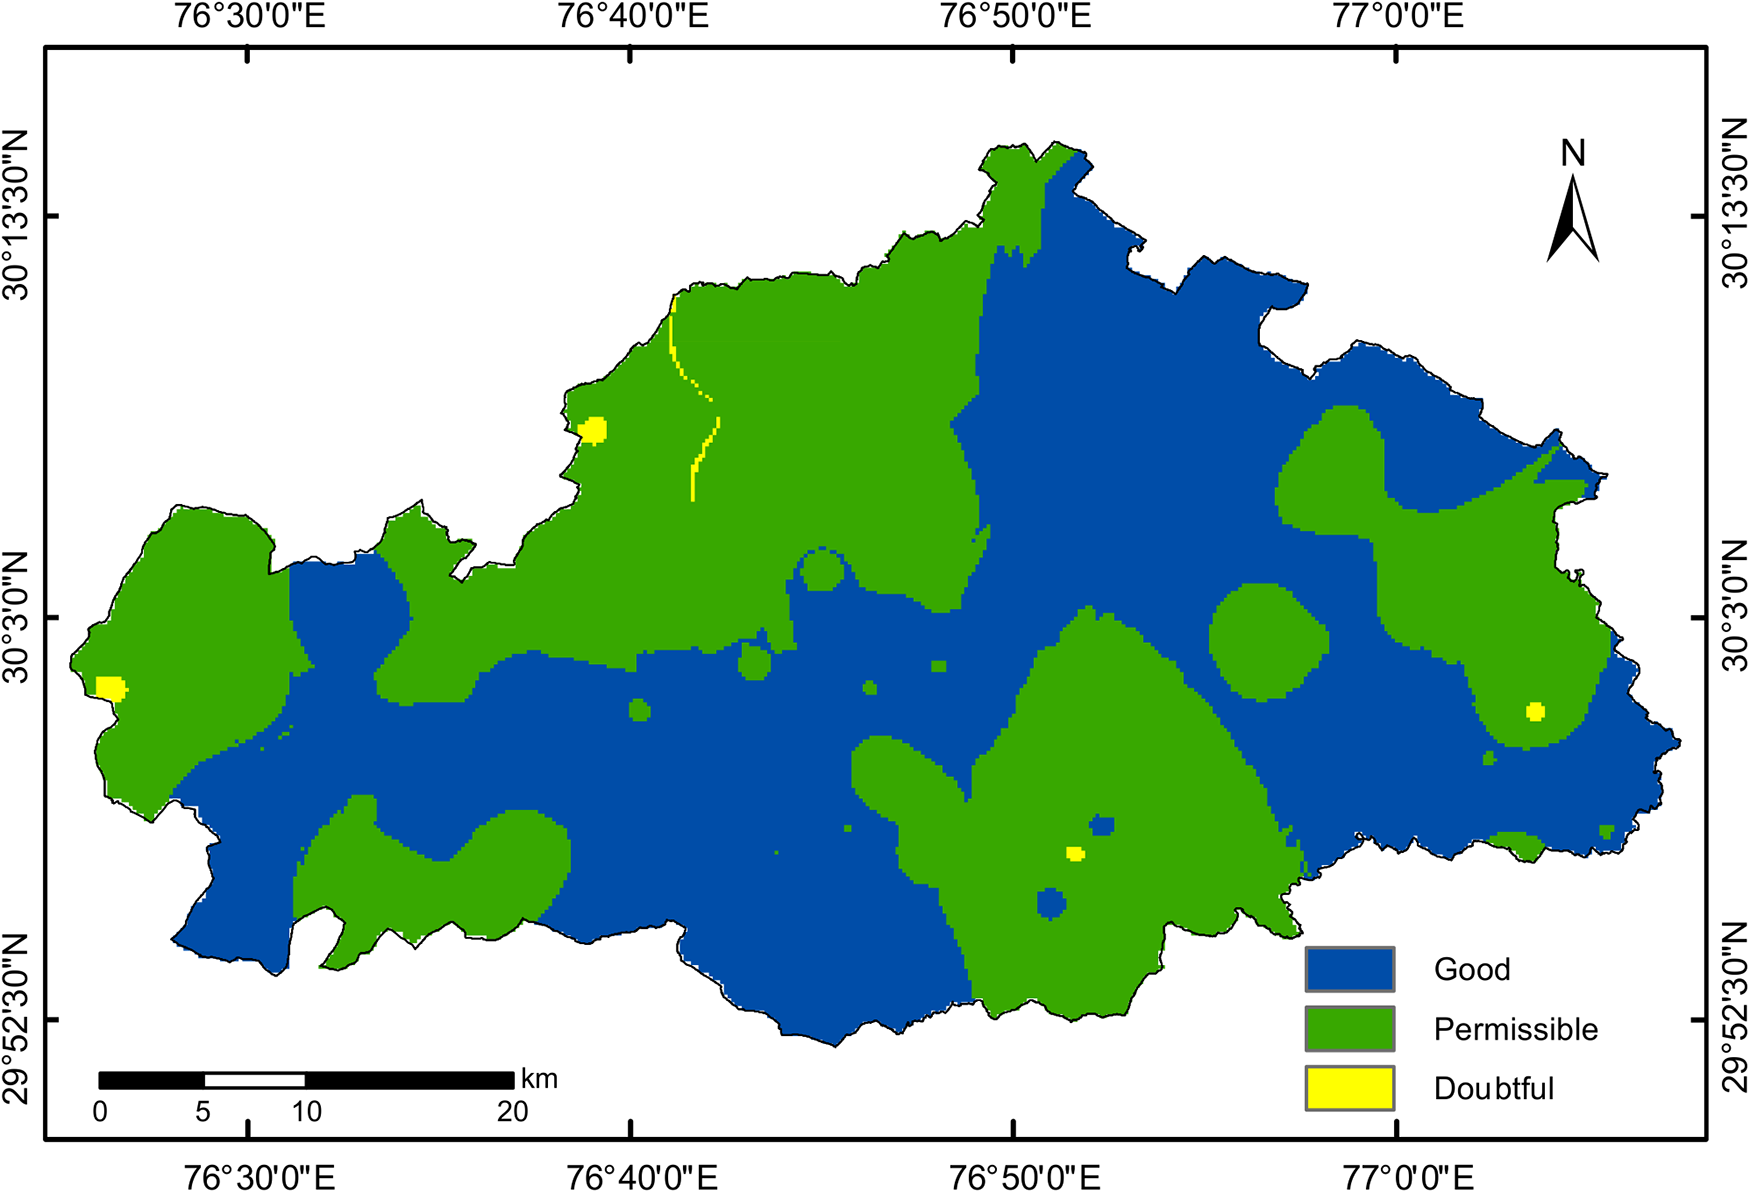
Figure 10: Integrated groundwater quality map for agricultural use in 2020.
The spatio-temporal assessment of groundwater quality in the Kurukshetra district between 1991 and 2020, reveals significant variations in key hydrogeochemical parameters with direct implications for human health. pH values, which indicated alkaline and undesirable groundwater in 1991, showed improvement during 2000 and 2010 but shifted toward acidic conditions in about 27% of the area by 2020, posing potential risks such as pipeline corrosion and gastrointestinal disorders [44]. Electrical Conductivity (EC) and Total Dissolved Solids (TDS) exhibited fluctuating trends, occasionally falling within the permissible to doubtful categories, indicating elevated concentrations of dissolved salts and minerals that may cause kidney stress and other long-term health issues if consumed without treatment [45]. Total Hardness (TH) showed a steady decline in quality, with the entire district categorized as hard water from 2000 onward, increasing susceptibility to urinary calculi and cardiovascular complications [46,47]. Although the Sodium Adsorption Ratio (SAR) remained within safe limits for irrigation, Percent Sodium (%Na) values were of concern, particularly in 2010 when nearly 94% of the district fell under the doubtful category, potentially contributing to hypertension and cardiovascular diseases upon prolonged consumption [48]. Residual Sodium Carbonate (RSC) exhibited critical conditions in 1991, with nearly 88% of the area classified as bad, though improvements were noted in subsequent years. The 2020 domestic suitability analysis indicated that almost the entire district fellunder the good to permissible class, whereas only 5.07% was found in the doubtful class, highlighting the need for continuous monitoring and water treatment in these areas so as to ensure sustainable management in the district. Overall, the results demonstrate that declining groundwater quality, if not properly addressed, could lead to serious health issues-including gastrointestinal, renal, and cardiovascular disorders-underscoring the urgent necessity for integrated groundwater quality management in the district.
The spatio-temporal assessment of groundwater quality in Kurukshetra district reflected significant fluctuations influenced by both natural processes and anthropogenic activities over three decades. While parameters like pH, EC, TDS, SAR, and RSC showed notable improvement from 1991 to 2020, concerns remain regarding TH and PS. In 2020, approximately 95% of the area was found suitable for domestic use, while over 99% of the district was found under the permissible to good class for agriculture. The study highlights a general trend of water quality improvement, likely due to better management practices and reduced contamination in recent years. However, localized deterioration in certain parameters necessitates continuous monitoring for sustainable groundwater management. Integrated strategies such as regulated fertilizer use, improved waste disposal, and continuous water quality assessment are crucial to safeguard groundwater for future domestic and agricultural needs. This research provides valuable baseline information for policy development and resource planning in semi-arid regions facing similar groundwater challenges.
Acknowledgement: The authors are thankful to Ground Water Cell, Irrigation & Water Resources Department, Government of Haryana, for providing the observation well data for this study.
Funding Statement: The authors received no specific funding.
Author Contributions: The authors confirm contribution to the paper as follows: Conceptualization, Aakash Deep, Bhagwan Singh Chaudhary and Sushil Kumar; Methodology, Aakash Deep and Sushil Kumar; Validation and formal analysis, investigation, writing—original draft preparation, Aakash Deep, Bhagwan Singh Chaudhary and Sushil Kumar; Writing—review, and editing, Sushil Kumar and Bhagwan Singh Chaudhary. All authors reviewed and approved the final version of the manuscript.
Availability of Data and Materials: The data that support the findings of this study are available from the Corresponding Author, [Aakash Deep], upon reasonable request.
Ethics Approval: Not applicable.
Conflicts of Interest: The authors declare no conflicts of interest.
References
1. Subba Rao N, Das R, Sahoo HK, Gugulothu S. Hydrochemical characterization and water quality perspectives for groundwater management for urban development. Groundw Sustain Dev. 2024;24:101071. doi:10.1016/j.gsd.2023.101071. [Google Scholar] [CrossRef]
2. Gugulothu S, Subbarao N, Das R, Dhakate R. Geochemical evaluation of groundwater and suitability of groundwater quality for irrigation purpose in an agricultural region of South India. Appl Water Sci. 2022;12(6):142. doi:10.1007/s13201-022-01583-w. [Google Scholar] [CrossRef]
3. Gupta DS, Raju A, Patel A, Chandniha SK, Sahu V, Kumar A, et al. Integrated assessment of the hydrogeochemical and human risks of fluoride and nitrate in groundwater using the RS-GIS tool: case study of the marginal Ganga Alluvial Plain, India. Water. 2024;16(24):3683. doi:10.3390/w16243683. [Google Scholar] [CrossRef]
4. Adimalla N, Qian H. Groundwater quality evaluation using water quality index (WQI) for drinking purposes and human health risk (HHR) assessment in an agricultural region of Nanganur, south India. Ecotoxicol Environ Saf. 2019;176:153–61. doi:10.1016/j.ecoenv.2019.03.066. [Google Scholar] [PubMed] [CrossRef]
5. Mukherjee I, Singh UK. Groundwater fluoride contamination, probable release, and containment mechanisms: a review on Indian context. Environ Geochem Health. 2018;40(6):2259–301. doi:10.1007/s10653-018-0096-x. [Google Scholar] [PubMed] [CrossRef]
6. Maurya S, Saxena A. Health risk assessment of groundwater quality: a case study of Pratapgarh district U.P, India. J King Saud Univ Sci. 2024;36(8):103275. doi:10.1016/j.jksus.2024.103275. [Google Scholar] [CrossRef]
7. Alcamo J, Flörke M, Märker M. Future long-term changes in global water resources driven by socio-economic and climatic changes. Hydrol Sci J. 2007;52(2):247–75. doi:10.1623/hysj.52.2.247. [Google Scholar] [CrossRef]
8. Gleeson T, Wada Y, Bierkens MFP, van Beek LPH. Water balance of global aquifers revealed by groundwater footprint. Nature. 2012;488(7410):197–200. doi:10.1038/nature11295. [Google Scholar] [PubMed] [CrossRef]
9. Scanlon BR, Faunt CC, Longuevergne L, Reedy RC, Alley WM, McGuire VL, et al. Groundwater depletion and sustainability of irrigation in the US High Plains and Central Valley. Proc Natl Acad Sci U S A. 2012;109(24):9320–5. doi:10.1073/pnas.1200311109. [Google Scholar] [PubMed] [CrossRef]
10. Famiglietti JS. The global groundwater crisis. Nat Clim Change. 2014;4(11):945–8. doi:10.1038/nclimate2425. [Google Scholar] [CrossRef]
11. Gleeson T, Befus KM, Jasechko S, Luijendijk E, Cardenas MB. The global volume and distribution of modern groundwater. Nat Geosci. 2016;9(2):161–7. doi:10.1038/ngeo2590. [Google Scholar] [CrossRef]
12. Todd DK, Mays LW. Groundwater hydrology. 3rd ed. Hoboken, NJ, USA: Wiley; 2005. p. 329–58. [Google Scholar]
13. Custodio E, Andreu-Rodes JM, Aragón R, Estrela T, Ferrer J, García-Aróstegui JL, et al. Groundwater intensive use and mining in south-eastern peninsular Spain: hydrogeological, economic and social aspects. Sci Total Environ. 2016;559:302–16. doi:10.1016/j.scitotenv.2016.02.107. [Google Scholar] [PubMed] [CrossRef]
14. Foster S, Chilton J. Policy experience with groundwater protection from diffuse pollution—a review. Curr Opin Environ Sci Health. 2021;23:100288. doi:10.1016/j.coesh.2021.100288. [Google Scholar] [CrossRef]
15. Kannan P, Balasubramaniyan G, Karuppannan S, Swaminathan B, Sam SC, Murugesan B. Groundwater quality beyond potability: decoding the hydrogeochemical signatures using spatial and statistical methods in regions of Dindigul District, Tamil Nadu. Discov Sustain. 2025;6(1):784. doi:10.1007/s43621-025-01344-0. [Google Scholar] [CrossRef]
16. Bera A, Mukhopadhyay BP, Das S. Groundwater vulnerability and contamination risk mapping of semi-arid Totko River Basin, India using GIS-based DRASTIC model and AHP techniques. Chemosphere. 2022;307(Part 2):135831. doi:10.1016/j.chemosphere.2022.135831. [Google Scholar] [PubMed] [CrossRef]
17. Lapworth DJ, Nkhuwa DCW, Okotto-Okotto J, Pedley S, Stuart ME, Tijani MN, et al. Urban groundwater quality in sub-Saharan Africa: current status and implications for water security and public health. Hydrogeol J. 2017;25(4):1093–116. doi:10.1007/s10040-016-1516-6. [Google Scholar] [PubMed] [CrossRef]
18. Li P, Karunanidhi D, Subramani T, Srinivasamoorthy K. Sources and consequences of groundwater contamination. Arch Environ Contam Toxicol. 2021;80(1):1–10. doi:10.1007/s00244-020-00805-z. [Google Scholar] [PubMed] [CrossRef]
19. Pakash R, Dinesh, Kumar S. Survey and mapping of groundwater quality of Sonipat Block in Sonipat District of Haryana, India. J Soil Salin Water Qual. 2023;13(2):221–7. [Google Scholar]
20. Singh R, Upreti P, Allemailem KS, Almatroudi A, Rahmani AH, Albalawi GM, et al. Geospatial assessment of ground water quality and associated health problems in the western region of India. Water. 2022;14(3):296. doi:10.3390/w14030296. [Google Scholar] [CrossRef]
21. El Mountassir O, Bahir M, Hakimi S, Faraj TKh, Carreira PM. Assessment of groundwater quality in the semi-arid environment: implications of climate change. Limnol Rev. 2024;24(4). doi:10.3390/limnolrev24040030. [Google Scholar] [CrossRef]
22. Awasthi A, Rishi MS, Khosla A, Panjgotra S. Geographic information system-based groundwater quality assessment for drinking and irrigation purposes in transboundary aquifers of River Ravi, India. Environ Sci Pollut Res Int. 2023;30(12):34536–52. doi:10.1007/s11356-022-24642-w. [Google Scholar] [PubMed] [CrossRef]
23. Datta SP, Biswas DR, Saharan N, Ghosh SK, Rattan RK. Effect of long-term application of sewage effluents on organic carbon, bioavailable phosphorus, potassium and heavy metal status of soils and content of heavy metals in crops grown thereon. J Indian Soc Soil Sci. 2000;48:836–9. doi:10.1016/j.agee.2005.02.025. [Google Scholar] [CrossRef]
24. Rangarajan, Athavale RN. Annual replenishable ground water potential of India—an estimate based on injected tritium studies. J Hydrol. 2000;234(1–2):38–53. doi:10.1016/S0022-1694(00)00239-0. [Google Scholar] [CrossRef]
25. Heath RC. Basic ground-water hydrology. Denver, CO, USA: Geological Survey; 1998. Report No.: USGS Water-Supply Paper 2220. [Google Scholar]
26. Lloyd JW, Heathcote JA. Natural inorganic hydrochemistry in relation to groundwater. Oxford, UK: Clarendon Press; 1985. [Google Scholar]
27. Goyal SK, Chaudhary BS, Singh O, Sethi GK, Thakur PK. GIS based spatial distribution mapping and suitability evaluation of groundwater quality for domestic and agricultural purpose in Kaithal district, Haryana state, India. Environ Earth Sci. 2010;61(8):1587–97. doi:10.1007/s12665-010-0472-z. [Google Scholar] [CrossRef]
28. Sethi GK, Chaudhary BS, Goyal SK, Thakur PK. Suitability analysis of groundwater quality for domestic and irrigation usage in Yamuna Nagar district, India: a GIS approach. J Indian Soc Remote Sens. 2012;40(1):155–65. doi:10.1007/s12524-011-0116-0. [Google Scholar] [CrossRef]
29. Ravindra B, Subba Rao N, Dhanamjaya Rao EN. Groundwater quality monitoring for assessment of pollution levels and potability using WPI and WQI methods from a part of Guntur district, Andhra Pradesh, India. Environ Dev Sustain. 2023;25(12):14785–815. doi:10.1007/s10668-022-02689-6. [Google Scholar] [CrossRef]
30. Subba Rao N, Dinakar A, Sun L. Estimation of groundwater pollution levels and specific ionic sources in the groundwater, using a comprehensive approach of geochemical ratios, pollution index of groundwater, unmix model and land use/land cover—a case study. J Contam Hydrol. 2022;248:103990. doi:10.1016/j.jconhyd.2022.103990. [Google Scholar] [PubMed] [CrossRef]
31. Dhawan V. Water and agriculture in India. Hamburg, Germany: German Asia-Pacific Business Association; 2017 [cited 2025 Jan 1]. Available from: https://www.oav.de/fileadmin/user_upload/5_Publikationen/5_Studien/170118_Study_Water_Agriculture_India.pdf. [Google Scholar]
32. Wu Z, Lai X, Li K. Water quality assessment of rivers in Lake Chaohu Basin (China) using water quality index. Ecol Indic. 2021;121:107021. doi:10.1016/j.ecolind.2020.107021. [Google Scholar] [CrossRef]
33. Carey B, Williams M, Hakala A, Fessenden J, Keating E. Experimental study of sediment-CO2 reactions with application to changes in groundwater quality due to leakage of sequestered CO2. AGU Fall Meet Abstr. 2009:H13A–0913. [Google Scholar]
34. Suthar S, Bishnoi P, Singh S, Mutiyar PK, Nema AK, Patil NS. Nitrate contamination in groundwater of some rural areas of Rajasthan, India. J Hazard Mater. 2009;171(1–3):189–99. doi:10.1016/j.jhazmat.2009.05.111. [Google Scholar] [PubMed] [CrossRef]
35. Pareta K, Karan S, Enemark T, Reddy T, Dashora Y, Issar T, et al. Groundwater quality assessment for drinking and irrigation purposes in the Ayad river basin, Udaipur (India). Groundw Sustain Dev. 2024;27:101351. doi:10.1016/j.gsd.2024.101351. [Google Scholar] [CrossRef]
36. Barad S, Thakur RR, Nandi D, Bera DK, Sahu PC, Mishra P, et al. Hydrogeochemical and geospatial insights into groundwater contamination: fluoride and nitrate risks in western Odisha, India. Water. 2025;17(10):1514. doi:10.3390/w17101514. [Google Scholar] [CrossRef]
37. India Meteorological Department (IMD). Press release: annual climate summary 2024. [cited 2025 Jan 15]. Available from: https://internal.imd.gov.in/press_release/20250115_pr_3554.pdf. [Google Scholar]
38. Rani R, Chaudhary BS. Spatial distribution mapping and assessment of suitability of groundwater quality for drinking purpose in Hisar District of Haryana State, India. SSARSC Int J Geo Sci Geo Inform. 2015;2(1):1–8. doi:10.1007/s12665-010-0472-z. [Google Scholar] [CrossRef]
39. Dimple, Singh PK, Kothari M, Yadav KK, Bhakar SR, Rajput J, et al. Assessing groundwater quality in Nand Samand catchment, Rajasthan, India: a GIS-based multi indices approach for drinking and irrigation water suitability. Water Pract Technol. 2024;19(4):1249–71. doi:10.2166/wpt.2024.069. [Google Scholar] [CrossRef]
40. Raghunath HM. Ground water. London, UK: New Age International Publishers; 2022. 506 p. [Google Scholar]
41. Shepard D. A two-dimensional interpolation for irregularly spaced data. In: Proceedings of the 23rd ACM National Conference; 1968 Aug 27–29; New York, NY, USA. p. 517–24. doi:10.1145/800186.810616. [Google Scholar] [CrossRef]
42. Reeta R, Chaudhary BS. GIS based spatio-temporal mapping of groundwater depth in Hisar district, Haryana state, India. Int J Adv Remote Sens GIS. 2016;5(1):1971–80. doi:10.23953/cloud.ijarsg.75. [Google Scholar] [CrossRef]
43. Deep A, Kumar S, Chaudhary BS. Spatio-temporal monitoring of groundwater depth for sustainable groundwater resources management in Kurukshetra district, Haryana. Discov Geosci. 2025;3(1):184. doi:10.1007/s44288-025-00296-2. [Google Scholar] [CrossRef]
44. Raheja H, Goel A, Pal M. An evaluation of groundwater quality and its suitability for drinking and irrigation uses under the GIS framework. Water Pract Technol. 2022;17(11):2259–77. doi:10.2166/wpt.2022.134. [Google Scholar] [CrossRef]
45. Singh R, Singh S, Das A, Sahu H, Durgam M, Khose S, et al. Evaluating groundwater quality for drinking and irrigation purposes and health risk assessment in west Midnapore district of west Bengal, India. J Agric Eng Ind. 2024;61(4):580–96. doi:10.52151/jae2024614.1869. [Google Scholar] [CrossRef]
46. Gupta DP, Sunita, Saharan JP. Physiochemical analysis of groundwater of selected area of Kaithal City (HaryanaIndia. Researcher. 2009;1(2):1–5. [Google Scholar]
47. Deshmukh VD, Wharekar SR, Ingole SP, Khedkar DD. Physico-chemical analysis of ground water sample from Kamal colony, Amravati. Int J Life Sci. 2014;Special Issue A2:119–22. [Google Scholar]
48. Ravindra K, Garg VK. Distribution of fluoride in groundwater and its suitability assessment for drinking purpose. Int J Environ Health Res. 2006;16(2):163–6. doi:10.1080/09603120500538283. [Google Scholar] [PubMed] [CrossRef]
Cite This Article
 Copyright © 2026 The Author(s). Published by Tech Science Press.
This work is licensed under a Creative Commons Attribution 4.0 International License , which permits unrestricted use, distribution, and reproduction in any medium, provided the original work is properly cited.
 Downloads
 Citation Tools