
 Submit a Paper
 Propose a Special lssue
 Open Access
ARTICLE
A New Normalized Climate Index (U2) for Türkiye: Comparison with Classical Methods
1 Department of Risk Management of Natural Disasters, Canakkale Onsekiz Mart University, Canakkale, Türkiye
2 Geophysical Engineering, Canakkale Onsekiz Mart University, Canakkale, Türkiye
* Corresponding Author: Erdinç Uslan. Email:
Revue Internationale de Géomatique 2026, 35, 31-51. https://doi.org/10.32604/rig.2026.075081
Received 24 October 2025; Accepted 31 December 2025; Issue published 05 February 2026
 View Full Text
 Download PDF
Abstract
Climate classification systems are essential tools for analyzing regional climatic behavior, assessing long-term aridity patterns, and evaluating the impacts of climate change on water resources and ecosystem resilience. This study introduces a new Climate Classification Method based on uniform and unitless variables, referred to as the U2 Climate Classification (U2CC). The proposed U2 Index was designed to overcome structural limitations of the classical De Martonne (1942) and Erinç (1949) indices, which rely on raw precipitation–temperature ratios and are sensitive to extreme values, particularly subzero temperatures. The U2 methodology consisted of two key steps: (i) normalization of temperature and precipitation relative to their long-term provincial means, and (ii) restructuring of the climatic year to begin on 1 April, aligning the index with hydrological and agricultural cycles. This approach provided a more stable and comparable representation of climatic moisture balance across Türkiye. Using long-term meteorological observations covering the period 1927–2023 obtained from the Turkish State Meteorological Service, national-scale climate maps based on the U2 Index were produced and evaluated in comparison with the De Martonne and Erinç classifications. The results indicated that U2CC captured broad-scale climatic patterns consistent with established methods while providing improved representation of transitional climatic zones. Spatial patterns revealed increasing aridity across Central Anatolia associated with declining winter precipitation, whereas the Black Sea and southwestern coastal regions retained humid characteristics due to persistent maritime influence. Overall, the findings demonstrated that U2CC offered a refined and robust framework for climate zoning, agricultural planning, drought assessment, and sustainable water resource management under ongoing climate change conditions.Keywords
The impacts of global climate change have become increasingly visible across Türkiye, particularly within the Mediterranean Basin—one of the world’s most environmentally vulnerable regions [1]. Recent national-scale assessments indicate that drought frequency, aridity severity, and climatic variability have intensified across the country, while rising temperatures, decreasing winter precipitation, and shifting seasonal rainfall regimes have disrupted both surface and groundwater resources, accelerating drought-driven land degradation in many regions, most notably across the Central Anatolian Plateau [2,3].
Given Türkiye’s strong dependence on agricultural productivity, precipitation variability has direct socio-economic consequences. Reduced rainfall leads to declining reservoir storage, groundwater depletion, diminished crop yield, and increased irrigation costs, thereby intensifying rural vulnerability. These challenges highlight the need for accurate and spatially coherent climate classification systems that can represent Türkiye’s diverse climatic regimes and evolving environmental conditions.
A conceptual distinction must be emphasized: aridity refers to the long-term climatic dryness inherent to a region, whereas drought is a short-term meteorological anomaly superimposed on this baseline [4]. Conventional drought indices therefore cannot fully capture persistent climatic structures. In this context, the present study introduces the U2 Climate Classification Method, a long-term, normalization-based, unitless climatic index designed to overcome key limitations in traditional aridity assessments. Unlike short-term drought indices, the U2 Method quantifies stable climatic behavior by normalizing both temperature and precipitation, thereby creating a scale-independent classification suitable for comparative regional analysis and addressing the difficulty of applying raw climatic variables—particularly temperatures in Celsius that frequently drop below zero in Türkiye—to mathematical indices without introducing structural bias.
Historically, climate classification efforts have sought to describe how temperature and precipitation jointly shape regional environmental conditions. Köppen’s pioneering work established a vegetation-based global climate typology that forms the conceptual foundation of modern climate classification systems and has since been operationalized and refined in contemporary global datasets [5–7]. This framework was later refined to better represent mid-latitude thermal regimes and to more explicitly delineate the boundaries between humid and dry zones [8]. Mathematical aridity formulations followed, including the De Martonne, Thornthwaite, and Erinç indices, each attempting to create quantitative indicators of climatic moisture availability [9–11]. Despite their utility, these indices share fundamental limitations: they rely on raw temperature–precipitation ratios, are directly influenced by negative temperature values, and use non-normalized variables, reducing cross-regional comparability [12].
Within Türkiye, the De Martonne and Erinç indices remain widely applied for climatic zoning; however, they often oversimplify transitional zones—particularly between humid coastal areas and the semi-arid interior—because they cannot adequately account for topographic gradients, continentality, or interseasonal amplitude within a dimensionless framework [13]. As a result, such classifications may fail to reflect the true climatic heterogeneity of the country.
Recent studies have increasingly emphasized the need for climate classification frameworks that move beyond classical temperature–precipitation ratios and provide a more robust representation of regional climatic heterogeneity. In particular, graph-based and data-driven classification approaches have been shown to improve spatial coherence and structural consistency, especially in regions characterized by strong continentality and complex topography, such as the Middle East and Anatolia [14].
At the same time, fine-grained climate classification methods based on normalized climatic variables have demonstrated improved sensitivity in distinguishing transitional climatic zones and reducing scale dependency across regions with contrasting thermal and hydrological regimes [15]. These approaches underline the importance of normalization and structural consistency in long-term climate classification.
More recent developments further highlight that advanced classification techniques—ranging from statistical frameworks to hybrid machine-learning–based models—can enhance the discrimination of local and regional climate zones under contemporary climate variability, particularly when spatial structure and climatic extremes are explicitly considered [16].
To address these gaps, this study proposes the U2 Climate Classification, which employs long-term normalized, unitless temperature and precipitation values to generate a robust and scalable climatic index for Türkiye. By eliminating unit dependency, correcting negative-temperature sensitivity, and improving sensitivity to hydrological–thermal seasonality, the U2 Method provides a more coherent and spatially detailed assessment of climatic structure. While U2 introduces significant methodological advantages, it also has inherent limitations—most notably its reliance on provincial-scale averages rather than station-level or gridded datasets—an issue addressed in later sections of this paper.
In this study, three major climate classification systems were evaluated and compared:
(1) the De Martonne Climate Classification (DMCC),
(2) the Erinç Climate Classification (ECC), and
(3) the newly proposed U2 Climate Classification (U2CC).
These approaches represent different methodological perspectives on how temperature and precipitation interact to define regional climatic conditions. The following subsections outline the conceptual background and mathematical structure of each method, forming the basis for the comparative analyses presented in this study.
2.1 De Martonne Climate Classification (DMCC)
De Martonne proposed one of the earliest quantitative aridity indices to characterize long-term moisture availability using annual mean temperature and total precipitation [9]. The index is defined as:
where
P = annual precipitation total (mm),
T = annual mean temperature (°C).
The constant +10 prevents the denominator from approaching zero or becoming negative in regions where monthly mean temperatures fall below 0°C. Although widely used due to its simplicity, the DMCC becomes less reliable when long-term datasets include extended cold seasons or strong seasonal contrasts, which may exaggerate or suppress aridity levels [12]. Moreover, the method does not incorporate any form of normalization, making cross-regional comparisons difficult when climatic amplitudes differ substantially.
2.2 Erinç Climate Classification (ECC)
Erinç introduced a precipitation efficiency index specifically suited to regions such as Türkiye, where the contrast between dry summers and wet winters is pronounced [11]. In contrast to De Martonne’s use of annual mean temperature, Erinç employed the mean of monthly maximum temperatures, thereby better reflecting the evaporative potential of warm-season conditions.
The index is expressed as:
where
P = annual total precipitation (mm),
Tom = annual mean of monthly maximum temperatures (°C).
By using monthly maximum temperatures rather than annual means, the Erinç Index provides a more realistic representation of summer aridity, which is a defining characteristic of Türkiye’s Mediterranean and continental climatic regimes. However, the index remains scale-dependent, as it relies on raw temperature (°C) and precipitation (mm) values. As a result, regions with similar precipitation but different thermal amplitudes may be classified inconsistently. For example, 700 mm of rainfall paired with Tom = 20°C yields Im = 35, whereas 400 mm with Tom = 10°C yields Im = 40—suggesting a more “humid” classification despite substantially lower precipitation.
Such discrepancies highlight the need for a normalized and unitless classification that can provide coherent comparisons across regions with diverse climatic characteristics. This methodological gap motivates the development of the U2 Climate Classification.
2.3 U2 Climatic Classification (U2CC)
The U2 Index is a normalized and unitless climate classification method designed to overcome structural limitations inherent in DMCC and ECC.
In this study, the terms aridity, humidity, and drought are used descriptively to express long-term climatic moisture balance rather than short-term meteorological anomalies.
U2 introduces three major methodological improvements:
1. Normalization of variables:
Both temperature and precipitation are normalized relative to their long-term means, eliminating unit dependency and reducing the influence of extreme seasonal values.
2. Avoidance of negative-temperature bias:
By removing direct dependence on Celsius values, U2 prevents abrupt ratio distortions that occur in classical formulas when temperatures drop below zero—an important advantage for the continental and mountainous regions of Türkiye.
3. Enhanced cross-regional comparability:
The unitless structure allows climatic zones to be compared more consistently across different thermal regimes, providing greater sensitivity in transitional zones between humid coastal and arid inland regions.
The U2 Classification therefore provides a more physically consistent representation of Türkiye’s climatic balance by integrating long-term thermal and hydrological signals into a unified, dimensionless index. Detailed explanations of the normalization procedure, index formulation, and seasonal realignment are provided in the following sections.
Traditional aridity indices typically rely on raw precipitation–temperature ratios (mm/°C), which introduce dimensional bias and reduce their ability to represent climatic gradients, especially in regions where temperatures frequently drop below 0°C. Such formulations distort the thermal component of aridity by causing abrupt changes in the denominator when negative temperatures occur. The U2 Index resolves these structural limitations by (i) transforming temperature data into a scale that avoids negative values, and (ii) normalizing both temperature and precipitation relative to their long-term means, thereby producing dimensionless and comparably scaled indicators.
By adopting a normalization-based, unit-independent framework, the U2 Classification enables climatic variability to be evaluated consistently across regions with contrasting thermal and hydrological amplitudes, offering a unified representation of long-term thermal–hydrological balance for Türkiye’s diverse climatic regimes.
To avoid the distortions caused by negative Celsius values, all temperature data were converted from °C to °F before normalization. This conversion preserves proportional variability without altering climatic trends:
Temperature is not used in its Fahrenheit form in the final index; instead, this transformation simply ensures that the normalized ratios derived in later steps are not influenced by subzero temperature values.
2.3.3 Normalization of Variables
To achieve a unitless and comparable climatic scale, both temperature and precipitation were normalized relative to their long-term provincial annual means.
Temperature normalization
and
where
T (monthly) = monthly mean temperature,
These ratios represent how far the thermal extremes deviate from the annual mean, enabling standardized comparison among regions with different thermal ranges.
Precipitation normalization
and
where
P(monthly) = monthly precipitation (mm),
Together, Eqs. (4)–(7) describe the hydrological and thermal amplitudes of each province within a dimensionless framework, forming the basis of the U2 climatic structure.
Because the Gregorian calendar does not correspond to natural climatic cycles in Türkiye, the Seasonal New Year was redefined as 1 April, aligning with the onset of the hydrological and phenological cycle. In most regions, precipitation maxima occur in January whereas temperature maxima occur in July; these inverse seasonal peaks generate a natural thermal–hydrological offset.
Observational studies indicate that precipitation minima and temperature maxima consistently occur between January and July [2]. Realigning the climatic year to begin on 1 April therefore increases sensitivity to spring–summer transitions, which are critical for distinguishing drought evolution and aridity gradients across Türkiye.
When normalized temperature and precipitation series are examined across Türkiye, six characteristic annual variation patterns emerge, corresponding to the dominant climatic regimes: hot (A), warm (T), cold (X), humid (KB), mountain (D), and extremely humid (EX). These patterns represent distinct thermal–hydrological structures that define Türkiye’s climatic diversity. They are illustrated in Fig. 1, which displays normalized monthly behavior beginning from the Seasonal New Year on 1 April.
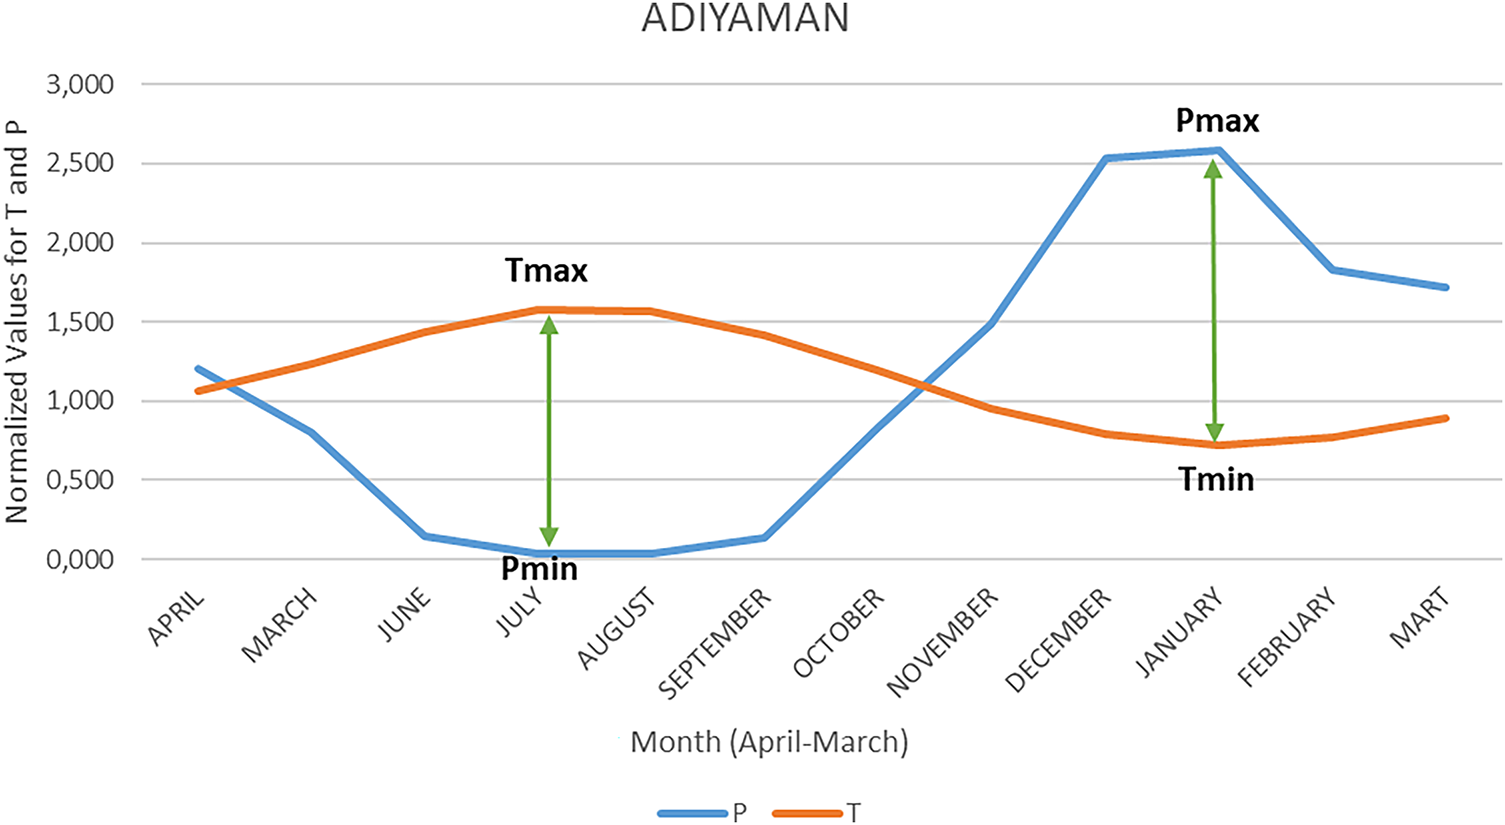
Figure 1: Annual variation of normalized (unitless) temperature and precipitation values for a representative province (Adıyaman), with the seasonal climatic year defined to begin on 1 April. Tmax and Tmin denote normalized thermal extremes, while Pmax and Pmin represent normalized hydrological extremes. The relative timing and magnitude of these extremes constitute the structural basis of the U2 Index.
The U2 Index quantifies the overall climatic balance by measuring the relative displacement between thermal and hydrological extremes:
where all variables correspond to the normalized parameters defined in Eqs. (4)–(7).
This dimensionless formulation captures the magnitude and direction of the offset between temperature and precipitation extremes, providing a more sensitive indicator of climatic variability than classical aridity indices that rely on raw values.
A higher Iu2 value indicates stronger aridity, whereas lower or negative values correspond to humid or moisture-surplus conditions. Because the index incorporates both the amplitude and timing of thermal and hydrological extremes, it enables clearer differentiation between transitional climatic zones.
Fig. 1 illustrates the annual progression of normalized monthly temperature and precipitation for a representative province (Adıyaman), marking the Seasonal New Year on 1 April. This example highlights the structural offset between Tmax–Pmin and Pmax–Tmin, demonstrating how their relative magnitudes form the basis of the U2 climatic patterns.
When the normalized temperature and precipitation curves are plotted for all provinces in Türkiye, six dominant annual variation patterns emerge (Fig. 2). These patterns reflect the combined thermal–hydrological structure of each region and correspond closely to Türkiye’s well-established climatic divisions. The use of normalized values enables these patterns to be compared consistently across provinces with different temperature amplitudes and precipitation ranges.
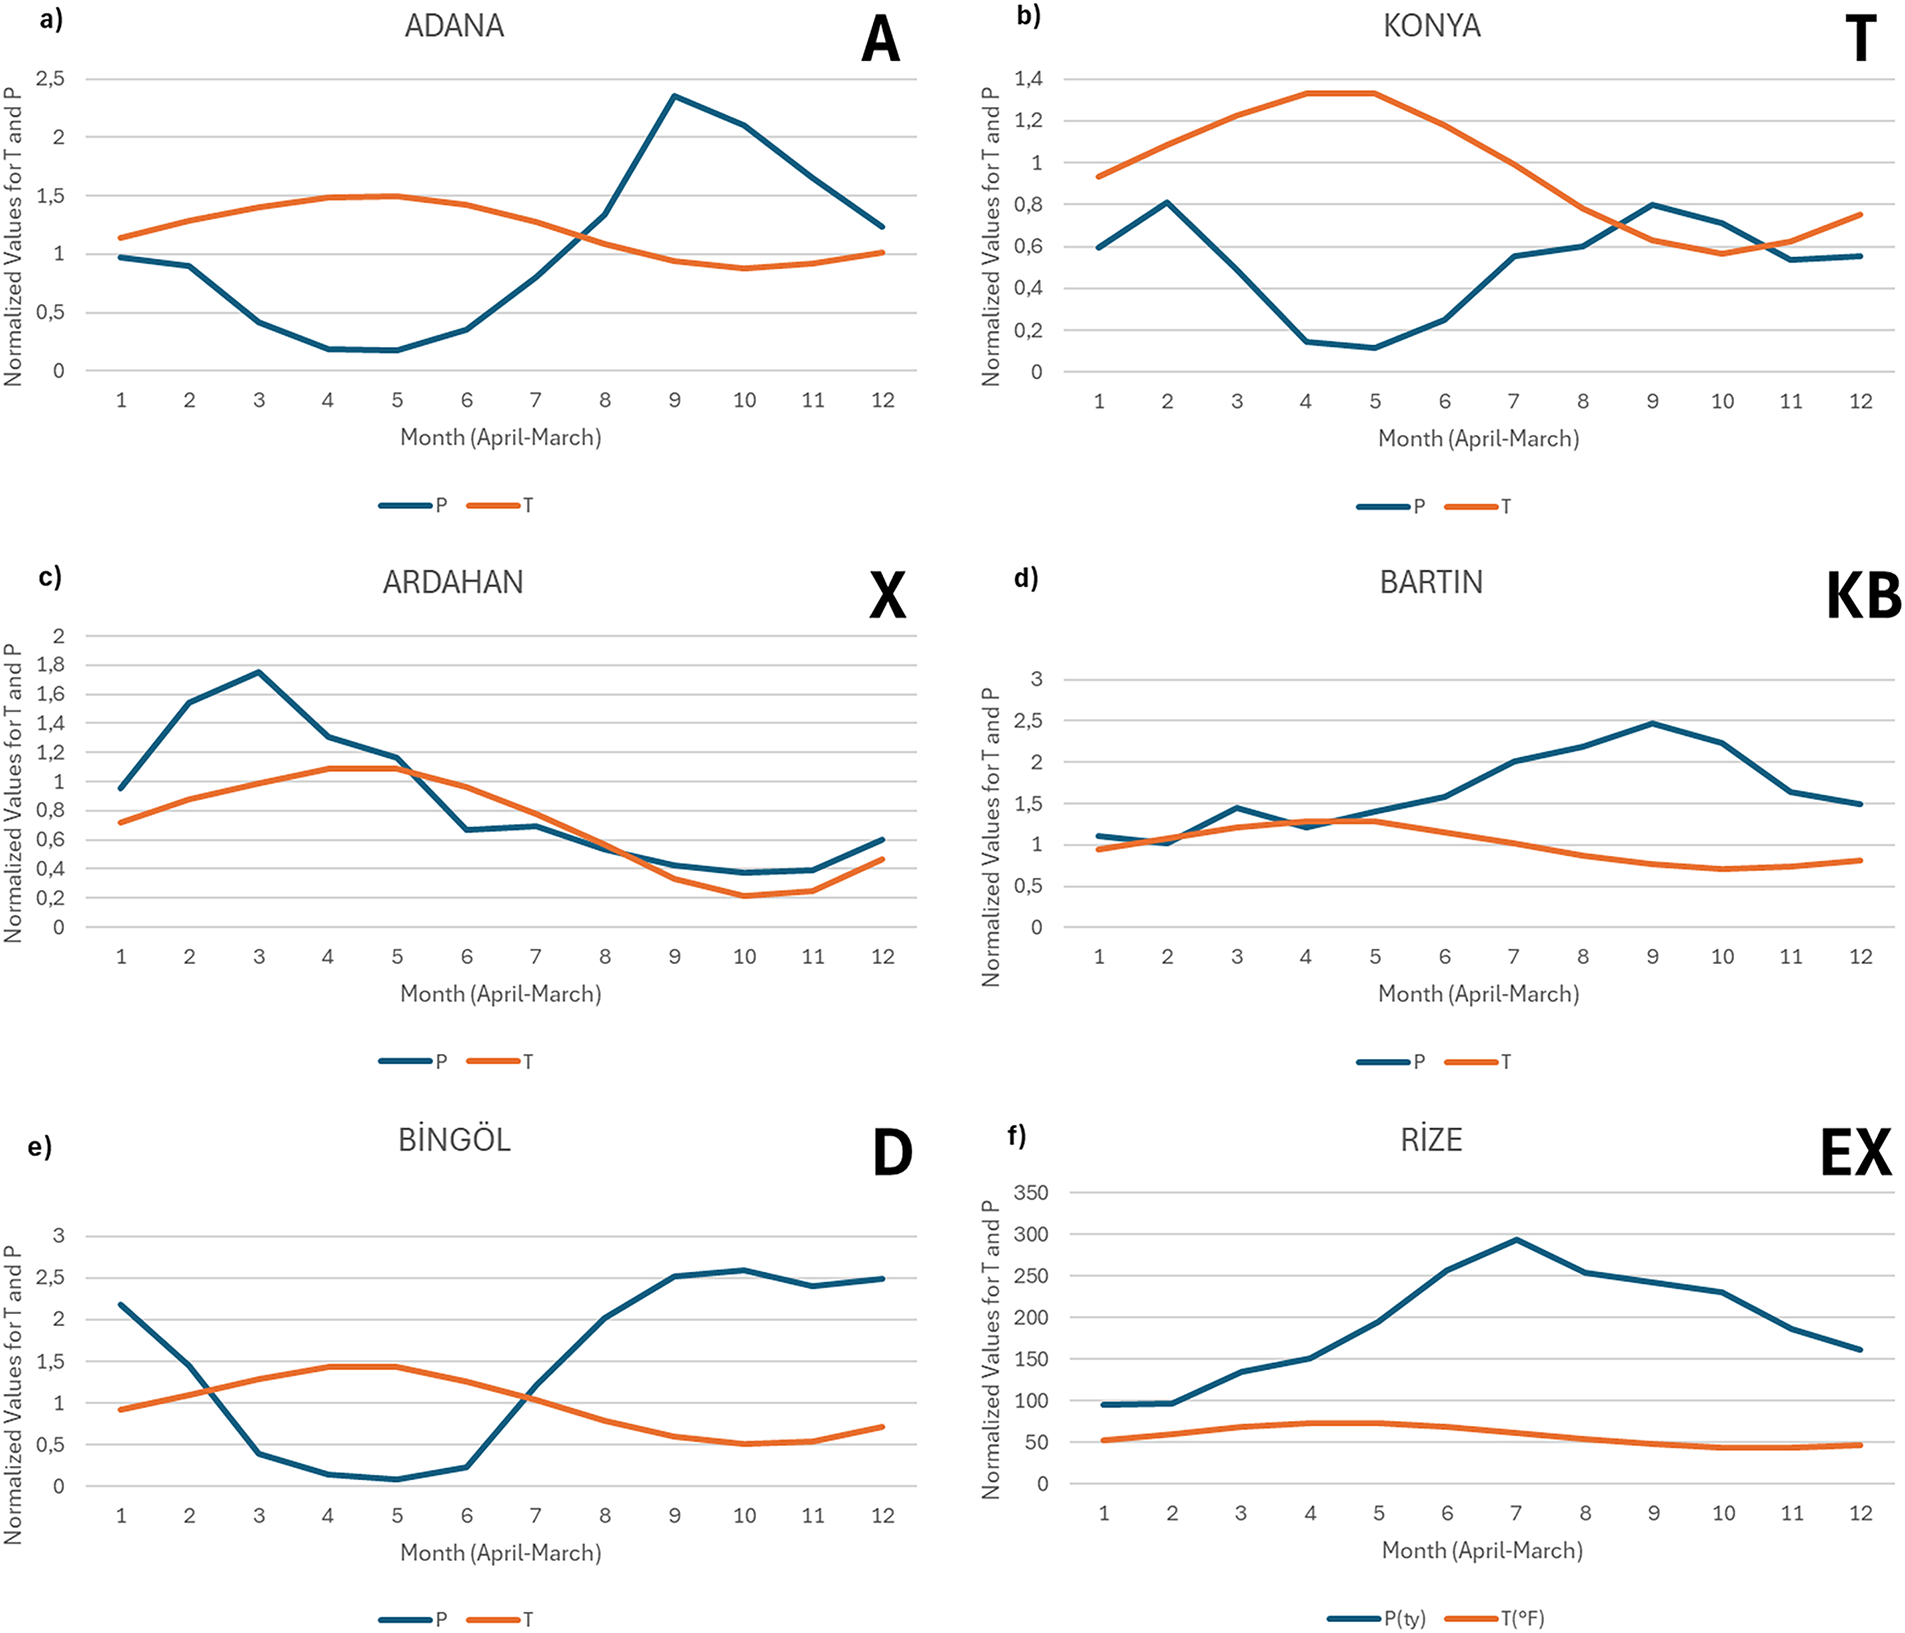
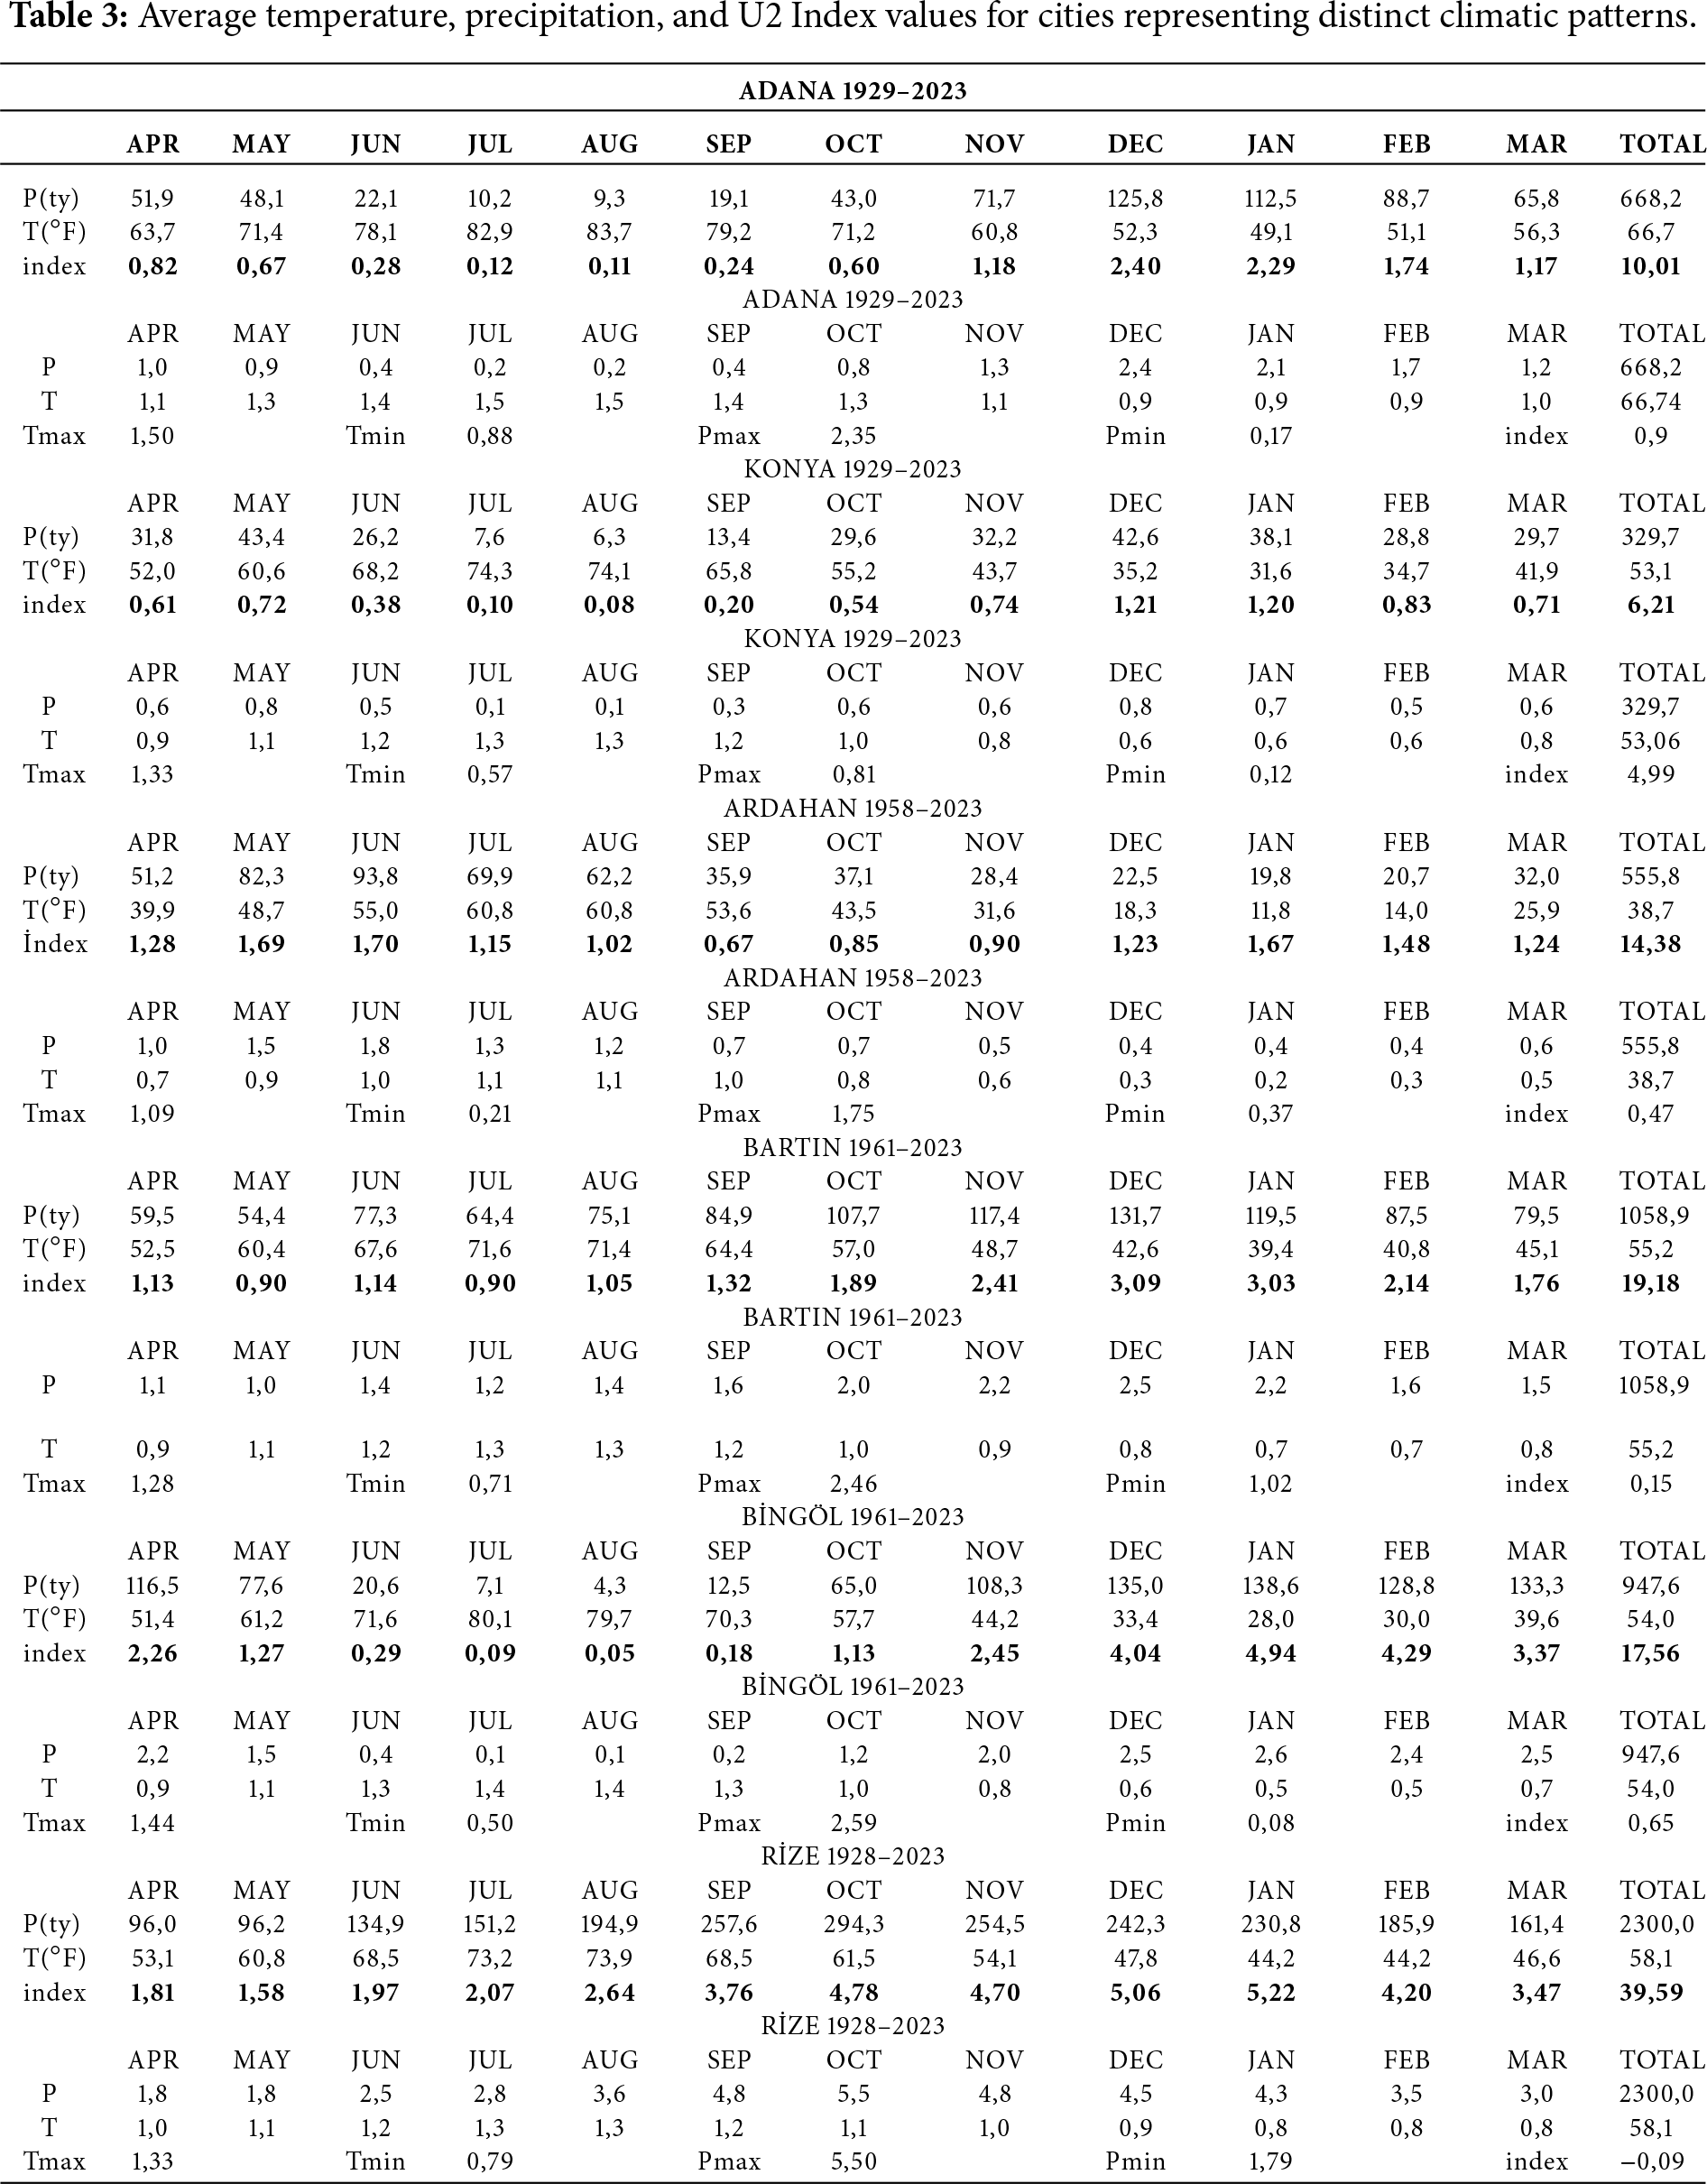
Figure 2: Representative normalized (unitless) temperature (T) and precipitation (P) patterns for six major climatic regimes in Türkiye: (a) Adana (A), (b) Konya (T), (c) Ardahan (X), (d) Bartın (KB), (e) Bingöl (D), and (f) Rize (EX). The curves illustrate distinct annual thermal–hydrological regimes characterizing Türkiye’s principal climate types, ranging from hot–dry continental lowlands to extremely humid maritime environments.
Pattern A (Hot) represents provinces where summer temperatures reach their annual maximum while summer precipitation nearly drops to zero. These regions exhibit strong summer aridity typical of Mediterranean lowlands.
Pattern T (Warm) is defined by warm summers and moderate rainfall persistence throughout the summer months, reflecting semi-arid transitional zones.
Pattern X (Cold) describes provinces with pronounced continentality, characterized by cold winters, moderate summer precipitation, and high thermal amplitudes.
Pattern KB (Humid Coastal) corresponds to the Black Sea’s maritime regime, where precipitation is distributed relatively evenly throughout the year and summers remain mild.
Pattern D (Mountain) reflects high-elevation regions with sharp vertical climatic gradients, where thermal amplitude is reduced but orographic precipitation enhances autumn–winter rainfall.
Pattern EX (Extremely Humid) represents strongly maritime areas with consistently high precipitation and limited thermal variation, dominated by persistent moisture.
These characteristic shapes demonstrate that the U2 Index is capable of capturing Türkiye’s climatic hierarchy using a unitless and normalized framework. The patterns provide a structural basis for interpreting how each province’s thermal and hydrological extremes interact within the U2 formulation, enabling both regional comparison and refined classification in transitional climate belts.
2.4 Data and Spatial Processing
Long-term meteorological observations covering the period 1927–2023 were obtained from the Turkish State Meteorological Service (TSMS), including monthly mean temperature and monthly total precipitation for all 81 provinces of Türkiye. These datasets form the primary basis of the U2 Climate Classification. To ensure consistency and completeness, the long-term series were screened for missing values, temporal discontinuities, and internal inconsistencies using standard quality-control procedures. This screening was applied solely to verify the temporal stability and reliability of the TSMS time series; no external datasets or reanalysis products were incorporated into the U2 Index calculations.
Spatial representativeness was maintained by using provincial boundaries derived from Thiessen polygons, which approximate the effective spatial domain of meteorological stations. This approach provides a realistic partitioning of Türkiye’s climatic regions, especially in areas where station density varies with topography and population distribution.
For visualization and pattern interpretation, 12 representative provinces were selected: Adana, Konya, Istanbul, Kars, Rize, Antalya, Bursa, Amasya, Bitlis, Eskişehir, Şanlıurfa, and Canakkale. These provinces were chosen to reflect the full range of Türkiye’s climatic subregions—including Mediterranean, continental, maritime, high-altitude, and transitional zones—and to demonstrate the ability of the U2 Index to capture spatial climatic heterogeneity. All spatial analyses, mapping procedures, and pattern extractions were performed using normalized monthly temperature and precipitation series derived from these datasets.
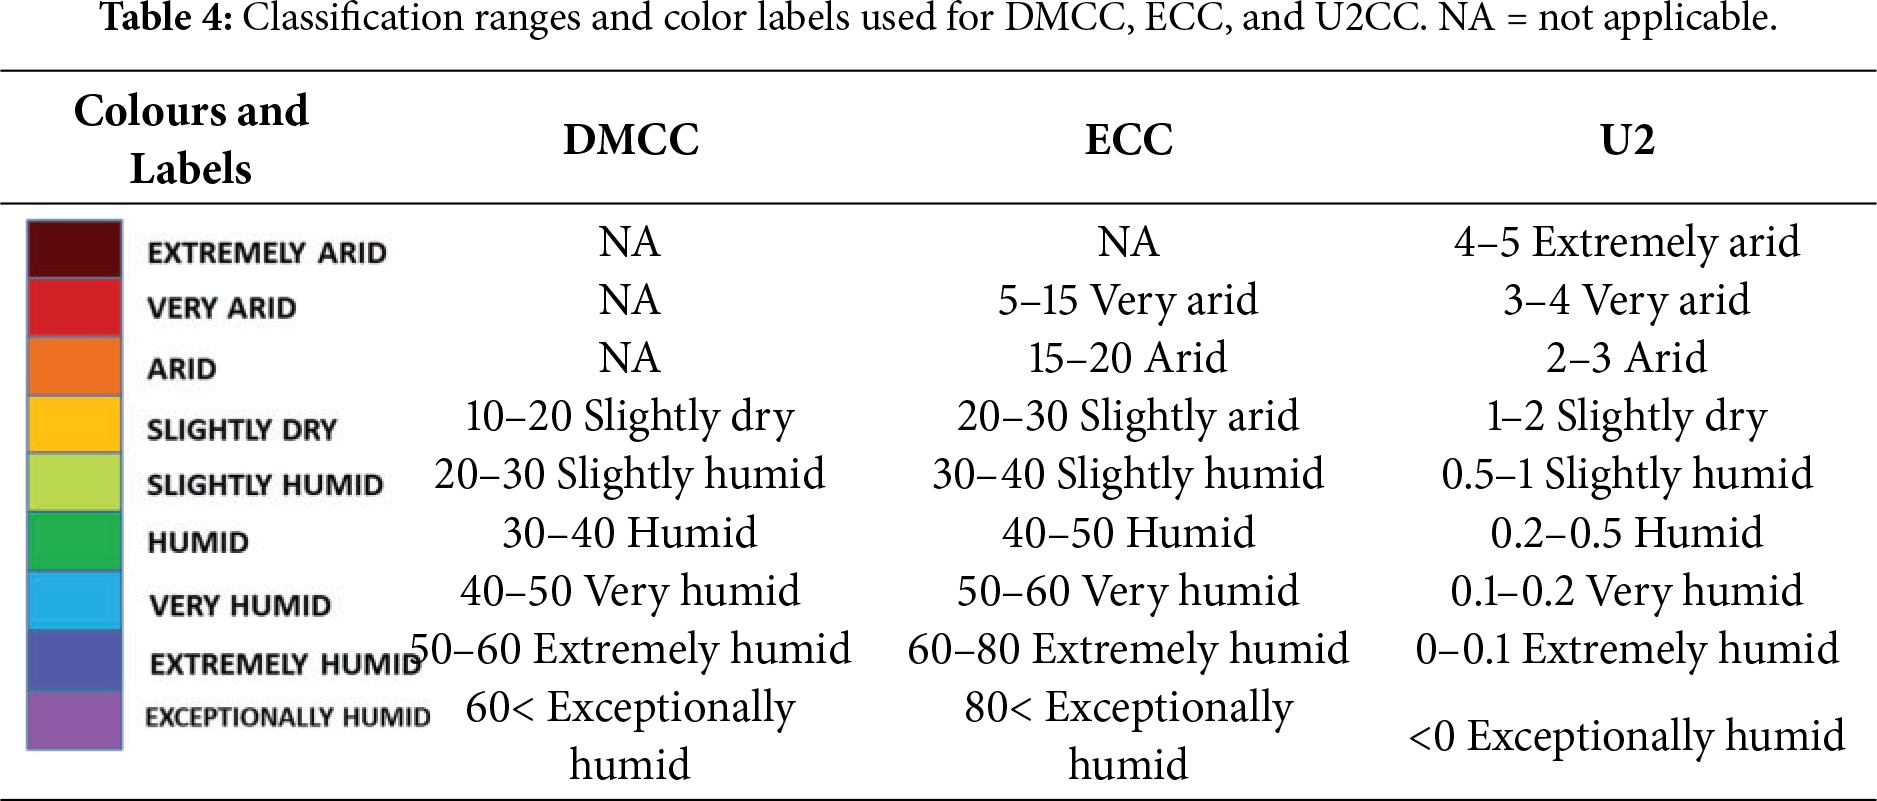
Based on the distribution of normalized U2 Index values across all provinces and the comparison of these values with established thresholds from the De Martonne (DMCC) and Erinç (ECC) classifications, a set of nine climatic classes was defined for the U2 Climate Classification. These classes reflect a continuous gradient from exceptionally humid to extremely arid conditions and are designed to maintain consistency with traditional methods while taking advantage of U2’s normalized, unitless structure. The classification criteria are presented in Table 1.
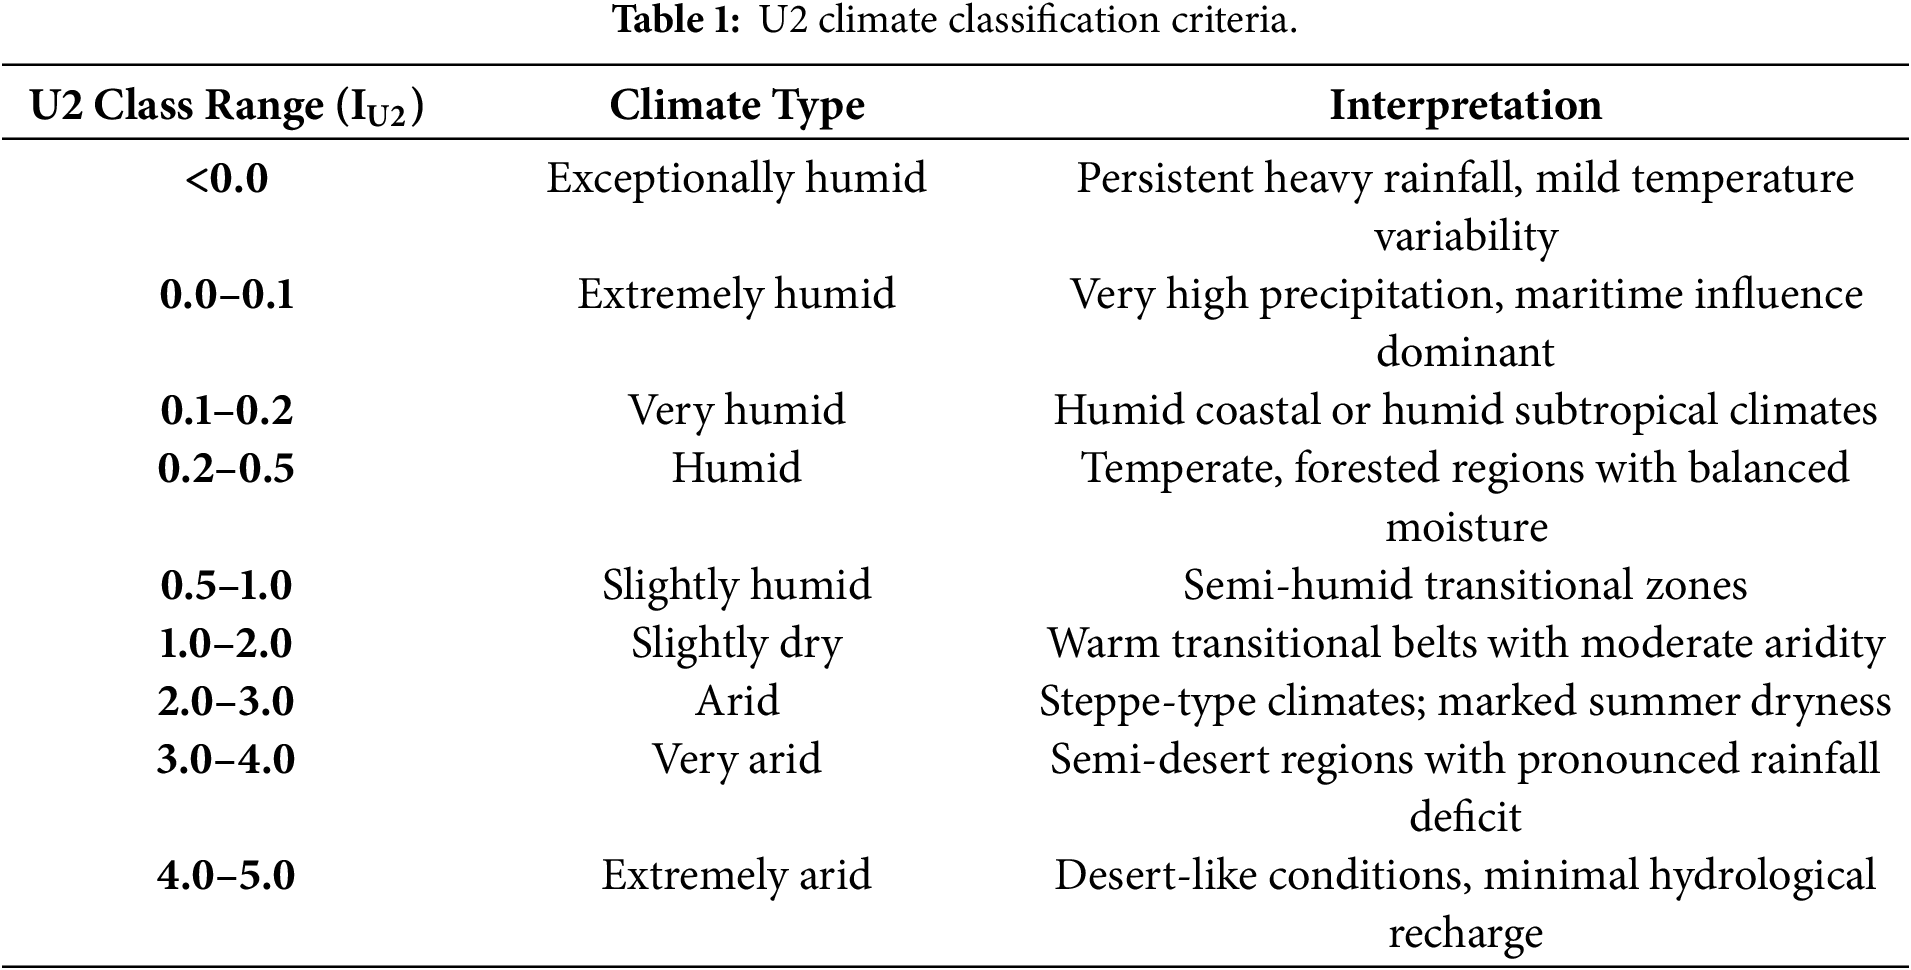
These ranges were calibrated through iterative comparison with DMCC and ECC thresholds and validated against observed spatial patterns of Türkiye’s climatic zones. This approach ensures that the U2 classes retain compatibility with classical aridity assessments while providing improved sensitivity in transitional regions due to their normalized and dimensionless formulation.
To assess internal consistency and evaluate how the U2 Index aligns with established climatic indicators, U2 values were compared with outputs from the De Martonne (DMCC) and Erinç (ECC) classifications using Pearson correlation analysis. This procedure quantifies the degree to which spatial patterns produced by U2 correspond to those generated by classical aridity formulations.
The analysis revealed strong and statistically significant correlations between U2 and both DMCC and ECC across all provinces, indicating that the normalized and unitless structure of U2 preserves the fundamental climatic gradients represented by traditional indices. At the same time, spatial inspection showed that U2 provides greater detail in transitional climate zones, where DMCC and ECC tend to generalize moisture levels due to their dependence on raw temperature–precipitation ratios.
These results confirm that the U2 Index maintains physical coherence with conventional climatological approaches while offering enhanced sensitivity and spatial resolution, thereby supporting its validity as a robust classification tool for Türkiye’s diverse climatic regimes.
The U2 Climate Classification was applied using long-term temperature and precipitation datasets obtained from the Turkish State Meteorological Service (TSMS), covering the period 1927–2023 for all 81 provinces of Türkiye. The methodological workflow consists of five sequential steps: data compilation, temperature transformation, normalization, index calculation, and spatial mapping. These steps are summarized in Fig. 3.
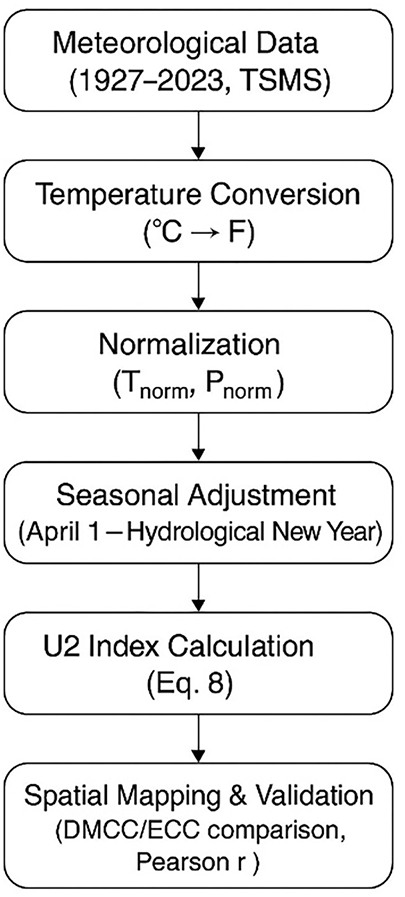
Figure 3: Workflow of the U2 climate classification method.
(1) Data Compilation
For each province, monthly mean temperature (°C) and monthly total precipitation (mm) were compiled into continuous long-term series. Data screening procedures were applied to detect missing values, discontinuities, or anomalous entries, ensuring internal consistency prior to analysis.
(2) Temperature Conversion
To eliminate negative-temperature distortions in subsequent ratio-based calculations, all temperature values were first converted from Celsius to Fahrenheit using Eq. (3):
This transformation prevents zero or negative values from artificially inflating or suppressing normalized ratios, while preserving intermonthly temperature variability.
(3) Normalization
Normalization was performed independently for each province to create a dimensionless representation of climatic variability. Monthly temperature and precipitation values were divided by their respective long-term annual means:
The normalized series were then used to derive the four extreme parameters (
(4) U2 Index Calculation
The U2 Index for each province was calculated using Eq. (8):
This formulation represents the relative displacement between thermal and hydrological extremes, enabling a physically meaningful comparison of climatic balance across Türkiye.
(5) Mapping and Visualization
Normalized U2 values were spatially analyzed to produce the U2 Climate Classification Map. Twelve representative provinces (Adana, Konya, Istanbul, Kars, Rize, Antalya, Bursa, Amasya, Bitlis, Eskişehir, Şanlıurfa, and Çanakkale) were selected to illustrate the diversity of climatic patterns in Türkiye and to demonstrate the applicability of the index across contrasting environments.
Spatial interpolation and classification procedures were performed in a GIS environment, producing maps that highlight regional climatic zones and transitional boundaries. The complete methodological workflow, from data acquisition to mapping, is summarized in Fig. 3.
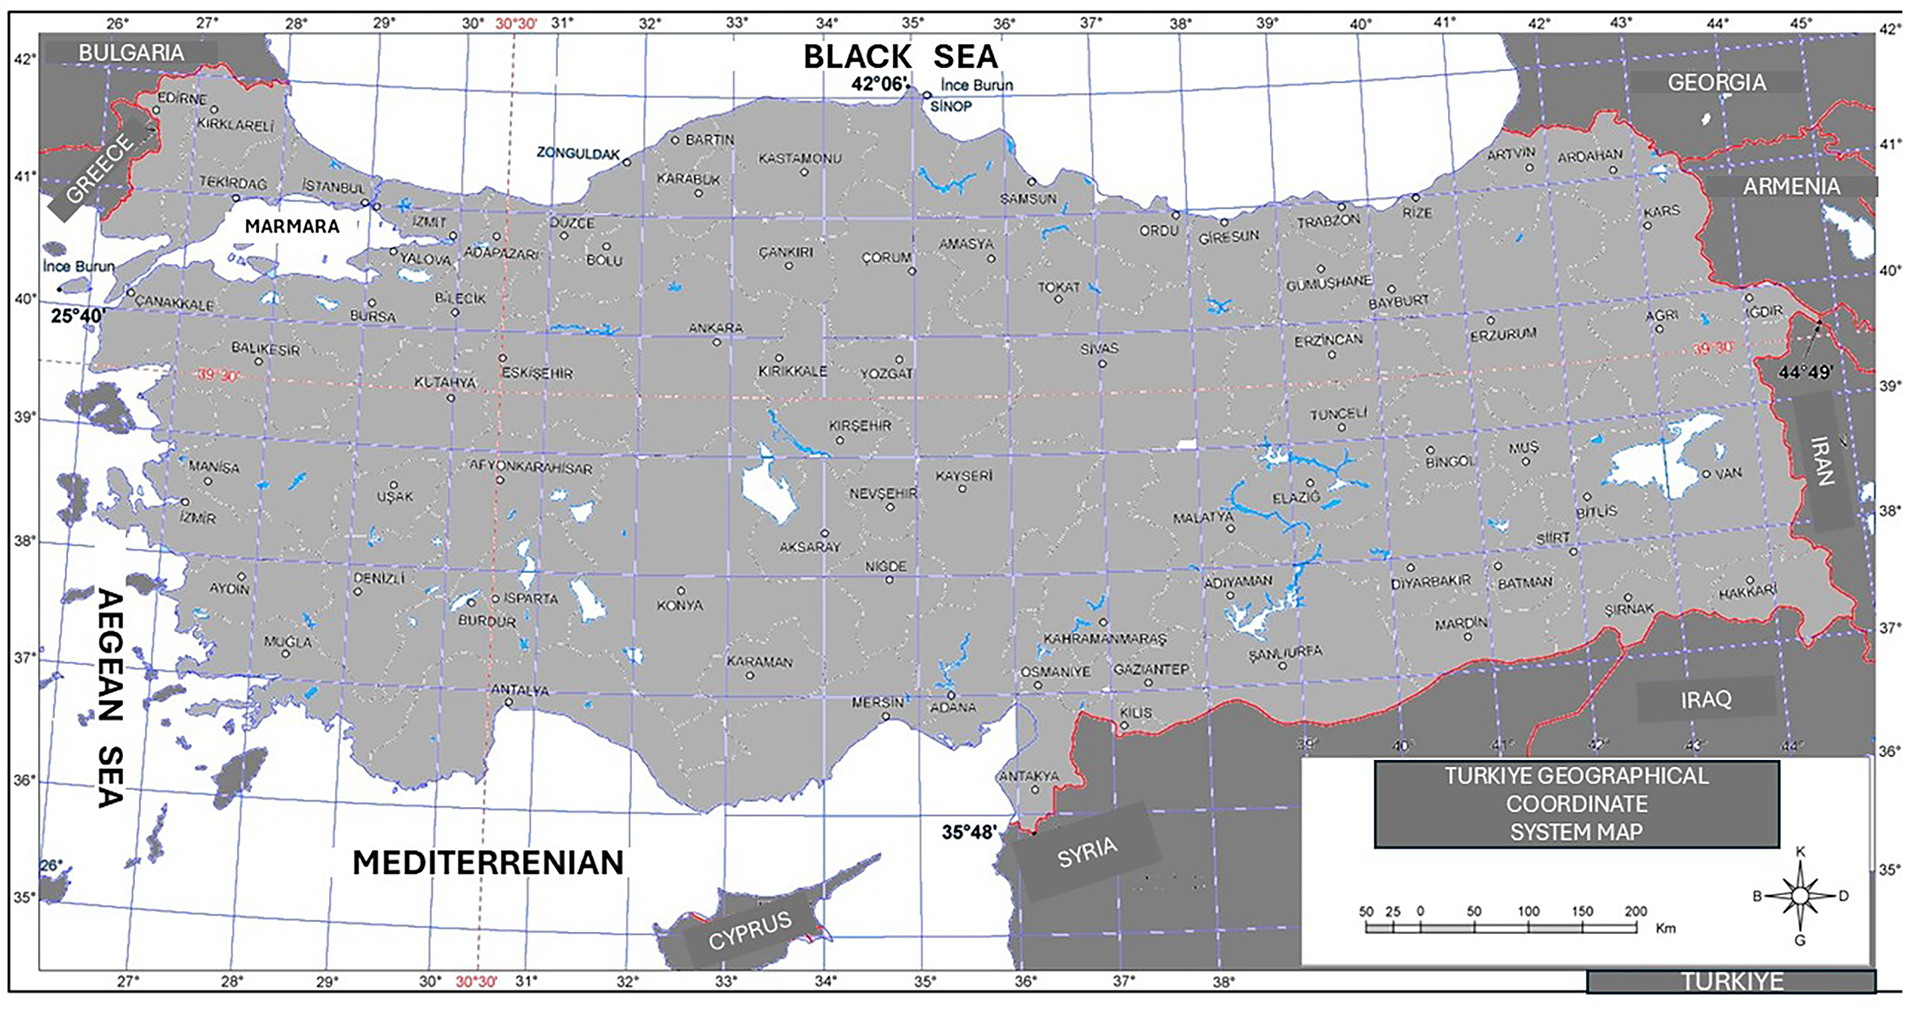
City names and coordinates are provided in Appendix A.
The spatial distribution of climatic conditions across Türkiye was evaluated using the De Martonne (DMCC), Erinç (ECC), and U2 Climate Classification (U2CC) methods. All three indices were applied to long-term meteorological records (1927–2023) from 81 provinces. To illustrate regional variability and to highlight differences between the three classification schemes, twelve representative provinces—Adana, Konya, Istanbul, Kars, Rize, Antalya, Bursa, Amasya, Bitlis, Eskişehir, Şanlıurfa, and Çanakkale—were selected as reference locations. These provinces encompass a wide range of hydro-climatic conditions, including humid coastal regions, continental interiors, high-elevation zones, and transitional belts.
Overall, the results demonstrate that while the DMCC and ECC methods reproduce Türkiye’s broad climatic divisions, they tend to generalize conditions in transitional regions due to their dependence on raw precipitation–temperature ratios. In contrast, the U2 Index, with its normalized and unitless structure, provides clearer gradients and enhanced spatial sensitivity, particularly in semi-arid and continental transition zones of Central and Eastern Anatolia.
Across the twelve reference provinces, U2CC successfully captures the offset between thermal and hydrological extremes, resulting in a more detailed depiction of regional aridity and humidity patterns. The classification outputs show a strong correspondence with DMCC and ECC in the identification of humid coastal climates (e.g., Rize, Bartın) and arid interior basins (e.g., Konya, Şanlıurfa), while offering improved resolution in areas where traditional indices classify broad regions into a single category. These distinctions become especially evident in provinces such as Bursa, Amasya, and Çanakkale, where U2CC reveals subtle but climatically meaningful differences not captured by DMCC or ECC.
The following subsections present the spatial patterns produced by each method and quantify the similarities and differences among them, supported by Pearson correlation analysis and mapping comparisons.
3.1 Comparative Evaluation of DMCC, ECC, and U2CC
The comparative performance of the De Martonne (DMCC), Erinç (ECC), and U2 Climate Classification (U2CC) methods is summarized in Table 2. The three indices exhibit distinct sensitivities to temperature, precipitation, and seasonal variability due to differences in their mathematical structures and normalization approaches.
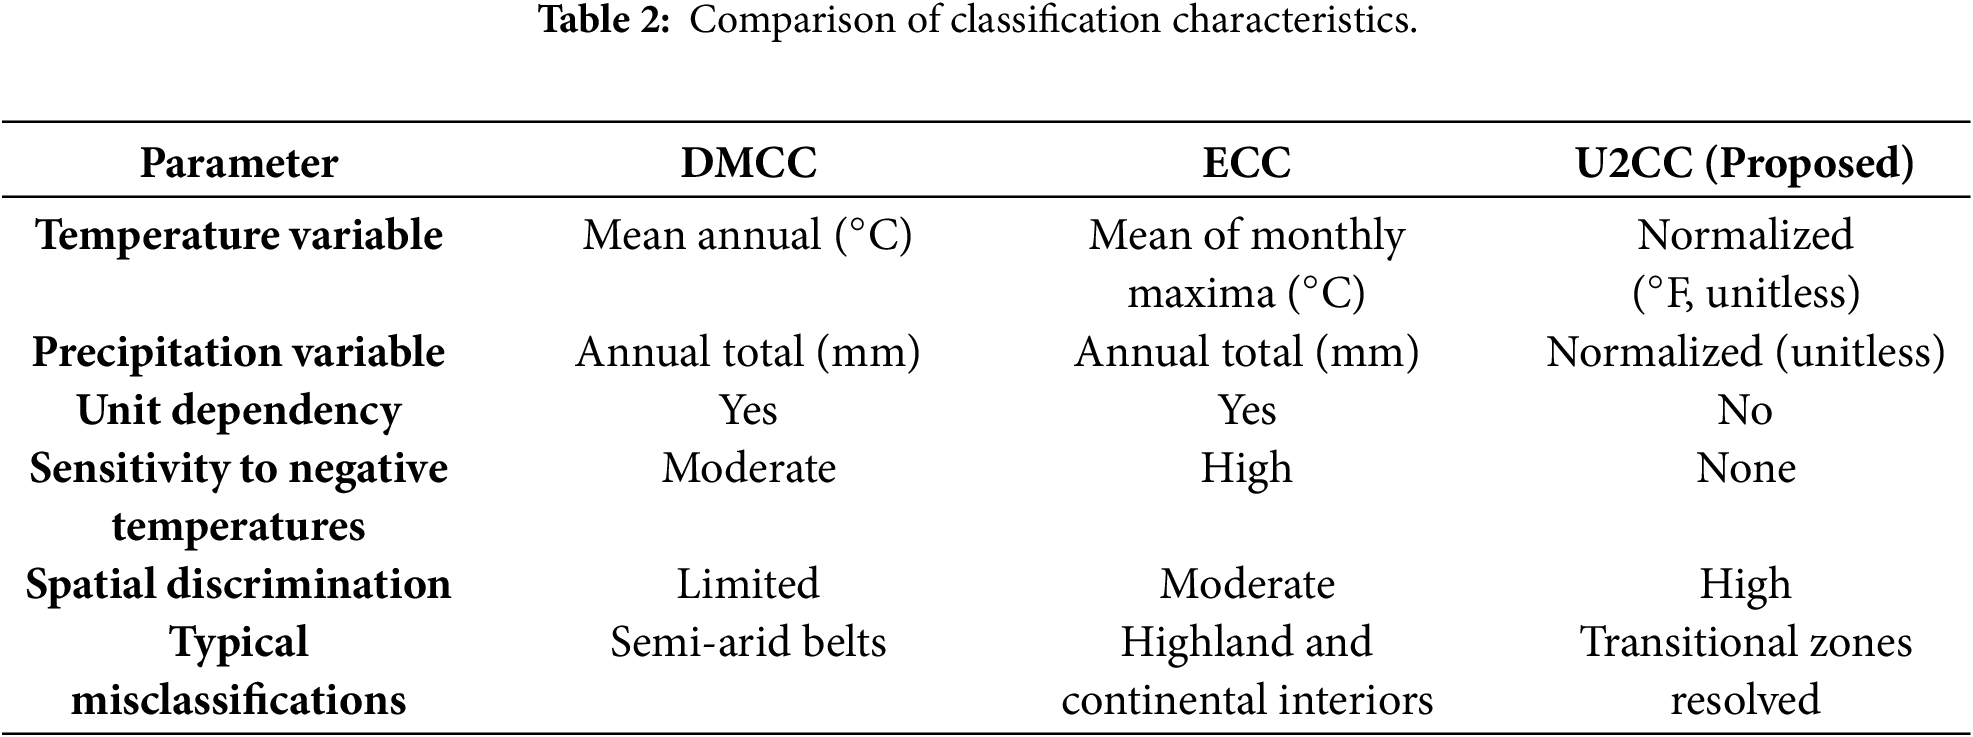
U2CC uses temperature values converted from °C to °F during preprocessing; however, the final index is fully dimensionless.
Across Türkiye, DMCC and ECC generally reproduce the large-scale climatic divisions but tend to oversimplify conditions in semi-arid and sub-humid regions due to their reliance on raw temperature–precipitation ratios. ECC partially improves warm-season sensitivity by incorporating monthly maximum temperatures, yet both classical indices remain constrained by unit dependency and unequal rainfall distribution.
In contrast, U2CC exhibits greater spatial discrimination, particularly in regions with sharp thermal and hydrological gradients such as Central Anatolia, Eastern Anatolia, and Southeastern Türkiye. Because U2CC employs normalized, unitless parameters, it captures the relative displacement between temperature and precipitation extremes more effectively than DMCC or ECC.
For example, in Konya Province, DMCC yields a broadly defined “semi-arid” classification (index ≈ 12.8), whereas U2CC identifies an arid–semi-arid transition zone, aligning more closely with observed water balance characteristics and long-term drought tendencies. Similar refinements appear in transitional climates such as Bursa, Eskişehir, and Amasya, where U2CC differentiates subtle regional contrasts that DMCC and ECC classify identically.
Overall, the comparative evaluation confirms that the U2 Index minimizes classification bias introduced by temperature units, seasonal asymmetry, and rainfall variability, thereby providing a more internally consistent and spatially sensitive representation of Türkiye’s climatic patterns.
The spatial distribution maps produced by the three climate classification methods (Figs. 4–6) reveal significant methodological differences in how Türkiye’s climatic zones are delineated. Although all methods identify the broad humid–arid contrast between coastal and inland regions, their spatial sensitivities and transitional boundaries vary markedly.
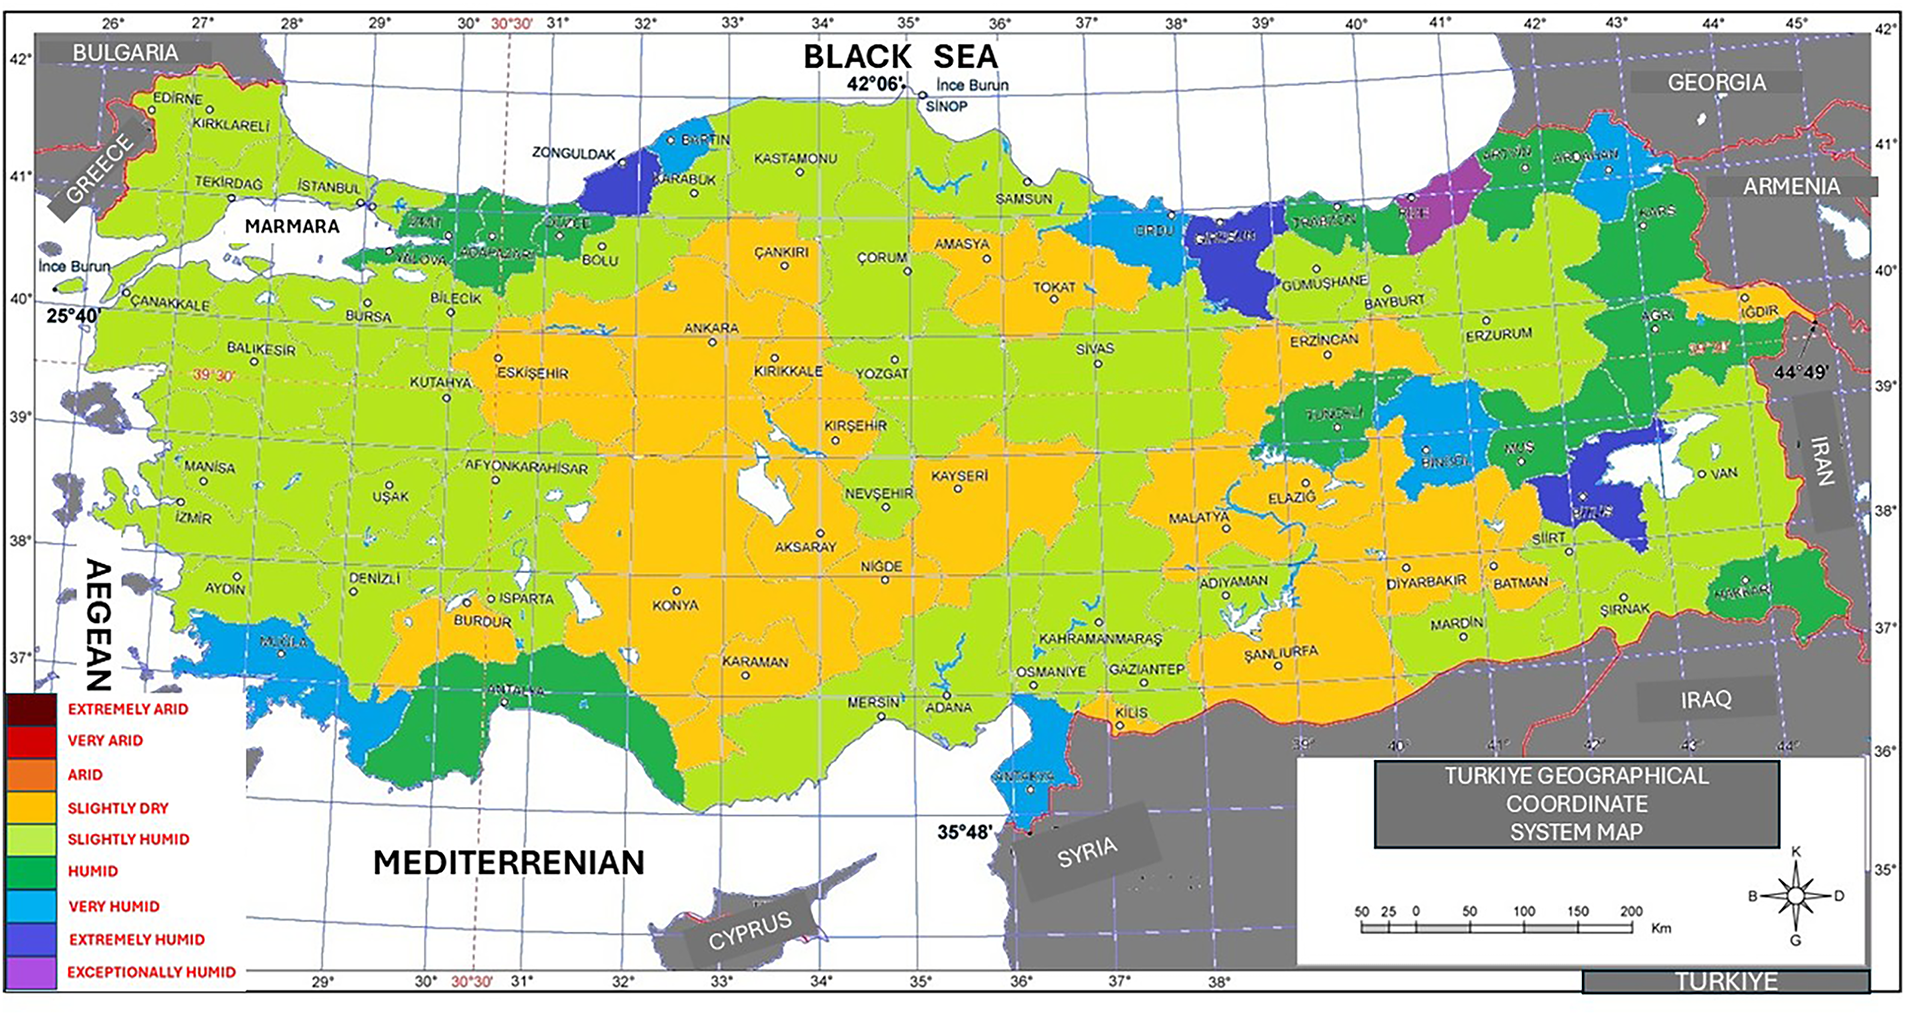
Figure 4: Spatial distribution of DMCC climatic zones in Türkiye (1927–2023).
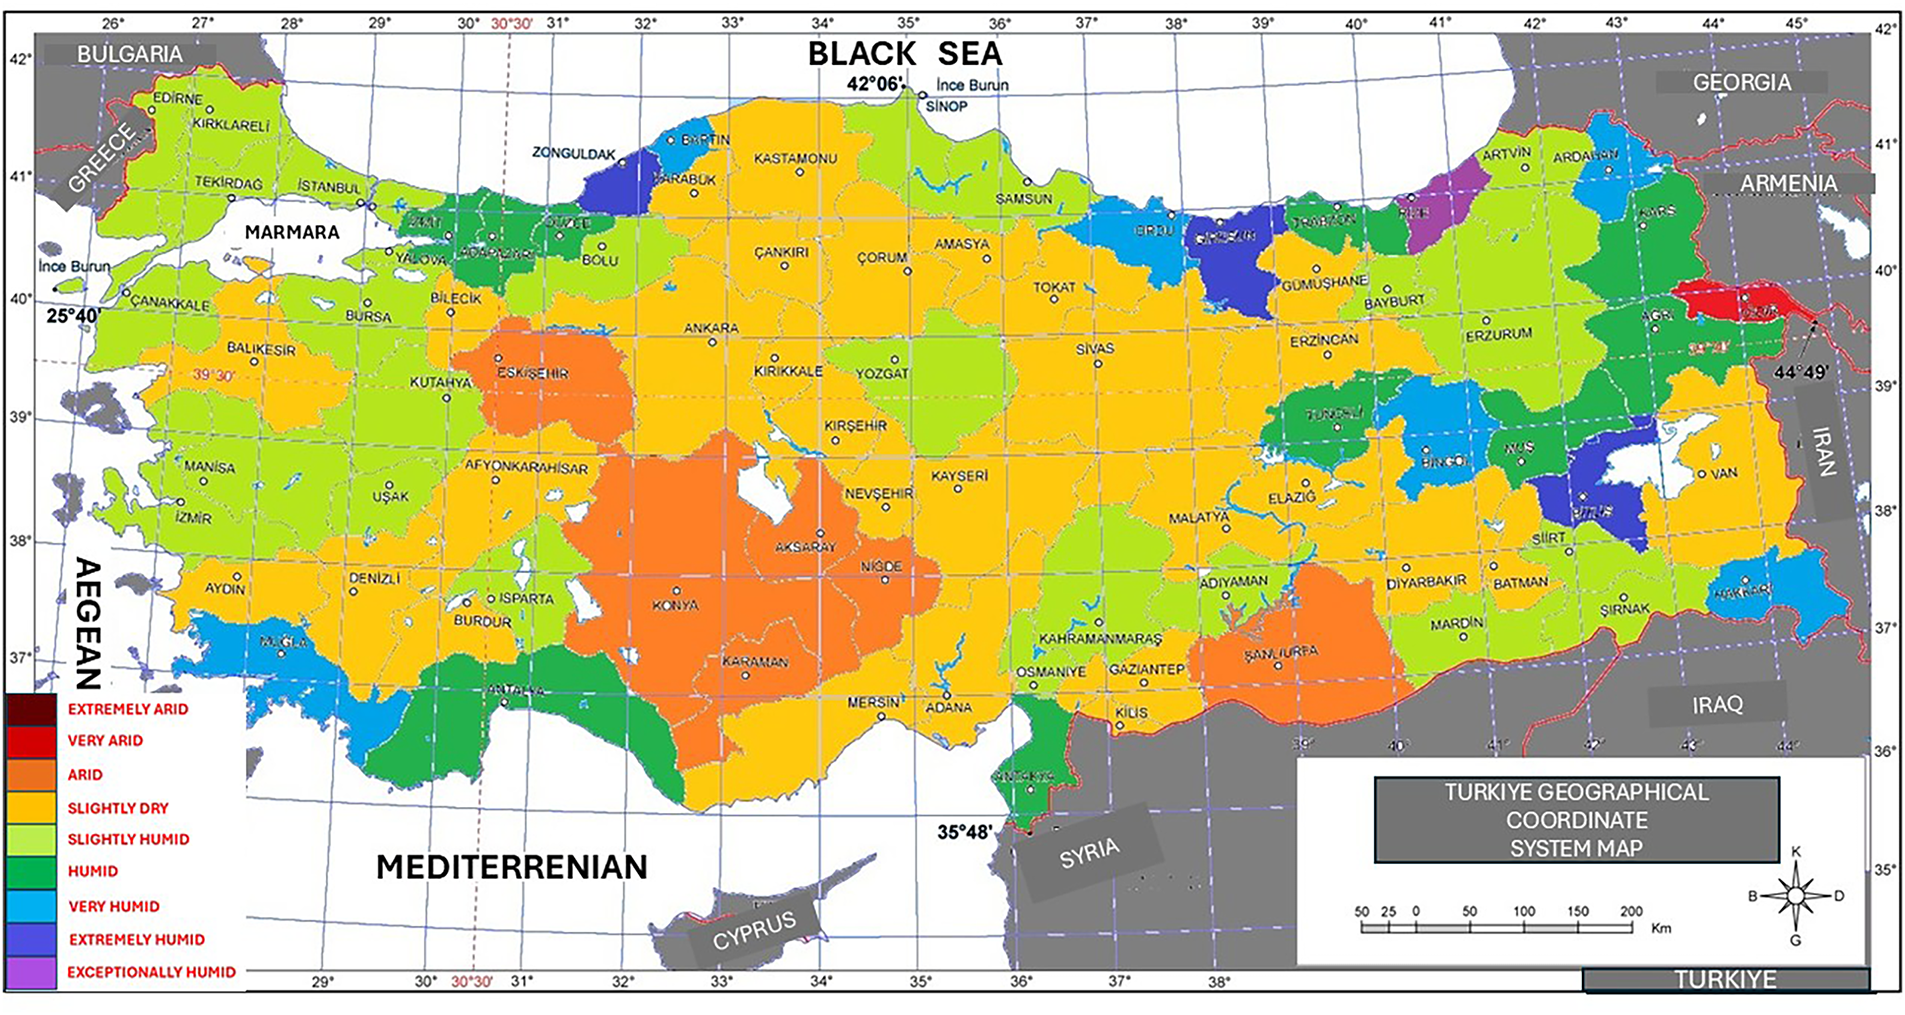
Figure 5: Spatial distribution of ECC climatic zones in Türkiye (1927–2023).
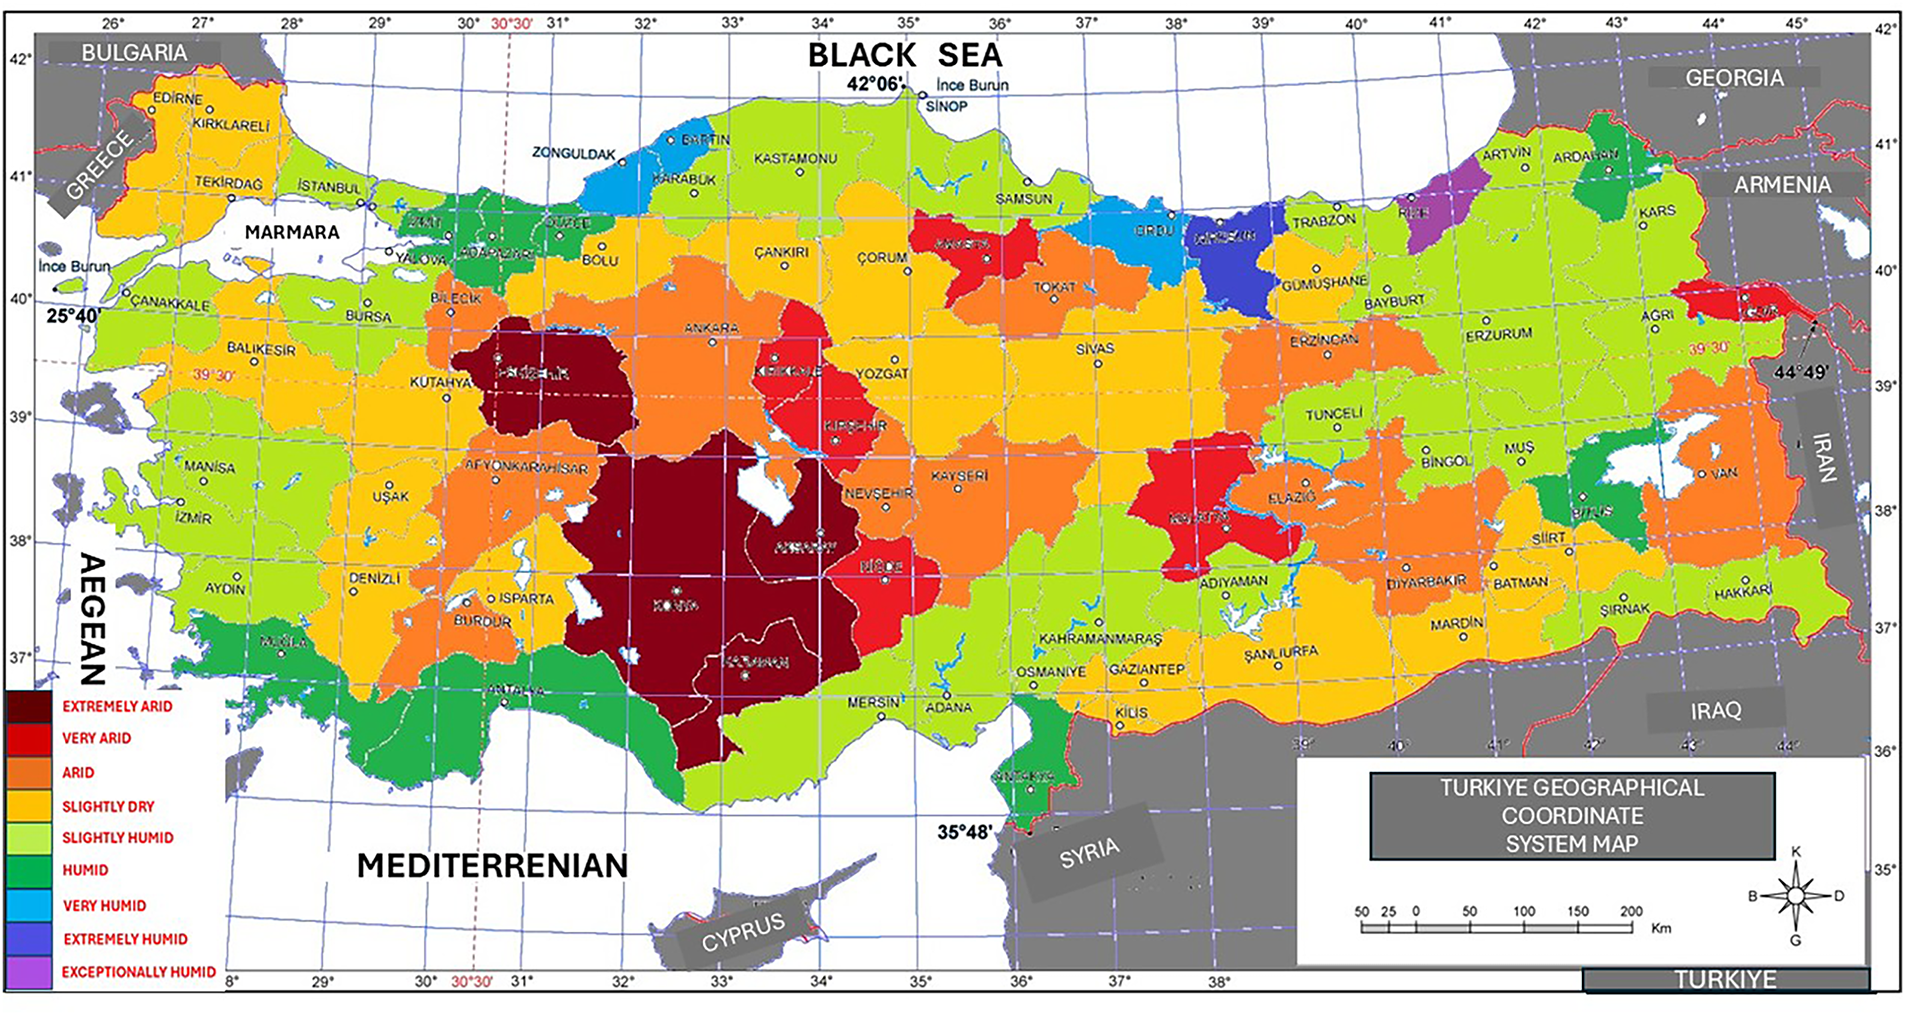
Figure 6: Spatial distribution of U2CC climatic zones in Türkiye (1927–2023).
DMCC Spatial Patterns
The DMCC map (Fig. 4) emphasizes large-scale continental aridity, particularly across Central Anatolia, Eastern Anatolia, and Southeastern Türkiye. However, the method tends to overestimate semi-arid conditions in the Aegean hinterland and interior basins due to its reliance on mean annual temperature and total precipitation. As a result, several regions with moderate winter rainfall—such as inner Aydın, Uşak, and parts of Afyon—are classified as more arid than their hydrological regimes suggest.
ECC Spatial Patterns
The ECC map (Fig. 5), which incorporates the mean of monthly maximum temperatures (TOM), yields slightly more humid classifications along the Aegean, Marmara, and Black Sea coastal belts. This occurs because TOM increases the relative contribution of warm-season evaporative demand, indirectly highlighting precipitation-rich coastal regions.
However, ECC underrepresents localized dry zones, particularly in topographically complex areas such as inner Antalya, Malatya, and the depressions of Eastern Anatolia, where sharp precipitation gradients occur over short distances.
U2CC Spatial Patterns
The U2 Climate Classification map (Fig. 6) provides a more balanced and spatially refined representation of Türkiye’s climatic diversity. Because U2CC is based on normalized, unitless temperature and precipitation values, it captures both macro-climatic gradients (coastal humidity vs. continental dryness) and meso-climatic variations driven by topography, elevation, and seasonal moisture fluctuations.
Notably, the U2CC map highlights several transitional belts that classical indices generalize, including:
The Afyon–Konya–Aksaray corridor, where semi-arid and slightly dry conditions alternate;
The Bursa–Bilecik–Eskişehir transitional zone, where U2CC resolves subtle humidity differences;
The Eastern Anatolia highlands, where cold continental and high-elevation patterns are distinguished.
Identification of Six Fundamental Climatic Patterns
The U2CC reveals six characteristic climatic patterns consistent with Türkiye’s established climate divisions (Section 2.3; Fig. 2):
Pattern A—Hot and arid regions: Adana, Şanlıurfa
Pattern T—Warm semi-arid regions: Konya, Afyon
Pattern X—Cold continental regions: Kars, Erzurum
Pattern KB—Humid maritime regions: Rize, Zonguldak
Pattern D—Highland regions with large annual amplitudes: Bitlis, Hakkari
Pattern EX—Extremely humid coastal zones: Giresun, Rize
These representative provinces and their corresponding long-term mean temperature, precipitation, and U2 Index values are provided in Table 3.
Verification of Spatial Patterns
The six patterns identified by U2CC were evaluated against long-term precipitation–temperature time series and were found to be consistent with classical Köppen–Geiger climate types as operationalized in modern, high-resolution datasets [6,7], as well as with observed hydrological behavior (e.g., drought intensity and seasonal moisture deficits) and orographic precipitation regimes characteristic of the Black Sea and Eastern Anatolia [17,18].
Furthermore, a Mann–Kendall trend test (p < 0.05) was applied to assess the statistical significance of long-term climatic tendencies. The results confirm that the spatial variations detected by U2CC reflect persistent regional signals rather than random fluctuations. Color Scales and Classification Intervals
The color codes and class definitions used in the DMCC, ECC, and U2CC maps (Figs. 4–6) are summarized in Table 4, enabling direct cross-method comparison.
3.3 Statistical Consistency and Validation
To evaluate the internal robustness of the U2 Climate Classification, Pearson correlation analyses were conducted between province-level U2 Index values and the outputs of the two classical indices (DMCC and ECC). The results show strong and statistically significant positive correlations between U2 and both DMCC and ECC across Türkiye, confirming that the normalized structure of the U2 Index preserves the fundamental climatic gradients captured by traditional methods.
At the same time, scatter and residual analyses indicate that U2CC maintains distinct classification boundaries, particularly within transitional climatic zones where DMCC and ECC tend to converge despite substantial differences in hydrological or thermal regimes. This demonstrates that U2CC is not merely reproducing the classical schemes but providing a refined differentiation that reflects real spatial variability.
Cross-validation of the mapped classifications further confirms that U2CC aligns with observed patterns of climatic organization:
Arid and semi-arid regimes remain concentrated in Central and Southeastern Anatolia,
Humid regimes dominate the Black Sea and western coastal regions,
Highland climates of Eastern Anatolia remain distinct,
while U2CC offers sharper transitions and more consistent sub-regional boundaries compared with DMCC and ECC.
These findings collectively demonstrate that the U2 Index is statistically coherent with established climatological frameworks while improving spatial sensitivity and classification reliability.
1. The U2 Climate Classification provides a scale-independent, unitless framework, eliminating temperature-unit bias and reducing the tendency of DMCC and ECC to overclassify humid areas.
2. Normalization of temperature and precipitation enhances comparability across provinces with contrasting climatic ranges, enabling a consistent interpretation of aridity–humidity gradients.
3. The Seasonal New Year (April 1) aligns the classification with Türkiye’s hydrological and phenological cycles, improving the representation of spring–summer climatic transitions.
4. Six characteristic climatic patterns (A, T, X, KB, D, EX) identified through U2CC capture both macro-climatic divisions and meso-scale regional variations more effectively than classical indices.
5. Spatial analysis shows that U2CC refines transitional zones, offering clearer boundaries between humid, semi-humid, and semi-arid regions—particularly in Central and Western Anatolia.
The U2 Climate Classification provides a versatile, transferable, and physically meaningful tool for climatic assessment. Its unitless and normalization-based formulation enables integration into:
Regional planning and zoning,
Agricultural suitability and drought-risk assessments,
Water-resource management frameworks,
Climate-risk modeling and environmental monitoring,
Comparative studies across countries or datasets, without the need to adjust class thresholds.
Because U2CC provides enhanced sensitivity within transitional climatic boundaries, it offers improved diagnostic capability for identifying regions vulnerable to desertification, hydrological imbalance, and climate-induced stress. This makes U2CC a valuable complement—not a replacement—to existing classification systems, especially in regions undergoing rapid climatic change.
The findings of this study underscore the need to re-evaluate classical climate classification indices that rely on dimensional temperature–precipitation ratios. Although the De Martonne and Erinç indices have long provided valuable frameworks for climate zoning in Türkiye, both approaches exhibit structural limitations arising from their dependence on Celsius-based temperature values and unnormalized precipitation totals. These constraints become particularly evident in regions characterized by large seasonal thermal amplitudes and spatially heterogeneous rainfall regimes.
The methodological design of the U2 Climate Classification is consistent with this recent literature trend, which increasingly favors normalization-based, structure-aware climate classification systems to improve comparability and interpretability across diverse climatic regimes [14–16].
Historical attempts to address such limitations, most notably Thornthwaite’s moisture balance framework and later modifications by Feddema, emphasized the importance of linking climatic classification to physical processes such as evapotranspiration [19]. However, these indices still rely on dimensional variables, which complicates regional comparisons in countries with strong continentality and high interannual variability. In contrast, the U2 Climate Classification (U2CC) introduces a scale-independent, normalization-based approach that operationalizes temperature and precipitation as dimensionless quantities, thereby enhancing comparability across both spatial and temporal domains.
The U2CC framework resolves three key limitations of traditional indices.
First, it removes temperature-unit dependency, ensuring consistent results regardless of whether data are expressed in Celsius or Fahrenheit. Second, normalization allows meaningful comparison across provinces spanning humid, sub-humid, semi-arid, and arid regimes without requiring empirical adjustment factors. Third, by relating thermal and hydrological extremes (Eq. (8)), U2CC captures climatic elasticity more dynamically than mean-based formulations, enabling more realistic representation of seasonal tension between moisture availability and evaporative demand.
Spatial comparisons demonstrate that U2CC replicates broad-scale climatic patterns identified in Köppen–Geiger classifications while providing enhanced resolution in transitional zones. This improvement aligns with recent updates to the Köppen–Geiger maps [7], highlighting the potential of normalization-based indices to complement modern reclassification efforts. In provinces such as Konya, Şanlıurfa, and Aksaray—frequently inconsistently categorized by DMCC or ECC—the U2CC accurately identifies arid-to-semi-arid transition belts by capturing the magnitude and timing of monthly extremes, thereby offering a more refined representation of regional climatic structure in Central Anatolia.
The adoption of a Seasonal New Year on April 1 further strengthens the interpretive capacity of U2CC by aligning the classification with Türkiye’s hydrological and phenological cycles rather than arbitrarily imposed calendar boundaries. This adjustment enhances the detection of spring–summer transitions—critical periods for agricultural planning, drought monitoring, and ecosystem functioning.
Despite its advantages, certain limitations of the current implementation should be acknowledged. The U2 Index was applied at the provincial scale; thus, microclimatic variability associated with elevation gradients, coast–inland contrasts, and local land–atmosphere interactions may remain undetected. Future applications can address this by incorporating high-resolution gridded datasets such as ERA5 or CRU TS, which would improve spatial precision without altering the index structure. Moreover, integration with remote-sensing products (e.g., NDVI) or hydrological indices (e.g., SPI) offers a promising avenue for validating U2CC against vegetation response, soil moisture dynamics, and multi-scalar drought indicators. Similar normalization-based approaches emphasizing hydrological drought consistency support the conceptual rationale behind this integration [20].
Overall, the conceptual simplicity, dimensionless structure, and physical coherence of U2CC make it broadly applicable beyond Türkiye. Because it requires no unit-specific calibration or region-specific adjustment, the index can be readily applied to other climates featuring strong seasonal contrasts or distinct hydrological regimes. As climate change continues to alter precipitation and temperature dynamics worldwide, normalization-based frameworks such as U2CC offer a robust and transferable tool for modern climatological classification.
This study presents the U2 Climate Classification (U2CC), a normalization-based and unitless climatic index designed to overcome the dimensional inconsistencies inherent in classical classification schemes. By expressing temperature and precipitation as relative, scale-free variables, U2CC provides an internally consistent and physically meaningful framework that enables objective comparison across regions with contrasting climatic regimes.
Applied to Türkiye’s long-term meteorological dataset (1927–2023), the U2CC successfully identifies six distinct climatic patterns that align closely with established macro- and microclimates. Unlike the De Martonne and Erinç indices, which rely on raw temperature–precipitation ratios, U2CC eliminates unit dependency and captures the thermal–hydrological offset more effectively. As a result, it offers enhanced spatial differentiation, particularly in transition zones across Central Anatolia, Eastern Anatolia, and Southeastern Türkiye, where classical indices frequently oversimplify classification boundaries.
The simplicity, transparency, and transferability of the U2CC framework make it a useful tool for modern climatological research. Because the method operates on normalized values and requires no empirical regional calibration, it can be readily integrated into global datasets, cross-country comparative studies, agricultural zoning efforts, hydrological assessments, and climate change impact analyses.
Future research should focus on applying the U2CC using high-resolution gridded datasets and coupling it with ecological and hydrological indicators—such as NDVI, SPI, soil moisture products, and land-surface temperature anomalies—to further substantiate its diagnostic value and ecological relevance. Such extensions will enable a more detailed understanding of climate–vegetation interactions and drought sensitivity across complex landscapes.
In conclusion, the U2 Climate Classification represents a modern, objective, and scalable alternative to traditional climate indices, offering a robust pathway for assessing climatic diversity not only in Türkiye but also in other regions with pronounced spatial and seasonal variability.
Acknowledgement: The authors express their sincere gratitude to the Turkish State Meteorological Service (TSMS) for providing access to long-term meteorological datasets.
Funding Statement: The authors received no specific funding for this study.
Author Contributions: The authors confirm contribution to the paper as follows: Erdinç Uslan developed the U2 Climate Classification method, performed the data analysis, generated the figures and tables, and wrote the manuscript. Emin Ulugergerli provided scientific supervision, contributed to methodological refinement, and reviewed and edited the manuscript. All authors reviewed and approved the final version of the manuscript.
Availability of Data and Materials: Meteorological data used in this study are publicly available from the Turkish State Meteorological Service (TSMS). All analyses and consistency checks were conducted using these observational datasets.
Ethics Approval: Not applicable.
Conflicts of Interest: The authors declare no conflicts of interest.
Appendix A List of Representative Cities
References
1. IPCC. Climate change 2023: synthesis report. Contribution of working groups I, II and III to the sixth assessment report of the intergovernmental panel on climate change [Internet]. Geneva, Switzerland: IPCC; 2023 [cited 2025 Dec 1]. Available from: https://www.ipcc.ch/report/ar6/syr/. [Google Scholar]
2. Arca D, Keskin Citiroglu H. Determining climate classifications and producing climate border maps with GIS of Mugla province on the southern Aegean Sea coast of Türkiye. Theor Appl Climatol. 2024;155(7):5745–57. doi:10.1007/s00704-024-04954-2. [Google Scholar] [CrossRef]
3. Koycegiz C, Buyukyildiz M. Analysis of seasonal rainfall variability with innovative graphical methods of Konya Closed Basin, Türkiye. Phys Chem Earth Parts A/B/C. 2024;136(3):103767. doi:10.1016/j.pce.2024.103767. [Google Scholar] [CrossRef]
4. UNEP. World Atlas of Desertification. 2nd. London, UK: Arnold; 1997. [Google Scholar]
5. Köppen W. Versuch einer Klassifikation der Klimate, vorzugsweise nach ihren Beziehungen zur Pflanzenwelt. Geogr Z, 1900:593–611. doi:10.1007/978-3-7091-9519-2_11. [Google Scholar] [CrossRef]
6. Peel MC, Finlayson BL, McMahon TA. Updated world map of the Köppen-Geiger climate classification. Hydrol Earth Syst Sci. 2007;11(5):1633–44. doi:10.5194/hess-11-1633-2007. [Google Scholar] [CrossRef]
7. Beck HE, Zimmermann NE, McVicar TR, Vergopolan N, Berg A, Wood EF. Present and future Köppen-Geiger climate classification maps at 1-km resolution. Sci Data. 2018;5(1):180214. doi:10.1038/sdata.2018.214. [Google Scholar] [PubMed] [CrossRef]
8. Trewartha GT. An introduction to climate. 3rd ed. New York: McGraw-Hill; 1954. [Google Scholar]
9. de Martonne E. Nouvelle carte mondial de l’indice d’aridité. Geo. 1942;51(288):241–50. doi:10.3406/geo.1942.12050. [Google Scholar] [CrossRef]
10. Thornthwaite CW. An approach toward a rational classification of climate. Geogr Rev. 1948;38(1):55–94. doi:10.2307/210739. [Google Scholar] [CrossRef]
11. Erinc S. The climates of Turkey according to thornthwaite’s classifications. Ann Assoc Am Geogr. 1949;39(1):26. doi:10.2307/2561098. [Google Scholar] [CrossRef]
12. Wilson D, Hisdal H, Lawrence D. Has streamflow changed in the Nordic countries? –Recent trends and comparisons to hydrological projections. J Hydrol. 2010;394(3–4):334–46. doi:10.1016/j.jhydrol.2010.09.010. [Google Scholar] [CrossRef]
13. Yılmaz E, Çiçek İ. Türkiye’nin detaylandırılmış Köppen-Geiger iklim bölgeleri. J Hum Sci. 2018;15(1):225–42. (In Turkish). doi:10.14687/jhs.v15i1.5040. [Google Scholar] [CrossRef]
14. Akrami N, Ziarati K, Dev S. Graph-based local climate classification in Iran. Int J Climatol. 2022;42(3):1337–53. doi:10.1002/joc.7306. [Google Scholar] [CrossRef]
15. Feng Y, Du S, Fraedrich K, Zhang X. Fine-grained climate classification for the Qaidam Basin. Atmos. 2022;13(6):913. doi:10.3390/atmos13060913. [Google Scholar] [CrossRef]
16. Wang R, Wang M, Zhang Z, Xing J, Liu X. LLNet: lightweight network with a channel and spatial attention mechanism for local climate zone classification from Sentinel-2 image. Int J Climatol. 2023;43(3):1543–60. doi:10.1002/joc.7932. [Google Scholar] [CrossRef]
17. Türkeş M. Spatial and temporal analysis of annual rainfall variations in Turkey. Int J Climatol. 1996;16(9):1057–76. doi:10.1002/(SICI)1097-0088(199609)16:91057::AID-JOC75>3.0.CO;2-D. [Google Scholar] [CrossRef]
18. Xu J, Powell. Dynamical downscaling precipitation over Southwest Asia: impacts of radiance data assimilation on the forecasts of the WRF-ARW model. Atmos Res. 2012;111:90–103. doi:10.1016/j.atmosres.2012.03.005. [Google Scholar] [CrossRef]
19. Feddema JJ. A revised thornthwaite-type global climate classification. Phys Geogr. 2005;26(6):442–66. doi:10.2747/0272-3646.26.6.442. [Google Scholar] [CrossRef]
20. Nalbantis I, Tsakiris G. Assessment of hydrological drought revisited. Water Resour Manag. 2009;23(5):881–97. doi:10.1007/s11269-008-9305-1. [Google Scholar] [CrossRef]
Cite This Article
 Copyright © 2026 The Author(s). Published by Tech Science Press.
This work is licensed under a Creative Commons Attribution 4.0 International License , which permits unrestricted use, distribution, and reproduction in any medium, provided the original work is properly cited.
 Downloads
 Citation Tools