
 Submit a Paper
 Propose a Special lssue
 Open Access
ARTICLE
Historical Transportation GIS (1880–2020) for Decision Making in Sustainable Development Goals
Department of Geography, Universidad Autónoma de Madrid, Madrid, Spain
* Corresponding Author: Bárbara Polo-Martín. Email:
(This article belongs to the Special Issue: Innovative Applications and Developments in Geomatics Technology)
Revue Internationale de Géomatique 2026, 35, 53-78. https://doi.org/10.32604/rig.2026.071069
Received 30 July 2025; Accepted 07 January 2026; Issue published 05 February 2026
 View Full Text
 Download PDF
Abstract
The expansion of transportation networks, including railways and ports, has been a major force driving urban growth, mobility, and socio-economic transformations since the Industrial Revolution. This study utilizes Historical Geographic Information Systems to examine the global evolution of transportation infrastructure, focusing on railways and ports, from 1880 to 2020. The dataset enables a multidimensional analysis of how transportation systems have shaped cities, influenced regional development, and helped to make possible sustainability efforts. By offering insights into transport accessibility, land-use changes, and economic connectivity, the study provides a robust empirical foundation for understanding long-term infrastructure dynamics. While the dataset supports policy-relevant applications—particularly in relation to sustainability and Sustainable Development Goals (SDG)-related targets—its primary contribution lies in the methodological framework and analytical potential it offers for future research. The integration of historical transport data into urban planning and decision-making processes can help design more resilient, inclusive, and efficient mobility systems, aligned with sustainable development principles.Keywords
The historical progression of transportation infrastructure is closely tied to industrialization and urbanization. In regions such as the United Kingdom [1] and later the United States [2], industrialization in the early 19th century marked a shift from small-scale artisanal production to steam-powered factory systems. This transformation relied heavily on the advancement of transportation networks. These systems were not merely facilitators of industrial expansion—they actively shaped economic landscapes by establishing interconnected corridors for the movement of people, goods, and services, as well as influencing patterns of urban development.
During the initial phases of industrialization, steamships and railways played a pivotal role in linking production centers with markets, accelerating trade and urban development [3–5]. By the mid-to-late 19th century, manufacturing had scaled up significantly, becoming increasingly mechanized and extending across multiple industries. This period, often described as the “steam revolution”, saw rapid improvements in the speed, efficiency, and scope of transport systems. Railways and ports worked in tandem, forming interconnected networks that facilitated long-distance trade, labor migration, and urban expansion.
As industrial economies grew, so did the demand for efficient and interconnected transport infrastructure. Cities emerging as industrial hubs developed concentrated and strategically connected transport systems—such as urban railways, streetcars, and improved roadways—that facilitated trade and supported expanding urban populations. By the early 20th century, transportation networks had evolved into sophisticated, integrated systems that laid the foundation for modern urban planning and infrastructure strategies [6]. Seaports, in particular, had to continuously upgrade their facilities to remain competitive [4], with major hubs like Rotterdam and the Ruhr region extending their reach into inland markets.
Transport networks have played a transformative role in shaping economic and social structures worldwide [7]. However, despite growing interest in the long-term impacts of transport infrastructure, existing studies are often limited in geographic or temporal scope—focused on individual countries or short historical periods. There is currently no standardized, global dataset that allows for a comparative, longitudinal analysis of how railways have shaped urban growth and spatial inequality across regions. This gap prevents a fuller understanding of transportation’s role in long-term socio-economic development and its relevance to global policy agendas like the Sustainable Development Goals (SDGs). To address this, our research explores the question: How did historical transport access between 1880 and 2020 influence urban population growth and transport equity in different regions, and what lessons can be drawn for achieving SDGs today?? By narrowing the scope to certain regions and timeframes, we aim to provide a more grounded analysis of how transport networks have shaped urbanization and accessibility, offering insights directly relevant to contemporary sustainable development policy.
The relationship between transport infrastructure and urban development has long been a focus of geographic and planning scholarship. However, recent research emphasizes the importance of transport equity—the fair distribution of mobility resources—as a key dimension of sustainable development. Equity in transport is not only about physical access to infrastructure but also about affordability, safety, and inclusion, particularly for historically marginalized populations. Drawing on concepts of spatial justice [8,9] and just urbanism [10,11], this study situates historical railway access within broader debates on infrastructure-led inequality and territorial cohesion.
By integrating historical GIS data with demographic and socio-economic indicators, we aim to assess how early access to transports shaped long-term urban growth and disparities in accessibility. While the study engages with the Sustainable Development Goals (SDGs), its primary contribution lies in the development and application of a global historical GIS database [12–14]. Rather than attempting to directly measure SDG progress, the study provides tools and insights that can inform such assessments, especially in relation to infrastructure equity, urban accessibility, and long-term spatial development. This framing aligns with SDG 9 (Industry, Innovation, and Infrastructure), SDG 10 (Reduced Inequalities), SDG 11 (Sustainable Cities and Communities), and SDG 13 (Climate Action), and allows the manuscript to highlight its strongest aspects—data quality, methodological rigor, and spatial analysis—while maintaining relevance to broader sustainability agendas. We hypothesize that early and continuous access to transport infrastructures is positively associated with long-term urban growth, regional economic integration, and improved accessibility—particularly in relation to SDG priorities such as sustainable urbanization (SDG 11), infrastructure equity (SDG 10), and climate mitigation (SDG 13). The inclusion of equity in this hypothesis reflects a broader shift in transport research toward frameworks that prioritize distributive outcomes and social inclusion. Rather than treating infrastructure as a neutral enabler of development, scholarship has emphasized its role in shaping access to opportunities and reinforcing spatial hierarchies [15–17]. This perspective informs our approach to historical railway analysis, recognizing that transport systems—past and present—are embedded in socio-political contexts that determine who benefits from mobility investments. By situating our hypothesis within this conceptual terrain, we align the study with ongoing debates on transport justice and exclusion and reinforce its relevance to SDG 10 and SDG 11. The existence of historical geospatial databases that documents the expansion of railway systems [18–50], ports and cities [51] over a 140-year period (1880–2020) at the global scale enables spatial and temporal analysis of infrastructures and its broader impacts on urbanization—providing new tools for addressing contemporary challenges such as those outlined in the Paris Agreement [52].
This study advances beyond traditional descriptive approaches by applying empirical, data-driven methods to dynamically analyze the spatial and temporal evolution of transport networks. This study makes two key contributions: first, this study shows the potential of historical transport databases; second, it demonstrates how the analysis of long-term mobility trends, globalization processes, and transportation’s role in shaping modern cities is essential for meeting the SDGs. Historical geospatial databases, like that one of railway expansion, are designed to support research across multiple scales—from global trends to localized case studies—offering insights into the relationship between transportation networks, economic integration, and urban growth.
With the adoption of historical GIS methodologies, researchers can rethink traditional approaches to transportation history and urban development to meet emerging societal needs. This study moves beyond conventional descriptive analyses, providing empirical, data-driven insights that allow for dynamic spatial evaluations of transport networks over time. European railway research has seen extensive digitalization efforts, as evident in studies on [53], Britain [54], France [55], Italy [56], Galicia & Austrian Silesia [57], and Switzerland [58]. Similar efforts have expanded to North America [59], colonial India [60], and Canada [61].
By incorporating Geographic Information Systems [52] into historical transportation research, this study contributes to understand and assess urban planning, infrastructure policy, and global mobility strategies. The findings align with several Sustainable Development Goals (SDGs), emphasizing their relevance for contemporary policy and planning. SDG 9 (Industry, Innovation, and Infrastructure) is supported by offering critical insights into transport infrastructure development and resilience. SDG 11 (Sustainable Cities and Communities) benefits from historical perspectives of railway expansion, aiding the design of efficient, inclusive, and low-emission mobility strategies. SDG 13 (Climate Action) is addressed through lessons drawn from long-term mobility shifts and their environmental impact. Additionally, SDG 10 (Reduced Inequalities) is reflected in the study’s focus on disparities in access to transport infrastructure and related opportunities.
Geographic Information Systems (GIS) are pivotal in advancing the United Nations’ Sustainable Development Goals (SDGs) by enabling the collection, analysis, and visualization of spatial data to inform decision-making across various sectors. This study integrates diverse records—historical maps, demographic data, and infrastructure layouts—into a unified GIS framework that supports robust, spatiotemporal analysis. It offers both a retrospective and forward-looking perspective on transportation’s role in shaping modern societies. The research outlines previous literature, presents its core objectives, details the data and methodology, and visualizes findings through maps, graphs, and statistical analyses. The final section explores future research possibilities, including potential data integrations with socio-economic and environmental datasets to expand interdisciplinary studies.
While this study aspires to provide a global perspective on the evolution of transportation networks and their relationship to urban and socio-economic development, we acknowledge several limitations. Data completeness and precision vary significantly by region. As a result, some analyses rely on broader spatial approximations or assumptions, particularly in regions with limited historical documentation. These constraints are discussed in detail in the following sections.
The development of historical geospatial databases is not a new endeavor, especially in the context of European studies. Nevertheless, the reason for creating a comprehensive global database on the historical expansion of railway networks lies in the increasing demand to support both qualitative and quantitative research on the evolution of infrastructure and urbanization, two domains in which railways have played a fundamental role. When combined with other emerging datasets, such as those documenting ports and population distributions, a truly global railway database unlocks new possibilities for addressing contemporary urban and spatial challenges. With the adoption of historical GIS methodologies, researchers can rethink traditional approaches, like for example during and after COVID pandemic [62,63].
Importantly, research and international policy reports have highlighted the central role of transport infrastructure in achieving the Sustainable Development Goals (SDGs), particularly in relation to access to opportunities, social inclusion, and territorial development [13,14]. For example, SDG 11.2 explicitly calls for access to safe, affordable, accessible, and sustainable transport systems for all, while SDG 9.1 focuses on developing quality, reliable, sustainable, and resilient infrastructure. Transport is recognized as a key facilitator of access to education, employment, and healthcare, and as a driver of social equity and economic growth [14]. The integration of historical transport data into GIS frameworks thus provides a critical foundation for informed decision-making aimed at advancing the SDGs, especially those related to sustainable cities, infrastructure development, and equitable access to mobility.
This section examines how existing research has approached the relationship between socio-economic factors and transportation, while emphasizing the ongoing need for an integrated global historical database. Developing such a database is particularly challenging due to the difficulty of disentangling the evolution of infrastructure from that of urban systems. This task requires a rigorous empirical approach and a clearly defined methodology. Notable contributions by scholars in the last years [64–66] offer valuable methodological frameworks and serve as important references for advancing this type of research.
The potential of a historical geospatial database and its applications across different disciplines has been extensively documented in recent years. In research, Geographic Information Systems have been recognized not only as tools for creating descriptive maps but also repositories for socio-economic data related to specific territories (countries, regions or cities) powerful instruments for spatial and temporal pattern analysis [6,67–70]. The reconstruction of railway networks and their impact on cities, or the broader effects of steam-powered infrastructure, represent just two of the many areas rich with potential for exploration.
Furthermore, empirical studies and global reviews have demonstrated that improved transport connectivity is directly linked to increased access to jobs, education, and health services, and to reductions in social and spatial inequalities [11,13]. These impacts are especially relevant for SDG 10 (Reduced Inequalities) and SDG 13 (Climate Action), as sustainable transport systems can promote inclusion and support transitions toward low-carbon mobility [14]. Although Geographic Information Systems (GIS) are widely used for managing and analyzing contemporary transportation networks, their application in historical research is only gradually gaining broader recognition. Historical Geographic Information Systems (HGIS) are becoming increasingly instrumental in uncovering the spatial dynamics of past territories, offering essential context for understanding long-term trends and informing present-day decision-making.
Several initiatives have already incorporated historical railway data into GIS for socio-economic studies; however, most of these efforts are limited to the national scale [64,71–74]. These studies typically explore how rail infrastructure has shaped urban development, particularly the emergence and expansion of cities around railway stations. Geographers have examined these dynamics in diverse contexts, including France, Spain, Italy [75–78], Portugal [72], the United Kingdom [79], Japan [65], the American Midwest [80], China [81,82], the Netherlands [83], South Africa [84], Sierra Leona [85], Sri Lanka [86] or at global level [87] among others. Fewer studies address historical port data, and those that do are also mostly constrained to the national level, such as the case of [88–91], England and Wales [92] or China [93].
While national and regional studies often benefit from more complete and reliable datasets, they usually highlight local specificities or focus on more recent periods. Broader projects, such as those covering Europe [66,91], have taken important steps toward continental-scale understanding. However, a truly global historical geospatial database remains absent. Without such a comprehensive resource, conducting international-level socio-economic analyses—especially those aligned with global challenges like achieving the Sustainable Development Goals (SDGs)—remains a significant obstacle.
Framing this research within the broader domain of network analysis underscores its importance in understanding the spatial and temporal complexities of transportation systems [94,95]. Network analysis has become a critical tool for examining how the structure and evolution of transport infrastructure influence social and economic dynamics over time [96–100]. Building on the framework presented by Xie and Levinson [101], who identify several theoretical approaches to transportation network development, his study offers a distinct contribution by providing a globally comprehensive and spatially explicit examination of railway expansion over time.
Through the integration of Geographic Information Systems (GIS), the research reconstructs historical railway networks and enables advanced spatial analysis of network growth patterns. This approach not only reveals how railways evolved globally but also explores their interactions with other modes of transport and their long-term impacts on regional development. By combining historical reconstruction with modern analytical tools, the study provides new perspectives on how transport networks shape—and are shaped by—economic and social transformations.
This historical perspective is particularly valuable in the context of the Sustainable Development Goals (SDGs). For instance, SDG 9 (Industry, Innovation and Infrastructure) and SDG 11 (Sustainable Cities and Communities) emphasize the importance of inclusive, safe, and resilient infrastructure. By revealing how past transportation systems shaped regional development, this database supports better planning of future transport networks that prioritize accessibility and sustainability. Additionally, the data can inform SDG 13 (Climate Action) by helping to understand long-term shifts in mobility patterns and their environmental impacts, offering insights into how cities can transition toward low-carbon transport systems.
By integrating spatial data with social, economic, and environmental indicators, this research fosters a more holistic, evidence-based approach to sustainable development. It empowers scholars, planners, and policymakers with the historical context needed to design infrastructure policies and urban strategies that are aligned with long-term sustainability goals. Ultimately, the dataset serves not only as a tool for historical inquiry but also as a forward-looking instrument to support progress toward achieving the SDGs.
To examine the long-term relationship between transportation infrastructure and sustainable development, this research uses as its main source a Geographic Information System (GIS)-based historical database that tracked global railway expansion from 1880 to 2020. In combination with other historical datasets, such as those related to ports and population [51,102–104], and various socio-economic indicators related to health, mortality, life expectancy, and pollution [105,106], his methodological framework provides a robust empirical foundation to investigate how historical transportation systems have influenced urbanization, regional development, and socio-economic transitions—all critical dimensions of the United Nations’ Sustainable Development Goals (SDGs).
Guided by the research question—how historical transportation access between 1880 and 1950 influenced urban population growth and transport equity in different regions, and what lessons can be drawn for achieving SDGs today—this study adopts a comparative, regionally contextualized approach. By focusing on some examples, which differ in both data quality and historical development patterns, the analysis aims to provide grounded insights into the spatial and temporal dynamics of transport-driven urbanization and accessibility.
Developing a comprehensive historical database—specifically one focused on railway networks—involves several critical stages to ensure validity, consistency, and reliability of the data. These stages include: (1) data collection (2) data integration and (3) reconstruction of networks. Below, each of these steps is discussed in more detail:
1. Data collection
• Gather data from historical maps, archives, and digital sources:
This step involves collecting all available information about historical railway infrastructure. Sources include:
• Historical maps: Old cartographic documents showing railway lines, stations, and routes.
• Archives: Official records, government documents, railway company reports, and photographs.
• Digital sources: Online databases, scanned documents, and previously digitized datasets.
2. Data structuring
• Organize transport data in intervals (20 years):
To analyze changes over time, data is grouped into regular time intervals (e.g., every 20 years). This helps track the evolution of the railway network.
• Integration of data: population, socio-economic, and environmental:
Railway data is combined with other relevant datasets, such as:
• Population: Census data to understand demographic changes.
• Socio-economic: Economic activity, industrialization, urbanization.
• Environmental: Land use, natural features, and environmental impacts.
3. Digitalization and georeferencing
• Convert historical maps and archive information into GIS-compatible formats:
Physical maps and documents are scanned and digitized. Their features (railway lines, stations) are traced and converted into digital formats that can be used in Geographic Information Systems (GIS).
• Reconstruct railway lines:
Using the digitized data, the historical railway network is recreated as accurately as possible in the GIS environment.
4. Data integration
• Combine all materials into a unified temporal GIS framework:
All datasets (railways, population, socio-economic, environmental) are merged into a single GIS database. This allows for spatial and temporal analysis across different periods.
5. Topological corrections
• Enforce rules: no duplications, boundaries, or assumed stations:
The data is cleaned to ensure:
• No duplicate railway lines or stations.
• All features are within correct boundaries.
• Only real, documented stations are included (no assumptions).
6. Interpolation of missing data
• Geospatial interpolation:
When data is missing for certain areas or periods, spatial analysis techniques are used to estimate likely values based on nearby known data.
• Proximity-based rules:
Missing features (e.g., stations) may be inferred based on their proximity to known features.
• Address missing data:
All gaps are systematically identified and filled using the best available methods.
7. Validation
• Cross-check with current layers:
The reconstructed historical data is compared with modern datasets to check for consistency and accuracy.
• Sensitivity analysis:
Tests are performed to see how results change with different assumptions or data sources, ensuring robustness.
8. Visualization and analysis
• Spatiotemporal analysis:
The GIS database is used to visualize how the railway network and related factors changed over time and space.
• Impact on urban and regional development:
The data is analyzed to understand how the railway influenced the growth of cities, towns, and regions.
The data collection phase is gathering relevant data from a variety of sources, such as historical maps, archival documents, and digital databases. These can be accessed through libraries, governmental archives, and historical societies (e.g., Michelin Guides). For Europe, previously digitized sources [68] offered valuable insights into railway expansion. These resources provide essential details, including railway line layouts, station locations, and operational timelines.
This step demands a deep understanding of historical context to ensure appropriate source selection. Finding relevant materials proved challenging in some cases. Notable cartographic sources include the University of Cambridge Library, the Library of Congress, the Bibliothèque Nationale de France, and the University of Florida’s George A. Smathers Libraries. In terms of historical cartography, the Vector Smart Map (VMap) files, produced by the United States Defense Mapping Agency and based on the Digital Chart of the World (scale 1:1,000,000), were a primary digital resource. However, since these maps date to the early 2000s, they required updates to extend coverage to the year 2020.
While we had access to data on network expansion, detailed information on station locations, opening and closure dates, and temporal precision for specific railway segments was unavailable in many countries, with England being a notable exception. Acquiring such fine-grained data was particularly challenging and required extensive verification efforts over several years.
Gaps in station data and operational timelines hindered the precision of spatial and temporal analyses. For example, the absence of exact station data could lead to oversimplified conclusions regarding the proximity of urban centers to rail lines, potentially distorting our understanding of how railways influenced urbanization and economic growth. These data gaps could also obscure the finer impacts of railway closures or expansions on local and regional socio-economic conditions.
To assess the extent and implications of these limitations, we conducted a comparative analysis between regions with high-resolution historical data and those with notable gaps. In Western Europe, approximately 85% of railway segments include verified construction and closure dates, and over 70% of cities have geolocated stations [66,107]. In contrast, in Sub-Saharan Africa and parts of South Asia, fewer than 30% of segments include temporal data, and only about 20% of urban areas have station-level precision. These discrepancies directly affect the robustness of regional analyses. In high-quality regions, we tested the proximity assumption (e.g., 2 km from railway lines) against actual coordinates and found a ±15% margin of error when station data was unavailable. Furthermore, regression models correlating population growth with railway access showed stable results in Western Europe (±5% variation) but fluctuated by more than ±20% in West African contexts. This sensitivity confirms that data gaps introduce measurable but geographically uneven effects on analytical reliability.
To address more accurately these limitations, future research should involve collaboration with local archives, historians, and geographers to improve the accuracy of station-specific information. In addition, advanced geospatial interpolation techniques may help estimate missing data points, enhancing analytical reliability. Acknowledging these gaps and their potential impacts on the study’s conclusions enhances the credibility of the research and provides valuable direction for future investigations.
For consistency, we structured the historical data into 20-year intervals (e.g., 1880, 1900, 1920). This approach was necessary because acquiring information for every year, or even every five or ten years, was not feasible across all countries. In Europe, however, sources like Thomas Cook’s travel books provided more frequent data. Population data was also incorporated at various scales—city, municipal, and agglomeration levels-, with the latter available only from 1950 onward. Most population data came from the Population Statistics global database [106], which offers demographic information dating back to the mid-19th century. Additional sources, such as Africapolis for African countries, were used to refine population estimates.
Cities were classified by functional areas or agglomerations rather than administrative boundaries. This approach was made possible by databases providing population data at both agglomeration and municipal levels. The Population Statistics database, which includes data for small and medium-sized cities, proved particularly valuable in comparison to other datasets that focus solely on major metropolitan areas. After collecting the historical data, the next step involved integrating the materials into a unified Geographic Information System (GIS) framework. This GIS system was specifically designed to support temporal analysis, allowing researchers to track the evolution of railway networks over time. Data on railway lines and stations were converted into GIS-compatible formats while ensuring spatial accuracy. Each historical map was digitized and georeferenced to ensure consistency across sources, which often varied in scale and detail.
Reconstructing the railway network relied primarily on the Vector Map Level 0 (VMAP0) and other historical maps. These were analyzed to identify operational railway lines for each time period (e.g., 1880–1900, 1900–1920). Given the importance of spatial accuracy, great care was taken to represent the networks correctly for each time frame. The integration of historical maps into the GIS platform provided a clear, visual representation of railway network development, allowing for detailed spatial analysis.
To resolve inconsistencies, specific topological rules were applied. For example, duplicate rail lines were avoided, and networks were constrained within national borders [108]. Additionally, cities with railway connections were treated as equivalent to the stations they contained. The vector lines from the Vector Map (VM0) were overlaid on the reproduction of African lines in the decade of 1940. The green lines represent lines that correspond to railway lines in service in 1880, while the red lines indicate those that were not operational in 1900 and the blue ones that correspond to 2000 from VM0.
Fig. 1 shows a detail of South Africa taken from the Map of Africa showing railways, navigable waters, and distance from the coast contained in the Statesman’s Year-Book of 1899 (Fig. 2). Fig. 3 provides the full map used to achieve optimal detail and determine which lines were developed by 1900.
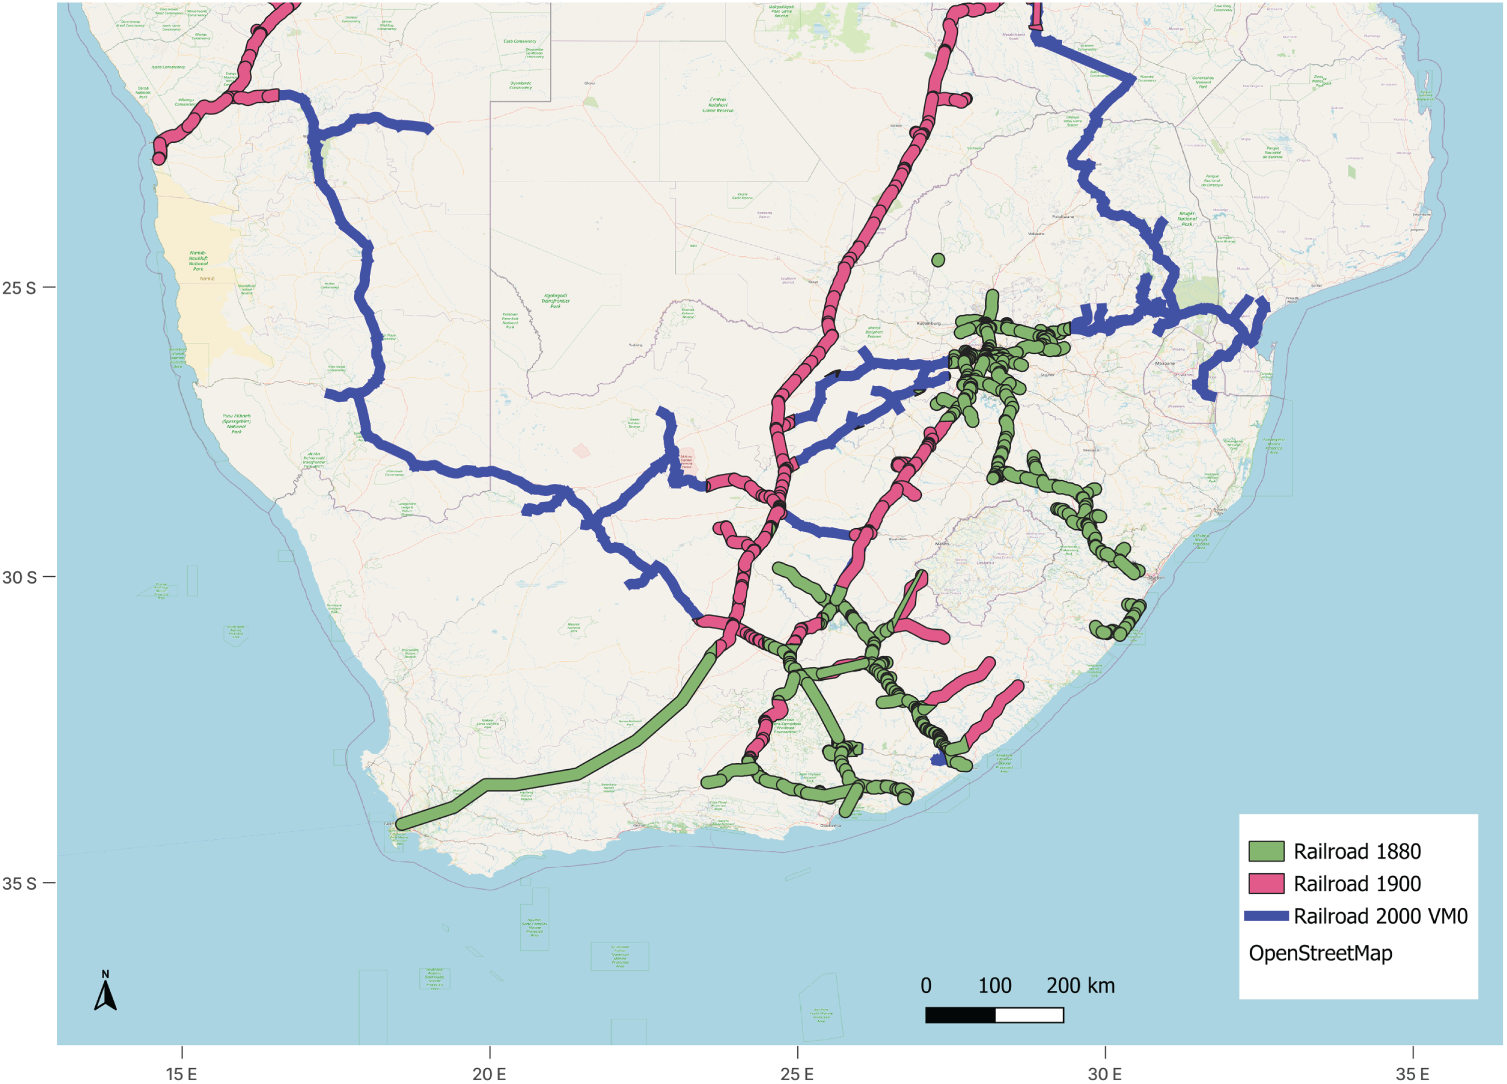
Figure 1: Detail of South Africa in the Geographic Information System software. Source: Own elaboration
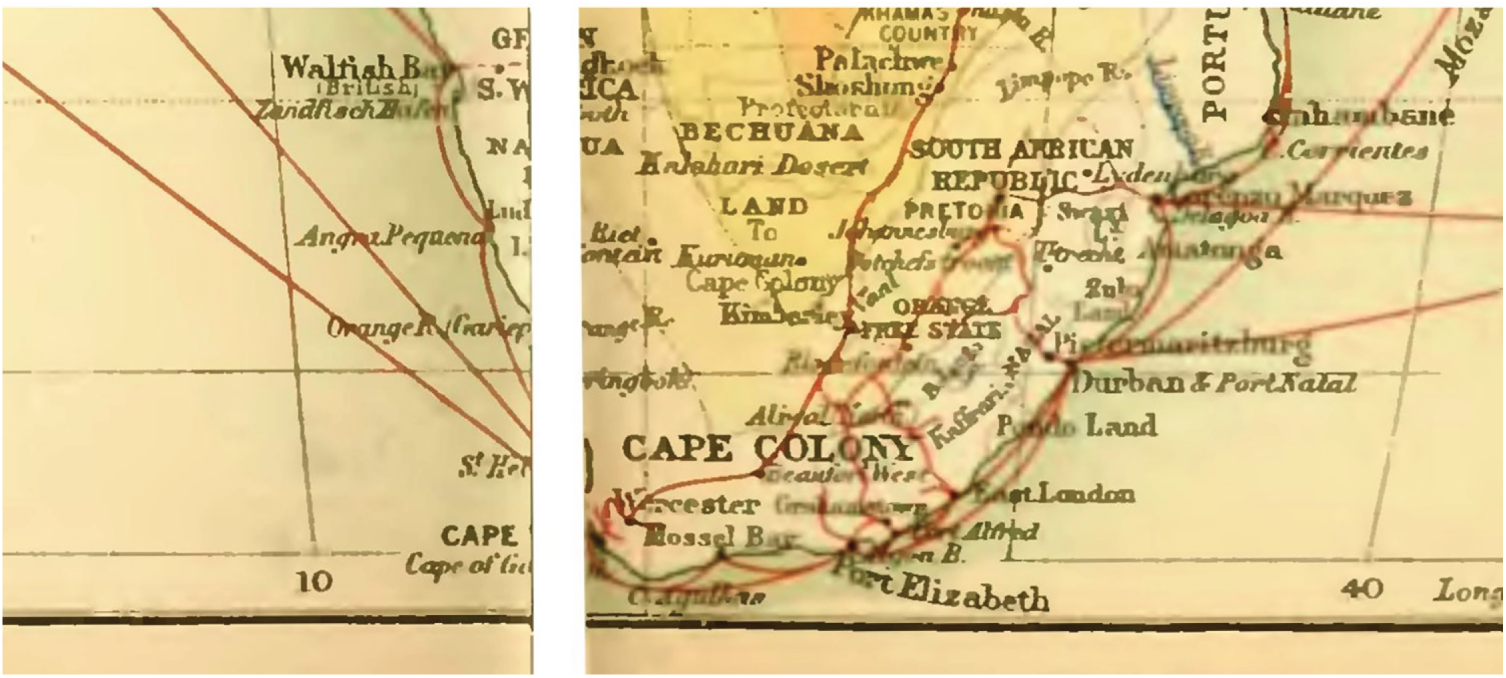
Figure 2: Detail from the Map of Africa showing railways, navigatable waters, and distance from the coast contained in the Statesman’s Year-Book of 1899. Source: Open source
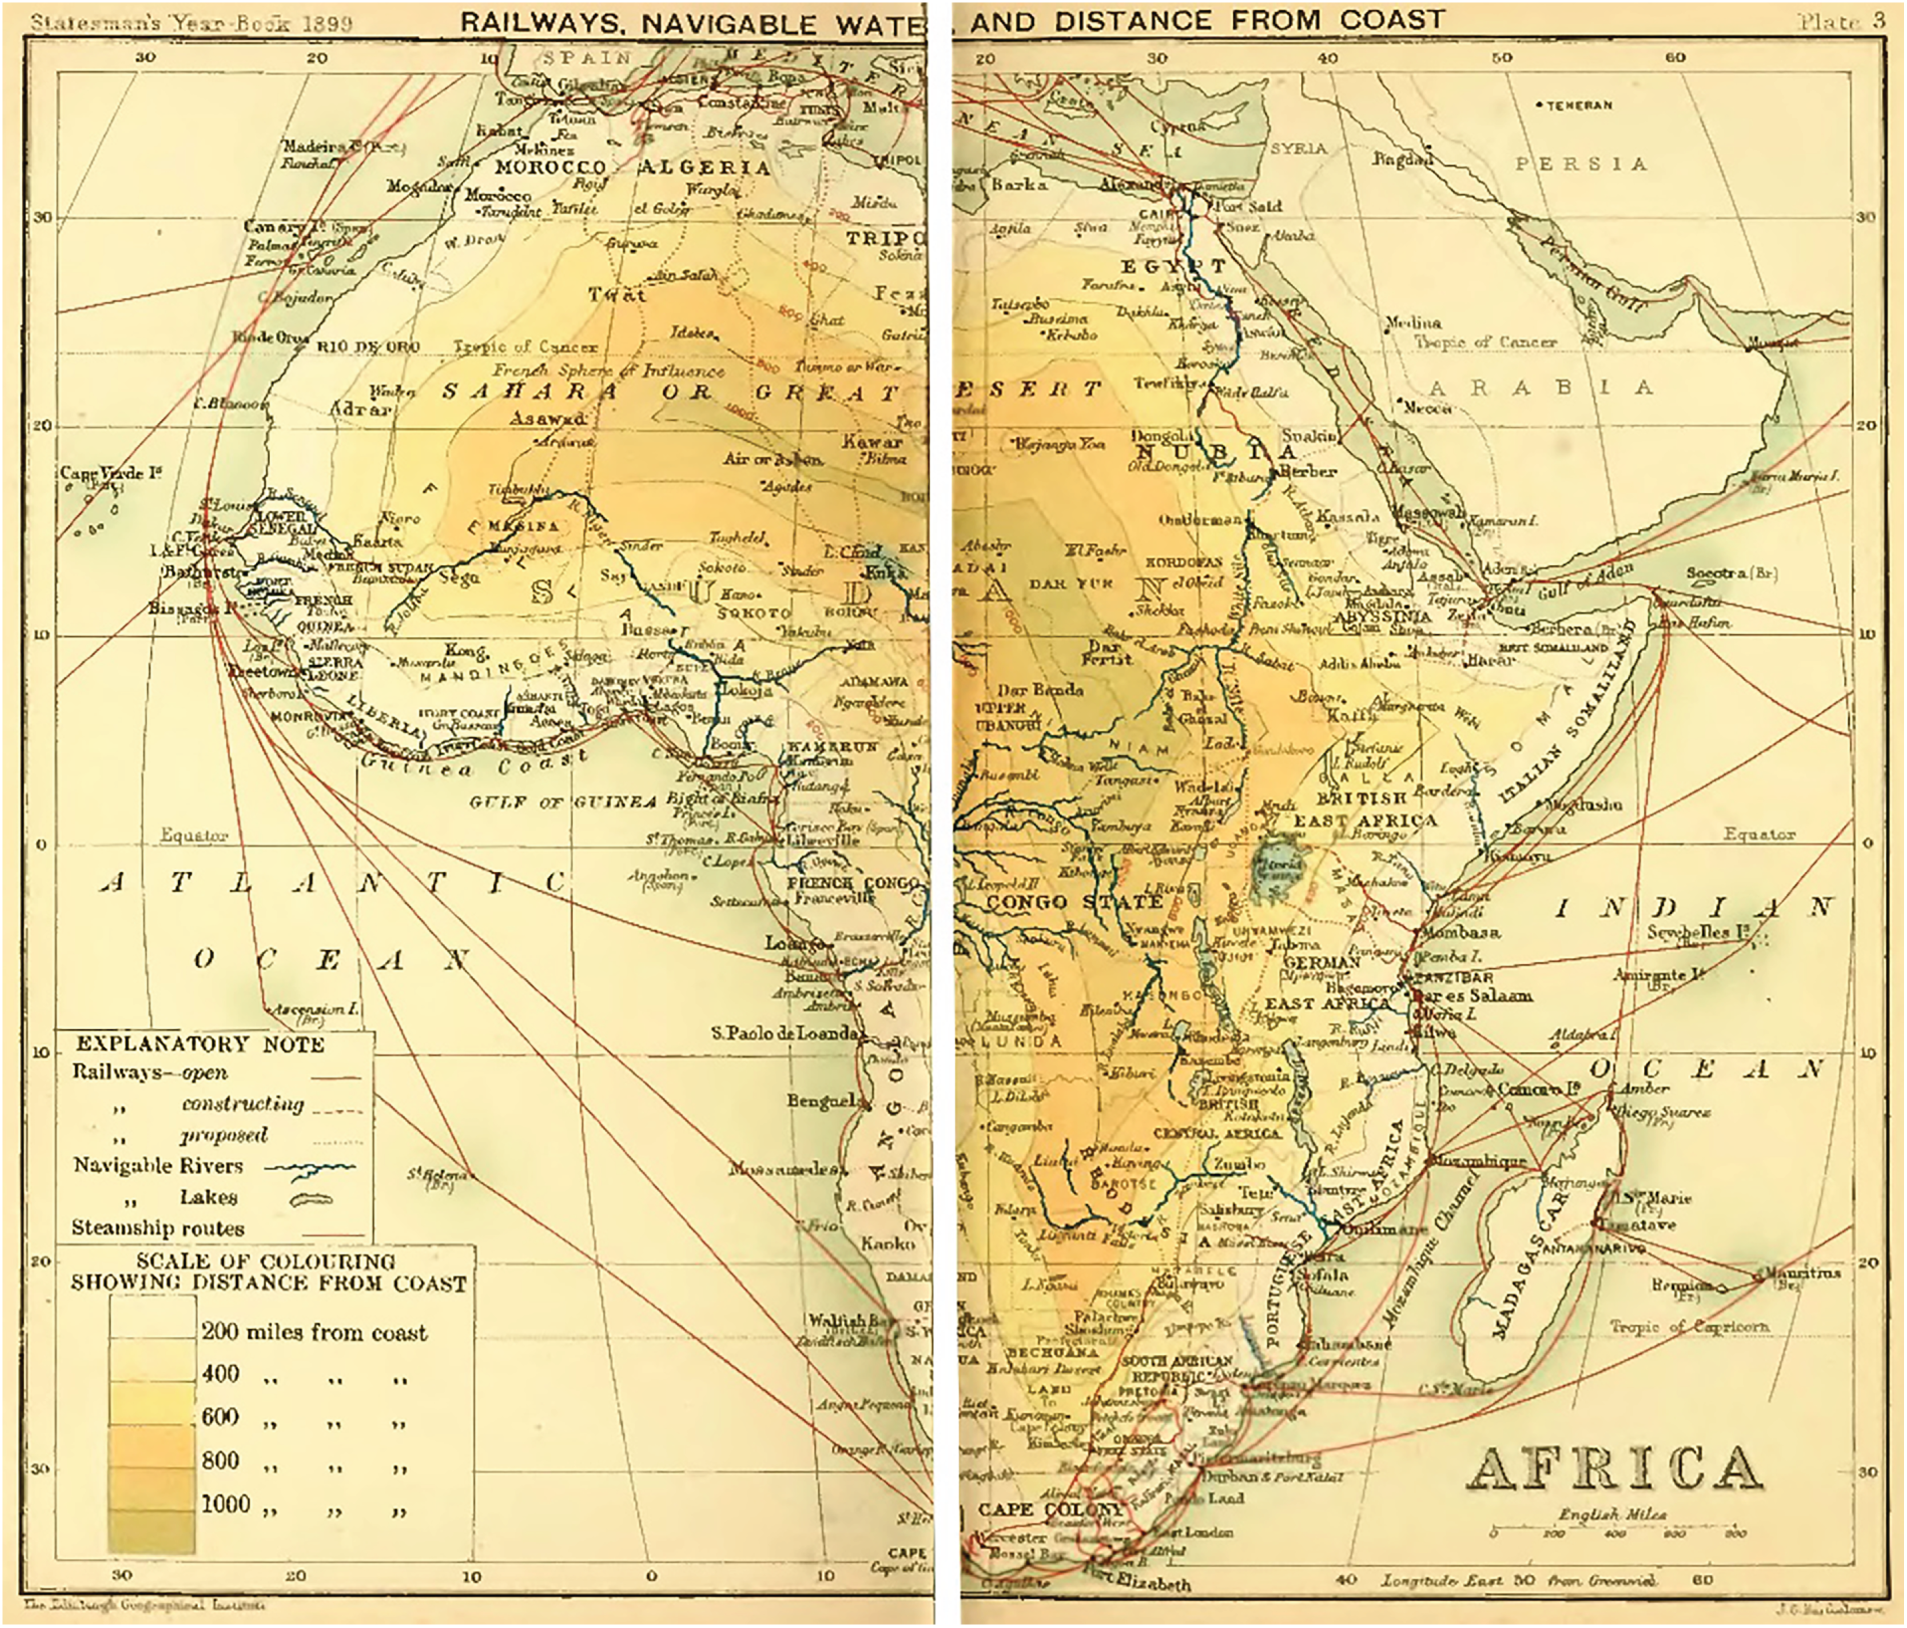
Figure 3: Map of Africa showing railways, navigatable waters, and distance from the coast contained in the Statesman’s Year-Book of 1899. Source: Open source
The resulting geospatial database offers a detailed global view of railway networks spanning from 1880 to 2020, illustrating significant expansion phases, periods of decline, and the changing prominence of various regions over time. Alongside the railway vector layers, an additional layer represents the locations of railway stations, based on the assumption that cities with connected railway lines also contain stations. Due to the limited availability of station-specific data, we assumed that urban areas within two kilometers of a railway line were part of the railway network. This proximity threshold was selected based on both historical and contemporary observations, which suggest that railways significantly influenced urban and economic development within such distances [109]. However, this assumption does not account for geographic or infrastructural obstacles—such as rivers, terrain, or poor road access—that could have limited actual connectivity to the railway system.
To evaluate the validity of this assumption, a sensitivity analysis was conducted by adjusting the proximity threshold (e.g., to five kilometers). This helped to assess the influence of varying distances on the study’s findings. The analysis aimed to determine whether the two-kilometer buffer significantly impacted the observed relationships between railway proximity, urbanization, and economic development, particularly from the late 19th century until the 1950s, when automobiles became more widespread, and railway station access became more straightforward. This sensitivity analysis strengthened the study’s methodological framework by addressing potential spatial biases and accounting for historical variations in urban form, transport infrastructure, and settlement patterns that could have shaped railway-urban dynamics. The analysis also allowed for a deeper understanding of threshold effects—specifically, whether the influence of railways on urbanization and development declines gradually or drops sharply beyond a certain distance. By systematically testing these factors, we ensured that the conclusions drawn from the data were based on actual spatial and economic trends, rather than being driven by methodological assumptions.
The database also includes data on the opening years of stations, when available, as well as the number of connections, particularly for European regions with detailed historical records. This GIS-based historical geospatial database enables dynamic visualization and analytical capabilities, uncovering complex spatial patterns and temporal trends that would have been difficult to detect using traditional methods.
The open-access historical geospatial database—comprising shapefiles for each continent, organized by decade and hosted on Nakala [18–50]—integrates historical maps, archival documents, and demographic sources within a unified spatial framework. This Historical Geographic Information System (HGIS) enables longitudinal analysis of infrastructural changes and includes layers such as railway stations, ports, and airports. Combined with complementary datasets on ports and population [51], it offers a valuable foundation for interdisciplinary research on urban growth, economic development, and regional integration.
The database supports analyses at multiple scales. At the global level, it reveals distinct phases of expansion and contraction between 1880 and 2020, showing how infrastructure development was uneven across continents. At the regional level, comparative analyses (e.g., Western Europe vs. North Africa as it is shown in Figs. 4 and 5) highlight differences in data quality, investment priorities, and long-term accessibility. Figs. 4 and 5 illustrate regional disparities in railway accessibility in Western Europe and North Africa across two historical benchmarks (1880 and 2020). While Europe shows a dense and interconnected network by 1880, North Africa remains sparsely covered, reflecting uneven infrastructure investment. By 2020, European cities are almost universally connected, whereas many African cities still lack direct access to rail lines. This visual comparison underscores long-term differences in accessibility and investment priorities, complementing the global trend of uneven expansion and contraction highlighted in the database. Quantitatively, Europe’s network grew from approximately 152,000 km in 1880 to 202,600 km in 2020, connecting over 90% of cities, while North Africa expanded from about 900 to 15,858 km, reaching only an estimated 25%–30% of cities. At the local level, city-focused cases such as South Africa (Figs. 6–8) demonstrate how railway presence shaped population growth, urban form, and station dynamics. These multiscale applications provide grounded insights into the ways transport infrastructure influenced urbanization and socio-economic outcomes.
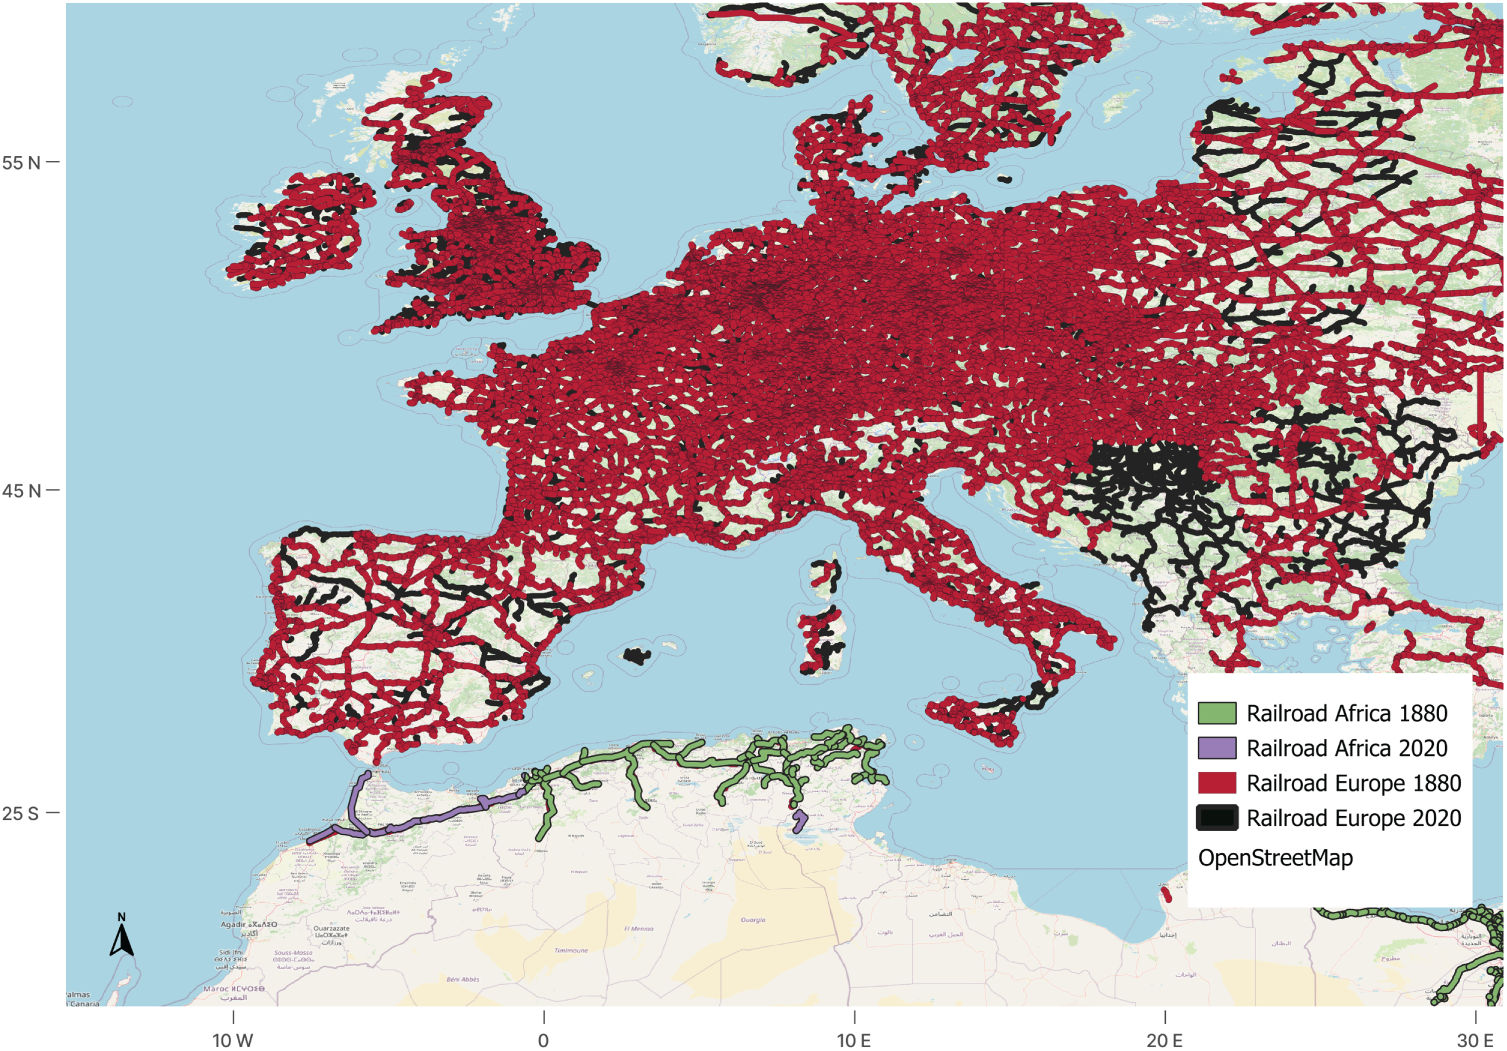
Figure 4: Inequal development of lines in Western Europe and North Africa along time (1880 vs. 2020). Source: Own elaboration

Figure 5: Evolution of railroad connectivity for cities in Western Europe and North Africa (1880 vs. 2020). Source: Own elaboration
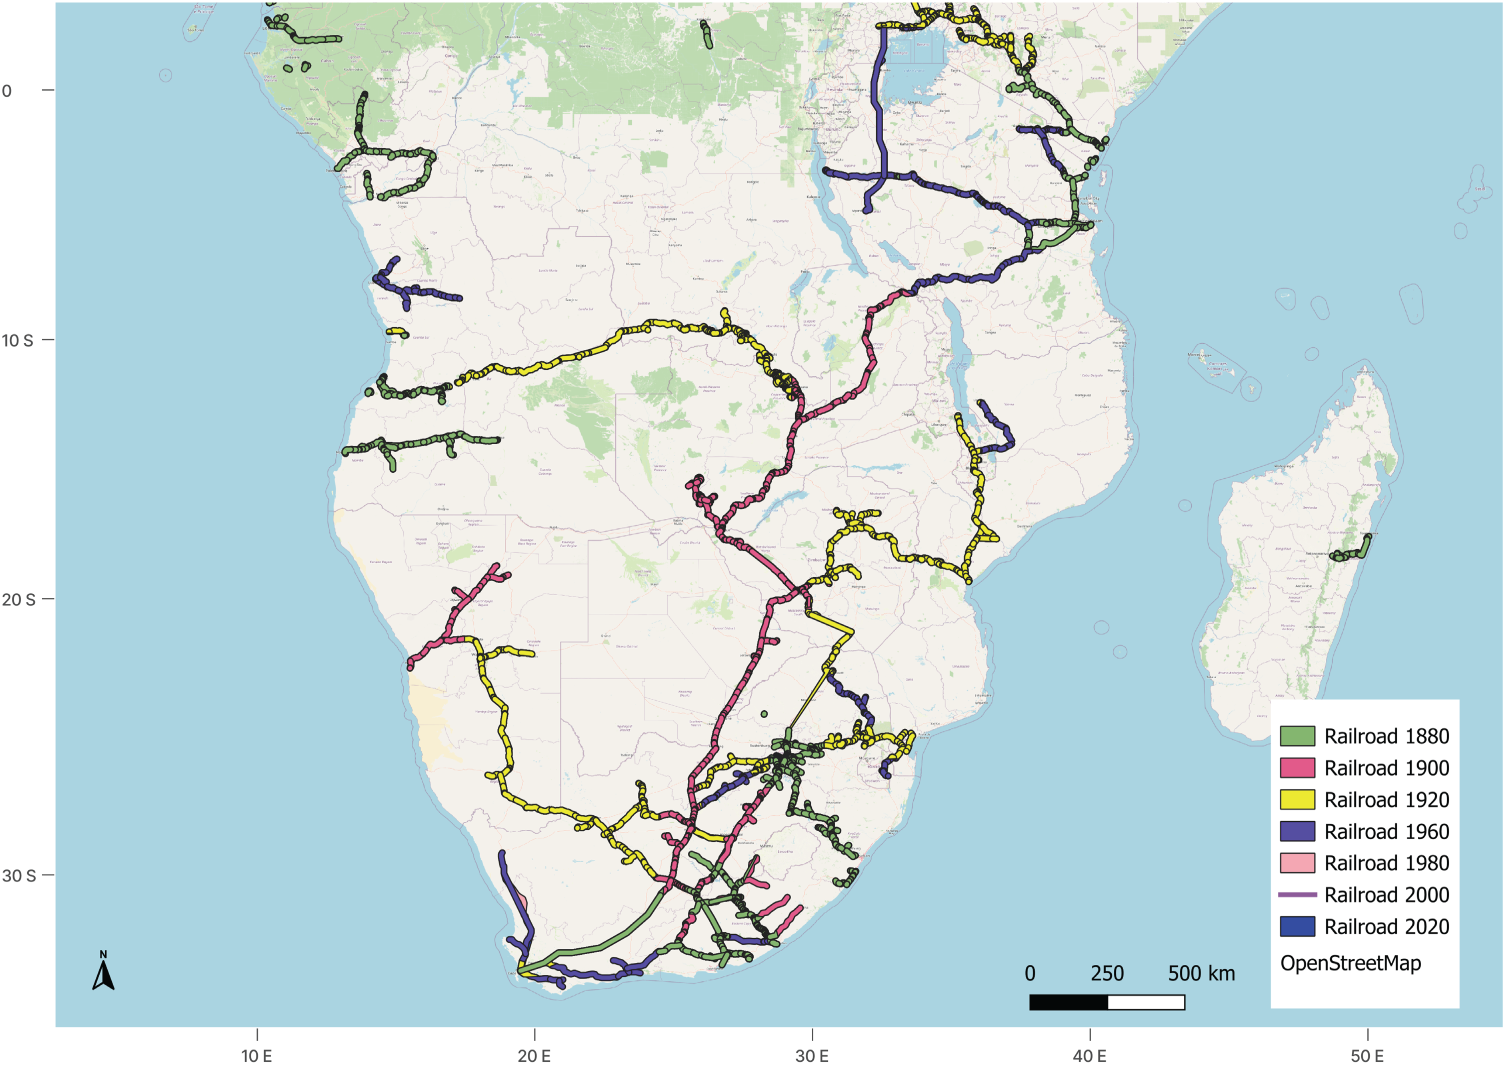
Figure 6: South African lines from 1880 to 2020. Source: Own elaboration
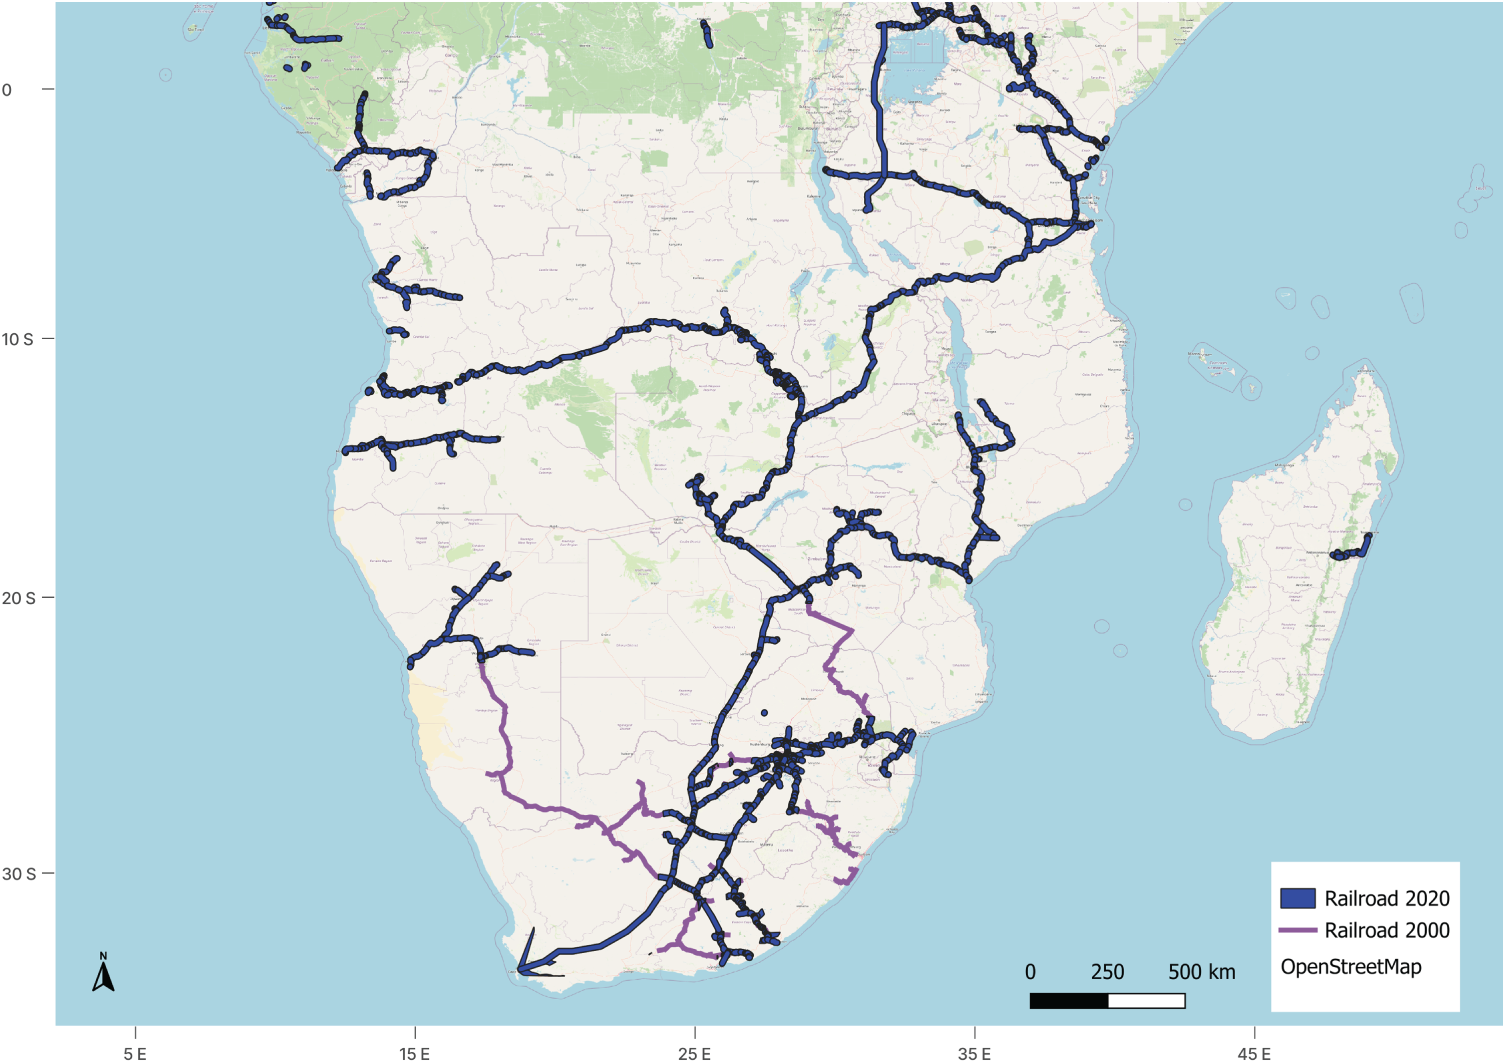
Figure 7: Loss of lines in South Africa between 2000 and 2020. The violet part, which existed in the 2000’s has disappeared. Source: Own elaboration
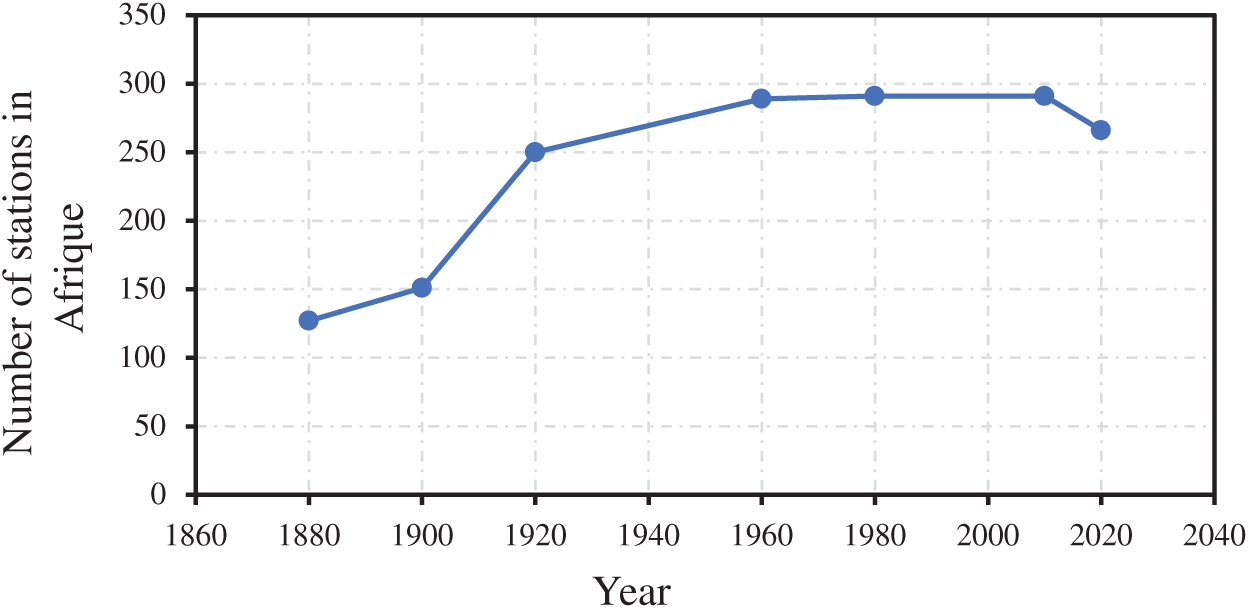
Figure 8: Number of stations in use across South Afrique from 1880 to 2020. Source: Own elaboration
To further illustrate the value of a regionally contextualized approach, we highlight several concrete examples. In Western Europe, the abundance of detailed archival and digital data enables precise tracking of railway line openings, closures, and their direct impact on urban growth and economic integration. For instance, Western Europe, and overall the United Kingdom and France, exhibit clear correlations between early railway access and sustained population growth at the municipal level. In contrast, North Africa presents significant data gaps, yet the GIS framework still reveals broad patterns, such as the concentration of railways along colonial-era trade corridors and the subsequent decline of certain lines in the post-colonial period, as seen in South Africa. These regionally grounded analyses demonstrate how the dataset can be flexibly applied to uncover both global trends and local specificities, providing actionable insights for policymakers and researchers focused on sustainable development and infrastructure planning.
These findings offer critical insights into the spatial inequalities and development trajectories that align with key Sustainable Development Goals (SDGs). For instance, the early and widespread railway access observed in Western Europe supports SDG 9.1 (developing quality, reliable, sustainable infrastructure) and SDG 11.2 (providing access to safe, affordable, and sustainable transport systems for all). In contrast, the limited and uneven expansion of rail networks in parts of Africa and Asia highlights persistent challenges for SDG 10.2 (promoting social, economic, and political inclusion) and underscores the need for targeted infrastructure investment. At the global scale, the database reveals how historical transport accessibility shaped long-term urban growth and regional integration, offering a valuable temporal lens for evaluating progress toward SDG 13.2 (integrating climate change measures into national policies) by identifying modal shifts and infrastructure decline. These patterns not only reflect past development priorities but also inform future strategies for equitable and sustainable mobility.
As we have explained previously, given the heterogeneity of historical data, a sensitivity analysis was conducted to assess the robustness of the spatial assumptions underlying the database—particularly the use of a two-kilometer proximity threshold to define urban railway access. By varying this threshold (e.g., increasing it to five kilometers) and comparing results across regions with different data quality, we found that the impact on analytical outcomes was minimal in data-rich areas such as Western Europe (±5% variation), but more pronounced in regions with sparser records, such as Africa (variation exceeding ±20%). This analysis underscores the importance of data completeness and highlights the potential for spatial bias in regions with limited historical documentation. By systematically testing these parameters, we ensured that the main findings reflect genuine spatial and economic patterns, rather than artifacts of methodological choices.
Figs. 9 and 10 illustrate the difference in railway infrastructure between 1880 and 2020 at regional and continental levels. The incorporation of borders into these analyses reveals the priorities each state placed on railway development, despite challenges in acquiring precise border data for some continents. These figures trace the temporal evolution of the South African network, including phases of expansion, consolidation, and contraction.
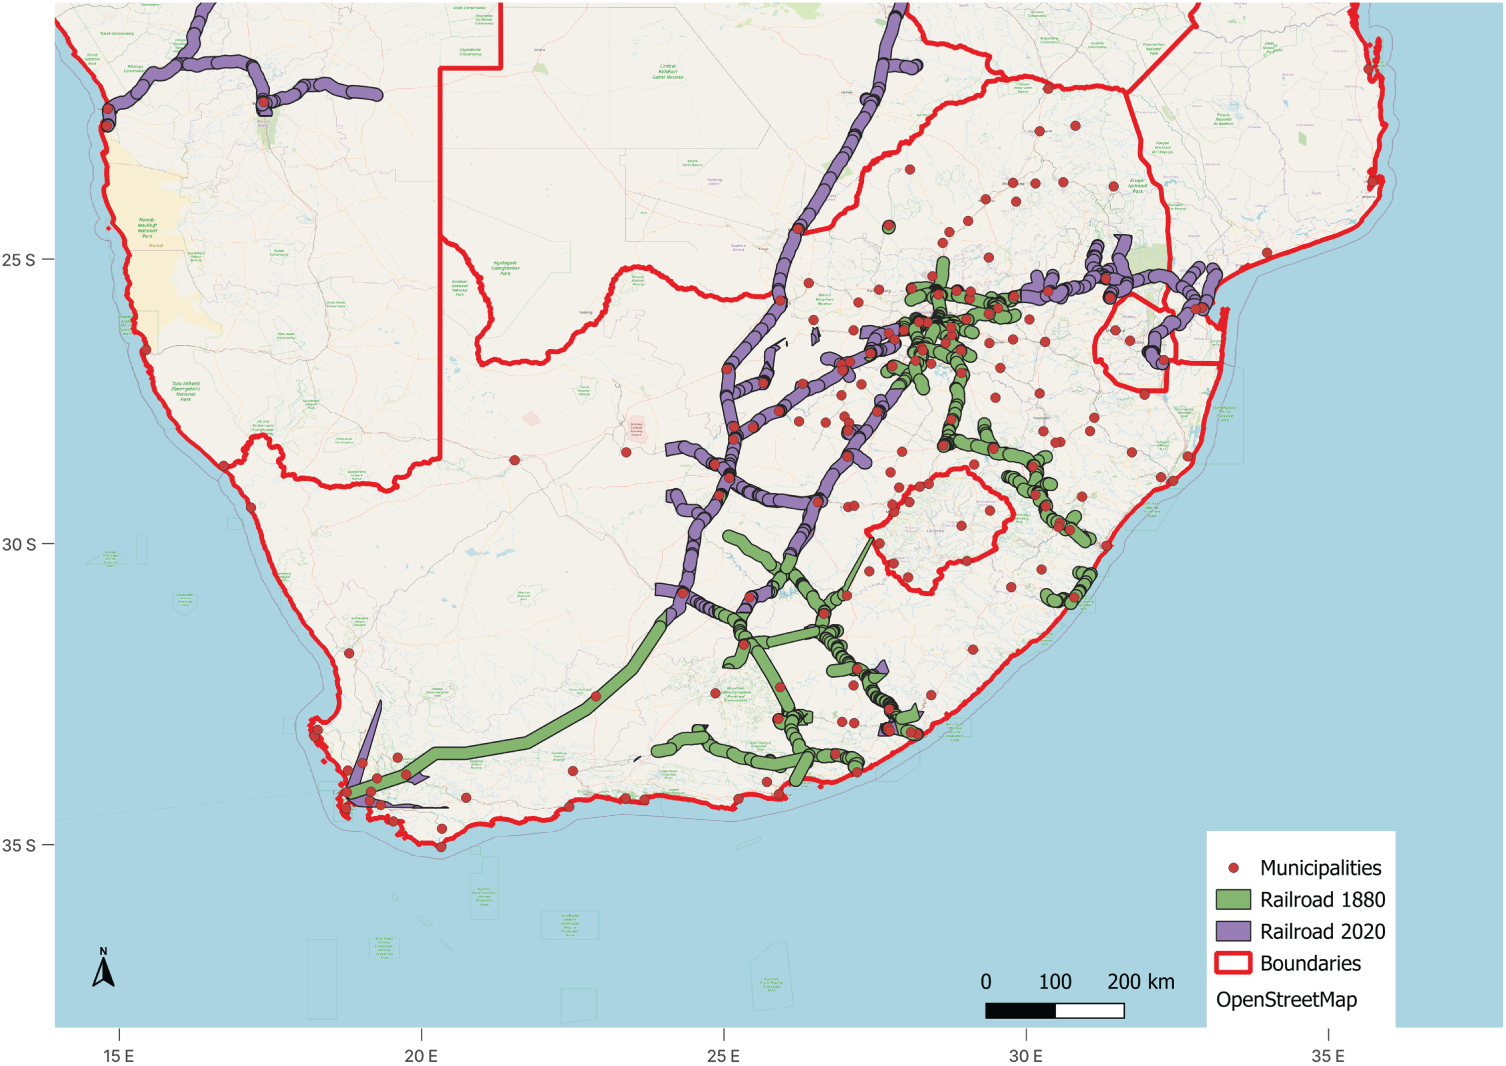
Figure 9: Difference of railways between 1880 and 2020 at regional level. Source: Own elaboration
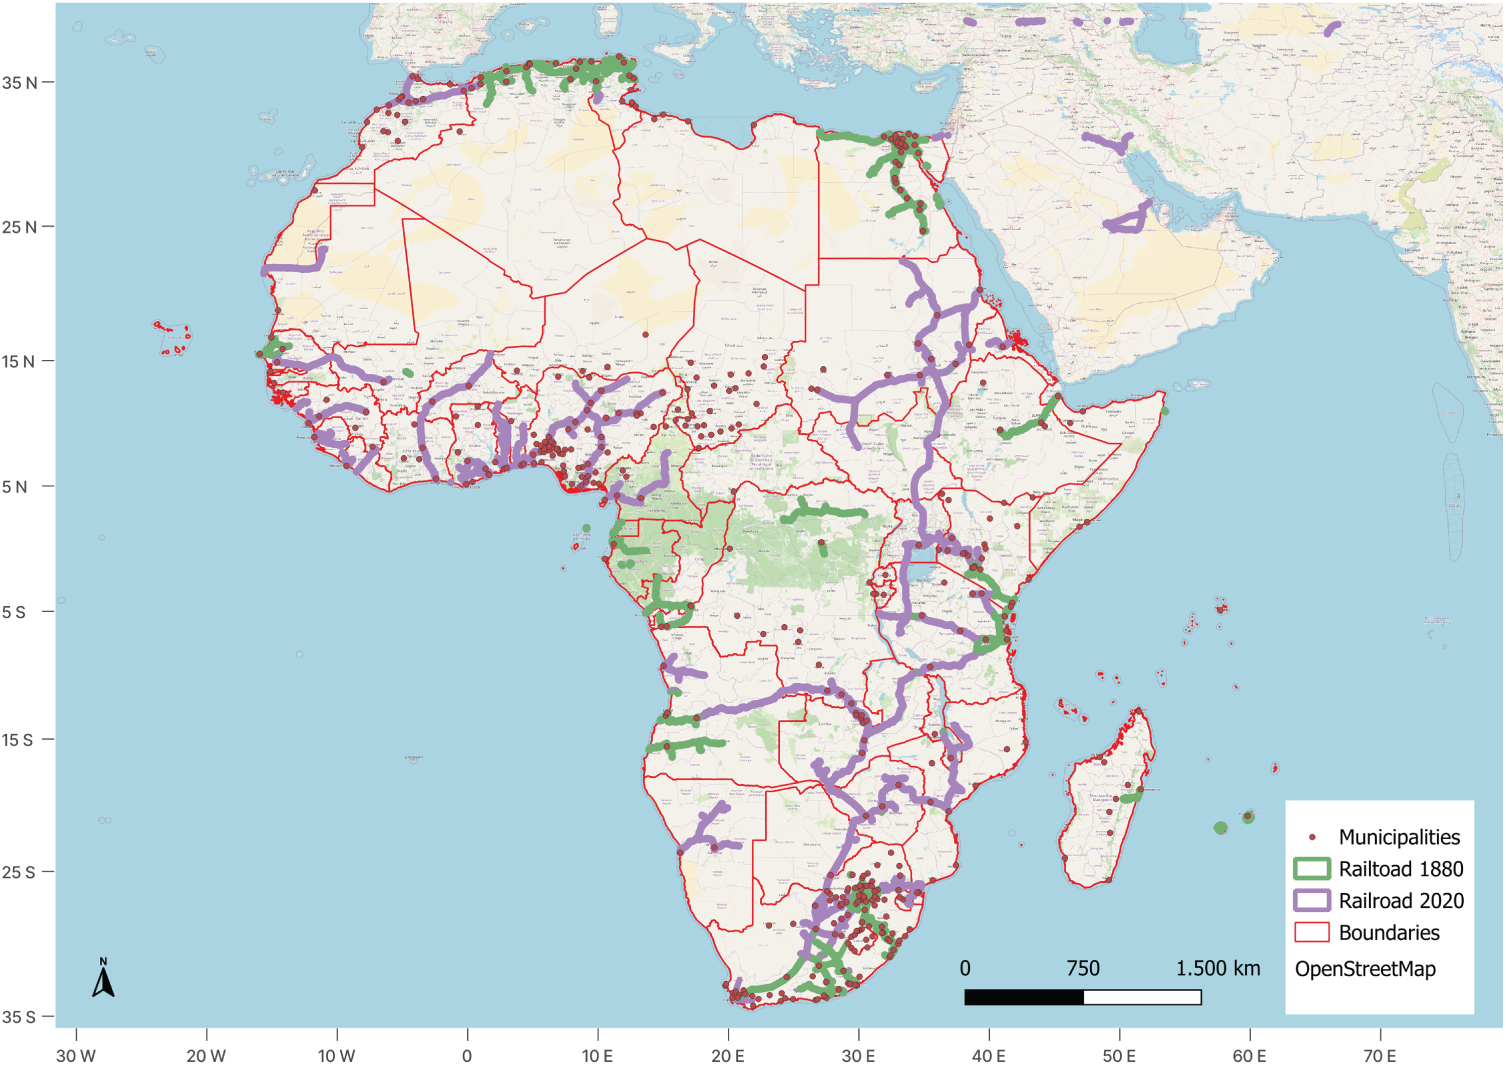
Figure 10: Difference of railways between 1880 and 2020 at continental level. Source: Own elaboration
A detailed analysis of railway networks at national and continental levels reveals distinct phases characterized by initial openings, periods of stability, closures, and more recent trends of expansion or decline. These phases reflect broader political, economic, and technological shifts influencing infrastructure development across regions. Comparative analyses demonstrate disparities in data quality and railway development patterns across regions. Western Europe, with abundant archival and digital data—such as the well-documented Great Britain railway stations dataset [110]—permits detailed tracking of line openings and closures, as exemplified in Fig. 8. Conversely, in regions with sparser data like Africa or Asia, analyses rely more on assumptions from maps and news sources, resulting in broader but less precise conclusions. Building on previous research, one study compares population growth rates at city or municipal levels between municipalities with and without railway connections (Fig. 9), following methodologies pioneered in the last decade [79,94]. Furthermore, regional, national, or continental comparisons highlight disparities in railway development, deepening insight into the dataset.
The integration of railway, maritime, and population data reveals strong correlations between infrastructure and urban growth. For example, Fig. 11 compares population growth rates at city or municipal levels in South Africa between municipalities with and without railway connections from 1880 to 2020. The results show that cities connected to the railway system systematically experienced higher and more sustained growth, particularly those with high network centrality, such as Johannesburg, Durban, and Cape Town. Early railway access created long-term demographic advantages that persisted even during phases of network contraction, confirming the path-dependent nature of urban development.
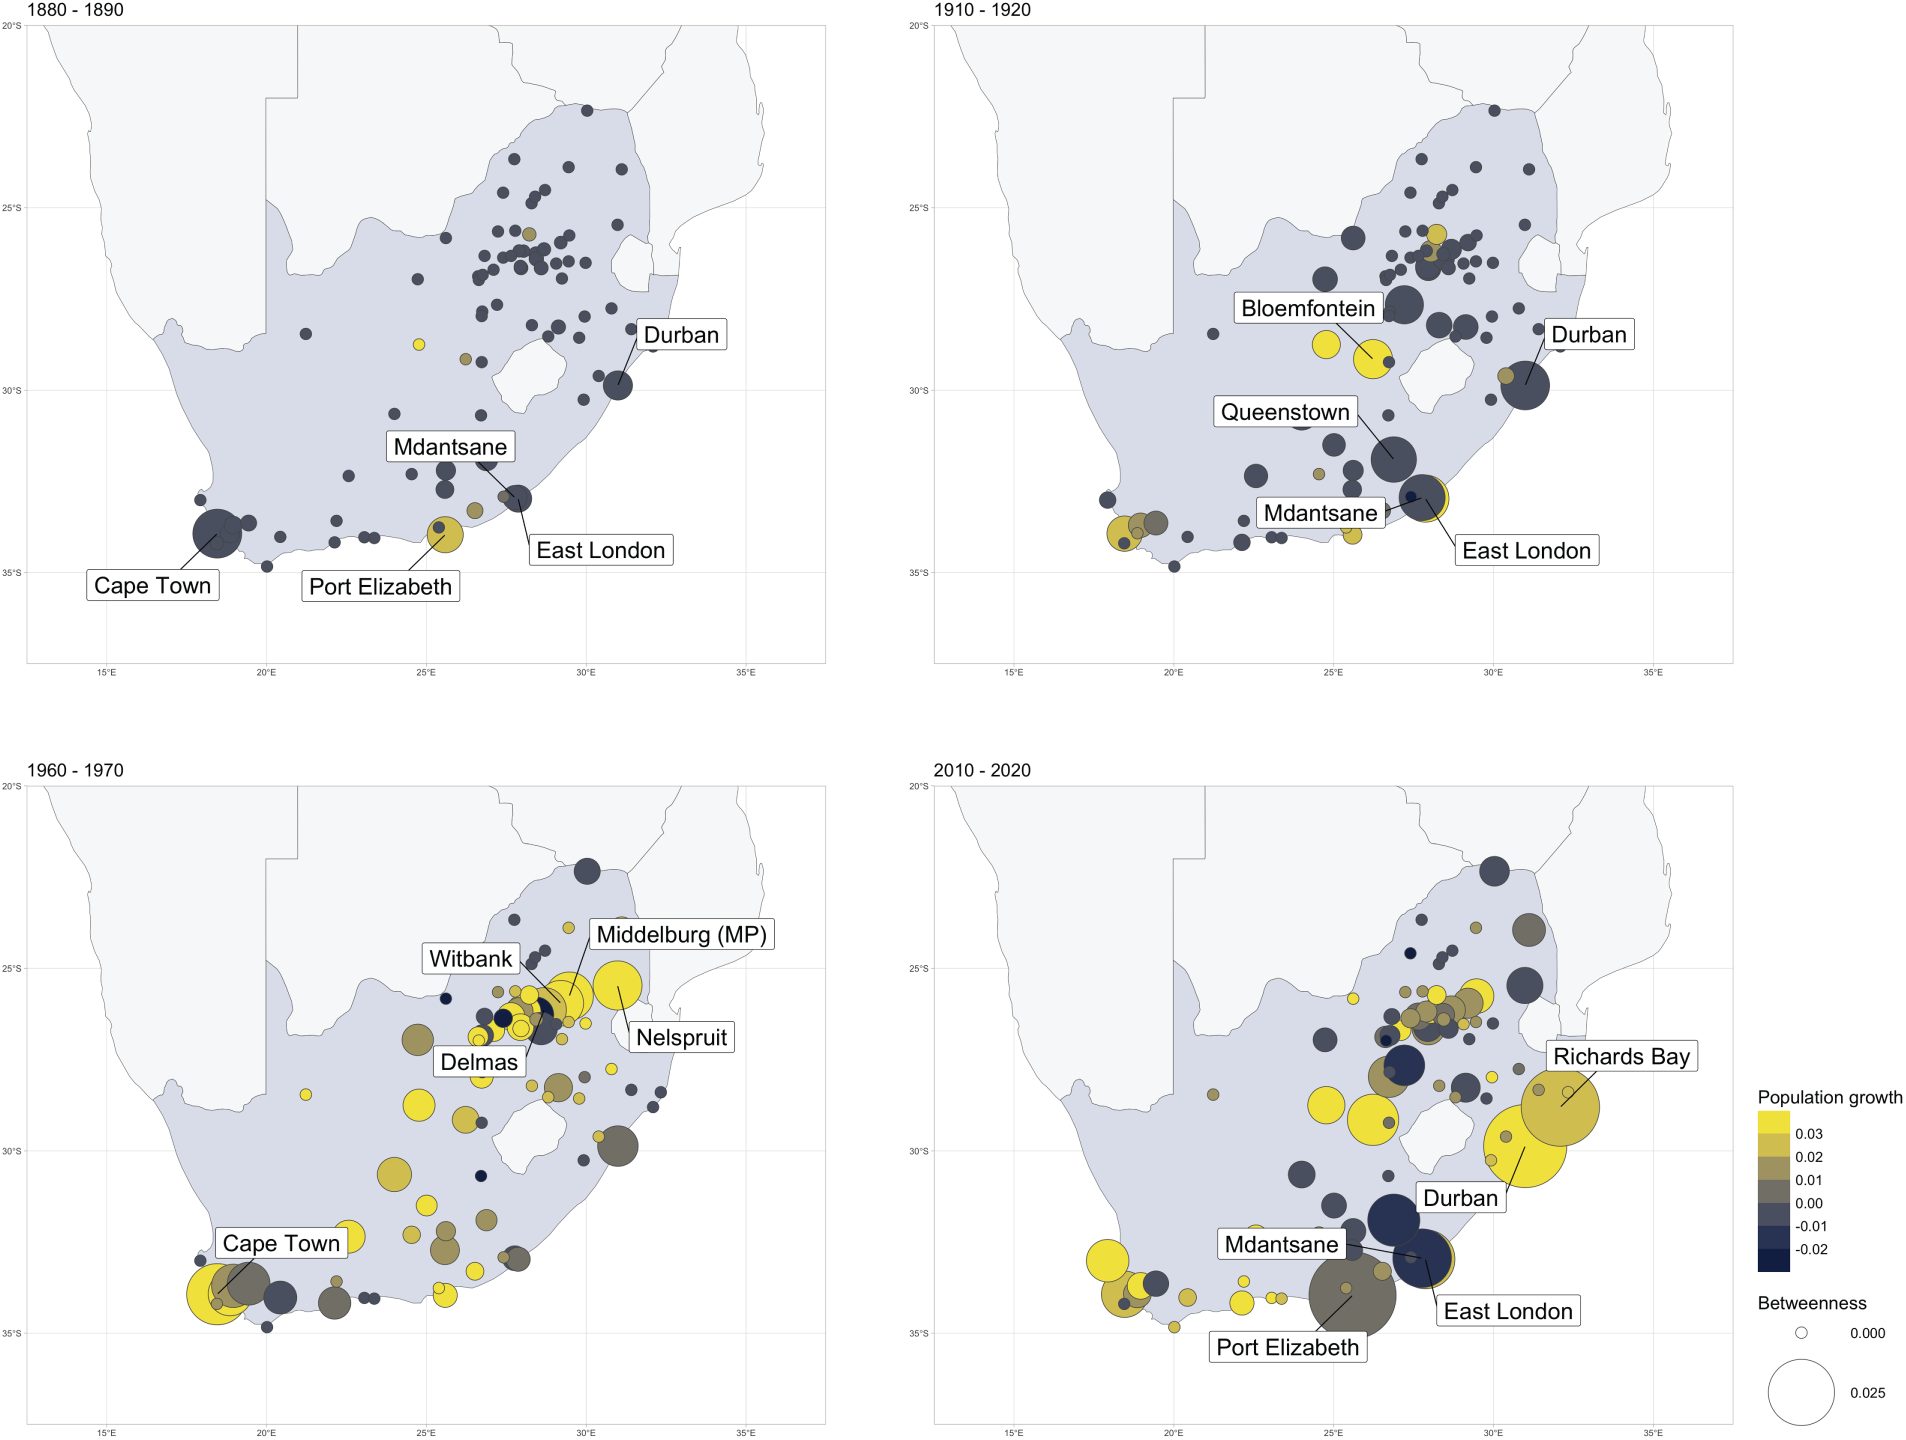
Figure 11: Evolution of population growth and infrastructure connectivity in South African cities from 1880 until 2020. Source: Own elaboration
Extending the analysis (Fig. 12), we operationalized SDG 9 and SDG 11 using historical railway network metrics derived from GIS and population data in Africa across 504 city–decade observations for Algeria and Angola (1880–2010). Connectivity intensity reflects local infrastructure provision, while accessibility approximates convenient access to the network. As results prove, accessibility shows a significant positive association with annual population growth (r = 0.111, permutation-test p = 0.0146), and eigenvector centrality exhibits a similar pattern (r = 0.097, p = 0.029). Connectivity intensity is weaker (r = 0.045, p = 0.296). Cities in the top quartile of accessibility grew +0.75 percentage points faster per year than those in the bottom quartile; for connectivity, the gap is +1.08 percentage points.
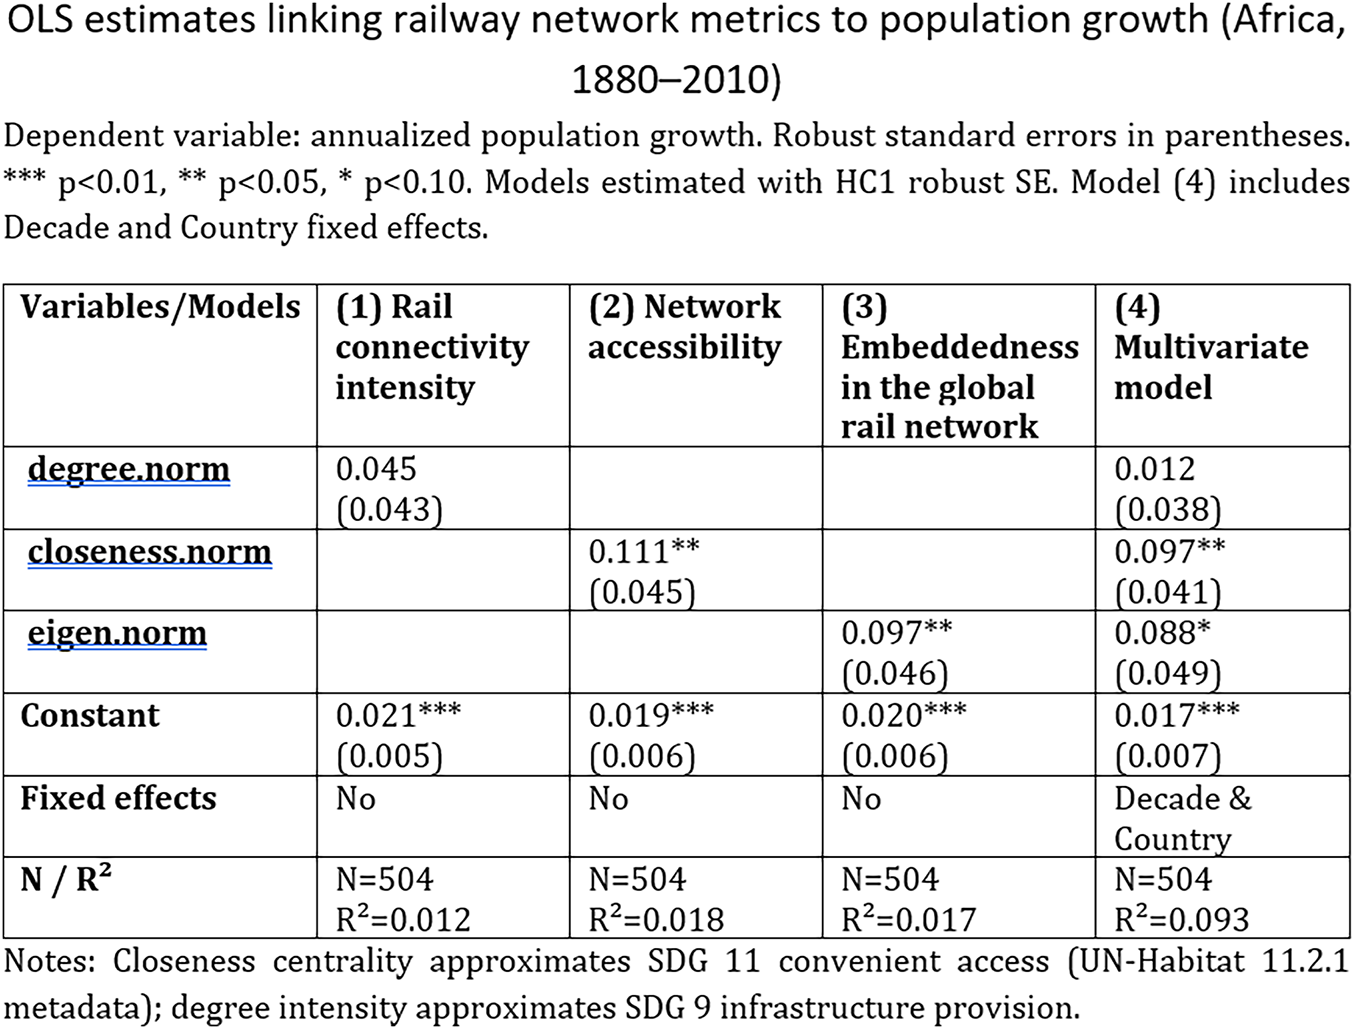
Figure 12: OLS estimations linking railway network metrics to population growth
Previous figures illustrate the spatial evolution of rail networks in Southern Africa: early colonial lines (1880) concentrated along coasts, followed by inland penetration (1900–1920), major consolidation (1960), and later stagnation or decline (2000–2020). This trajectory explains why the share of cities with rail access rose from ~67% in 1880 to ~75% after 1970 but decreased thereafter. These findings confirm that denser and more integrated rail networks historically supported inclusive urban development, aligning with SDGs. While official SDG 11 requires population within 1 km of high-capacity transit, our proxy approach (network accessibility) follows UN-Habitat’s recommended methodology for historical contexts.
Similarly, around the turn of the century, major global cities functioned as junctions between maritime and railway systems, further consolidating their growth [7]. This finding aligns with earlier studies [99,100] and specific econometric case studies. The dataset also supports the analysis of employment growth in relation to railway expansion, tracing how infrastructure development has correlated with industrialization and job creation across regions [107,110]. By grounding the analysis in specific regional contexts, the study demonstrates the flexibility and utility of the historical GIS database for both global and local research questions. These regionally contextualized findings provide actionable insights for policymakers, such as identifying areas where historical underinvestment in transport infrastructure continues to shape contemporary patterns of inequality and accessibility. However, it is important to note that the robustness of regional analyses is directly influenced by the availability and quality of historical data. For example, while Western Europe benefits from high-resolution datasets enabling precise tracking of railway development, analyses in Africa and other parts of the worlds, like Asia, are constrained by data gaps and less frequent temporal records. In these cases, results should be interpreted with caution, as they may reflect broader trends rather than fine-grained local dynamics.
Historical databases serve as a critical tool for contemporary urban and transport policy, enabling the identification of long-term patterns in transportation accessibility, regional connectivity, and socio-economic inequality. The results of this study, based on a global railway GIS from 1880 to 2020, demonstrate how early and continuous access to transport infrastructure shaped urban growth, regional integration, and disparities in development. These insights are relevant to sustainable development, but their strength lies in the methodological innovations and empirical depth of the dataset.
The core contribution of this research is the development of a comprehensive, spatiotemporal GIS database that reconstructs historical railway networks across continents. This database integrates archival maps, demographic data, and infrastructure records into a unified framework, enabling comparative analyses across regions and decades. The methodological rigor—particularly in data structuring, georeferencing, and topological correction—ensures analytical consistency and supports robust spatial analysis.
The spatial analysis of railway access highlights historical disparities in infrastructure provision, directly informing Target 10.2 on promoting universal social, economic, and political inclusion. The database allows for the identification of regions and populations historically underserved by transport networks, supporting efforts to address mobility-related inequalities.
By explicitly linking analytical outcomes to these SDG targets and indicators, our study demonstrates the value of historical GIS data for evidence-based policy and planning in support of sustainable development. The database also enables comparative analyses between regions or countries, helping policymakers learn from historical successes and failures in transport development [77,79,81,83]. On a larger scale, it supports global connectivity initiatives, including cross-border transport policies and projects like the Belt and Road Initiative (BRI). By comparing historical patterns of infrastructure expansion with contemporary initiatives such as the BRI, policymakers can better anticipate the long-term impacts of large-scale transport investments and avoid replicating past inequalities [111,112].
Beyond descriptive mapping, the integration of graph theory and complex network analysis provides a powerful lens to assess the structure and efficiency of historical transport systems as dynamic [6,112]. Cities with high centrality—such as Johannesburg or Paris—emerged as key nodes in the global railway network, maintaining demographic and economic advantages over time [5,99]. This approach, exemplified by the “global accessibility map” proposed by Weiss et al. [113], offers valuable insights into network efficiency, resilience, and vulnerabilities, further enriching the understanding of transportation infrastructure dynamics and supporting SDG 13.2. While the study engages with several Sustainable Development Goals (SDGs), including SDG 9 (Infrastructure), SDG 10 (Inequality), SDG 11 (Sustainable Cities), and SDG 13 (Climate Action), these connections are best understood as contextual applications of the database rather than its primary analytical focus. For instance, the long-term perspective on infrastructure access supports SDG 9.1 and SDG 11.2 by illustrating how historical investments shaped accessibility and urban form. Similarly, the spatial analysis of underserved regions informs SDG 10.2, and modal shifts in transport systems contribute to SDG 13.2.
The historical contraction of railway networks in regions such as Sub-Saharan Africa has significant implications for climate action. Rail transport emits approximately 75% less CO2 per ton-kilometer than road freight (18 g vs. 62 g CO2 per ton-km) [114,115]. Using historical network lengths from this study’s GIS database (Europe: 152,000 km in 1880 to 202,600 km in 2020; Africa: 900 km to 15,858 km) and a conservative freight density assumption (1 million ton-km per km of rail per year), the potential annual avoided emissions if freight were carried by rail instead of road are striking: Europe could avoid 6.7 million metric tons of CO2 in 1880 and 8.9 million metric tons in 2020, while Africa could avoid 39,600 metric tons in 1880 and 698,000 metric tons in 2020. These avoided emissions estimated for 1880 represent a counterfactual scenario, assuming equivalent freight volumes would have been transported by road rather than rail, even though motorized road networks were not yet widespread. This comparison is intended to highlight the long-term climate benefits of rail relative to road transport. These figures underscore the climate benefits of rail infrastructure and highlight the consequences of modal shifts toward road transport, which contributed to Africa’s transport-related emissions reaching 326.8 Mt in 2019, a 34% increase since 2010 [115]. Linking network density trends to emissions trajectories provides a robust basis for climate-sensitive transport planning, reinforcing the need for low-carbon mobility strategies in Africa and other regions experiencing rail decline.
Despite these strengths, several limitations should be acknowledged. First, the quality and completeness of historical transport data vary significantly by region. Western Europe and parts of North America provide detailed and reliable records [53,54,58], while data for Africa, Asia, and other regions are often fragmented or lack temporal precision [84,85]. For example, in West Africa, colonial-era maps offer limited station-level data, making results more dependent on assumptions. Second, the focus on railways and ports, while foundational, does not capture the full complexity of multimodal transport systems, especially in the latter half of the twentieth century when road and air travel became increasingly important [97,98]. Third, the use of proximity thresholds (e.g., cities within two kilometers of a railway line) is a methodological necessity but may oversimplify the actual accessibility and impact of transport infrastructure, particularly in regions with challenging geography or incomplete station data. These limitations highlight the need for ongoing data collection, collaboration with local experts, and methodological refinement to enhance the robustness and representativeness of future analyses. Future efforts should incorporate additional transport modes (e.g., roads, aviation), integrate socio-economic and environmental indicators, and expand the database’s temporal and spatial coverage to support more comprehensive and equitable infrastructure planning.
In summary, the primary value of this study lies in its methodological contributions and the creation of a globally consistent historical GIS database. By enabling dynamic, data-driven analysis of transport infrastructure over time, it provides essential tools for scholars and policymakers seeking to design inclusive, resilient, and sustainable mobility systems. Future work should focus on integrating socio-economic and environmental indicators, conducting detailed case studies, and expanding the database’s coverage to support more comprehensive planning aligned with the 2030 Agenda.
The creation of a global geo-spatial database documenting railways from 1880 to 2020 marks a significant advancement in historical Geographic Information Systems (GIS) research. This comprehensive database captures the spatial and temporal evolution of railway networks across multiple countries and continents, enabling the analysis of complex patterns of growth, decline, and transformation over nearly a century and a half. By providing unprecedented detail and accuracy, the database fills a critical gap in infrastructure studies and supports both retrospective analysis and forward-looking planning.
Crucially, the findings of this study demonstrate that early and sustained access to railway infrastructure has had a measurable impact on urban growth, regional integration, and socio-economic development. The results highlight clear regional disparities: while Western Europe and parts of North America benefited from dense, well-documented networks that fostered sustained population growth and accessibility, regions such as Sub-Saharan Africa and parts of Asia experienced more fragmented development and persistent inequalities. These insights are directly relevant to the United Nations Sustainable Development Goals (SDGs), particularly SDG 9 (Industry, Innovation, and Infrastructure), SDG 10 (Reduced Inequalities), SDG 11 (Sustainable Cities and Communities), and SDG 13 (Climate Action).
Importantly, this database is not merely a static archive; it is a dynamic analytical tool that facilitates sophisticated spatial and temporal investigations. The integration of graph theory and network analysis within this framework enables the identification of key nodes, assessment of network resilience, and understanding of accessibility patterns—providing actionable evidence for policymakers and planners. Furthermore, by contextualizing historical patterns alongside contemporary initiatives such as the Belt and Road Initiative, the database offers a valuable lens for evaluating the long-term impacts of large-scale infrastructure investments and for avoiding the repetition of past inequalities.
Nevertheless, several limitations must be acknowledged. The quality and completeness of historical transport data vary significantly by region, with Western Europe and North America providing more reliable records than Africa or Asia. The current focus on railways and ports, while foundational, does not capture the full complexity of multimodal transport systems, particularly after the mid-twentieth century when road and air travel became increasingly important. Methodological choices, such as the use of proximity thresholds to define access, may also introduce uncertainties, especially in data-poor regions. To address these limitations and further enhance the value of the database, future research should prioritize these aspects.
In summary, this global historical GIS database provides rich insights into the evolution of transport networks and their role in shaping urban and regional development. Its primary value lies in informing contemporary policy and planning, supporting evidence-based strategies for sustainable, inclusive, and resilient infrastructure in line with the 2030 Agenda for Sustainable Development.
Acknowledgement: Not applicable.
Funding Statement: This research received funding from the French National Research Agency (ANR) through the research project MAGNETICS, No. ANR-22-CE22-0002.
Availability of Data and Materials: Data openly available in a public repository. The data that support the findings of this study are openly available in Nakala at: Ducruet C. (2025). Global port-city database (Versión 4) [Data set]. NAKALA—https://nakala.fr (Huma-Num-CNRS). https://doi.org/10.34847/NKL.63AF2QX5; Polo-Martín B. (2024a). Environmental sustainability in maritime hubs: the case of Santa Pola, Spain. Towards circular: analysis of the coastal areas of Greece, Italy and Spain, 1. https://doi:10.13140/RG.2.2.13073.03685; Polo Martín B. (2024b). Shapefile of railways in South America between 2000 and 2020 (Version 1) [Data set]. NAKALA. https://doi.org/10.34847/NKL.4F6491V0; Polo Martín B. (2024c). Shapefile of railways in South America between 1990 and 2010 (Version 1) [Data set]. NAKALA. https://doi.org/10.34847/NKL.F916HFI8; Polo Martín B. (2024d). Shapefile of railways in South America between 1980 and 2000 (Version 1) [Data set]. NAKALA. https://doi.org/10.34847/NKL.2C073T78; Polo Martín B. (2024e). Shapefile of railways in South America between 1960 and 1980 (Version 1) [Data set]. NAKALA. https://doi.org/10.34847/NKL.DF8FE50C; Polo Martín B. (2024f). Shapefile of railways in South America between 1940 and 1960 (Version 1) [Data set]. NAKALA. https://doi.org/10.34847/NKL.3C5EG3KP; Polo Martín B. (2024g). Shapefile of railways in South America between 1920 and 1940 (Version 1) [Data set]. NAKALA. https://doi.org/10.34847/NKL.6528MV9M; Polo Martín B. (2024h). Shapefile of railways in South America between 1900 and 1920 (Version 1) [Data set]. NAKALA. https://doi.org/10.34847/NKL.612ER61G; Polo Martín B. (2024i). Shapefile of railways in South America between 1880 and 1900 (Version 1) [Data set]. NAKALA. https://doi.org/10.34847/NKL.9ADEBL6O; Polo Martín B. (2024j). Shapefile of railways in South America between 1860 and 1880 (Version 1) [Data set]. NAKALA. https://doi.org/10.34847/NKL.AEBF04CF; Polo Martín B. (2024k). Shapefile of railways in North America between 2000 and 2020 (Version 1) [Data set]. NAKALA. https://doi.org/10.34847/NKL.0EF1059A; Polo Martín B. (2024l). Shapefile of railways in North America between 1990 and 2010 (Version 1) [Data set]. NAKALA. https://doi.org/10.34847/NKL.EEB0X97Y; Polo Martín B. (2024m). Shapefile of railways in North America between 1980 and 2000 (Version 1) [Data set]. NAKALA. https://doi.org/10.34847/NKL.A7BEC3K3; Polo Martín B. (2024n). Shapefile of railways in North America between 1960 and 1980 (Version 1) [Data set]. NAKALA. https://doi.org/10.34847/NKL.3F57G68A; Polo Martín B. (2024o). Shapefile of railways in North America between 1940 and 1960 (Version 1) [Data set]. NAKALA. https://doi.org/10.34847/NKL.0CE9AN83; Polo Martín B. (2024p). Shapefile of railways in North America between 1920 and 1940 (Version 1) [Data set]. NAKALA. https://doi.org/10.34847/NKL.1DFD2JXU; Polo Martín B. (2024q). Shapefile of railways in North America between 1900 and 1920 (Version 1) [Data set]. NAKALA. https://doi.org/10.34847/NKL.E303RI0H; Polo Martín B. (2024r). Shapefile of railways in North America between 1880 and 1900 (Version 1) [Data set]. NAKALA. https://doi.org/10.34847/NKL.03993CY1; Polo Martín B. (2024s). Shapefile of railways in North America between 1860 and 1880 (Version 1) [Data set]. NAKALA. https://doi.org/10.34847/NKL.EBF3BR7T; Polo Martín B. (2024t). Shapefile of railways in Europe between 1980 and 2000 (Version 1) [Data set]. NAKALA. https://doi.org/10.34847/NKL.CF4E09IH; Polo Martín B. (2024u). Shapefile of railways in Europe between 1960 and 1980 (Version 1) [Data set]. NAKALA. https://doi.org/10.34847/NKL.AC70IK7I; Polo Martín B. (2024v). Shapefile of railways in Europe between 1940 and 1960 (Version 1) [Data set]. NAKALA. https://doi.org/10.34847/NKL.AC9E61J4; Polo Martín B. (2024w). Shapefile of railways in Europe between 1920 and 1940 (Version 1) [Data set]. NAKALA. https://doi.org/10.34847/NKL.6296QX69; Polo Martín B. (2024x). Shapefile of railways in Europe between 1900 and 1920 (Version 1) [Data set]. NAKALA. https://doi.org/10.34847/NKL.FC15R12A; Polo Martín B. (2024y). Shapefile of railways in Europe between 1880 and 1900 (Version 1) [Data set]. NAKALA. https://doi.org/10.34847/NKL.EBC2M003; Polo Martín B. (2024z). Shapefile of railways in Europe between 1860 and 1880 (Version 1) [Data set]. NAKALA. https://doi.org/10.34847/NKL.3CEFQI3X; Polo Martín B. (2024aa). Shapefile of railways in Australia between 2000 and 2020 (Version 1) [Data set]. NAKALA. https://doi.org/10.34847/NKL.CA30B92N; Polo Martín B. (2024ab). Shapefile of railways in Australia between 1980 and 2000 (Version 1) [Data set]. NAKALA. https://doi.org/10.34847/NKL.494CA4HI; Polo Martín B. (2024ac). Shapefile of railways in Australia between 1980 and 2000 (Version 1) [Data set]. NAKALA. https://doi.org/10.34847/NKL.494CA4HI; Polo Martín B. (2024ad). Shapefile of railways in Australia between 1960 and 1980 (Version 1) [Data set]. NAKALA. https://doi.org/10.34847/NKL.ED8F8R9F; Polo Martín B. (2024ae). Shapefile of railways in Australia between 1940 and 1960 (Version 1) [Data set]. NAKALA. https://doi.org/10.34847/NKL.1ED8U4VB; Polo Martín B. (2024af). Shapefile of railways in Australia between 1920 and 1940 (Version 1) [Data set]. NAKALA. https://doi.org/10.34847/NKL.07A044F6; Polo Martín B. (2024ag). Shapefile of railways in Australia between 1900 and 1920 (Version 1) [Data set]. NAKALA. https://doi.org/10.34847/NKL.01B3EA73; Polo Martín B. (2024ah). Shapefile of railways in Australia between 1880 and 1900 (Version 1) [Data set]. NAKALA. https://doi.org/10.34847/NKL.C5C4Q8MW; Polo Martín B. (2024ai). Shapefile of railways in Australia between 1860 and 1880 (Version 1) [Data set]. NAKALA. https://doi.org/10.34847/NKL.3A95E3J0.
Ethics Approval: Not applicable.
Conflicts of Interest: The author declares no conflicts of interest to report regarding the present study.
References
1. Crafts N, Mills TC. Was 19th century British growth steam-powered?: the climacteric revisited. Explor Econ Hist. 2004;41(2):156–71. doi:10.1016/j.eeh.2003.10.001. [Google Scholar] [CrossRef]
2. Kim S. Industrialization and urbanization: did the steam engine contribute to the growth of cities in the United States? Cambridge, MA, USA: NBER Working Paper; 2005. Report No.: w11206. [Google Scholar]
3. Odlyzko A. Collective hallucinations and inefficient markets: the British railway mania of the 1840s. Amsterdam, The Netherlands: SSRN; 2010. doi:10.2139/ssrn.1537338. [Google Scholar] [CrossRef]
4. Marnot B. Les villes portuaires maritimes en France, XIXe–XXIe siècle. Paris, France: Armand Colin; 2015. (In French). doi:10.3917/arco.marno.2015.01. [Google Scholar] [CrossRef]
5. Polo-Martín B, Ducruet C. Coupled connectivity in the global complex network: the case of United Kingdom (1880–1925). Appl Netw Sci. 2024;9(1):15. doi:10.1007/s41109-024-00622-6. [Google Scholar] [CrossRef]
6. Bretagnolle A, Pumain D. Simulating urban networks through multiscalar space-time dynamics: Europe and the United States, 17th–20th centuries. Urban Stud. 2010;47(13):2819–39. doi:10.1177/0042098010377366. [Google Scholar] [CrossRef]
7. Polo-Martín B. Environmental sustainability in maritime hubs: the case of Santa Pola, Spain. In: Towards circular: analysis of the coastal areas of Greece, Italy and Spain. The Hague, The Netherlands: Think Tank AlterContacts; 2024. doi:10.13140/RG.2.2.13073.03685. [Google Scholar] [CrossRef]
8. Harvey D. Social justice and the city. London, UK: Edward Arnold; 1973. [Google Scholar]
9. Soja EW. Seeking spatial justice. Minneapolis, MN, USA: University of Minnesota Press; 2010. [Google Scholar]
10. Fainstein SS. The just city. Ithaca, NY, USA: Cornell Universi0ty Press; 2010. [Google Scholar]
11. UN-Habitat, UNEP, SLoCaT. Analysis of the transport relevance of each of the 17 SDGs. New York, NY, USA: United Nations; 2015. [Google Scholar]
12. Kapur R, Das S, Nandineni RD. Sustainable transportation infrastructure’s role in attaining sustainable development goals. In: Industry, innovation and infrastructure. Berlin/Heidelberg, Germany: Springer; 2021. doi:10.1007/978-3-319-95873-6_52. [Google Scholar] [CrossRef]
13. UITP. Why public transport is key to achieve the SDGs. Brussels, Belgium: International Association of Public Transport; 2023. [Google Scholar]
14. UNECE. Transport and the sustainable development goals. Geneva, Switzerland: United Nations Economic Commission for Europe; 2021. [Google Scholar]
15. Martens K. Transport justice: designing fair transportation systems. Oxfordshire, UK: Routledge; 2017. [Google Scholar]
16. Pereira RHM, Schwanen T, Banister D. Distributive justice and equity in transportation. Transp Rev. 2017;37(2):170–91. doi:10.1080/01441647.2016.1257660. [Google Scholar] [CrossRef]
17. Lucas K. Transport and social exclusion: where are we now? Transp Policy. 2012;20(3):105–13. doi:10.1016/j.tranpol.2012.01.013. [Google Scholar] [CrossRef]
18. Polo-Martín B. Shapefile of railways in South America between 2000 and 2020 (Version 1) [Data set]. NAKALA 2024 [cited 2025 Jan 1]. Available from: 10.34847/NKL.4F6491V0. [Google Scholar] [CrossRef]
19. Polo Martín B. Shapefile of railways in South America between 1990 and 2010 (Version 1) [Data set]. NAKALA 2024 [cited 2025 Jan 1]. Available from: 10.34847/NKL.F916HFI8. [Google Scholar] [CrossRef]
20. Polo Martín B. Shapefile of railways in South America between 1980 and 2000 (Version 1) [Data set]. NAKALA 2024 [cited 2025 Jan 1]. Available from: 10.34847/NKL.2C073T78. [Google Scholar] [CrossRef]
21. Polo Martín B. Shapefile of railways in South America between 1960 and 1980 (Version 1) [Data set]. NAKALA 2024 [cited 2025 Jan 1]. Available from: 10.34847/NKL.DF8FE50C. [Google Scholar] [CrossRef]
22. Polo Martín B. Shapefile of railways in South America between 1940 and 1960 (Version 1) [Data set]. NAKALA 2024 [cited 2025 Jan 1]. Available from: 10.34847/NKL.3C5EG3KP. [Google Scholar] [CrossRef]
23. Polo Martín B. Shapefile of railways in South America between 1920 and 1940 (Version 1) [Data set]. NAKALA 2024 [cited 2025 Jan 1]. Available from: 10.34847/NKL.6528MV9M. [Google Scholar] [CrossRef]
24. Polo Martín B. Shapefile of railways in South America between 1900 and 1920 (Version 1) [Data set]. NAKALA 2024 [cited 2025 Jan 1]. Available from: 10.34847/NKL.612ER61G. [Google Scholar] [CrossRef]
25. Polo Martín B. Shapefile of railways in South America between 1880 and 1900 (Version 1) [Data set]. NAKALA 2024 [cited 2025 Jan 1]. Available from: 10.34847/NKL.9ADEBL6O. [Google Scholar] [CrossRef]
26. Polo Martín B. Shapefile of railways in South America between 1860 and 1880 (Version 1) [Data set]. NAKALA 2024 [cited 2025 Jan 1]. Available from: 10.34847/NKL.AEBF04CF. [Google Scholar] [CrossRef]
27. Polo Martín B. Shapefile of railways in North America between 2000 and 2020 (Version 1) [Data set]. NAKALA 2024 [cited 2025 Jan 1]. Available from: 10.34847/NKL.0EF1059A. [Google Scholar] [CrossRef]
28. Polo Martín B. Shapefile of railways in North America between 1990 and 2010 (Version 1) [Data set]. NAKALA 2024 [cited 2025 Jan 1]. Available from: 10.34847/NKL.EEB0X97Y. [Google Scholar] [CrossRef]
29. Polo Martín B. Shapefile of railways in North America between 1980 and 2000 (Version 1) [Data set]. NAKALA 2024 [cited 2025 Jan 1]. Available from: 10.34847/NKL.A7BEC3K3. [Google Scholar] [CrossRef]
30. Polo Martín B. Shapefile of railways in North America between 1960 and 1980 (Version 1) [Data set]. NAKALA 2024 [cited 2025 Jan 1]. Available from: 10.34847/NKL.3F57G68A. [Google Scholar] [CrossRef]
31. Polo Martín B. Shapefile of railways in North America between 1940 and 1960 (Version 1) [Data set]. NAKALA 2024 [cited 2025 Jan 1]. Available from: 10.34847/NKL.0CE9AN83. [Google Scholar] [CrossRef]
32. Polo Martín B. Shapefile of railways in North America between 1920 and 1940 (Version 1) [Data set]. NAKALA 2024 [cited 2025 Jan 1]. Available from: 10.34847/NKL.1DFD2JXU. [Google Scholar] [CrossRef]
33. Polo Martín B. Shapefile of railways in North America between 1900 and 1920 (Version 1) [Data set]. NAKALA 2024 [cited 2025 Jan 1]. Available from: 10.34847/NKL.E303RI0H. [Google Scholar] [CrossRef]
34. Polo Martín B. Shapefile of railways in North America between 1880 and 1900 (Version 1) [Data set]. NAKALA 2024 [cited 2025 Jan 1]. Available from: 10.34847/NKL.03993CY1. [Google Scholar] [CrossRef]
35. Polo Martín B. Shapefile of railways in North America between 1860 and 1880 (Version 1) [Data set]. NAKALA 2024 [cited 2025 Jan 1]. Available from: 10.34847/NKL.EBF3BR7T. [Google Scholar] [CrossRef]
36. Polo Martín B. Shapefile of railways in Europe between 1980 and 2000 (Version 1) [Data set]. NAKALA 2024 [cited 2025 Jan 1]. Available from: 10.34847/NKL.CF4E09IH. [Google Scholar] [CrossRef]
37. Polo Martín B. Shapefile of railways in Europe between 1960 and 1980 (Version 1) [Data set]. NAKALA 2024 [cited 2025 Jan 1]. Available from: 10.34847/NKL.AC70IK7I. [Google Scholar] [CrossRef]
38. Polo Martín B. Shapefile of railways in Europe between 1940 and 1960 (Version 1) [Data set]. NAKALA 2024 [cited 2025 Jan 1]. Available from: 10.34847/NKL.AC9E61J4. [Google Scholar] [CrossRef]
39. Polo Martín B. Shapefile of railways in Europe between 1920 and 1940 (Version 1) [Data set]. NAKALA 2024 [cited 2025 Jan 1]. Available from: 10.34847/NKL.6296QX69. [Google Scholar] [CrossRef]
40. Polo Martín B. Shapefile of railways in Europe between 1900 and 1920 (Version 1) [Data set]. NAKALA 2024 [cited 2025 Jan 1]. Available from: 10.34847/NKL.FC15R12A. [Google Scholar] [CrossRef]
41. Polo Martín B. Shapefile of railways in Europe between 1880 and 1900 (Version 1) [Data set]. NAKALA 2024 [cited 2025 Jan 1]. Available from: 10.34847/NKL.EBC2M003. [Google Scholar] [CrossRef]
42. Polo Martín B. Shapefile of railways in Europe between 1860 and 1880 (Version 1) [Data set]. NAKALA 2024 [cited 2025 Jan 1]. Available from: 10.34847/NKL.3CEFQI3X. [Google Scholar] [CrossRef]
43. Polo Martín B. Shapefile of railways in Australia between 2000 and 2020 (Version 1) [Data set]. NAKALA 2024 [cited 2025 Jan 1]. Available from: 10.34847/NKL.CA30B92N. [Google Scholar] [CrossRef]
44. Polo Martín B. Shapefile of railways in Australia between 1980 and 2000 (Version 1) [Data set]. NAKALA 2024 [cited 2025 Jan 1]. Available from: 10.34847/NKL.494CA4HI. [Google Scholar] [CrossRef]
45. Polo Martín B. Shapefile of railways in Australia between 1960 and 1980 (Version 1) [Data set]. NAKALA 2024 [cited 2025 Jan 1]. Available from: 10.34847/NKL.ED8F8R9F. [Google Scholar] [CrossRef]
46. Polo Martín B. Shapefile of railways in Australia between 1940 and 1960 (Version 1) [Data set]. NAKALA 2024 [cited 2025 Jan 1]. Available from: 10.34847/NKL.1ED8U4VB. [Google Scholar] [CrossRef]
47. Polo Martín B. Shapefile of railways in Australia between 1920 and 1940 (Version 1) [Data set]. NAKALA 2024 [cited 2025 Jan 1]. Available from: 10.34847/NKL.07A044F6. [Google Scholar] [CrossRef]
48. Polo Martín B. Shapefile of railways in Australia between 1900 and 1920 (Version 1) [Data set]. NAKALA 2024 [cited 2025 Jan 1]. Available from: 10.34847/NKL.01B3EA73. [Google Scholar] [CrossRef]
49. Polo Martín B. Shapefile of railways in Australia between 1880 and 1900 (Version 1) [Data set]. NAKALA 2024 [cited 2025 Jan 1]. Available from: 10.34847/NKL.C5C4Q8MW. [Google Scholar] [CrossRef]
50. Polo Martín B. Shapefile of railways in Australia between 1860 and 1880 (Version 1) [Data set]. NAKALA 2024 [cited 2025 Jan 1]. Available from: 10.34847/NKL.3A95E3J0. [Google Scholar] [CrossRef]
51. Ducruet C. Global port-city database (Version 4) [Data set]. NAKALA 2025 [cited 2025 Jan 1]. Available from: 10.34847/NKL.63AF2QX5. [Google Scholar] [CrossRef]
52. United Nations Statistics Division. Geography in implementing the SDGs. In: United Nations Data Forum; 2021 Oct 3–6; Bern, Switzerland. Available from: https://unstats.un.org/unsd/undataforum/blog/geography-in-implementing-the-SDGs/. [Google Scholar]
53. Esteban-Oliver G, Martí-Henneberg J. The Spanish railway network, 1848–2023. J Iber Lat Am Econ Hist. 2024;42(1):153–69. doi:10.1017/s021261092400003x. [Google Scholar] [CrossRef]
54. Martí-Henneberg J, Satchell M, You X, Shaw-Taylor L, Wrigley EA. 1861 England, Wales and Scotland rail lines. Colchester, UK: UK Data Archive; 2018. [Google Scholar]
55. Thévenin T, Schwartz R, Sapet L. Mapping the distortions in time and space: the French railway network 1830–1930. Hist Meth. 2013;46(3):134–43. doi:10.1080/01615440.2013.803409. [Google Scholar] [CrossRef]
56. Groote P, Ciccarelli C. GIS dataset of Italian railway development, 1839–1913 [dataset]. Mendeley 2020 [cited 2025 Jan 1]. Available from: 10.17632/RJWCCJGY7Z.1. [Google Scholar] [CrossRef]
57. Kaim D, Taczanowski J, Szwagrzyk M, Ostafin K. Railway network of Galicia and Austrian Silesia (1847–1914). J Maps. 2020;16(1):132–7. doi:10.1080/17445647.2020.1762774. [Google Scholar] [CrossRef]
58. Büchel K, Kyburz S. Fast track to growth? Railway access, population growth and local displacement in 19th century Switzerland. J Econ Geogr. 2020;20(1):155–95. doi:10.1093/jeg/lby046. [Google Scholar] [CrossRef]
59. Knowles AK, Healey RG. Geography, timing, and technology: a GIS-based analysis of Pennsylvania’s iron industry, 1825–1875. J Econ Hist. 2006;66(3):608–34. doi:10.1017/s0022050706000271. [Google Scholar] [CrossRef]
60. Donaldson D. Railroads of the raj: estimating the impact of transportation infrastructure. Am Econ Rev. 2018;108(4–5):899–934. doi:10.1257/aer.20101199. [Google Scholar] [CrossRef]
61. Cartography Office GD. Historical Canadian railroads [dataset]. Vienna, Austria: Borealis; 2020. doi:10.5683/SP2/UCCFVQ. [Google Scholar] [CrossRef]
62. Astari AJ, Mohamed AAA, Ridwana R. The role of geographic information science in achieving sustainable development goals (SDGs) during the COVID-19 pandemic. J Geogr Gea. 2021;21(2):112–22. doi:10.17509/gea.v21i2.39418. [Google Scholar] [CrossRef]
63. Polo Martín B. COVID-19: cartography as a witness of change of Spanish urban models along history due to sanitary crisis. Athens J Mediterr Stud. 2021;8(1):29–48. doi:10.30958/ajms.8-1-2. [Google Scholar] [CrossRef]
64. Gregory IN, Marti-Henneberg J, Tapiador FJ. Modelling long-term pan-European population change from 1870 to 2000 by using geographical information systems. J R Stat Soc Ser A Stat Soc. 2010;173(1):31–50. doi:10.1111/j.1467-985x.2009.00598.x. [Google Scholar] [CrossRef]
65. Siebert L. Using GIS to map rail network history. J Transp Hist. 2004;25(1):84–104. doi:10.7227/tjth.25.1.5. [Google Scholar] [CrossRef]
66. Morillas-Torné M. Creation of a geo-spatial database to analyse railways in Europe (1830–2010). A historical GIS approach. J Geogr Inf Syst. 2012;4(2):176–87. doi:10.4236/jgis.2012.42023. [Google Scholar] [CrossRef]
67. Gregory IN, Bennett C, Gilham VL, Southall HR. The Great Britain historical GIS project: from maps to changing human geography. Cartogr J. 2002;39(1):37–49. doi:10.1179/caj.2002.39.1.37. [Google Scholar] [CrossRef]
68. Gregory IN, Healey RG. Historical GIS: structuring, mapping and analysing geographies of the past. Prog Hum Geogr. 2007;31(5):638–53. doi:10.1177/0309132507081495. [Google Scholar] [CrossRef]
69. Gregory IN. Exploiting time and space: a challenge for GIS in the digital humanities. In: Bodenhamer DJ, Corrigan J, Harris TM, editors. The spatial humanities. Bloomington, Indiana: Indiana University Press; 2010. p. 58–75. [Google Scholar]
70. Cattan N. Cities and networks in Europe: a critical approach of polycentrism. Montrouge, France: John Libbey Eurotext; 2007. [Google Scholar]
71. Stanev K, Martí-Henneberg J, Ivanov M. Regional transformations of a state under construction: Bulgaria, 1878–2002. J Interdiscip Hist. 2011;42(1):111–34. doi:10.1162/jinh_a_00207. [Google Scholar] [CrossRef]
72. da Silveira LE, Alves D, Lima NM, Alcântara A, Puig J. Population and railways in Portugal, 1801–1930. J Interdiscip Hist. 2011;42(1):29–52. doi:10.1162/jinh_a_00204. [Google Scholar] [CrossRef]
73. Akgüngör S, Aldemir C, Kuştepeli Y, Gülcan Y, Tecim V. The effect of railway expansion on population in Turkey, 1856–2000. J Interdiscip Hist. 2011;42(1):135–57. doi:10.1162/jinh_a_00208. [Google Scholar] [CrossRef]
74. Kotavaara O, Antikainen H, Rusanen J. Urbanization and transportation in Finland, 1880–1970. J Interdiscip Hist. 2011;42(1):89–109. doi:10.1162/jinh_a_00206. [Google Scholar] [CrossRef]
75. Brons M, Givoni M, Rietveld P. Access to railway stations and its potential in increasing rail use. Transp Res Part A Policy Pract. 2009;43(2):136–49. doi:10.1016/j.tra.2008.08.002. [Google Scholar] [CrossRef]
76. Mojica L, Martí-Henneberg J. Railways and population distribution: France, Spain, and Portugal, 1870–2000. J Interdiscip Hist. 2011;42(1):15–28. doi:10.1162/jinh_a_00203. [Google Scholar] [CrossRef]
77. Alvarez E, Franch X, Martí-Henneberg J. Evolution of the territorial coverage of the railway network and its influence on population growth: the case of England and Wales, 1871–1931. Hist Meth. 2013;46(3):175–91. doi:10.1080/01615440.2013.804788. [Google Scholar] [CrossRef]
78. Baron N. Railways and demographic change. In: Finger M, Messulam P, editors. Rail economics, policy and regulation in Europe. Cheltenham, UK: Edward Elgar Publishing; 2015. p. 22–38. doi:10.4337/9781783473335.00007. [Google Scholar] [CrossRef]
79. Schwartz R, Gregory I, Thévenin T. Spatial history: railways, uneven development, and population change in France and Great Britain, 1850–1914. J Interdiscip Hist. 2011;42(1):53–88. doi:10.1162/jinh_a_00205. [Google Scholar] [CrossRef]
80. Atack J, Bateman F, Haines M, Margo RA. Did railroads induce or follow economic growth?: urbanization and population growth in the American Midwest, 1850–1860. Soc Sci Hist. 2010;34(2):171–97. doi:10.1215/01455532-2009-024. [Google Scholar] [CrossRef]
81. Wang J, Jin F, Mo H, Wang F. Spatiotemporal evolution of China’s railway network in the 20th century: an accessibility approach. Transp Res Part A Policy Pract. 2009;43(8):765–78. doi:10.1016/j.tra.2009.07.003. [Google Scholar] [CrossRef]
82. Hu H, Wang J, Jin F, Ding N. Evolution of regional transport dominance in China 1910–2012. J Geogr Sci. 2015;25(6):723–38. doi:10.1007/s11442-015-1198-3. [Google Scholar] [CrossRef]
83. Koopmans C, Rietveld P, Huijg A. An accessibility approach to railways and municipal population growth, 1840–1930. J Transp Geogr. 2012;25(1):98–104. doi:10.1016/j.jtrangeo.2012.01.031. [Google Scholar] [CrossRef]
84. Baffi S. Le chemin de fer et la ville dans le processus de territorialisation en Afrique du Sud: de la séparation à l’intégration territorial [dissertation]. Paris, France: Université Panthéon-Sorbonne; 2016. [cited 2025 Jan 1]. Available from: https://tel.archives-ouvertes.fr/tel-02505183. (In French). [Google Scholar]
85. Matekenya D, Espinet Alegre X, Arroyo Arroyo F, Gonzalez M. Using mobile data to understand urban mobility patterns in Freetown, Sierra Leone. Washington, DC, USA: World Bank; 2021. doi:10.1596/1813-9450-9519. [Google Scholar] [CrossRef]
86. Jayasinghe A, Jezan T. Fractal dimension of urban form elements and its relationships: in the case of city of Colombo. Asian J Eng Technol. 2014;2(2):98–108. [Google Scholar]
87. Puertos del Estado. Historia y funciones de la Comisión de Faros. Bol Mens. 2000;80. (In Spanish). [Google Scholar]
88. Pereda F, Marías F. El atlas del rey planeta: la descripción de España y de las costas y puertos de sus reinos de Pedro Teixeira, 1634. Hondarribia, Spain: Nerea; 2002. (In Spanish). [Google Scholar]
89. Castillo D, Valdaliso JM. Path dependence and change in the Spanish port system in the long run (1880–2014an historical perspective. Int J Marit Hist. 2017;29(3):569–96. doi:10.1177/0843871417712636. [Google Scholar] [CrossRef]
90. Alvarez-Palau EJ, Esteban-Oliver G, Martí-Henneberg J. Historical ports, lighthouses, and navigable waterways in Spain [Dataset]. Barcelona, Spain: CORA. Repositori de Dades de Recerca; 2024. [Google Scholar]
91. Esteban-Oliver G, Álvarez-Palau EJ, Martí-Henneberg J. Infraestructuras para la navegación en la España moderna y liberal: puertos, faros, canales y ríos navegables. Investig Hist Econ. 2024;1–8. doi:10.33231/j.ihe.2024.05.001. [Google Scholar] [CrossRef]
92. Dunn OB, Alvarez-Palau EJ. Dataset for historical lighthouses and light aids to navigation (LAN). England and Wales, 1514–1911. Data Brief. 2020;31:105991. doi:10.1016/j.dib.2020.105991. [Google Scholar] [PubMed] [CrossRef]
93. Song L, van Geenhuizen M. Port infrastructure investment and regional economic growth in China: panel evidence in port regions and provinces. Transp Policy. 2014;36(1):173–83. doi:10.1016/j.tranpol.2014.08.003. [Google Scholar] [CrossRef]
94. Martí-Henneberg J, Morillas-Torné M, Álvarez-Palau EJ, Polo-Martin B. Urban morphology in historical GIS. In: Creative ways to apply historical GIS. Cham, Switzerland: Springer; 2023. doi:10.1007/978-3-031-21731-9_12. [Google Scholar] [CrossRef]
95. Eagle N, Macy M, Claxton R. Network diversity and economic development. Science. 2010;328(5981):1029–31. doi:10.1126/science.1186605. [Google Scholar] [PubMed] [CrossRef]
96. Vespignani A. Complex networks: the fragility of interdependency. Nature. 2010;464(7291):984–5. doi:10.1038/464984a. [Google Scholar] [PubMed] [CrossRef]
97. Boccaletti S, Bianconi G, Criado R, Del Genio CI, Gómez-Gardeñes J, Romance M, et al. The structure and dynamics of multilayer networks. Phys Rep. 2014;544(1):1–122. doi:10.1016/j.physrep.2014.07.001. [Google Scholar] [PubMed] [CrossRef]
98. Garas A. Interconnected networks. In: Understanding complex systems. Berlin/Heidelberg, Germany: Springer; 2016. doi:10.1007/978-3-319-23947-7. [Google Scholar] [CrossRef]
99. Pumain D. Hierarchy in natural and social sciences. Berlin/Heidelberg, Germany: Springer; 2006. doi:10.1007/1-4020-4127-6. [Google Scholar] [CrossRef]
100. Pumain D, Paulus F, Vacchiani-Marcuzzo C. Innovation cycles and urban dynamics. In: Lane D, Pumain S, van der Leeuw G, West G, editors. Complexity perspectives in innovation and social change. Berlin/Heidelberg, Germany: Springer; 2009. p. 237–60. doi:10.1007/978-1-4020-9663-1_9. [Google Scholar] [CrossRef]
101. Xie F, Levinson D. Modeling the growth of transportation networks: a comprehensive review. Netw Spat Econ. 2009;9(3):291–307. doi:10.1007/s11067-007-9037-4. [Google Scholar] [CrossRef]
102. Ducruet C, Berli J. Measuring land-sea interactions at ports and cities: insights from geomatics and network analysis. Portus. 2018;35:1–12. [Google Scholar]
103. Ducruet C, Cuyala S, El Hosni A. Maritime networks as systems of cities: the long-term interdependencies between global shipping flows and urban development (1890–2010). J Transp Geogr. 2018;66(1–3):340–55. doi:10.1016/j.jtrangeo.2017.10.019. [Google Scholar] [CrossRef]
104. Li X, Neal ZP. Are larger cities more central in urban networks: a meta-analysis. Glob Netw. 2024;24(2):e12467. doi:10.1111/glob.12467. [Google Scholar] [CrossRef]
105. The lancet planetary health repository. [cited 2025 Jan 1]. Available from: https://github.com/PierreMasselot/Paper–2023–LancetPH–EUcityTRM. [Google Scholar]
106. Lahmeyer J. Growth of the population per country in a historical perspective 2015. [cited 2025 Jan 1]. Available from: http://www.populstat.info/. [Google Scholar]
107. Fujita M, Krugman PR, Venables AJ. The spatial economy: cities, regions, and international trade. Cambridge, MA, USA: MIT Press; 1999. [Google Scholar]
108. Gregory IN. A place in history: a guide to using GIS in historical research. Belfast, UK: Centre for Data Digitisation and Analysis; 2005. [Google Scholar]
109. Bogart D, You X, Alvarez-Palau EJ, Satchell M, Shaw-Taylor L. Railways, divergence, and structural change in 19th century England and Wales. J Urban Econ. 2022;128(2):103390. doi:10.1016/j.jue.2021.103390. [Google Scholar] [CrossRef]
110. Coll Ardanuy M, Beelen K, Lawrence J, McDonough K, Nanni F. Station to station: linking and enriching historical British railway data. In: Proceedings of the Conference on Computational Humanities Research; 2021 Nov 17–19; Amsterdam, The Netherlands. [Google Scholar]
111. Melo PC, Graham DJ, Noland RB. A meta-analysis of estimates of urban agglomeration economies. Reg Sci Urban Econ. 2009;39(3):332–42. doi:10.1016/j.regsciurbeco.2008.12.002. [Google Scholar] [CrossRef]
112. Bird J, Lebrand M, Venables AJ. The Belt and Road initiative: reshaping economic geography in central Asia? Washington, DC, USA: World Bank. Report No.: 8807. Available from: 10.1596/1813-9450-8807. [Google Scholar] [CrossRef]
113. Weiss DJ, Nelson A, Gibson HS, Temperley W, Peedell S, Lieber A, et al. A global map of travel time to cities to assess inequalities in accessibility in 2015. Nature. 2018;553(7688):333–6. doi:10.1038/nature25181. [Google Scholar] [PubMed] [CrossRef]
114. IPCC. 2019 refinement to the 2006 IPCC guidelines for national greenhouse gas inventories. Geneva, Switzerland: Intergovernmental Panel on Climate Change; 2019. [Google Scholar]
115. IEA. CO2 emissions in 2023. Paris, France: International Energy Agency; 2023. [Google Scholar]
Cite This Article
 Copyright © 2026 The Author(s). Published by Tech Science Press.
This work is licensed under a Creative Commons Attribution 4.0 International License , which permits unrestricted use, distribution, and reproduction in any medium, provided the original work is properly cited.
 Downloads
 Citation Tools