
 Submit a Paper
 Propose a Special lssue
 Open Access
ARTICLE

Accuracy Assessment of Smartphone LiDAR in 3D Bridge Modelling
1 Faculty of Built Environment, Universiti Teknologi MARA, Shah Alam, Selangor, Malaysia
2 Malaysia Institute of Transport (MITRANS), Universiti Teknologi MARA, Shah Alam, Selangor, Malaysia
* Corresponding Author: Noraain Mohamed Saraf. Email:
(This article belongs to the Special Issue: Advancements in Geospatial Methods and Technologies for Sustainable Built Environment and Engineering)
Revue Internationale de Géomatique 2026, 35, 101-120. https://doi.org/10.32604/rig.2026.072359
Received 25 August 2025; Accepted 26 January 2026; Issue published 24 February 2026
 View Full Text
 Download PDF
Abstract
The integration of Light Detection and Ranging (LiDAR) technology into consumer electronics like smartphones has created new opportunities for the use of three-dimensional (3D) modelling, especially in the domains of infrastructure inspection and civil engineering. This paper presents the accuracy of a 3D bridge model generated using a smartphone LiDAR application in comparison with conventional surveying methods. In this study, LiDAR data were captured using an iPhone 13 Pro and processed to generate 3D models. The accuracy of the generated model was then validated against reference data obtained from a tacheometry survey, which served as a ground truth for Root Mean Square Error (RMSE) determination based upon coordinates, distance measurements and volumetric comparison. The results indicate that smartphone LiDAR achieves coordinate RMSE values within the decimeter to submeter range for both Ground Control Points (GCPs) and bridge edge features. The RMSE values obtained for the GCPs were 0.324, 0.274 and 0.298 m, respectively. Distance analysis revealed moderate differences of 0.278, 0.668 and 0.455 m, respectively, while the volumetric comparison showed a relatively small overall difference of 0.679 m3 between the two methods. These values validate that the smartphone LiDAR is suitable for preliminary bridge documentation, 3D visualization and rapid geometric assessment. Nevertheless, it cannot serve as a replacement for high precision surveying methods required for detailed structural inspection. Overall, the findings demonstrate the potential of smartphone LiDAR as a cost-effective complementary device for bridge modelling applications in the fields of geomatics and civil engineering.Keywords
Bridge inspection and measurement are essential for ensuring structural condition, safety, and functionality. Regular assessment allows potential deterioration or defects to be identified at an early stage, thereby reducing the risk of severe damage, costly repairs or unexpected structural failure. In real operating conditions, bridge structures are continuously subjected to traffic loads and environmental influences, making systematic monitoring an essential aspect of infrastructure management rather than an optional activity. One effective approach in this regard is the use of 3D models for bridge measurement and inspection [1]. High resolution 3D models provide detailed geometric information that facilitates the identification of deformation, surface irregularities, and material degradation that could affect structural performance. From an engineering perspective, these models also support structural evaluation tasks, including load assessment and analysis of environmental responses, by enabling such assessments to be carried out within a digital environment [2]. Beyond inspection purposes, 3D modelling also contributes to maintenance planning by allowing alternative intervention strategies to be visualized and assessed before implementation. From an operational perspective, this can help optimize resource allocation and reduce disruptions to traffic and transportation networks [3].
However, by comparing the image-based and angle measurements, distance measures take more time. It is not always feasible to acquire images and assess distance and angle at the same time [4]. To address these limitations, there is an increasing demand in the geomatic research community to embrace surveying methods that meet all of the domain’s objectives, including decreased costs, reduced human labour, simplicity of use, dependability, and efficiency [5]. Complex 3D surveys often require integration of heterogeneous data from many sources [6]. For instance, Mobile Laser Scanning (MLS) can achieve centimeter accuracy, but its quality depends on the device used, data acquisition speed and the distance of the detected objects [7]. In structural safety inspections, non-contact techniques such as laser scanning, thermal imaging and photogrammetry are increasingly applied [8]. Among these, structural health monitoring (SHM) has proven to be one of the finest methods for identifying and diagnosing damage, examining changes brought on by damage spreading, and determining the general health of a bridge [9].
Bridges are infrastructural components that span barriers and connect two or more remote locations. They provide our society with the tools it needs to function both effectively and at all. Priority is given to their health (suitability for the intended use, safety, and circumstances), soundness, and functioning [10]. Bridges are subjected to constant applied stresses, including traffic, wind, and temperature, which hasten the deterioration of both the structure and its individual parts. To evaluate the state of the bridge, general and primary bridge studies are planned every two and six years, respectively. The occasional and somewhat subjective nature of inspections makes regular and thorough SHM necessary. The goal of SHM is to evaluate the bridge’s performance and assist the asset owner in making the necessary intervention choices [11]. When the LiDAR is permanently deployed at a fixed location in the field, even a slight deformation can lead to significant errors for far objects [12].
With the growing accessibility of mobile devices, new opportunities for 3D data acquisition have emerged. An Application such as PIX4DCatch for scanning purposes, a detailed survey plan is produced by processing the scanned data using Cloud Compare to compare every feature based on the drain invert level, building coordinates, building area, and ground control point [13]. According to Corradetti et al. [14], the PIX4Dcatch application is a component of a broader software package that also contains the well-known Structure from Motion (SfM) photogrammetric reconstruction programmed PIX4Dmapper. Given that almost everyone has a smart device these days, anyone can help preserve historical sites by taking digital photos of the site [15]. By using point-pair-picking between models, co-registration of the automatically scaled models may be carried out without a global reference. The smartphone can only be used for smaller-scale projects due to its 5 m distance range [16]. A high accuracy instrument must be used to establish a record measurement used as the true location of said features [17].
The importance of accurate 3D data is also evident in the construction sector, where building information modelling (BIM) integrates digital project data for lifecycle management. It is a coordinated procedure where managing a project’s functional and physical aspects involves digitally modelling the project’s actual construction [18]. Despite these benefits, producing detailed 3D models with conventional tools requires significant time and expertise, for example, Autodesk REVIT, estimated that it took around one working day [19].
Recent developments in mobile technologies and sensor fusion have further expanded the potential for 3D data acquisition in infrastructure monitoring and geomatics applications. Several studies have shown that the integration of data from heterogeneous sensors can enhance the robustness and interpretability of spatial information, particularly when applied in complex engineering environments. In practice, however, the performance of low-cost and consumer-grade sensors is highly sensitive to factors such as acquisition conditions, sensor characteristics, and the adopted data processing workflow. As a result, systematic accuracy assessment remains essential for developing a realistic understanding of the practical capabilities and limitations of smartphone-based LiDAR systems in infrastructure-related applications [20,21]. In this context, the present study evaluates the accuracy of smartphone LiDAR for 3D bridge modelling by comparing outputs from mobile scanning applications with those obtained using conventional surveying methods, with particular attention given to its suitability for preliminary infrastructure documentation.
Accuracy and cost efficiency have been widely recognized as key factors driving the adoption of mobile 3D scanning technologies for 3D bridge modelling and measurement. This emerging approach minimizes costs associated with conventional bridge evaluation methods while guaranteeing accurate findings through the optimization of scanning operations, data processing, and equipment affordability. By addressing challenges associated with labour and expensive equipment, this economical alternative improves the general effectiveness of bridge inspection procedures [22].
In parallel with advances in scanning hardware, a range of affordable and user-friendly mobile applications has been developed specifically to support bridge measurement and inspection tasks [16]. These applications enable inspection teams to collect visual and spatial data, including images, videos, and geometric information, directly in the field using mobile devices. The integration of automated data processing, image recognition techniques, and Global Positioning System (GPS) tagging further extends their functionality, allowing inspection teams to document and assess structural conditions more efficiently while reducing the reliance on manual inspection processes. In addition, 3D point cloud data have been increasingly employed for monitoring construction sites, construction activities, and associated equipment. Various techniques have been introduced for point cloud acquisition, particularly range-based methods such as laser scanning, which remain among the most established approaches [23].
When mobile 3D scanning technologies are combined with intuitive smartphone-based applications, bridge measurement and inspection tools become more accessible to a broader range of infrastructure management agencies and inspection teams. From a practical perspective, the cost-effectiveness of these solutions supports more frequent and comprehensive assessments, which in turn contribute to improved maintenance planning and long-term infrastructure management. Ultimately, this approach encourages the development of more efficient and sustainable methods for bridge measurement and modelling, thereby supporting the safety and durability of critical infrastructure assets [11].
Building upon these advancements, the increasing availability of smart devices equipped with sophisticated sensing capabilities has further expanded the scope of mobile-based spatial data acquisition. Devices such as the iPhone 13 Pro, are equipped with an array of sensors, such as LiDAR sensors, GNSS receivers, and high-resolution cameras, which make them effective instruments for mapping and data collection. The widespread accessibility of smart devices is a major benefit when it comes to mapping historical sites. Mobile sensing can be used to perform precise, real-time data acquisition at low setup costs thanks to recent advancements in robotic technology. With the ability to provide faster data rates and precise time synchronization, it is regarded as an advanced and sophisticated application of wireless sensing technology, the next wave of wireless sensing technology. Like smartphones, mobile sensors have a number of appealing features that SHM applications can take advantage of. In addition to their affordability, efficiency, and portability, these sensors can be seamlessly integrated with wireless and camera sensors to facilitate swifter and simpler data collection [5].
The benefit of quickly and easily gathering data is the ability to create a 3D representation of the nearby environment without any prior planning. Authorities, communities, and citizen science initiatives are further empowered to monitor environmental change with unprecedented simplicity because to the widespread availability, easy handling, and quick application. It is more affordable than Terrestrial Laser Scanning (TLS) or SfM-MVS (Multi-View Stereo) approaches because integrated data processing and live visualization of the collected surfaces minimize the amount of hardware and software needed. Sharing of data across many platforms and infrastructures is made possible by exporting point clouds or meshes in standard formats. By using point-pair-picking between models, co-registration of the automatically scaled models may be carried out without a global reference [24]. In contrast to the sides that were directly scanned, the vertices connected by the Triangulated Irregular Network (TIN) lines on the interpolated side are somewhat apart. Because of this, the longer TIN lines on the interpolated side could depict the surface geometry with less accuracy and smoothness. Shorter TIN lines are made possible by the availability of more data points on the directly scanned sides, which improves the accuracy of the depiction of surface changes and fine features. Additionally, a thorough volume analysis was carried out using the surface created from the smartphone data set that was downloaded from Pix4Dsurvey and imported into AutoCAD Civil 3D. More tools and features were made available by AutoCAD Civil 3D to precisely determine the volume using the surface data produced by the smartphone scans [15].
Furthermore, the structural input parameters of the analysis model are constantly altered by the state of the bridge as it ages. For example, the structural characteristics evaluate the following reducing factors: corrosion, material degradation, and fractures in steel elements. The postprocessing phase’s activities and time commitment might greatly vary depending on the intended applications. In order to produce a material inventory, the scope involved evaluating the various materials, their characteristics, and the quantity of waste generated. As a result, the postprocessing involved assembling the several departments that comprised the flat, exporting all components, modifying the BIM, and evaluating and compiling pertinent data via spreadsheets. Other activities were created based on the case study’s framework, including modelling more components like roofs and staircases and copying the full structure. Just to give you an idea of how much work this required, an expert with experience with 3D modelling tools, such as Autodesk REVIT, estimated that it took around one working day [19].
To support effective bridge maintenance, models must reach the highest level of development (LOD), integrating both high precision graphical data and linked structural information. This requires a data rich digital bridge model verified against field measurement. A federated model, combining BIM with real world inspection data, has been proposed as a framework to achieve this integration [25].
The purpose of this study is to assess a 3D mobile scanner application’s accuracy for possible usage in technological assessment, with an emphasis on bridge structures. To accomplish the goal, this research uses a variety of strategies. First, a 3D bridge model is generated using data collected from a mobile 3D scanner and processed using Revit software. The accuracy of the 3D model created by a mobile 3D scanning software is then assessed by comparing it against reference data obtained through a tacheometry survey. This comparison allows verification of the mobile scanner’s performance. The overall research methodology is illustrated in Fig. 1.
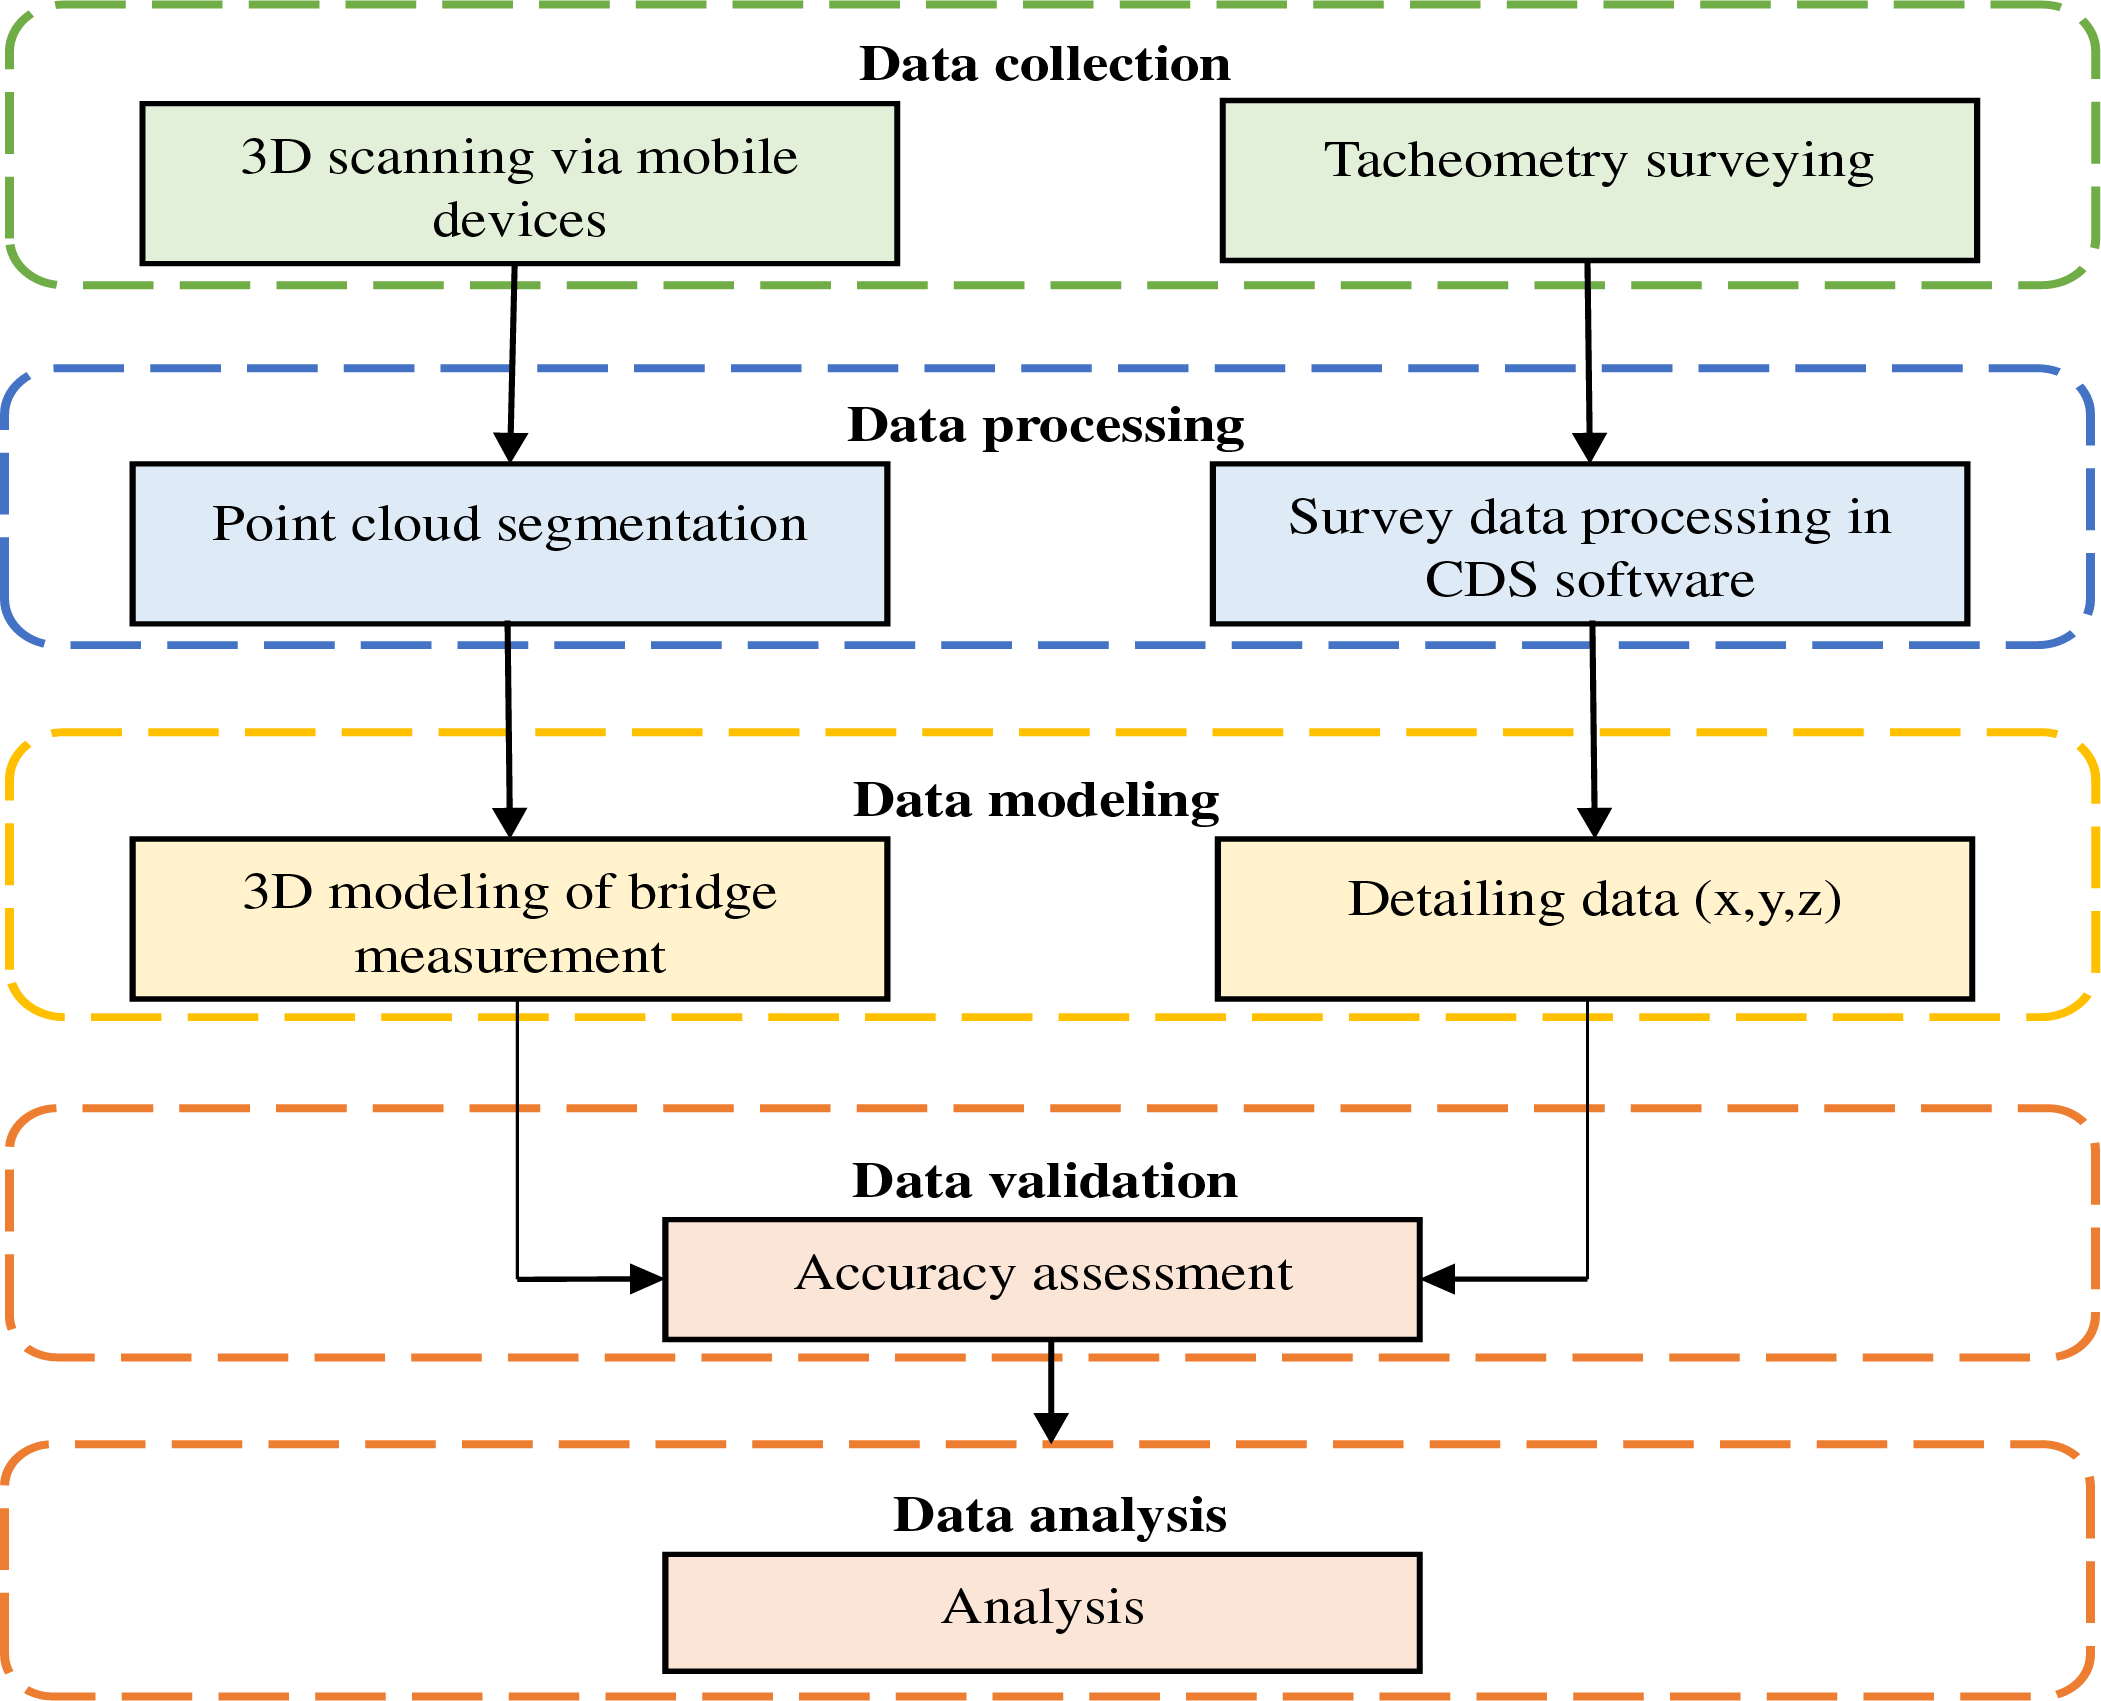
Figure 1: Flowchart of methodology.
The study area is located at Perpustakaan Tun Abdul Razak (PTAR), Universiti Teknologi MARA (UiTM) Shah Alam. PTAR is the main academic library of UiTM Shah Alam that functions as a central hub for academic resources, strategically situated within the campus core. For pedestrian access, a bridge connects the PTAR to the Hal Ehwal Pelajar (HEP) building. This elevated structure provides a safe and direct links between the two facilities that enabling seamless movement for students and staffs (Figs. 2 and 3).
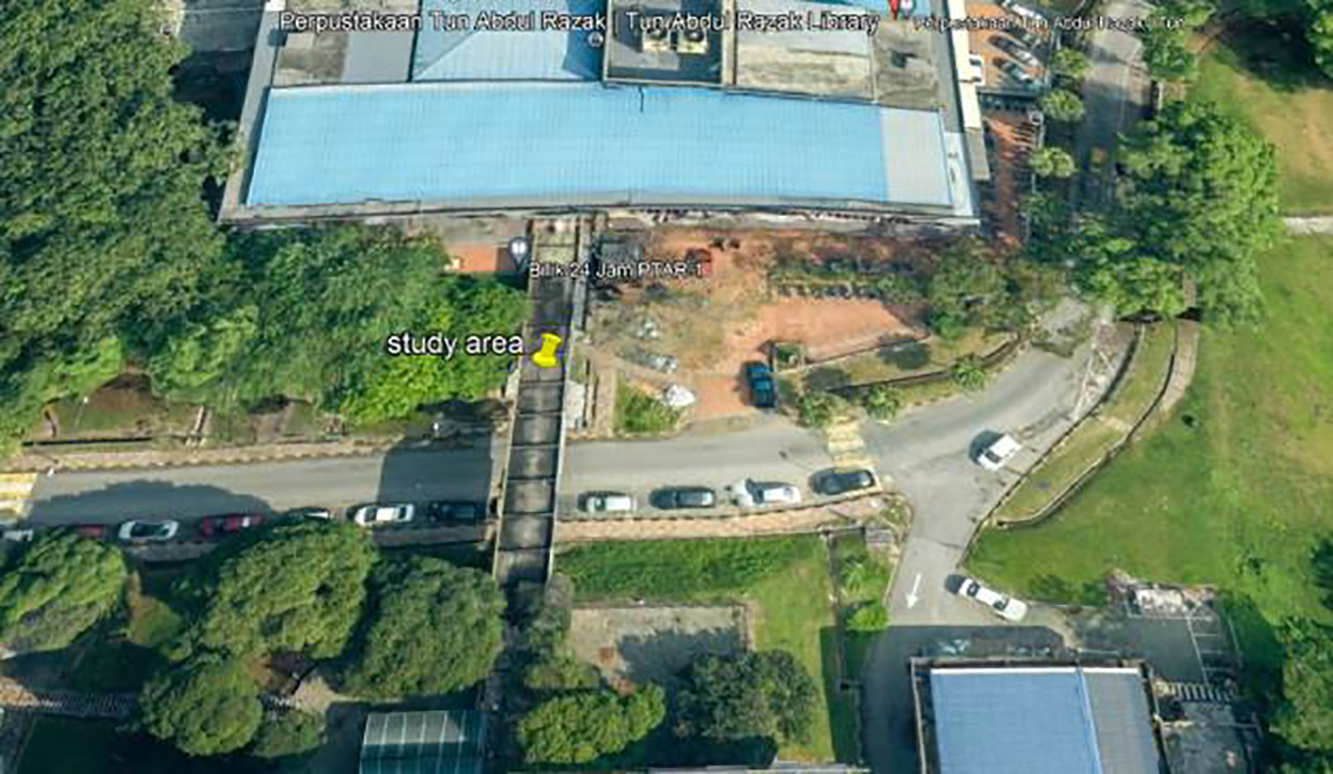
Figure 2: Location of study area.
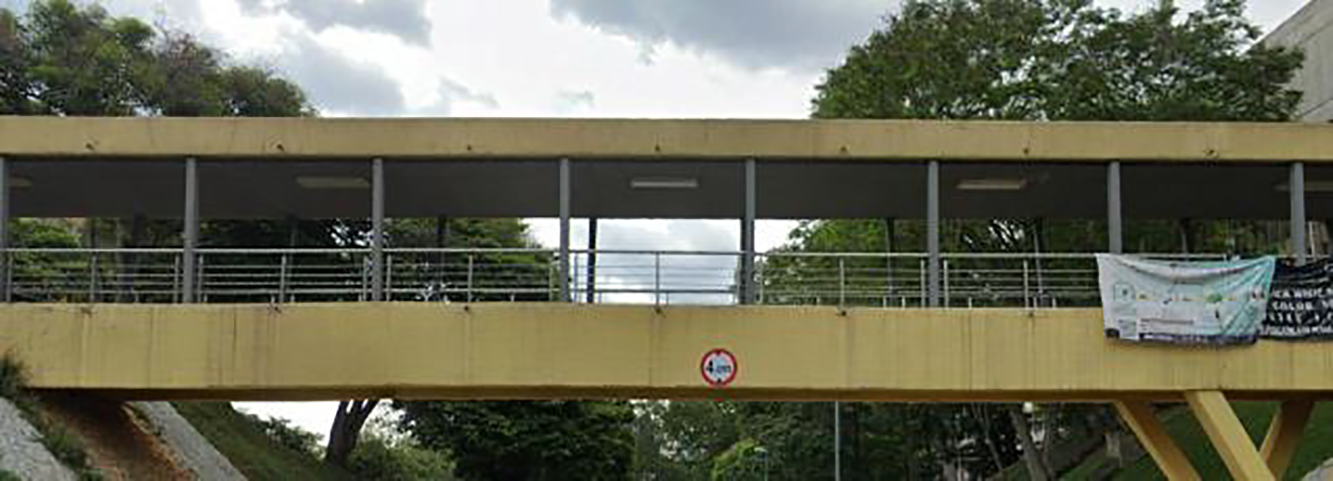
Figure 3: Pedestrian bridge links PTAR and HEP building.
The initial stage of this study involved data collection using an iPhone 13 Pro with an integrated LiDAR sensor to capture 3D spatial information of the pedestrian bridge structure. The scanning process was conducted by walking along both sides of the pedestrian bridge and beneath the bridge deck, maintaining an average scanning distance of approximately 2–5 m, which is consistent with the effective operational range of the smartphone LiDAR sensor. To achieve adequate point density and complete geometric representation, multiple scanning passes with sufficient overlap were conducted. Data collection was carried out under stable daylight conditions with minimal pedestrian obstruction to reduce motion noise and occlusion effects. The captured LiDAR data were subsequently used to generate a 3D point cloud for further processing and accuracy assessment.
In order to establish a reliable reference dataset for accuracy assessment, a conventional surveying approach was employed using a total station with millimeter-level distance accuracy and high angular precision was used, supported by GPS observations for the establishment of GCPs. The measurements obtained from these instruments served as the reference data against which the smartphone LiDAR results were assessed.
3.2.2 Smartphone LiDAR Scanning Method
The smartphone LiDAR scanning method utilizes the built-in LiDAR sensor of the iPhone 13 Pro to emit laser pulses and measure the time-of-flight of reflected signals, enabling the generation of depth information and 3D point clouds. During data acquisition, the device was operated manually along the bridge structure, with overlapping scans conducted to ensure continuity and redundancy of spatial data. This approach allows rapid acquisition of spatial information and facilitates the generation of 3D models suitable for visualization and preliminary geometric assessment, though it remains subject to sensor range and point density limitations inherent to consumer-grade LiDAR systems.
Data processing is an essential first step for survey data to be transformed into information that is useful and actionable. The processing work is performed using certain applications and software. The smartphone device scans the target, and the point cloud segmentation is executed using PIX4D software (see Fig. 4). The processing begins by importing captured images, followed by automatic feature matching to identify common points in overlapping photos. Using bundle adjustment, the software computes camera positions, orientations, and initial 3D point coordinates to establish the geometric structure of the scene. After initial processing, Pix4Dmapper generates a dense point cloud through triangulation, producing detailed outputs such as digital surface models (DSM), digital terrain models (DTM), ortho mosaics, and textured 3D models (see Fig. 5a). Users can assess the accuracy of the initial results using keyframes and sparse point clouds before processing with dense reconstruction. The final outputs can be analyzed, measured, and exported for use in GIS, CAD, and other geospatial applications, with processing time depending on image quantity, scene complexity, and hardware performance (see Fig. 5b).
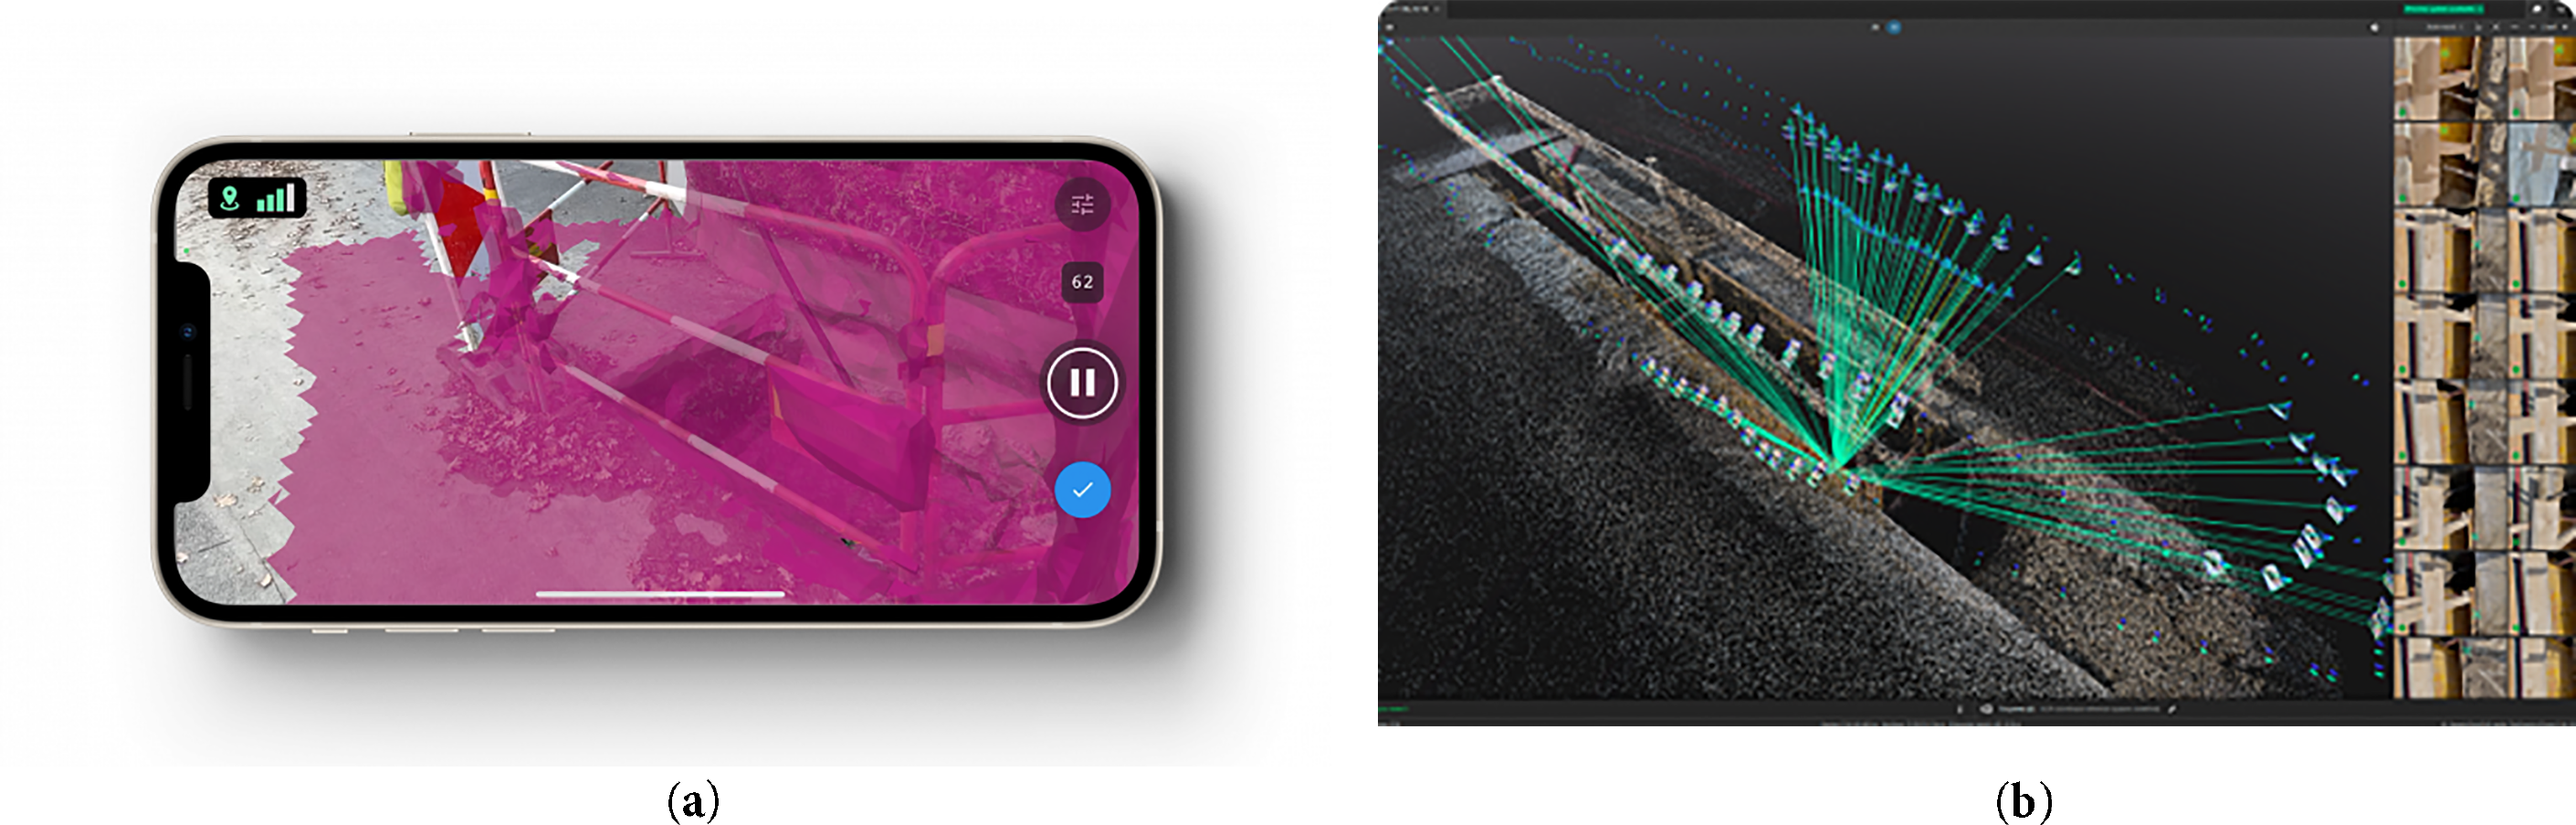
Figure 4: (a) Capturing data using PIX4D catch; (b) Reviewing the captured image.
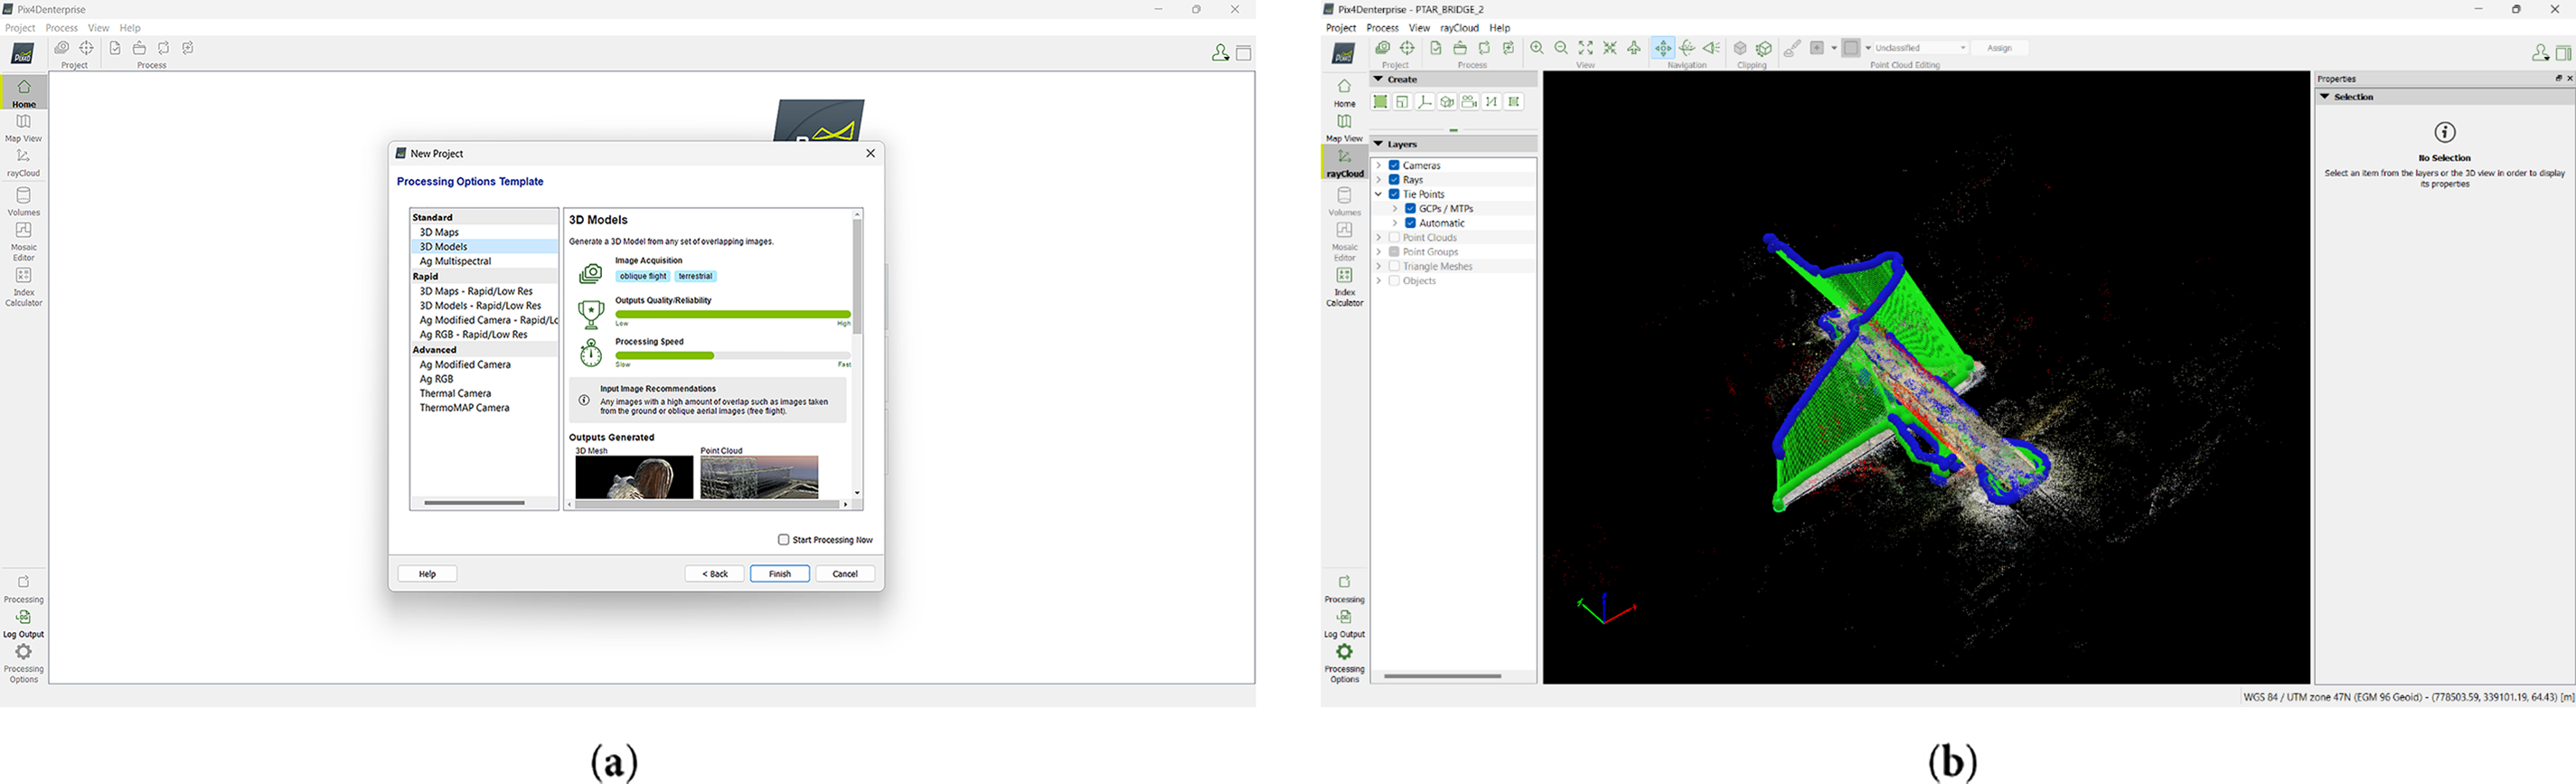
Figure 5: (a) The selection of quality to generate point cloud and 3D model; (b) The generated point cloud.
In contrast, detailed data obtained from the tacheometric survey were processed using the Cadastral Data System (CDS) software (see Fig. 6). This process included the calculation of angular and distance measurements, coordinates by application of specific instrument parameters. For both datasets, quality control procedures were applied to identify and correct potential errors or outliers. This involved reviewing the imported measurements, making necessary adjustments, and ensuring internal consistency of the data prior to subsequent modelling and validation steps.
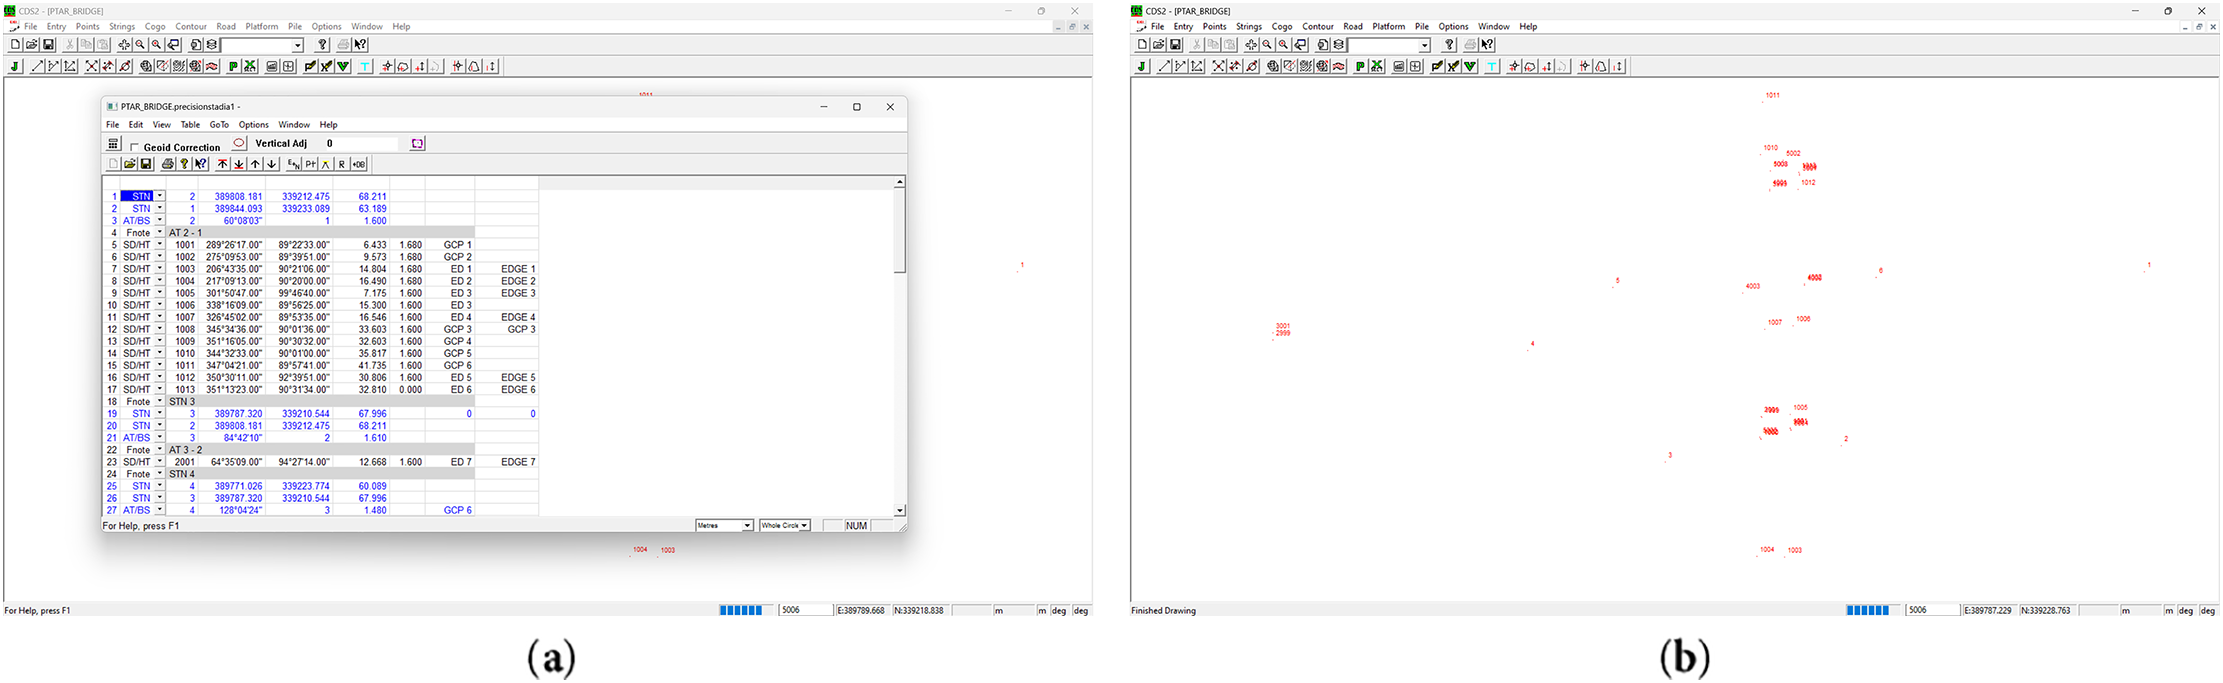
Figure 6: (a) Data of tacheometry survey; (b) The imported raw data of tacheometry survey in CDS.
The scanner gathers data points as it moves across the bridge’s structure, which is then processed to produce a digital representation of the complete bridge in a 3D model. In this stage, the programmer uses photogrammetric algorithms to create a 3D model after analyzing the photos. It depends on the quantity of photographs, scene complexity, and processing capacity of the device; processing images may take some time for 3D modelling. Then, the next process is to verify the accuracy of the first processing by looking at the keyframes and the sparse point cloud. If necessary, the adjustments can be done by starting processing in order to create a dense point cloud and carry out the 3D reconstruction procedure. In this stage, PIX4Dmapper determines the locations of additional scene points. After that, by using this model as the foundation for thorough measurements and inspections that are able to evaluate overall condition, detect probable flaws, and analyze structural integrity.
3.4.1 3D Modelling Using Conventional Data
Based on Fig. 7, to ensure accuracy and efficiency, there are usually numerous important processes involved in creating a 3D model in AutoCAD. The model’s structure and size must first be planned, usually using early drafts or sketches. Throughout the process, accuracy is crucial, paying close attention to precise dimensions, angles, and alignments to make sure the model faithfully captures the original design. Furthermore, different components inside the model can be managed and organized using AutoCAD’s layering system, making editing and manipulation simpler. Finer features, such as textures, materials, and annotations, are added as the model takes shape in order to improve realism and communicate significant information. AutoCAD’s collaborative capabilities facilitate the simultaneous work of numerous designers on the same model, thereby optimizing workflows and promoting teamwork.
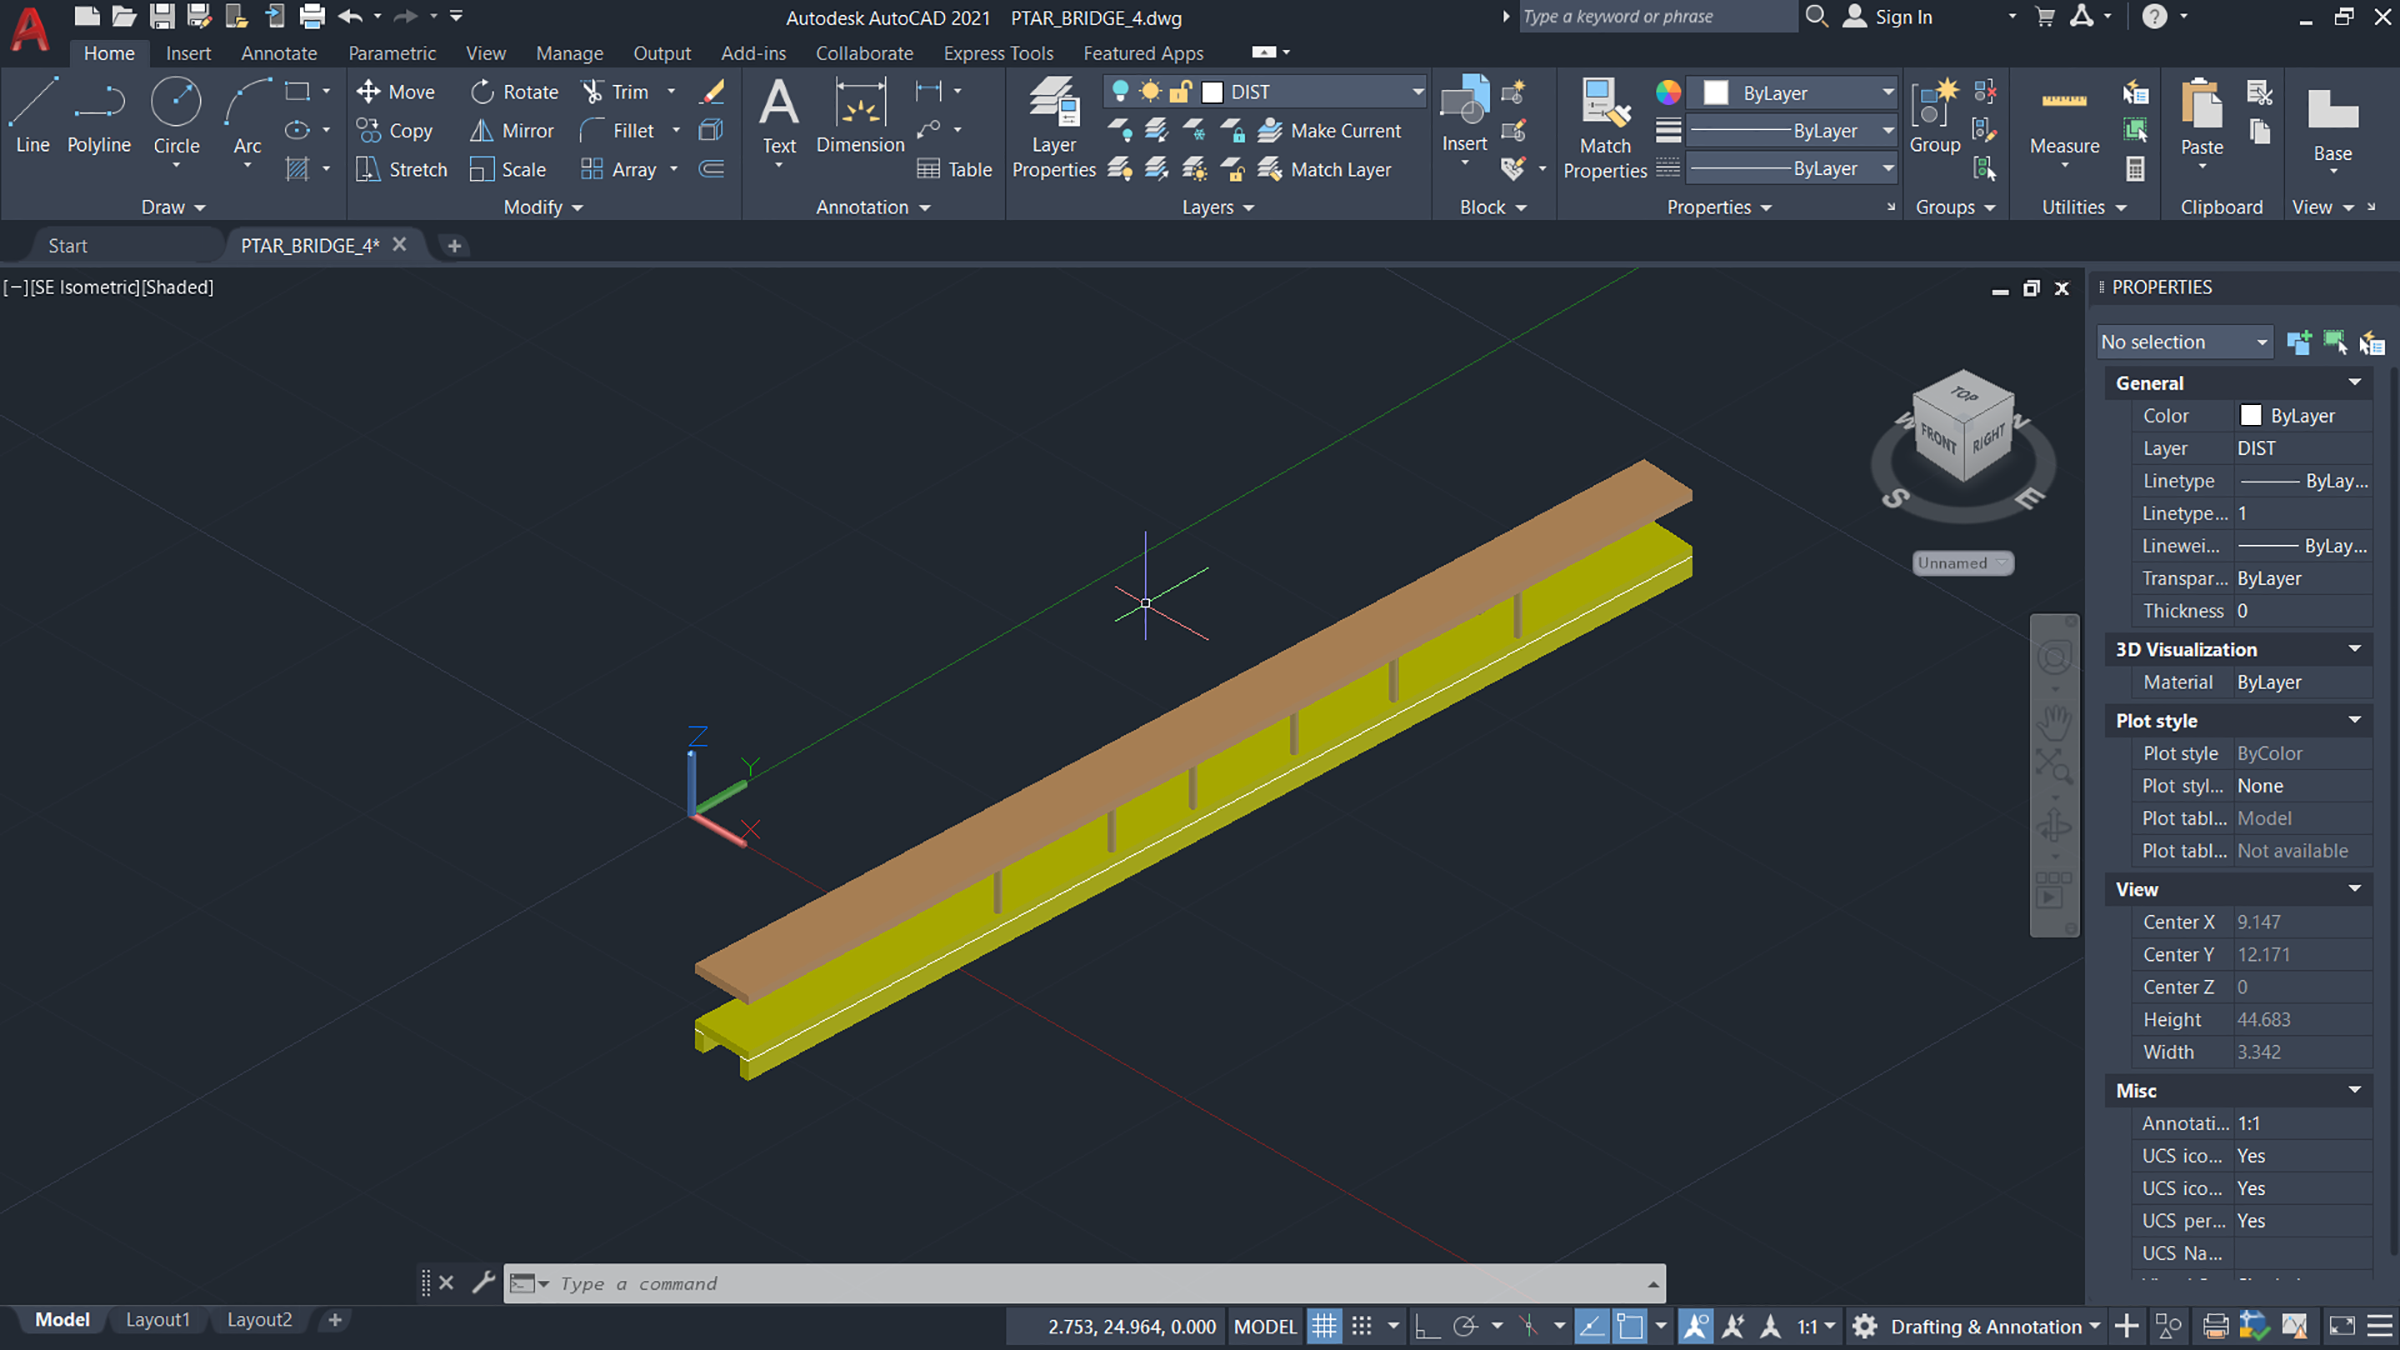
Figure 7: 3D modelling for tacheometry survey data.
3.4.2 3D Modelling Using Smartphone LiDAR Data
Reviewing the images on the PIX4D Catch app is essential because it lets you see those that are distorted, dimly lit, or otherwise corrupted. If required, it’s imperative to replace these flawed photos with fresh, better ones because they might seriously impair the final 3D model’s quality. Making sure that every picture is sharp and well-taken will have a big impact on the data quality and accuracy of the cloud comparison.
Pix4Dmapper is a software application widely used in the field of photogrammetry to process aerial and terrestrial imagery into 3D models, maps, and other geospatial products. The processing method involves several key steps. At first, the software imports the captured images and then utilizes advanced algorithms to automatically detect common points in the overlapping images, a process known as feature matching. After these points are identified, Pix4Dmapper calculates the position and orientation of the camera for each image, as well as the 3D coordinates of the common points, using a technique called bundle adjustment.
The processing workflow in CloudCompare consists of several key stages. Initially, point cloud datasets are imported into the software using supported formats such as LAS, XYZ, PTS, and PLY (see Fig. 8). Once imported, the software provides a comprehensive set of tools for point cloud inspection, manipulation, and visualization. These functionalities include 3D rendering, viewpoint adjustment for multi angle inspection, and the application of colour and intensity attributes. In addition, CloudCompare offers filtering and cleaning tools that enable the removal of noise, outliers, and irrelevant data points, thereby improving the overall quality of the point cloud prior to further analysis.
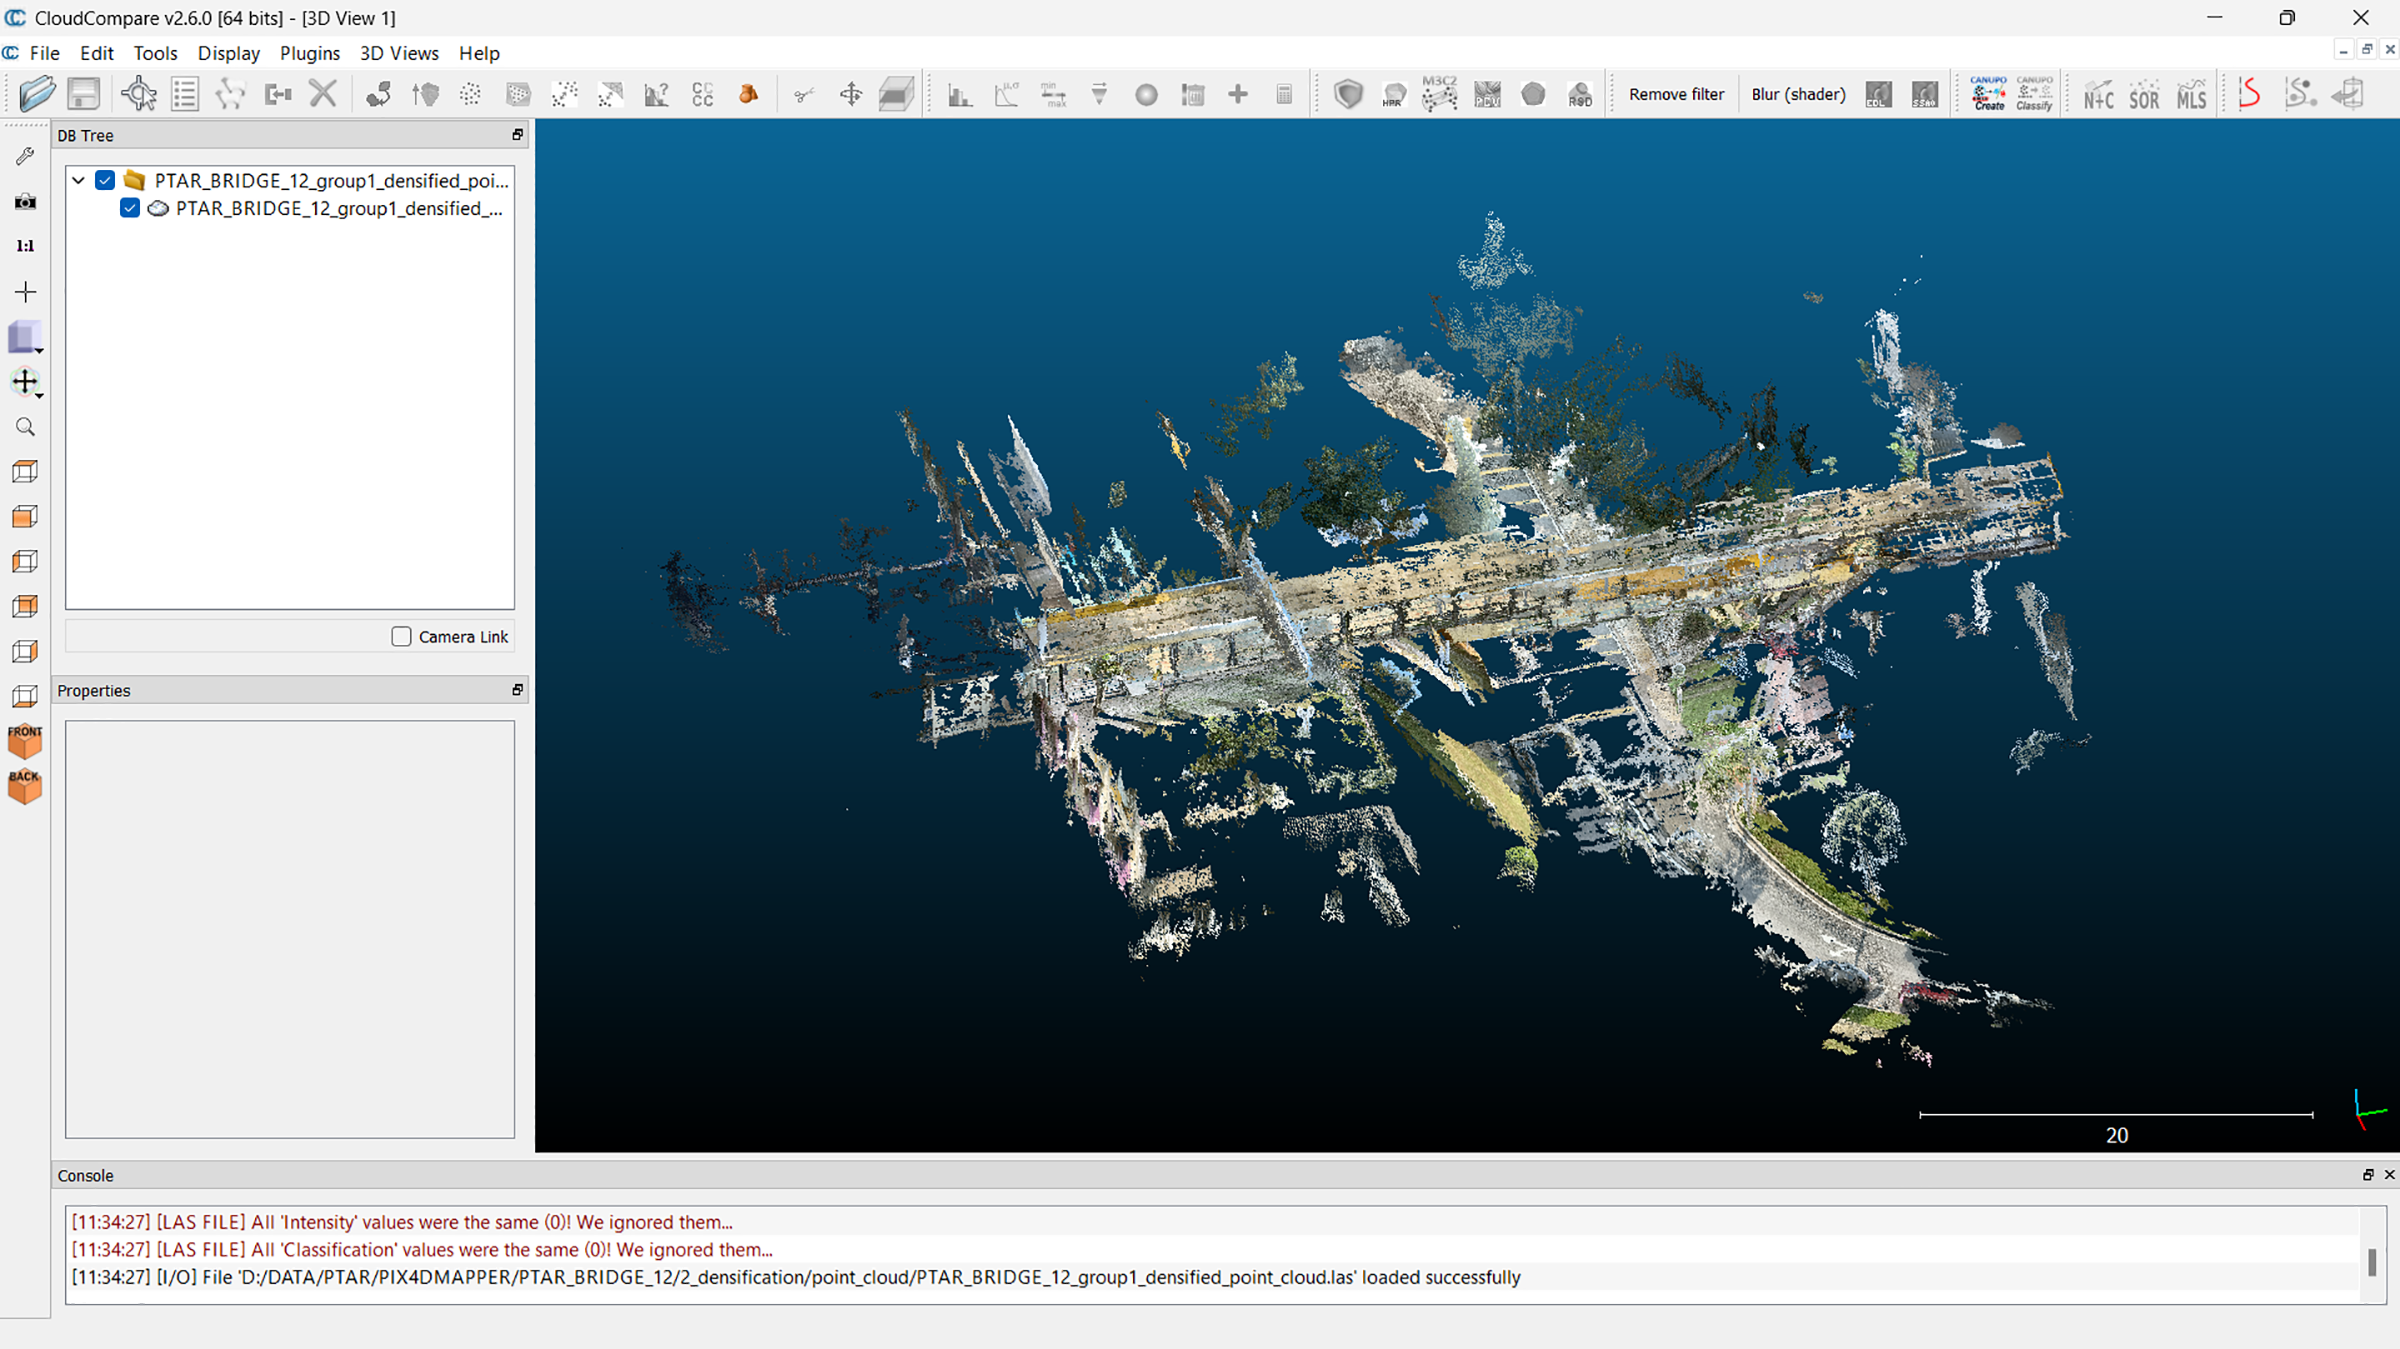
Figure 8: Point cloud imported in CloudCompare.
Based on Fig. 9a, once the point cloud data has been imported, CloudCompare provides a comprehensive suite of editing tools, including the adjustment of colour and intensity attributes, flexible viewpoint manipulation, and filtering operations for the removal of noise and outliers. As shown in Fig. 9b, Ground Control Points (GCPs) are then selected from the point cloud and registered with coordinates obtained from conventional surveying methods to align and rotate the dataset to a reference coordinate system. This process enables accuracy assessment by comparing measured points, followed by quality checks to identify errors, artefacts, and areas for improvement in the final model.
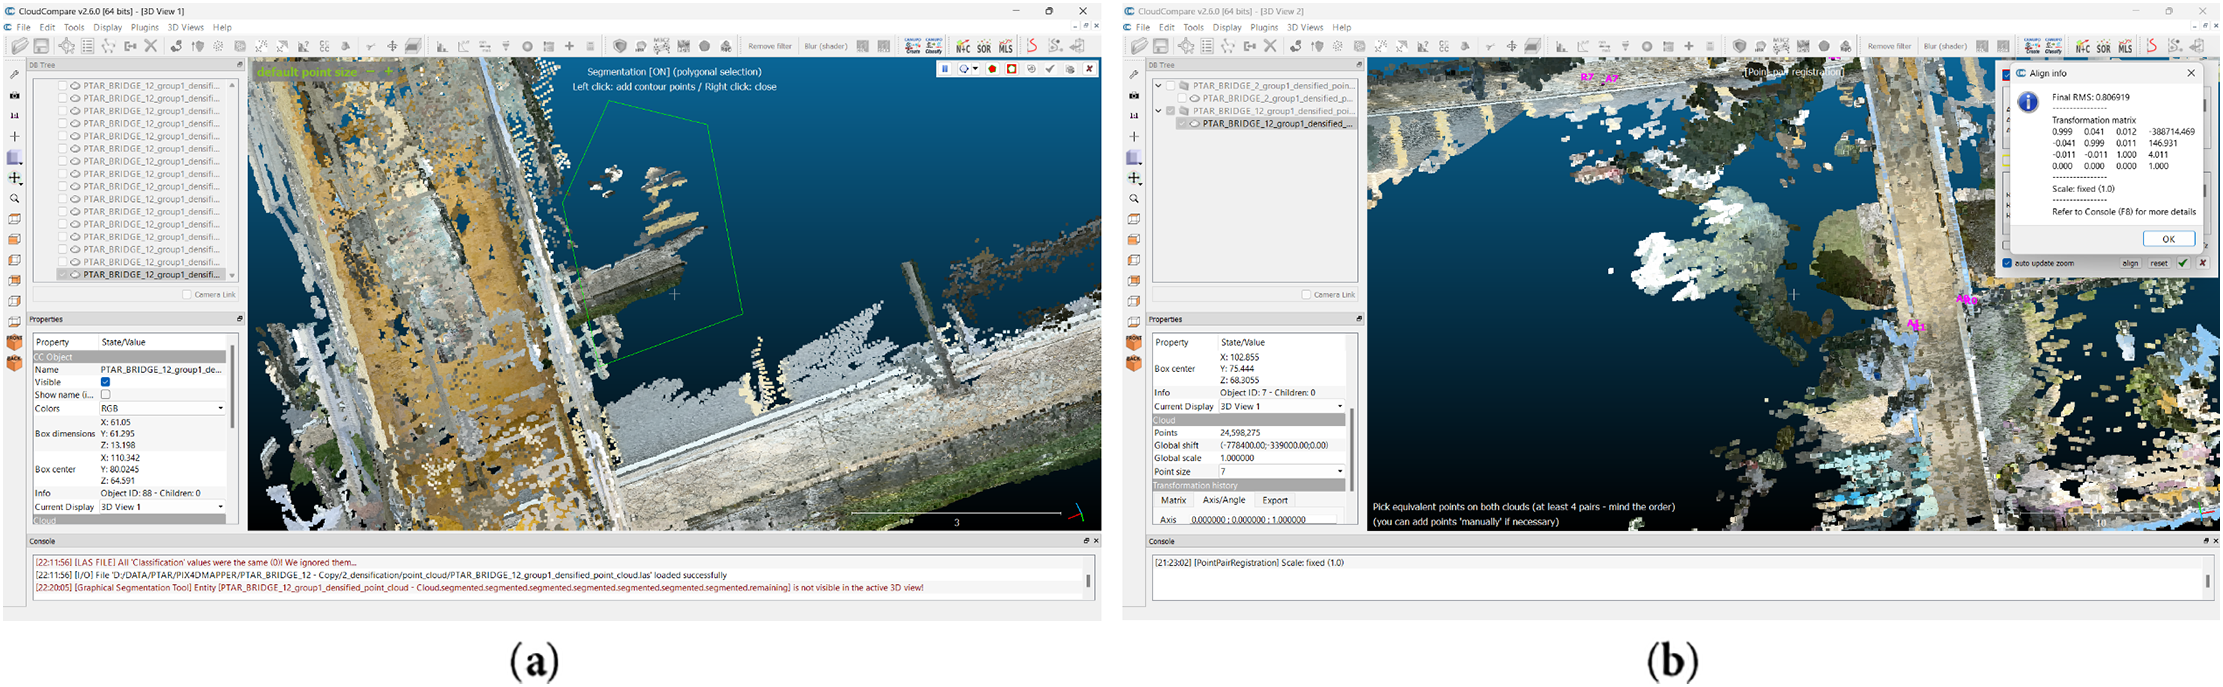
Figure 9: (a) The trimming noise process; (b) The registration coordinates process.
Applications in engineering, building, and design need the use of Autodesk ReCap software, which is used to transform reality capture data, such as laser scans or photos, into 3D models. Gathering raw data which may be point clouds from laser scanners or image sets from photogrammetry is the first step in using Autodesk ReCap first. Start a new project in Autodesk ReCap after the data collection is finished. Once the proper parameters have been chosen, import the raw data files into the project. For point clouds, formats such as .rcp or .rcs are commonly used, whereas picture files such as .jpg are for photogrammetry.
In Revit software, point cloud files can be effectively used in building modelling and design processes (see Fig. 10). Point cloud files, which are produced by photogrammetry or LiDAR scans, are dense collections of 3D points that depict the surfaces and characteristics of real-world settings or structures. These point cloud files can be simply imported into Revit projects by users, giving them an accurate spatial reference for modelling within the existing environment. Through the software’s interface, users can examine, modify, and analyze point cloud data once it has been imported into Revit. This contains filters, colorization, and transparency adjustments for the point cloud to improve visualization and help with modelling accuracy. In addition, Revit provides tools for creating precise building parts like floors, roofs, and walls by tracing over point cloud data.
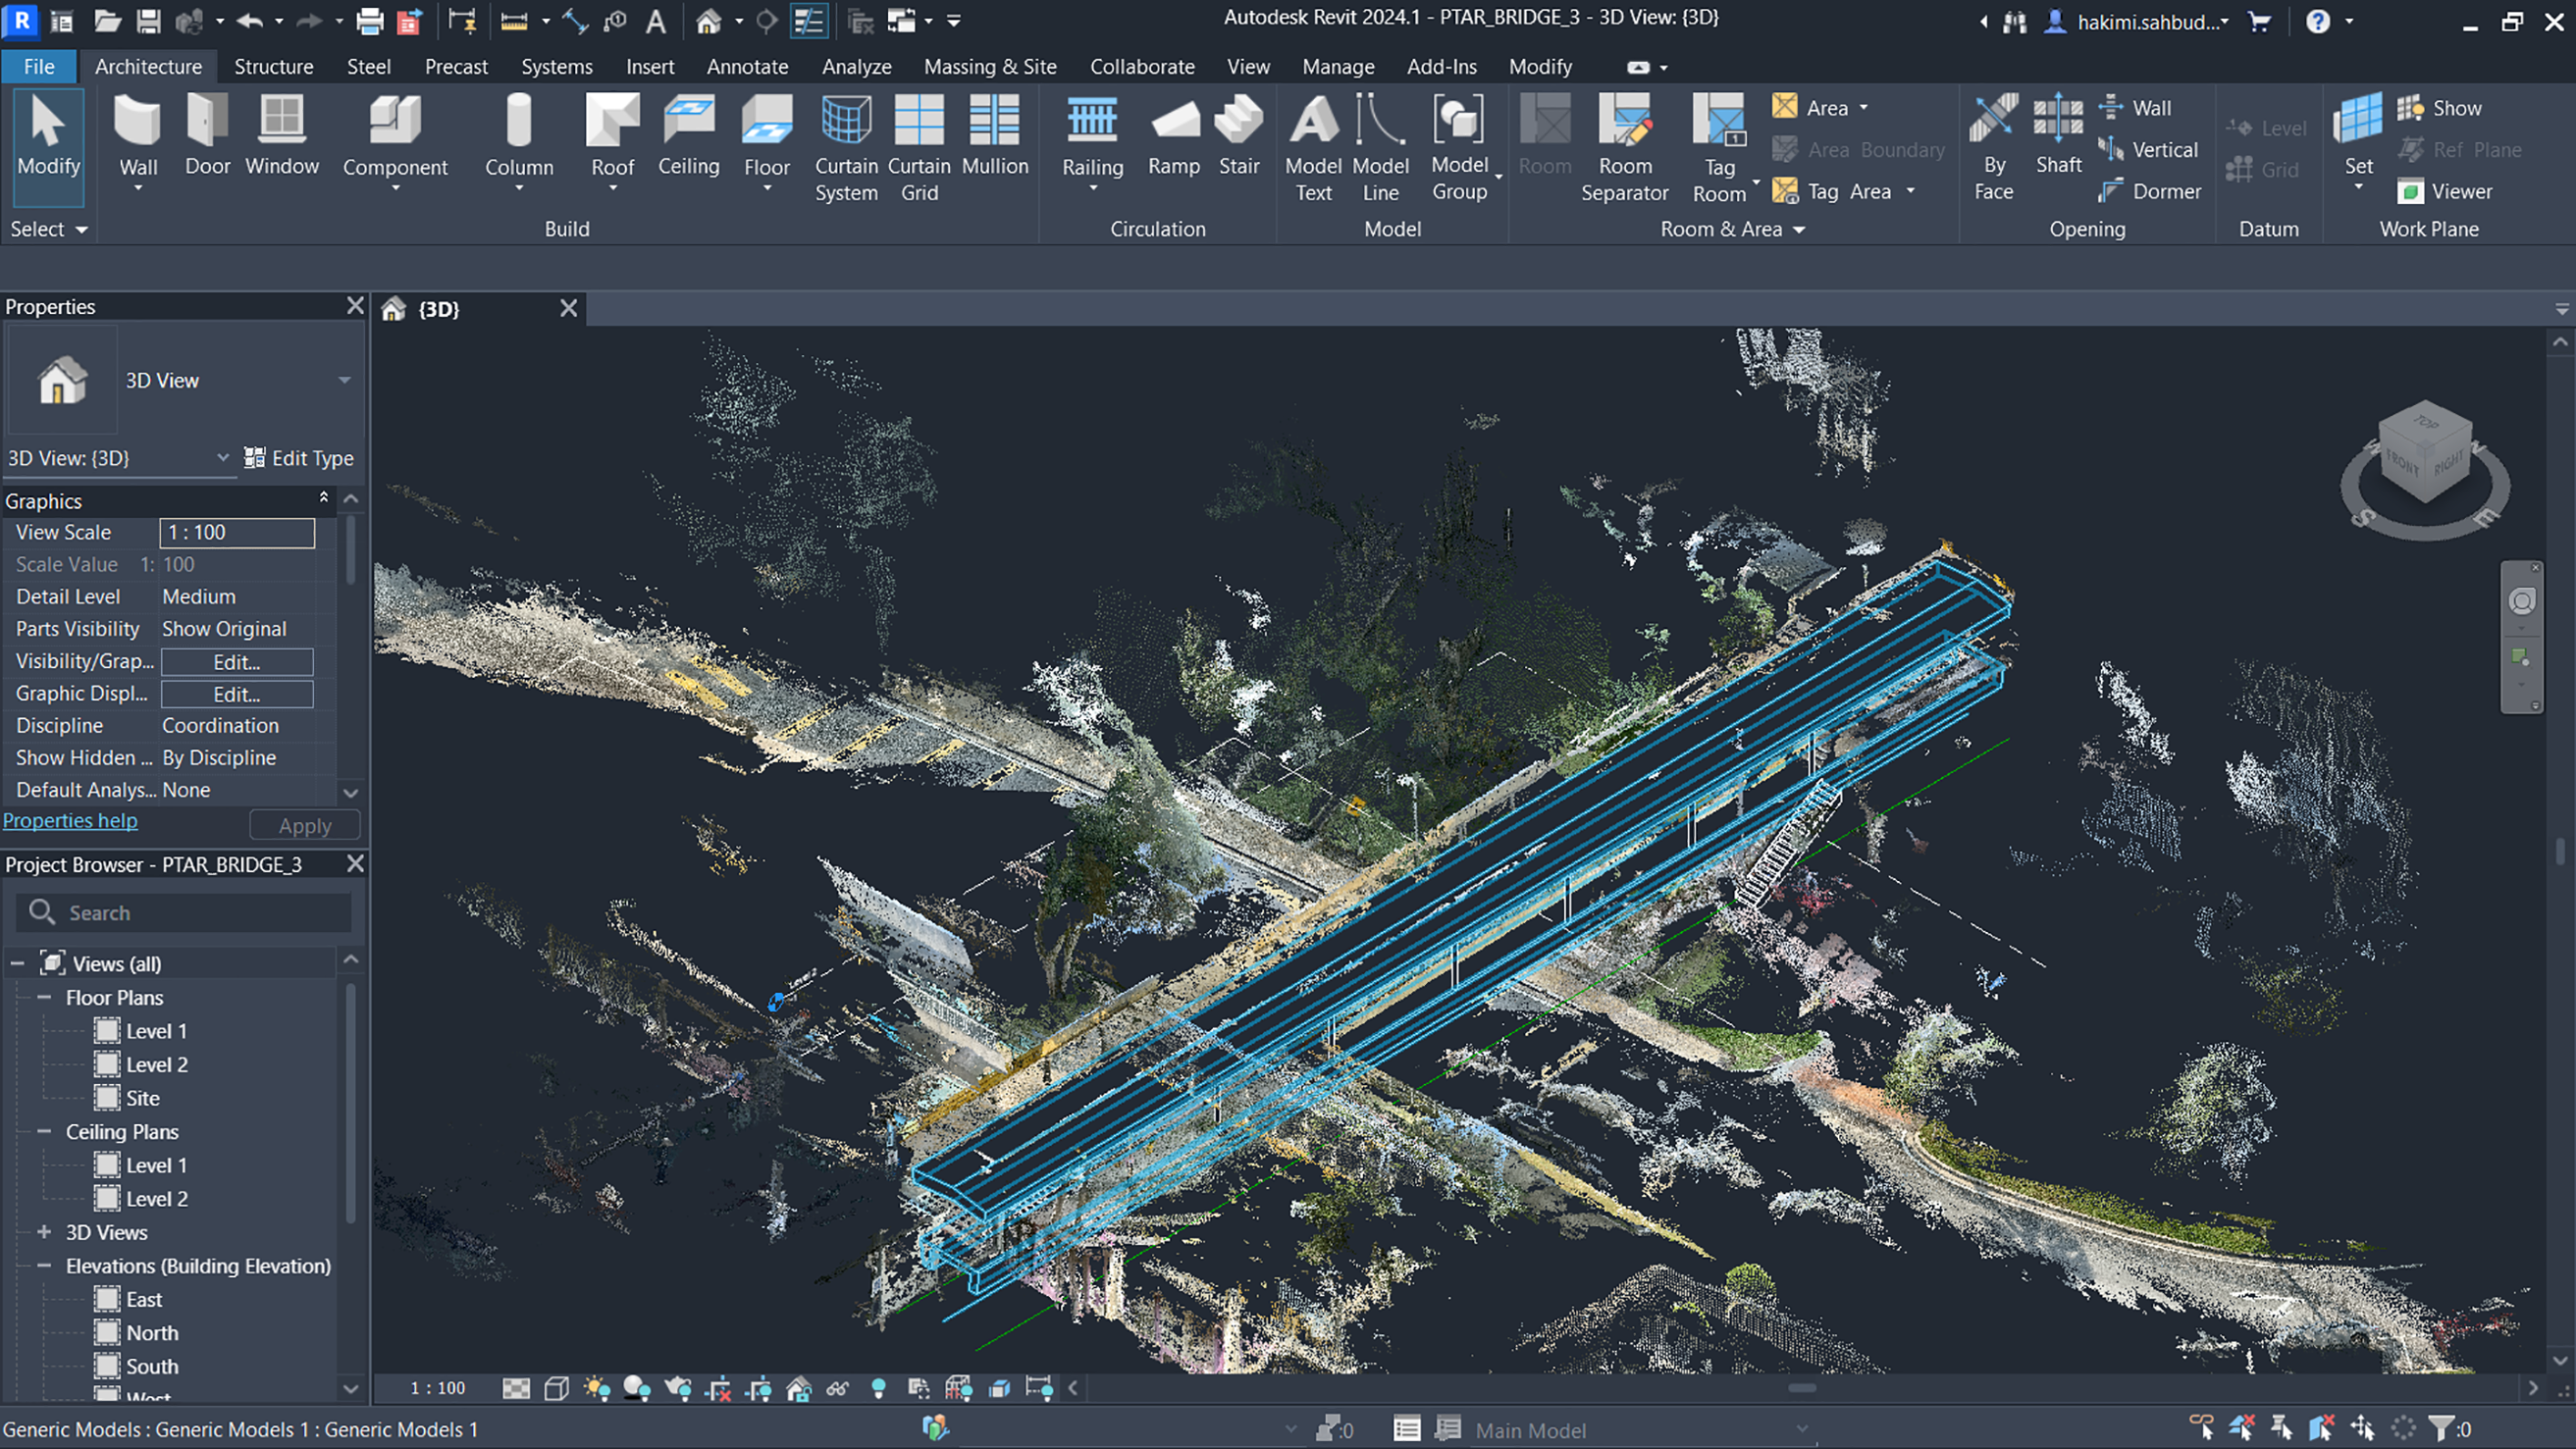
Figure 10: Generate 3D model using Revit software.
Data validation was carried out by comparing the smartphone LiDAR-derived measurements with reference data obtained from the conventional tacheometry and GPS-based survey. Two forms of accuracy assessment were performed: coordinate-based evaluation and distance-based evaluation. For distance validation, the Euclidean distance between selected control points was computed using Microsoft Excel according to Eq. (1):
where:
d = distance between two control points
For coordinate-based accuracy assessment, the Root Mean Square Error (RMSE) was used to quantify the positional differences between the smartphone LiDAR data and the conventional survey coordinates for each axis (X, Y, and Z). The RMSE was computed using the standard formulation shown in Eq. (2):
where:
x = reference coordinate from the conventional survey
n = the total number of observations
The RMSE values provide a quantitative indication of agreement between the smartphone LiDAR data and the reference survey. In general, lower RMSE values reflect closer positional consistency, however, in practical surveying applications, small variations are expected due to differences in acquisition geometry and sensor behaviour. In this study, RMSE values for distance measurement were also computed to assess relative geometric accuracy without direct reliance on absolute position. It should be noted that the RMSE values reported here are intended as descriptive indicators rather than inferential statistical measures, as the analysis is based on a limited number of independent observations. A more rigorous statistical evaluation would require repeated measurements under controlled conditions, which was beyond the scope of this investigation.
This section presents the results and analysis of the comparative assessment between the smartphone LiDAR method and the conventional survey. The findings are organized into several subsections, including 3D bridge modelling using both approaches, accuracy assessment based on GCPs and comparative analysis of geometric measurements in terms of coordinates, distances, and volume. The results obtained using the iPhone 13 Pro LiDAR sensor were systematically compared with those derived from the conventional surveying approach to assess the geometric consistency between the two methods of data collection.
4.1 3D Bridge Modelling Using Conventional Data
The conventional surveying method produced a set of precise 3D coordinates representing the geometry of the pedestrian bridge. These coordinates served as the reference dataset for subsequent accuracy assessment and comparison. Using AutoCAD software, the surveyed points were modelled into a 3D representation of the bridge, as shown in Fig. 11. The resulting model provides an accurate representation of the bridge geometry, including its dimensions, alignment, and elevation. Geometric consistency was ensured by systematically verifying that all modelled dimensions, angles, and proportions corresponded with the field measurements. As a result, the conventional model provides a reliable baseline for evaluating the performance of the smartphone LiDAR derived 3D reconstruction.
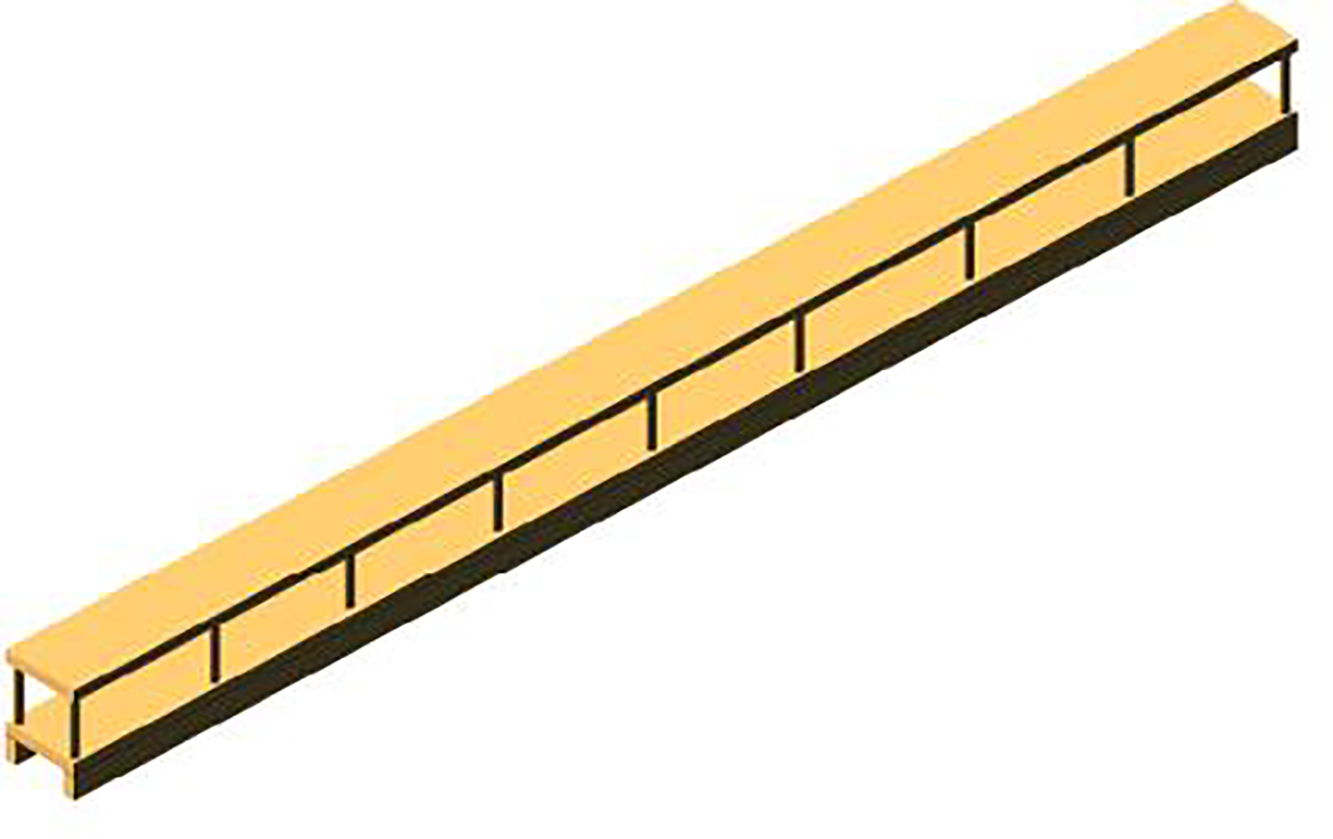
Figure 11: Bridge 3D model by AutoCAD software.
4.2 3D Bridge Modelling Using Mobile Scanner
A 3D bridge model was generated using smartphone LiDAR data acquired with an iPhone 13 Pro and processed using PIX4D and Revit software. The smartphone LiDAR model captures the overall geometry and visual characteristics of the bridge, as illustrated in Fig. 12. In comparison with the conventional survey derived model, the smartphone LiDAR model provides a more visually detailed surface representation due to dense point cloud generation. Although minor surface irregularities are present, the overall structural form and principal dimensions of the bridge remain well preserved. These results demonstrate the capability of smartphone LiDAR to produce realistic 3D representations that are suitable for visualization purposes and preliminary geometric assessment.
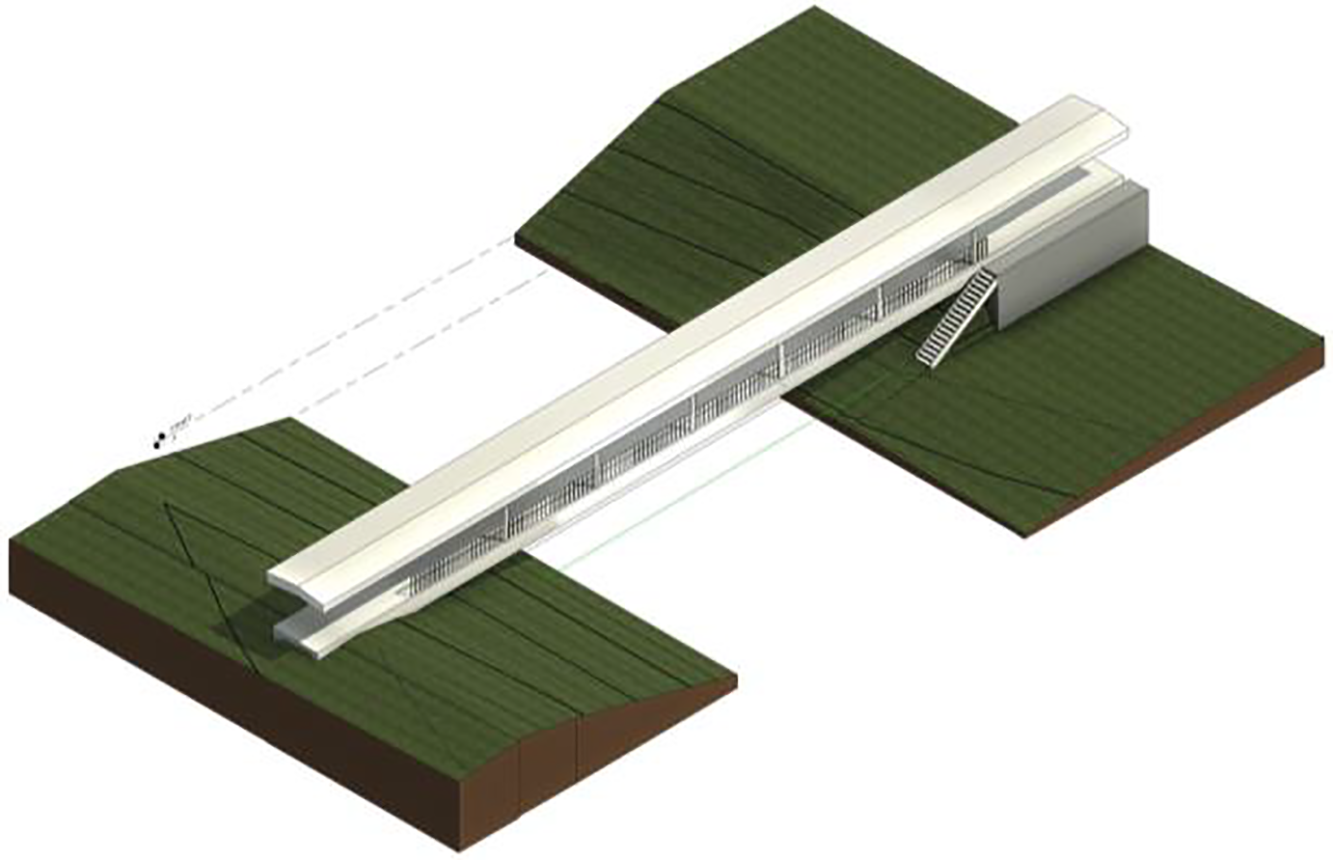
Figure 12: Bridge 3D model by Revit software.
GCPs were used to quantitatively assess the positional accuracy of the smartphone LiDAR data relative to the conventional survey dataset (Fig. 13). Coordinates extracted from both datasets were compared, and the Root Mean Square Error (RMSE) was computed for each coordinate component (X, Y, and Z).
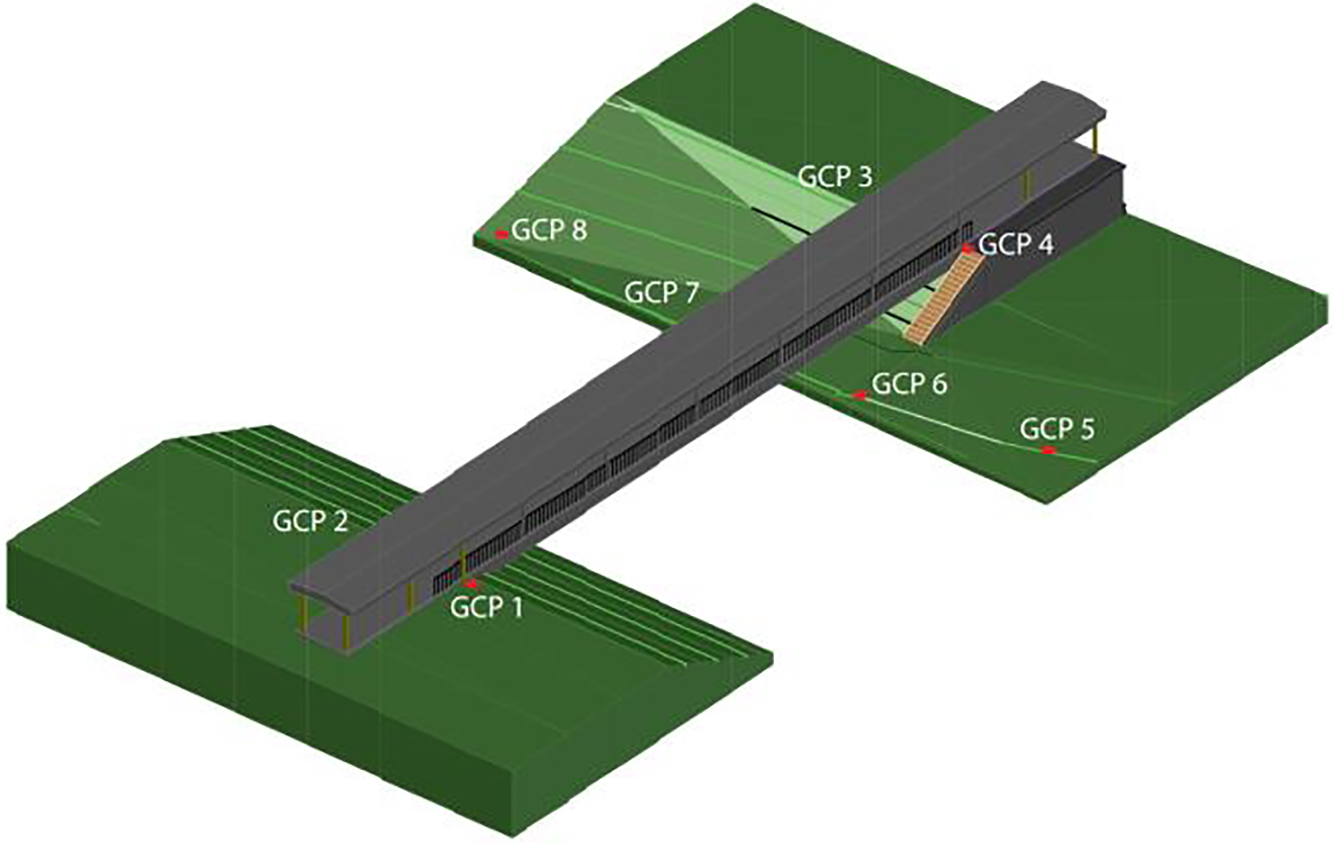
Figure 13: GCPs throughout the study area.
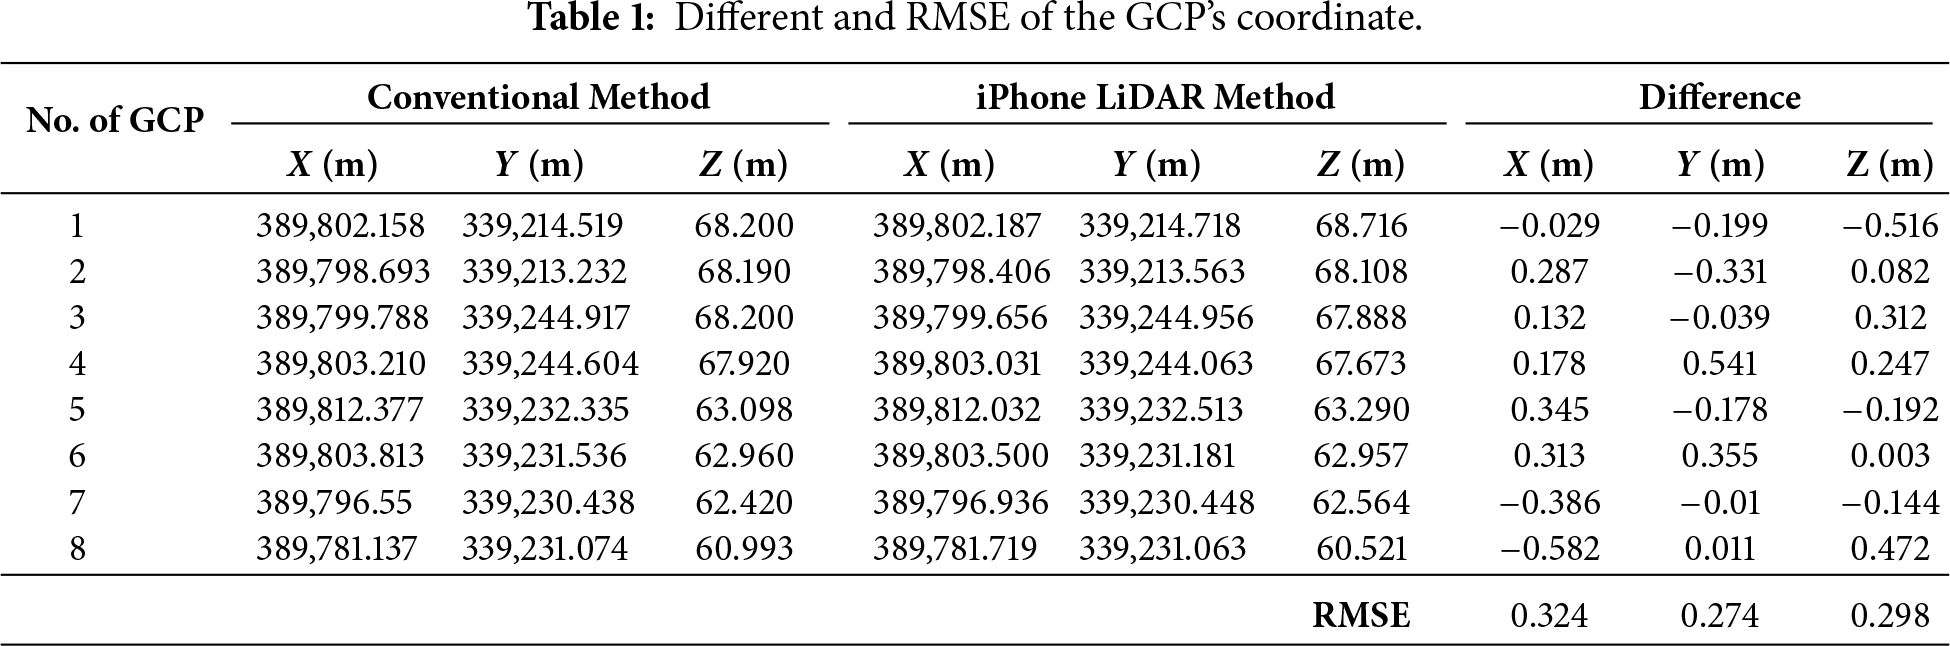
Table 1 presents the coordinate difference of the GCPs obtained from both methods, conventional surveying and the smartphone LiDAR approach. The observed discrepancies in the X, Y, and Z positions generally fall within the sub-meter range, indicating a reasonable level of agreement between the two datasets. The corresponding RMSE values for the coordinate values of GCPs were calculated as 0.324, 0.274, and 0.298 m, respectively. Although positional deviations are present, their relatively consistent magnitude suggests systematic differences rather than random errors. The similarity of RMSE values across all three coordinate components further indicates the stable performance of the smartphone LiDAR system in capturing spatial positions when properly georeferenced using GCPs. Overall, these results demonstrate that smartphone LiDAR can achieve acceptable positional accuracy for applications such as preliminary mapping, visualization, and general geometric representation of bridge structures, despite not yet attaining the precision offered by conventional surveying instruments.
4.4 Comparative Analysis of 3D Bridge Modelling
A comparative analysis was conducted to assess the geometric consistency between the 3D bridge models generated using the conventional surveying method and the smartphone LiDAR approach. The comparison focuses on bridge edge coordinates, distance measurements, and volumetric estimation.
4.4.1 Comparison of Bridge Edge Coordinates
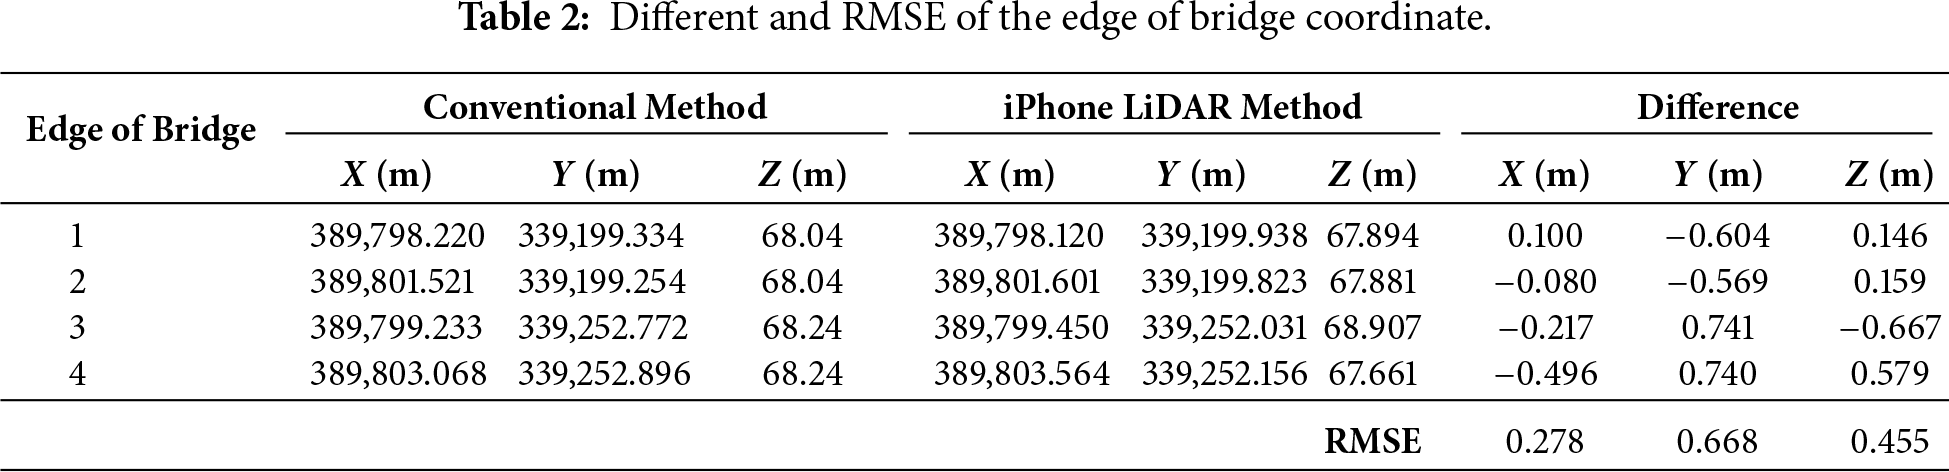
Bridge edge coordinates derived from both modelling approaches were compared to evaluate positional agreement (see Fig. 14). As summarized in Table 2, differences in the X, Y, and Z coordinates are generally small, indicating a good level of geometric consistency between the conventional survey results and the smartphone LiDAR data. This observation is further supported by the RMSE values, which suggest that smartphone LiDAR can capture bridge edge geometry with an accuracy suitable for documentation and preliminary analysis. The RMSE values obtained for the bridge edge coordinates were 0.278, 0.668, and 0.455 m for the X, Y, and Z components, respectively. The comparatively higher RMSE along the Y axis reflects increased uncertainty in the longitudinal direction of the bridge, likely influenced by scanning geometry and user movement during data acquisition. Despite this variation, all RMSE values remain within the sub-metre range.
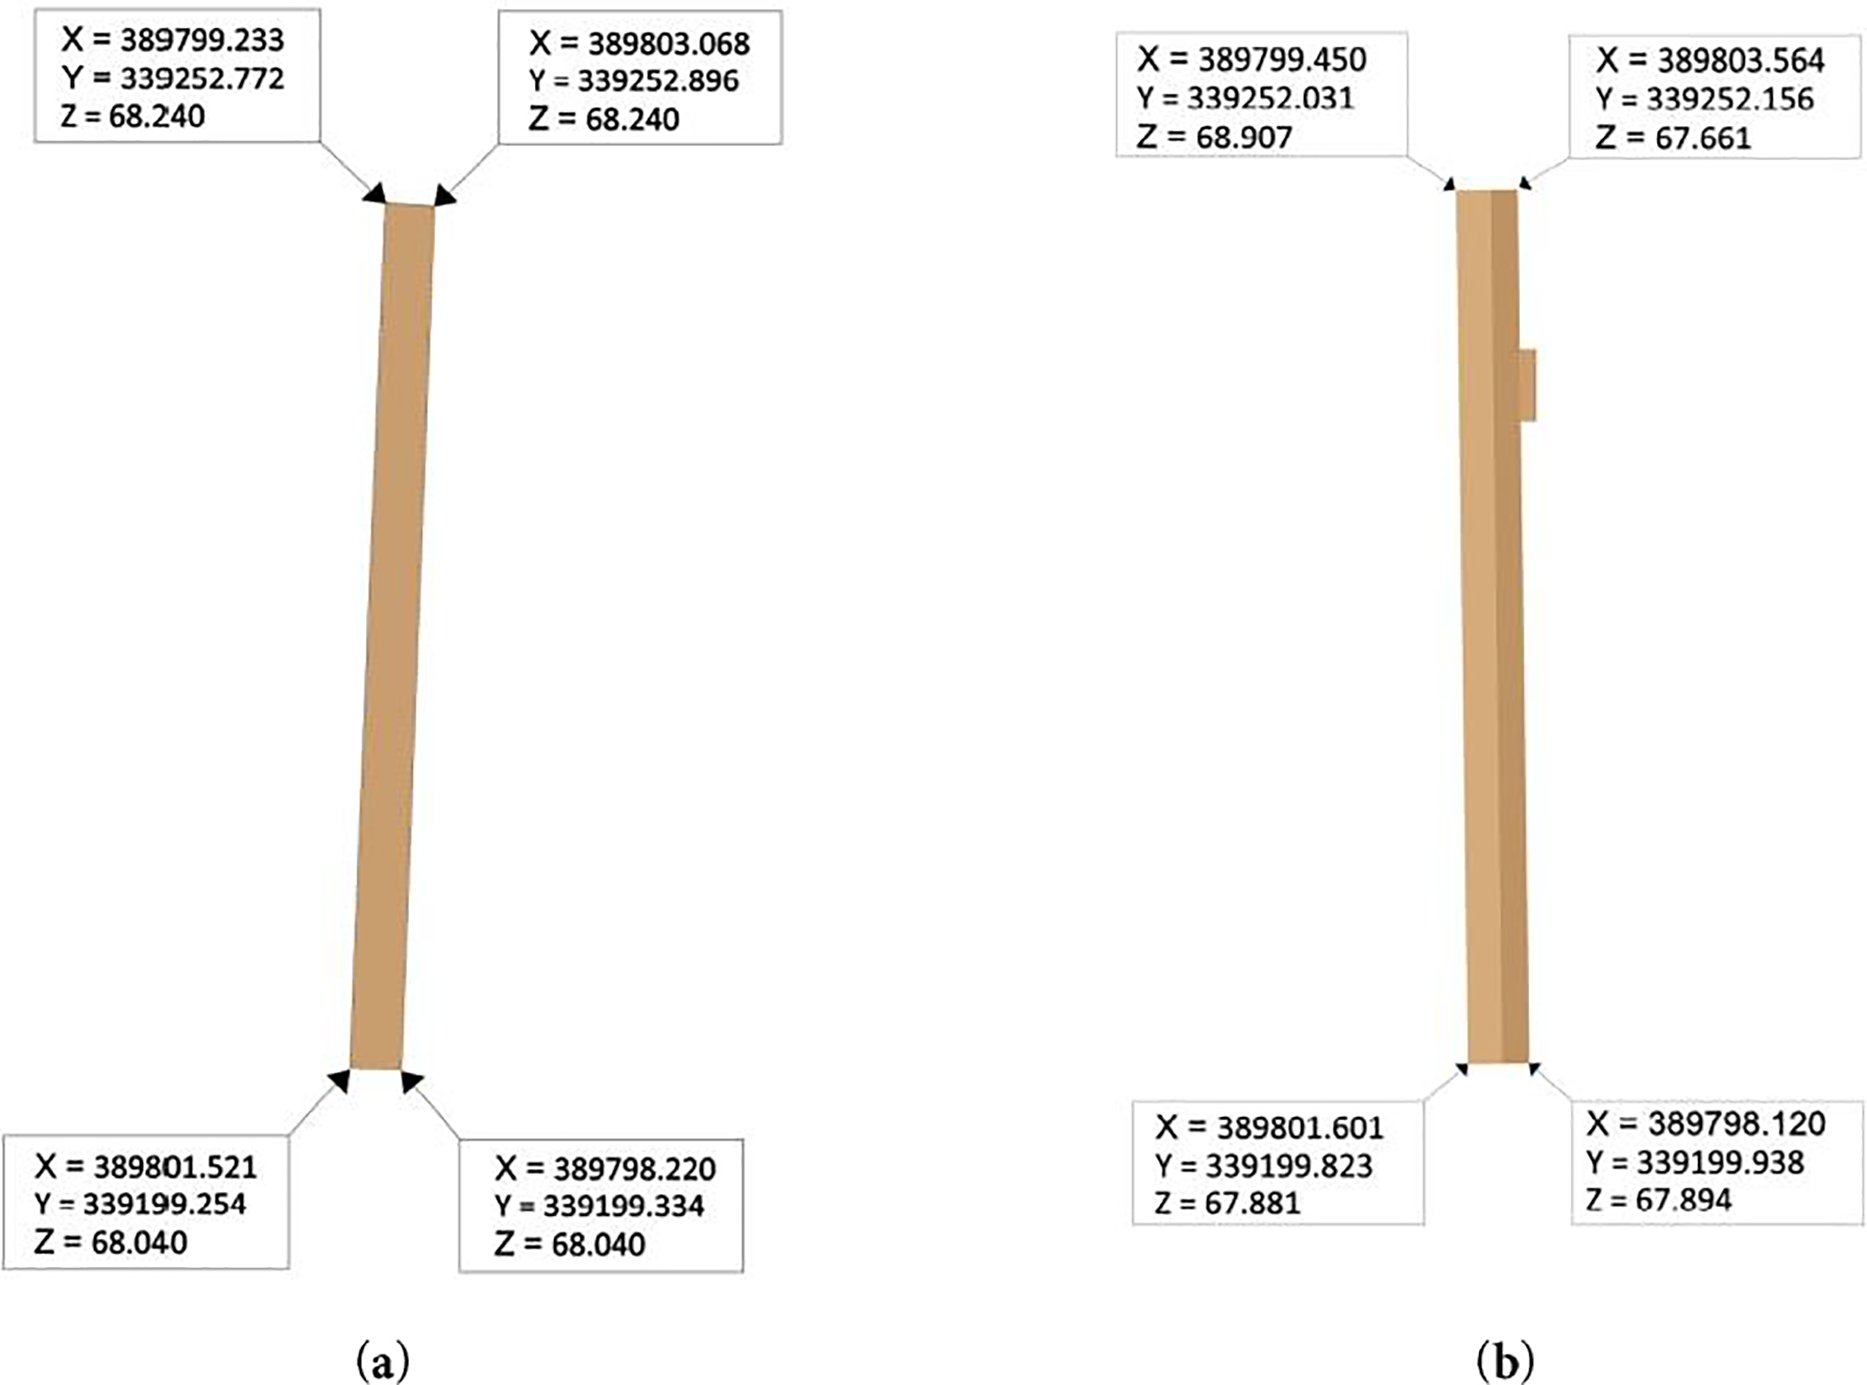
Figure 14: (a) Edge of the bridge’s coordinates by conventional method; (b) Edge of the bridge’s coordinates by iPhone LiDAR method.
4.4.2 Comparison of Bridge Dimension Measurements in Distance
The X, Y, and Z coordinates from the iPhone LiDAR approach as well as the conventional surveying method were calculated using the distance measurement (see Fig. 15). After the distances were calculated, the accuracy of the iPhone LiDAR method was evaluated in comparison to the conventional surveying method. The differences between these two sets of distance measurements were quantified by RMSE values. These results were derived by squaring the differences between distances obtained from the two methods, averaging these values, and subsequently taking the square root of the mean, thereby providing a comprehensive measure of overall accuracy. RMSE values enabled a precise assessment of the iPhone LiDAR method in capturing bridge edge dimensions and demonstrated its effectiveness and reliability relative to conventional surveying techniques.
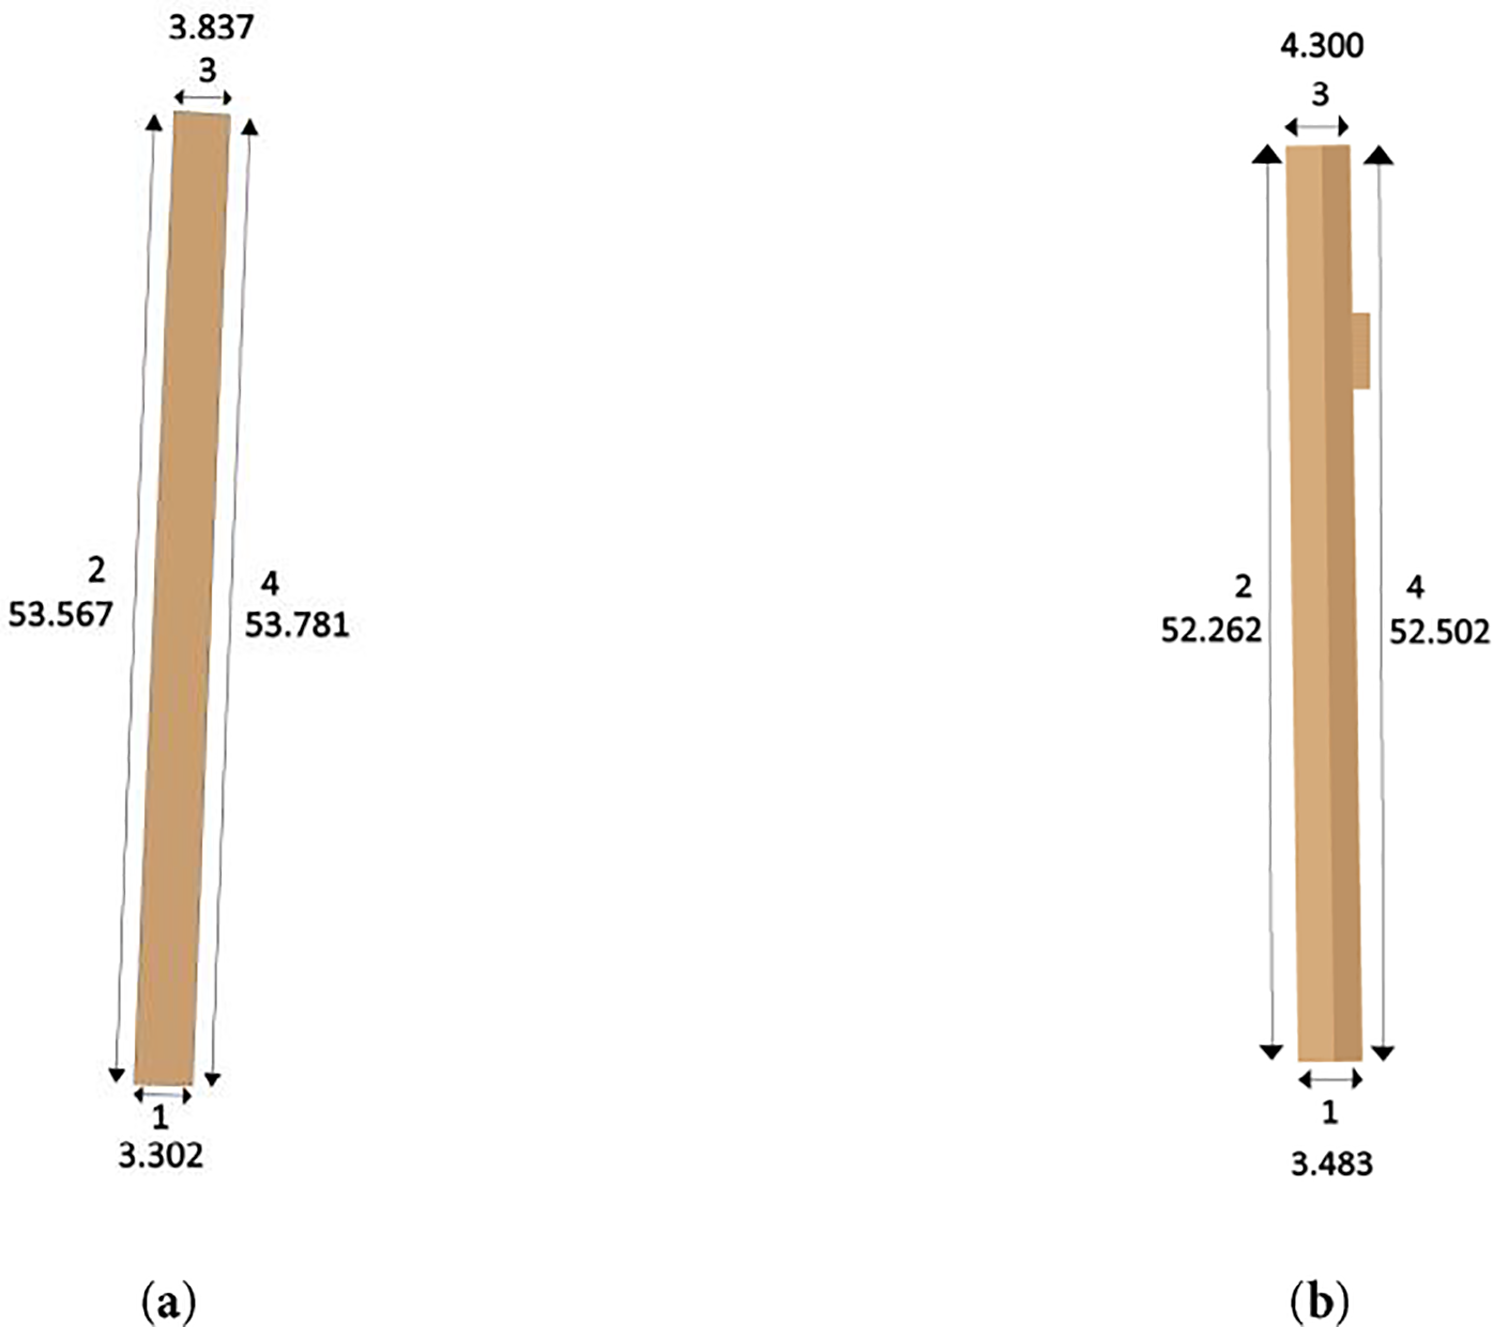
Figure 15: (a) Bridge’s distances in conventional method; (b) Bridge’s distances in iPhone LiDAR method.
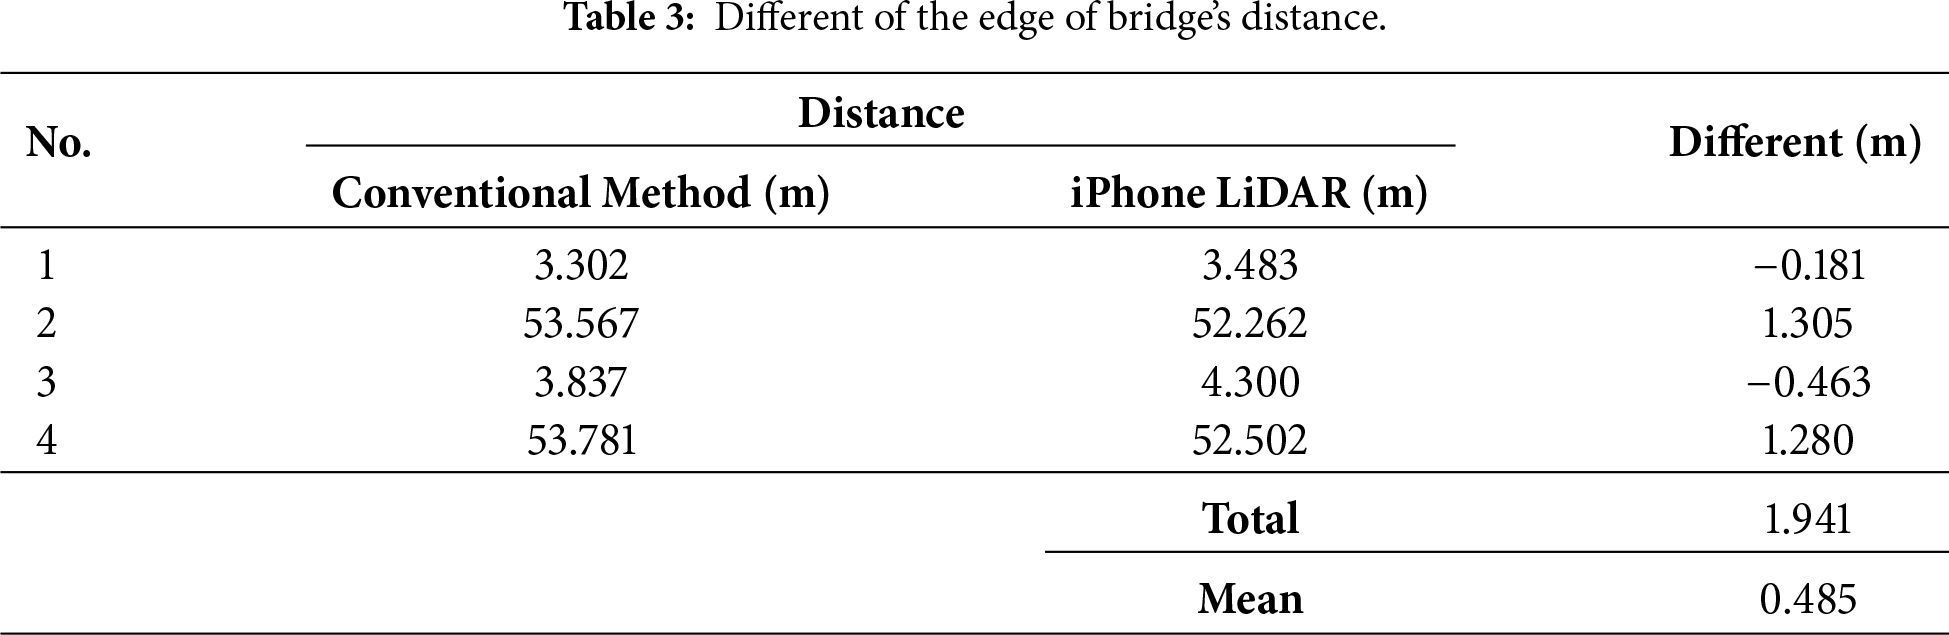
Distance measurements between selected points along the bridge were derived from both datasets and compared, as summarized in Table 3. The analysis shows a mean distance difference of 0.485 m between the smartphone LiDAR measurements and those obtained from the conventional survey. Although this value is higher than the coordinate-based RMSE, such behaviour is not unexpected. In practice, point-to-point distance calculations are particularly sensitive to localized positional deviations, especially when measurements span longer segments of the structure. Small offsets at individual points may therefore propagate into larger distance differences. For this reason, distance-based accuracy should be interpreted alongside coordinate and volumetric analyses to provide a more balanced assessment of measurement performance.
4.4.3 Comparison of Bridge Measurement in Volume
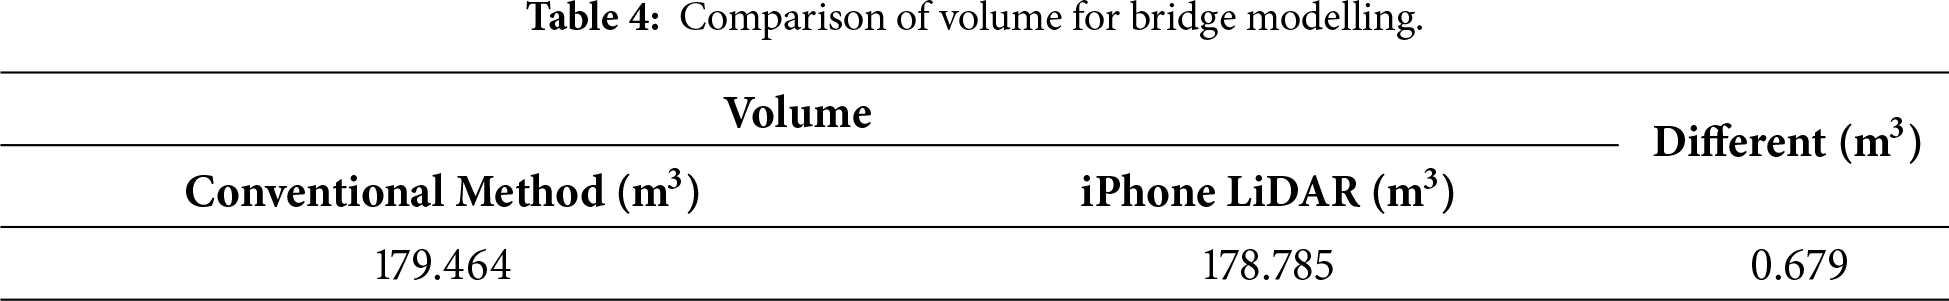
The objective of this assessment is to ascertain whether the volumes obtained from these two techniques are substantially comparable, therefore reviewing the accuracy and dependability of the iPhone LiDAR approach in reproducing the bridge’s physical dimensions. However, volumetric comparison was conducted to evaluate the overall geometric consistency of the reconstructed bridge models. As presented in Table 4, the estimated volume using the smartphone LiDAR approach differs from the conventional survey by volume 0.679 m3. Despite the moderate distance discrepancies observed at specific locations, this relatively small volumetric difference suggests that the overall bridge geometry is well preserved. This outcome can be attributed to the surface-based nature of volume computation, where localized positive and negative deviations tend to compensate during surface interpolation and mesh generation. As a result, volumetric analysis offers a more stable indicator of bridge model consistency under the conditions of this study.
Overall, the comparative analysis of this study demonstrates that coordinate and distance accuracy provide corresponding insights into the performance of smartphone LiDAR. Distance measurements are more sensitive to localized positional variations, whereas volumetric analysis captures the overall geometric consistency of the reconstructed model. These findings emphasize the value of using multiple accuracy indicators when assessing the suitability of consumer-grade LiDAR systems for engineering and geomatics applications.
4.5 Limitations and Future Work
Although the findings of this study demonstrate the potential of smartphone LiDAR for 3D bridge modelling and preliminary geometric assessment, several limitations should be acknowledged. First, the accuracy assessment was conducted on a single structure of a pedestrian bridge case study. As a result, the findings may not be directly transferable to bridges with different structural forms, materials, or loading conditions. In practice, more complex bridge geometries and larger spans may introduce additional challenges related to sensor range, point density, and data continuity. Also, the smartphone LiDAR sensor is subject to inherent technical constraints, including limited sensing range, variable point density, and noise characteristics. These factors can influence measurement accuracy, particularly in areas with complex geometry or reduced line-of-sight conditions. Next, the incremental scanning strategy adopted in this study, while effective in achieving complete coverage, may introduce cumulative alignment uncertainty due to user movement and scanning trajectory during data collection.
The accuracy assessment in this work was based on coordinate and distance comparisons with reference data obtained from a conventional surveying method. More advanced validation approaches, such as dense cloud-to-cloud comparison with terrestrial LiDAR or high-resolution photogrammetric datasets, were beyond the scope of the present study but would provide further insight into systematic errors and deformation detection. Future research should therefore consider multi-structure investigations incorporating different bridge types, optimized ground control point configurations, and controlled acquisition strategies. Additional studies involving repeated measurements, alternative scanning paths, and more advanced statistical analyses would also support the development of standardized and reproducible workflows for smartphone LiDAR applications in infrastructure assessment.
This study assessed the accuracy of smartphone LiDAR for 3D bridge modelling by comparing results obtained from an iPhone 13 Pro and conventional surveying methods. The assessment considered coordinate accuracy, distance measurements, and volumetric estimation in order to evaluate the geometric consistency between the two approaches.
The findings indicate that smartphone LiDAR is capable of generating 3D bridge models with coordinate accuracy within the decimeter to sub-meter range, showing reasonable agreement with the conventional surveying method under the conditions of this study. Distance analysis revealed moderate localized inconsistencies, reflecting the sensitivity of point-to-point measurements to positional variation. In contrast, volumetric comparison showed a relatively small overall difference between the reconstructed models, highlighting the capacity of surface integration to compensate for localized geometric deviations.
Although smartphone LiDAR cannot replace high precision surveying instruments required for detailed structural inspection and deformation monitoring, it represents a practical and cost-effective option for preliminary bridge documentation, visualization, and rapid geometric assessment. Overall, the results suggest that consumer-grade LiDAR embedded in smartphones has considerable potential as a complementary tool within geomatics and civil engineering workflows, particularly for applications where accessibility, efficiency, and operational simplicity are prioritized.
Acknowledgement: The authors would like to acknowledge the support of Faculty of Built Environment, Universiti Teknologi MARA for the encouragement and support on this research.
Funding Statement: The authors received no specific funding.
Author Contributions: The authors confirm contribution to the paper as follows: Conceptualization, Muhamad Hakimi Sahbudin and Noraain Mohamed Saraf; software, Muhamad Hakimi Sahbudin; methodology, Muhamad Hakimi Sahbudin, Noraain Mohamed Saraf and Lau Chong Luh; validation, Muhamad Hakimi Sahbudin and Noraain Mohamed Saraf; formal analysis, Muhamad Hakimi Sahbudin and Noraain Mohamed Saraf; investigation, Muhamad Hakimi Sahbudin; resources, Muhamad Hakimi Sahbudin; data curation, Muhamad Hakimi Sahbudin; writing—original draft preparation, Muhamad Hakimi Sahbudin; writing—review and editing, Noraain Mohamed Saraf, Saiful Aman Sulaiman and Nafisah Khalid; visualization, Muhamad Hakimi Sahbudin, Noraain Mohamed Saraf and Abdul Rauf Abdul Rasam; supervision, Noraain Mohamed Saraf; funding acquisition, Noraain Mohamed Saraf. All authors reviewed and approved the final version of the manuscript.
Availability of Data and Materials: Not applicable.
Ethics Approval: Not applicable.
Conflicts of Interest: The authors declare no conflicts of interest.
Nomenclature
| 3D | Three Dimensional |
| AR | Augmented Reality |
| BIM | Building Information Modelling |
| CDS | Cadastral Data System |
| GCP | Ground Control Point |
| GPS | Global Positioning System |
| HEP | Hal Ehwal Pelajar |
| LiDAR | Light Detection and Ranging |
| LOD | Level of Development |
| PTAR | Perpustakaan Tun Abdul Razak |
| RMSE | Root Mean Square Error |
| SfM | Structure from Motion |
| SHM | Structural Health Monitoring |
| TIN | Triangulated Irregular Network |
| TLS | Terrestrial Laser Scanning |
| UiTM | Universiti Teknologi MARA |
| VR | Virtual Reality |
References
1. Wang X, Zhao Q, Xi R, Li C, Li G, Li LA. Review of bridge structural health monitoring based on GNSS: from displacement monitoring to dynamic characteristic identification. IEEE Access. 2021;9:80043–65. doi:10.1109/access.2021.3083749. [Google Scholar] [CrossRef]
2. Ozer E, Kromanis R. Smartphone prospects in bridge structural health monitoring, a literature review. Sensors. 2024;24(11):3287. doi:10.3390/s24113287. [Google Scholar] [PubMed] [CrossRef]
3. Aktan E, Bartoli I, Glišić B, Rainieri C. Lessons from bridge structural health monitoring (SHM) and their implications for the development of cyber-physical systems. Infrastructures. 2024;9(2):30. doi:10.3390/infrastructures9020030. [Google Scholar] [CrossRef]
4. Zschiesche K. Image assisted total stations for structural health monitoring—a review. Geomatics. 2022;2(1):1–16. doi:10.3390/geomatics2010001. [Google Scholar] [CrossRef]
5. Sony S, Laventure S, Sadhu A. A literature review of next-generation smart sensing technology in structural health monitoring. Struct Control Health Monit. 2019;26(3):e2321. doi:10.1002/stc.2321. [Google Scholar] [CrossRef]
6. Di Stefano F, Chiappini S, Gorreja A, Balestra M, Pierdicca R. Mobile 3D scan LiDAR: a literature review. Geomat Nat Hazards Risk. 2021;12(1):2387–429. doi:10.1080/19475705.2021.1964617. [Google Scholar] [CrossRef]
7. Gollob C, Ritter T, Nothdurft A. Forest inventory with long range and high-speed personal laser scanning (PLS) and simultaneous localization and mapping (SLAM) technology. Remote Sens. 2020;12(9):1509. doi:10.3390/rs12091509. [Google Scholar] [CrossRef]
8. Cha G, Sim SH, Park S, Oh T. LiDAR-based bridge displacement estimation using 3D spatial optimization. Sensors. 2020;20(24):7117. doi:10.3390/s20247117. [Google Scholar] [PubMed] [CrossRef]
9. Zinno R, Haghshenas SS, Guido G, VItale A. Artificial intelligence and structural health monitoring of bridges: a review of the state-of-the-art. IEEE Access. 2022;10:88058–78. doi:10.1109/ACCESS.2022.3199443. [Google Scholar] [CrossRef]
10. Xiang W, Wei J, Zhang F. Structural health monitoring design and performance evaluation of a middle-span bridge. Sensors. 2023;23(21):8702. doi:10.3390/s23218702. [Google Scholar] [PubMed] [CrossRef]
11. Kromanis R. Health monitoring of bridges. In: Start-up creation: the smart eco-efficient built environment. Vol. 2. Amsterdam, The Netherlands: Elsevier; 2020. p. 369–89. [Google Scholar]
12. Lee J, Lee KC, Lee S, Lee YJ, Sim SH. Long-term displacement measurement of bridges using a LiDAR system. Struct Control Health Monit. 2019;26(10):e2428. doi:10.1002/stc.2428. [Google Scholar] [CrossRef]
13. Nik Azhan Hakim NNA, Razali R, Mohd Said MS, Muhamad MAH, Mokhtar MA. Accuracy assessment on detail survey plan using iPhone 13 Pro Max LiDAR sensor. Int J Geoinformatics. 2023;19(5):79–86. doi:10.52939/ijg.v19i5.2665. [Google Scholar] [CrossRef]
14. Corradetti A, Seers T, Mercuri M, Calligaris C, Busetti A, Zini L. Benchmarking different SfM-MVS photogrammetric and iOS LiDAR acquisition methods for the digital preservation of a short-lived excavation: a case study from an area of sinkhole related subsidence. Remote Sens. 2022;14(20):5187. doi:10.3390/rs14205187. [Google Scholar] [CrossRef]
15. Tamimi R, Toth C. Comparison of iPhone 13 pro’s camera and lidar sensor to uas photogrammetric model of the great pyramid of Giza. Int Arch Photogramm Remote Sens Spatial Inf Sci. 2023;XLVIII-M-3-2023:299–306. doi:10.5194/isprs-archives-xlviii-m-3-2023-299-2023. [Google Scholar] [CrossRef]
16. Chase PPC, Clarke KH, Hawkes AJ, Jabari S, Jakus JS. Apple iPhone 13 Pro LiDAR accuracy assesment for engineering application. In: Proceedings of the Transforming Construction with Reality Capture Technologies: the Digital Reality of Tomorrow; 2022 Aug 23–25; Fredericton, NB, Canada. [Google Scholar]
17. Tamimi R. Relative accuracy found within iPhone data collection. Int Arch Photogramm Remote Sens Spatial Inf Sci. 2022;XLIII-B2-2022:303–8. doi:10.5194/isprs-archives-xliii-b2-2022-303-2022. [Google Scholar] [CrossRef]
18. Carvalho JP, Bragança L, Mateus R. Optimising building sustainability assessment using BIM. Autom Constr. 2019;102:170–82. doi:10.1016/j.autcon.2019.02.021. [Google Scholar] [CrossRef]
19. Mêda P, Calvetti D, Sousa H. Exploring the potential of iPad-LiDAR technology for building renovation diagnosis: a case study. Buildings. 2023;13(2):456. doi:10.3390/buildings13020456. [Google Scholar] [CrossRef]
20. Zhang Y, Gao H, Chen Z, Fei S, Zhou J, Ghamisi P, et al. Adaptive multi-stage fusion of hyperspectral and LiDAR data via selective state space models. Inf Fusion. 2026;125:103488. doi:10.1016/j.inffus.2025.103488. [Google Scholar] [CrossRef]
21. Zhang Y, Gao H, Chen Z, Zhang C, Ghamisi P, Zhang B. E-Mamba: efficient Mamba network for hyperspectral and LiDAR joint classification. Inf Fusion. 2026;126(2):103649. doi:10.1016/j.inffus.2025.103649. [Google Scholar] [CrossRef]
22. Rutkowski W, Lipecki T. Use of the iPhone 13 pro LiDAR scanner for inspection and measurement in the mineshaft sinking process. Remote Sens. 2023;15(21):5089. doi:10.3390/rs15215089. [Google Scholar] [CrossRef]
23. Xu Y, Stilla U. Toward building and civil infrastructure reconstruction from point clouds: a review on data and key techniques. IEEE J Sel Top Appl Earth Obs Remote Sens. 2021;14:2857–85. doi:10.1109/JSTARS.2021.3060568. [Google Scholar] [CrossRef]
24. Luetzenburg G, Kroon A, Bjørk AA. Evaluation of the apple iPhone 12 pro LiDAR for an application in geosciences. Sci Rep. 2021;11(1):22221. doi:10.1038/s41598-021-01763-9. [Google Scholar] [PubMed] [CrossRef]
25. Shim CS, Dang NS, Lon S, Jeon CH. Development of a bridge maintenance system for prestressed concrete bridges using 3D digital twin model. Struct Infrastruct Eng. 2019;15(10):1319–32. doi:10.1080/15732479.2019.1620789. [Google Scholar] [CrossRef]
Cite This Article
 Copyright © 2026 The Author(s). Published by Tech Science Press.
This work is licensed under a Creative Commons Attribution 4.0 International License , which permits unrestricted use, distribution, and reproduction in any medium, provided the original work is properly cited.
 Downloads
 Citation Tools