
 Login
Login Register
 Submit a Paper
 Propose a Special lssue
 Open Access
ARTICLE
Integrated Assessment of Hydrologic Response and Spatial Hazard Vulnerability for Tropical Watershed Management
1 College of Engineering, Isabela State University, Echague, Isabela, Philippines
2 College of Forestry and Natural Resources, University of the Philippines, Los Baños, Laguna, Philippines
* Corresponding Author: Lanie A. Alejo. Email:
(This article belongs to the Special Issue: Application of Remote Sensing and GIS in Environmental Monitoring and Management, 2nd Edition)
Revue Internationale de Géomatique 2026, 35, 509-532. https://doi.org/10.32604/rig.2026.084091
Received 16 April 2026; Accepted 31 July 2026; Issue published 25 September 2026
 View Full Text
 Download PDF
Abstract
The Abuan Watershed in Isabela, Philippines faces increasing hydrologic and environmental pressures from rainfall variability, land-use change, and hazard-sensitive landscape conditions. This study integrated Soil and Water Assessment Tool (SWAT) modeling with GIS-based vulnerability assessment to evaluate watershed response and spatial vulnerability to flood, drought, and soil erosion. A 5 m × 5 m IFSAR-derived digital elevation model, land-use/land-cover data, soil maps, and hydroclimatic and streamflow records supported the analysis. Streamflow performance was acceptable, with calibration values of R2 = 0.61, nRMSE = 22%, and PBIAS = 3.1%, and validation values of R2 = 0.70, nRMSE = 14%, and PBIAS = 10%. Under baseline conditions, the 63,922-ha watershed received 2169.1 mm of annual precipitation, of which 47% became surface runoff, 23% evapotranspiration, and 30% percolation. Wetter scenarios produced the clearest hydrologic response, increasing runoff by up to 15.99% and soil erosion by up to 13.02% under combined land-use and rainfall-change conditions. Under the projected 2050 rainfall scenario, reforestation caused only minor runoff and percolation changes but reduced simulated soil erosion by up to 1.16 t ha−1 yr−1 relative to the urbanized condition. Flood vulnerability was concentrated in downstream agricultural and settlement areas, whereas drought and soil-erosion vulnerability were greater in cultivated and rainfed uplands. Priority actions therefore include flood-risk reduction and runoff moderation in downstream lowlands, together with vegetation recovery, reforestation, and soil-conservation measures in cultivated hilly and rolling terrain. The integrated SWAT–GIS approach provides a practical, spatially explicit basis for watershed prioritization and intervention planning for future watershed management.Keywords
Supplementary Material
Supplementary Material FileWatersheds are increasingly affected by the combined pressures of land-use change and climate variability. Both of which can alter hydrologic processes and intensify environmental degradation. In tropical regions, land-use and land-cover change associated with forest conversion, agricultural expansion, and settlement growth has been widely linked to changes in streamflow, surface runoff, water yield, evapotranspiration, and groundwater recharge [1,2]. These effects become more critical when they interact with changing rainfall patterns and climatic variability, which can further modify watershed response and increase hydrologic uncertainty [1,3]. Climate change also has important implications for soil erosion, as shifts in rainfall intensity and runoff regimes can increase soil loss and degrade watershed functions, ecosystem services, and land productivity [4,5]. Because land-use pressure and climate change act simultaneously in many basins, watershed-scale assessment has become increasingly necessary to support water resources management, land-use planning, and environmental protection [1,4].
Geospatial approaches provide an efficient means of examining how environmental conditions and hazards vary across space. Geographic Information Systems (GIS) allow terrain, land use, hydrology, soils, and other spatial datasets to be integrated into analytical frameworks for environmental assessment and decision-making [6]. In watershed studies, this is especially useful because basin conditions are rarely uniform. Spatial analysis helps delineate priority zones, hazard patterns, and management units [7]. Recent studies have likewise demonstrated the value of GIS-based approaches in flood risk zoning [8], terrain-informed hazard assessment using digital elevation models [9], and scenario-based spatial evaluation of environmental quality [10]. These capabilities make GIS particularly relevant for watershed analysis, where spatially explicit outputs are needed to support monitoring, hazard mapping, and intervention planning.
Alongside GIS, hydrologic modeling has become a key tool for evaluating watershed response under changing land-use and climatic conditions. Process-based watershed models are employed to simulate runoff, streamflow, evapotranspiration, percolation, and sediment-related processes under both baseline and scenario conditions, making them useful for analyzing present and future watershed behavior [11]. Among these tools, the Soil and Water Assessment Tool (SWAT) has been widely applied because it represents watershed heterogeneity through subbasins and hydrologic response units and supports long-term assessment of land management and climate effects on hydrologic processes [12]. SWAT was selected in this study because it can simulate the baseline and scenario-based hydrologic variables needed for integration with GIS-based hazard-vulnerability assessment, particularly runoff, evapotranspiration, percolation, and soil-erosion response at the watershed scale. In the Philippines, SWAT has been applied to evaluate hydrologic responses to land-cover and climate scenarios in selected watersheds. These studies showed that changes in precipitation, forest cover, and urbanization can substantially influence water yield, runoff, evapotranspiration, and baseflow [13]. It has also been applied in the Abuan Watershed to assess probable streamflow changes and associated water-resources risk under climate and land-use change [13]. However, previous work in the Abuan Watershed did not combine that hydrologic modeling approach with hazard-specific GIS-based flood, drought, and soil-erosion vulnerability assessment within a single spatial interpretation framework. In a related Philippine application, Alejo and Ella [14] used SWAT to assess the impacts of climate change on dependable flow and potential irrigable area in the Maasin River Watershed, further showing the value of model-based watershed analysis for water-resources planning. These studies indicate that hydrologic modeling is useful not only for quantifying watershed behavior, but also for testing alternative land-use and climate scenarios that cannot be directly observed in the field. The present study extends that line of work by linking hydrologic scenario simulation with hazard-specific GIS-based vulnerability assessment. This integration was used to identify priority management areas within the same watershed.
Hydrologic simulation alone, however, does not fully show where environmental impacts are likely to be most critical within a watershed. For watershed planning, model outputs need to be interpreted spatially so that areas prone to flood, drought, or soil erosion can be identified more clearly. In the Philippines, GIS-based flood mapping has been applied to delineate flood-prone areas from multiple terrain, hydrologic, and land-related factors, thereby supporting hazard assessment and land-use planning [15]. GIS-based drought assessment has likewise been applied at the river-basin scale to identify spatial differences in vulnerability and to support management in climate-sensitive watersheds [16]. For soil erosion, GIS-based approaches such as RUSLE and susceptibility mapping have been implemented to estimate spatial soil-loss patterns in Philippine watersheds and to identify erosion-prone areas under both present and changing rainfall conditions [17,18]. These approaches complement hydrologic modeling by translating watershed response into mapped priority areas for intervention and planning.
Despite the broad use of hydrologic modeling and GIS-based spatial assessment, these approaches are often applied separately in watershed studies. Reviews of integrated watershed analysis have noted that land-use and climate investigations commonly focus on individual components of basin response, even though water-resources management problems usually involve interacting hydrologic, geomorphic, and spatial processes [19]. More recent framework studies have likewise emphasized the need to move from single-hazard or single-variable assessment toward integrated spatial identification of priority management areas within watersheds [20]. Applied studies have shown that combining GIS with hydrologic or hydraulic modeling can strengthen evaluation of current and future watershed risk by linking process-based simulation with spatially explicit hazard interpretation [21]. Integrated watershed approaches have also been conducted to inform land-use planning and management by connecting scenario analysis with watershed-scale environmental response [22]. However, many studies still do not clearly show how modeled hydrologic change relates to the spatial distribution of hazard vulnerability within the same watershed. This gap is especially important in tropical settings, where land-use pressure, rainfall variability, and management constraints often occur simultaneously. These studies indicate that linking hydrologic modeling with GIS-based flood, drought, and erosion mapping can provide a more spatially explicit basis for watershed management.
The Abuan Watershed in Isabela, Philippines provides an appropriate case for this type of integrated technical assessment. In this study, hydrologic response under land-use and climate scenarios is examined together with GIS-based assessments of flood, drought, and soil-erosion vulnerability. This integrated approach allows modeled watershed change and mapped hazard sensitivity to be interpreted within a single framework for identifying priority management areas. In the present study, flood, drought, and soil-erosion vulnerability were first assessed separately using hazard-specific GIS-based indicators and were then interpreted jointly with the SWAT hydrologic outputs to identify priority management areas. The watershed includes lower areas exposed to flooding, agricultural zones sensitive to drought, and cultivated uplands susceptible to erosion. The watershed therefore provides a suitable setting for linking hydrologic modeling with GIS-based spatial assessment to evaluate watershed condition and identify priority management areas. The study aimed to evaluate hydrologic response and spatial hazard vulnerability under land-use and climate change and to identify priority areas for watershed management in the Abuan Watershed.
The study was conducted in the Abuan Watershed in Isabela, Philippines, located at approximately 17°11′12″ N and 122°07′12″ E, with an estimated catchment area of 63,922 ha (639.23 km2) (Fig. 1). The watershed is drained mainly by the Abuan and Bintacan Rivers. It shows strong spatial variation in terrain and land characteristics, with flood-prone lowlands in the downstream portion and rolling, hilly, to mountainous areas in the middle and upper catchments. Hydrologically, the available daily discharge records from the Alinguigan gauging station for 1985–2010 indicate that the long-term mean integrated downstream flow was approximately 333 m3/s. Because this station reflects the combined flow from the Abuan and Pinacanauan watersheds, the value is presented here only as a descriptor of downstream basin flow conditions and not as an observed annual mean discharge for the Abuan Watershed alone. The available geologic map shows that the Abuan Watershed is dominated by broad undifferentiated geologic units, with other formations occurring mainly near parts of the watershed boundary. This suggests spatial variability in subsurface conditions that may influence infiltration, percolation, and baseflow response across the basin. Soil information was based on the Bureau of Soil and Water Management (BSWM) soil map used in this study. In that source, upland and mountainous portions of the watershed are dominated by mapping units identified as mountain soils. Clay loam occurs in rolling and hilly areas, while sandy loam is more common in the floodplains. Land use is predominantly forest in the upper catchments, whereas agricultural areas planted mainly with corn and patches of kaingin are concentrated in the lower and middle portions. For the period used in the hydrologic modeling, the watershed received an average annual precipitation of about 2169.1 mm. Rainfall peaked during October and November, when flooding commonly occurs in the lower areas, and relatively drier conditions occurred from February to April. These characteristics make the Abuan Watershed a suitable case for integrated assessment because it combines forested upper catchments, cultivated and rainfed uplands, and flood-prone downstream agricultural and settlement areas within a single basin. The watershed is also undergoing land-use transition, including the recent development of tourism areas and ongoing road construction connecting the valley and coastal municipalities. This setting allows flood, drought, and soil-erosion vulnerability to be examined under shared land-use and rainfall pressures and provides a baseline for future watershed assessments.
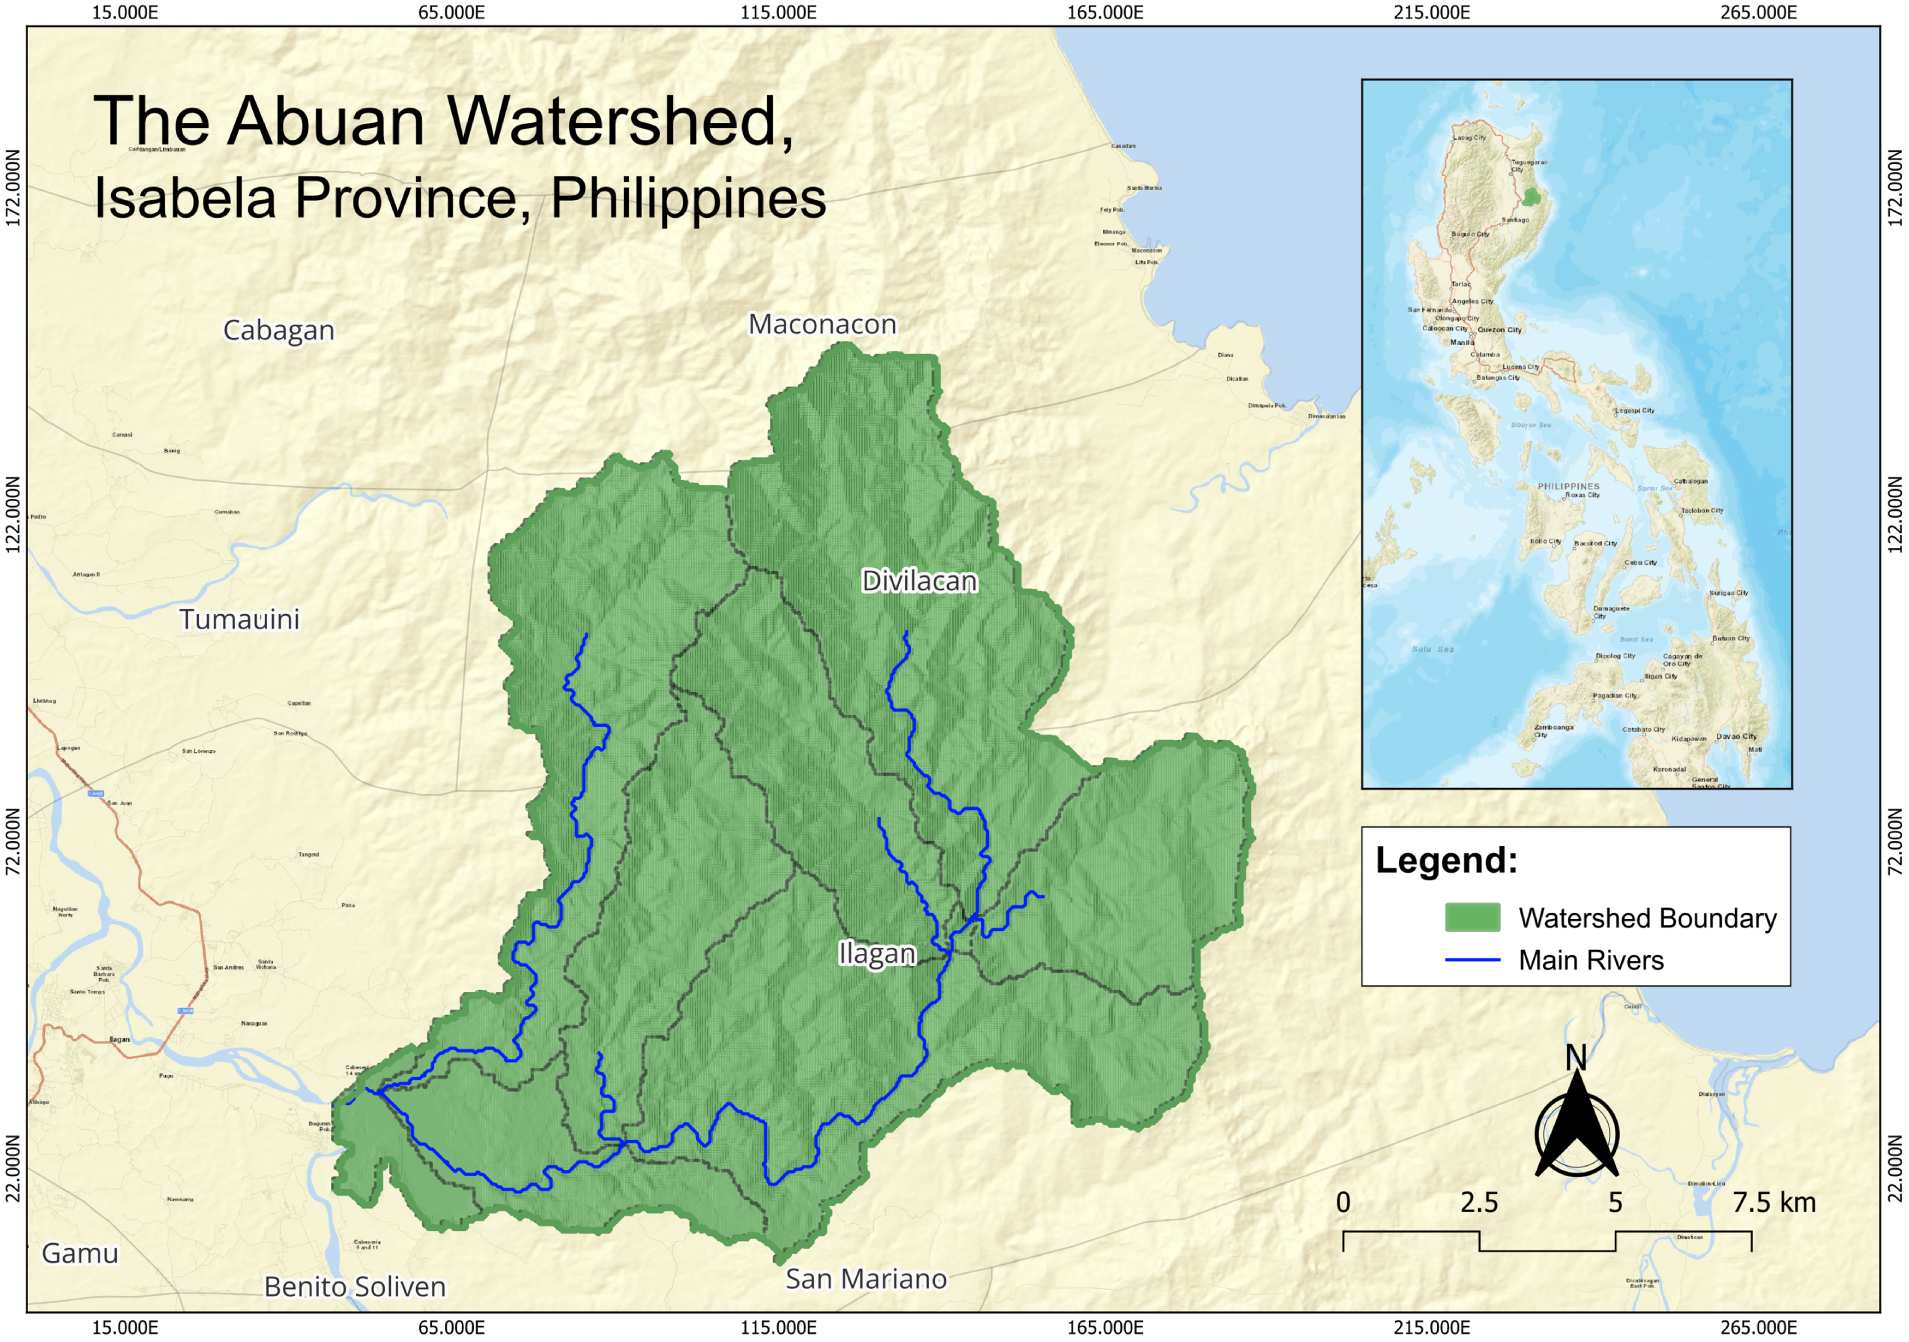
Figure 1: Study area map of the Abuan Watershed in Isabela province, Philippines, showing the watershed boundary, main river network, and surrounding municipalities.
2.2 Overall Methodological Framework
The study followed an integrated methodological framework consisting of four main stages namely data preparation, hydrologic simulation, GIS-based hazard vulnerability mapping, and integrated assessment (Fig. 2). In Stage 1, spatial, hydroclimatic, and hydrologic datasets were assembled and preprocessed for analysis. In Stage 2, the SWAT model was set up through watershed delineation and hydrologic response unit (HRU) generation. This stage was followed by model calibration and validation, land-use and climate scenario simulation, and hydrologic output extraction. In Stage 3, hazard-specific GIS-based flood, drought, and soil-erosion vulnerability maps were generated from relevant spatial indicators. In Stage 4, the baseline vulnerability maps and scenario-based hydrologic outputs were compared spatially and interpreted jointly. These results were then used to identify priority areas for watershed management and environmental intervention. The arrows in Fig. 2 show the sequence of analysis within each stage and the linkages among stages. They indicate the flow of prepared input data to hydrologic modeling, the parallel generation of hazard-specific GIS layers, and the final integration of modeled and mapped outputs.
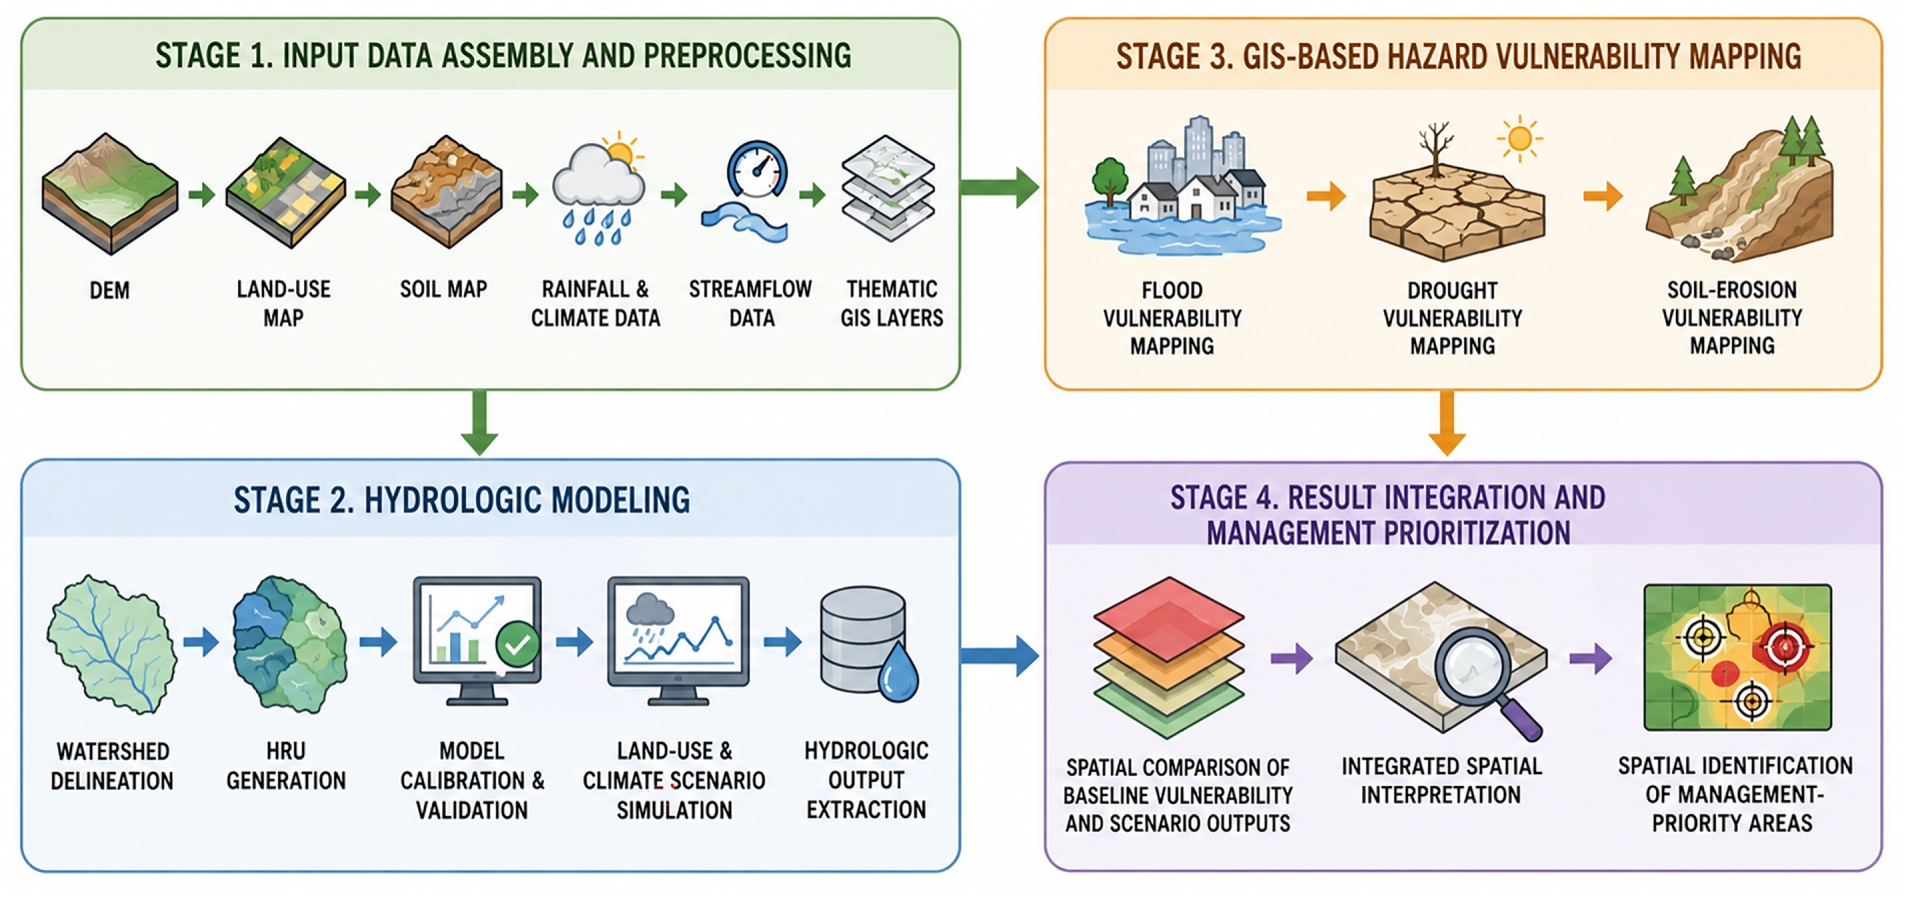
Figure 2: Integrated methodological framework showing the sequence of data preparation, hydrologic modeling, GIS-based hazard-vulnerability mapping, and result integration for watershed management prioritization. Arrows indicate the main flow of analysis within and across stages.
2.3 Data Sources and Preparation
2.3.1 Spatial and Model Input Data
Spatial inputs used in the study included the digital elevation model (DEM), land-use/land-cover data, soil map, river network, and thematic GIS layers required for flood, drought, and soil-erosion vulnerability assessment. The DEM used in this study was a 5 m × 5 m IFSAR-derived DTM obtained from National Mapping and Resource Information Authority (NAMRIA). The dataset formed part of NAMRIA’s 2013 nationwide IFSAR acquisition and was referenced to PRS92/WGS84. It was used for watershed characterization, delineation, and terrain analysis. Soil information was based on the soil map from the Bureau of Soils and Water Management (BSWM).
2.3.2 Calibration and Validation Data
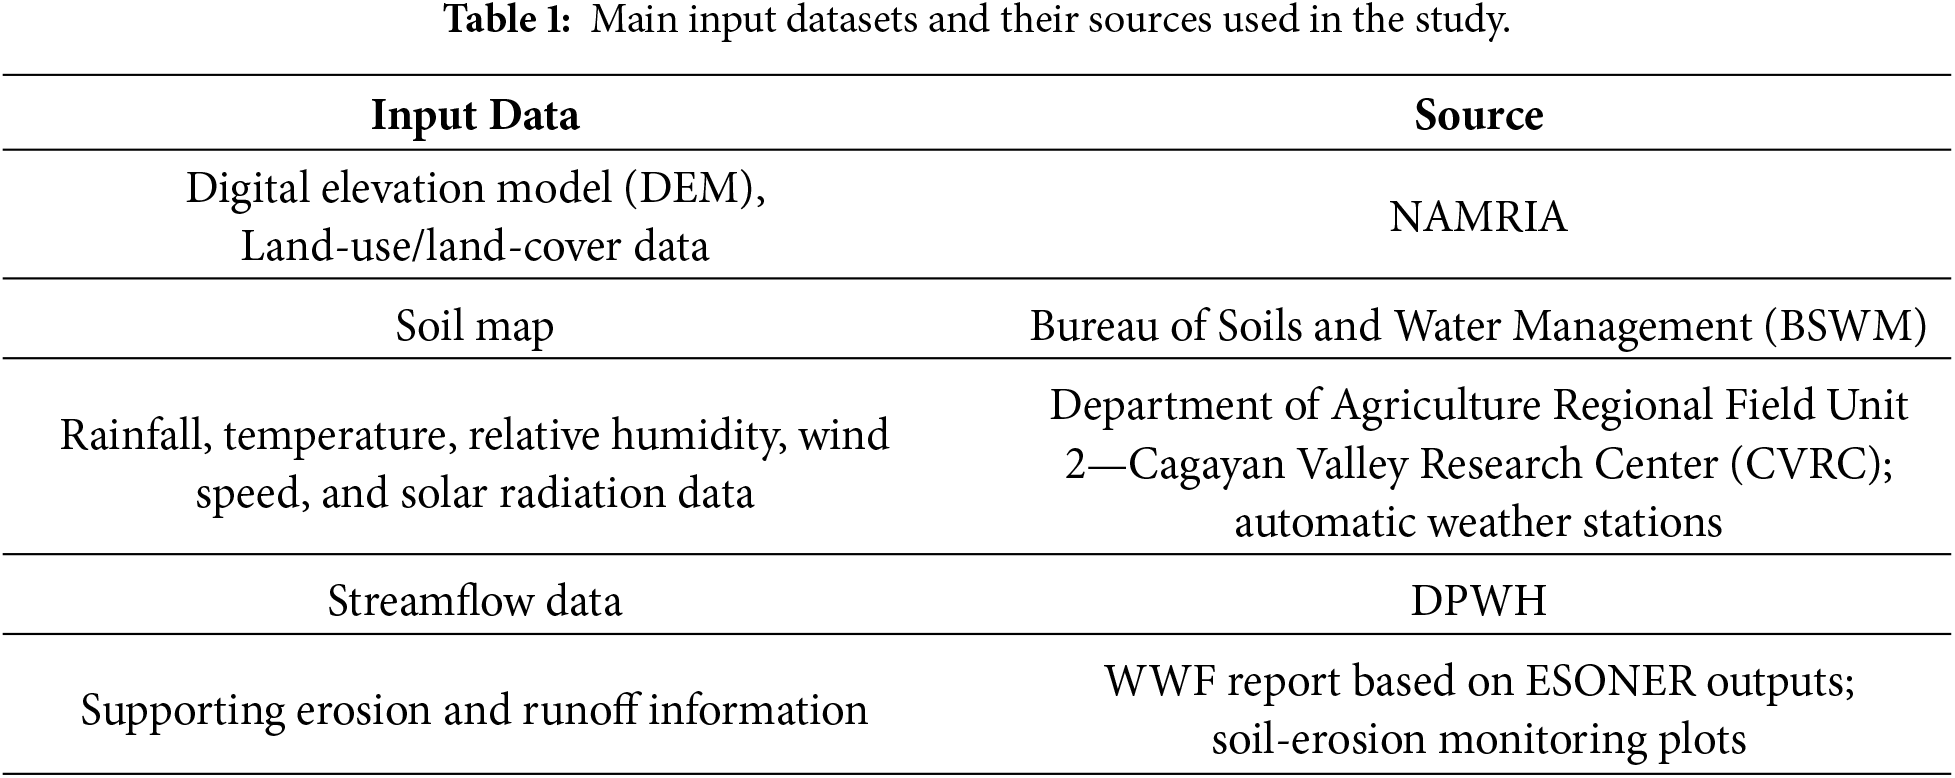
Hydroclimatic inputs included rainfall, temperature, relative humidity, wind speed, and solar radiation data. Available historical climate records from 1985–2016 were obtained from the Department of Agriculture Regional Field Unit 2—Cagayan Valley Research Center (CVRC) in Ilagan City, Isabela, and were used to characterize rainfall and climatic variability in the watershed. Rainfall input for the study was supported by two available sources namely, the historical CVRC station record and an automatic weather station (AWS) installed within the watershed. This available station setup was considered adequate for the present watershed-scale assessment, although it may not fully capture fine-scale spatial rainfall variability across the basin, which remains a common limitation in many Philippine watersheds. Automatic weather station (AWS) data collected within the watershed covered the period from 03 October 2016 to 03 February 2017 and included 47 storm events. For hydrologic analysis and model evaluation, streamflow data were obtained from the Alinguigan DPWH gauging station, where daily discharge records for 1985–2010 represented the integrated downstream flow from the Abuan and Pinacanauan watersheds. The observed record was not separated into independent contributions from the two watersheds and was therefore used as a combined downstream discharge series for calibration and validation. Automatic water-level recorder (AWLR) observations within the watershed were also obtained during the in-watershed monitoring period. Table 1 summarizes the main input datasets and their sources used in the study.
The spatial and hydrometeorological datasets were preprocessed prior to hydrologic modeling and GIS analysis. In the SWAT component, the DEM was used for watershed delineation, stream-network generation, and extraction of terrain-related parameters such as slope, basin area, stream length, and channel characteristics. Land use, soil type, and slope were then combined to define hydrologic response units (HRUs), while weather records were formatted into SWAT weather input text files for precipitation, temperature, solar radiation, wind speed, and relative humidity before simulation. For the GIS-based flood, drought, and soil-erosion assessments, thematic layers were processed through standard GIS procedures, including slope derivation from the DEM, computation of river proximity using Euclidean distance, rasterization and reclassification of indicator layers, and spatial overlay through raster-based map algebra to generate the final vulnerability maps.
The Soil and Water Assessment Tool was utilized to simulate hydrologic processes in the Abuan Watershed. The model setup used the digital elevation model, land-use/land-cover data, soil map, and hydroclimatic inputs as the main spatial and temporal inputs. Watershed delineation and stream generation were performed automatically in SWAT using the DEM. Hydrologic response units were then defined from the spatial combination of land use, soil type, and slope. Weather data for rainfall, temperature, relative humidity, wind speed, and solar radiation were preprocessed into individual SWAT weather input text files prior to simulation. Initial model runs were then performed to establish the baseline setup used for calibration, validation, and scenario simulation.
2.4.2 Calibration and Validation
Model calibration was conducted using long-term streamflow data gauged along the Pinacanauan River, where the Abuan River drains, while part of the dataset was reserved for model validation. Because the available gauging record represents the combined discharge from the Abuan and Pinacanauan watersheds, calibration was performed against the integrated downstream flow signal. This means that the calibrated parameter set reflects the available monitoring configuration rather than the isolated discharge response of the Abuan Watershed alone. Formal model calibration and validation were evaluated using observed streamflow data. Although erosion- and runoff-related information was used during parameter adjustment, the performance statistics presented in this study are based on streamflow. The reported streamflow performance statistics were the coefficient of determination (R2), normalized root mean square error (nRMSE), and percent bias (PBIAS). The acceptability criteria adopted in the source study were R2 ≥ 0.60, nRMSE ≤ 30%, and PBIAS within ±25%. Soil-erosion information from the World Wide Fund for Nature (WWF) report based on ESONER outputs and runoff observations from soil-erosion monitoring plots were used only as supporting information for parameter adjustment and process checking. These datasets were not treated as independent validation datasets for formal model-performance evaluation. This calibration strategy was adopted because directly observed watershed-scale sediment and isolated Abuan discharge records were not available for the present analysis. The calibrated parameters included available soil water content (SOL_AWC), evaporation compensation factor (ESCO), baseflow alpha factor (ALPHA_BF), curve number (CN2), USLE practice factor (USLE_P), groundwater delay (GW_DELAY), threshold water depth in the shallow aquifer required for return flow (GWQMN), and groundwater revap coefficient (GW_REVAP). These parameters were adjusted to improve the simulation of streamflow response and related watershed processes under the available data conditions.
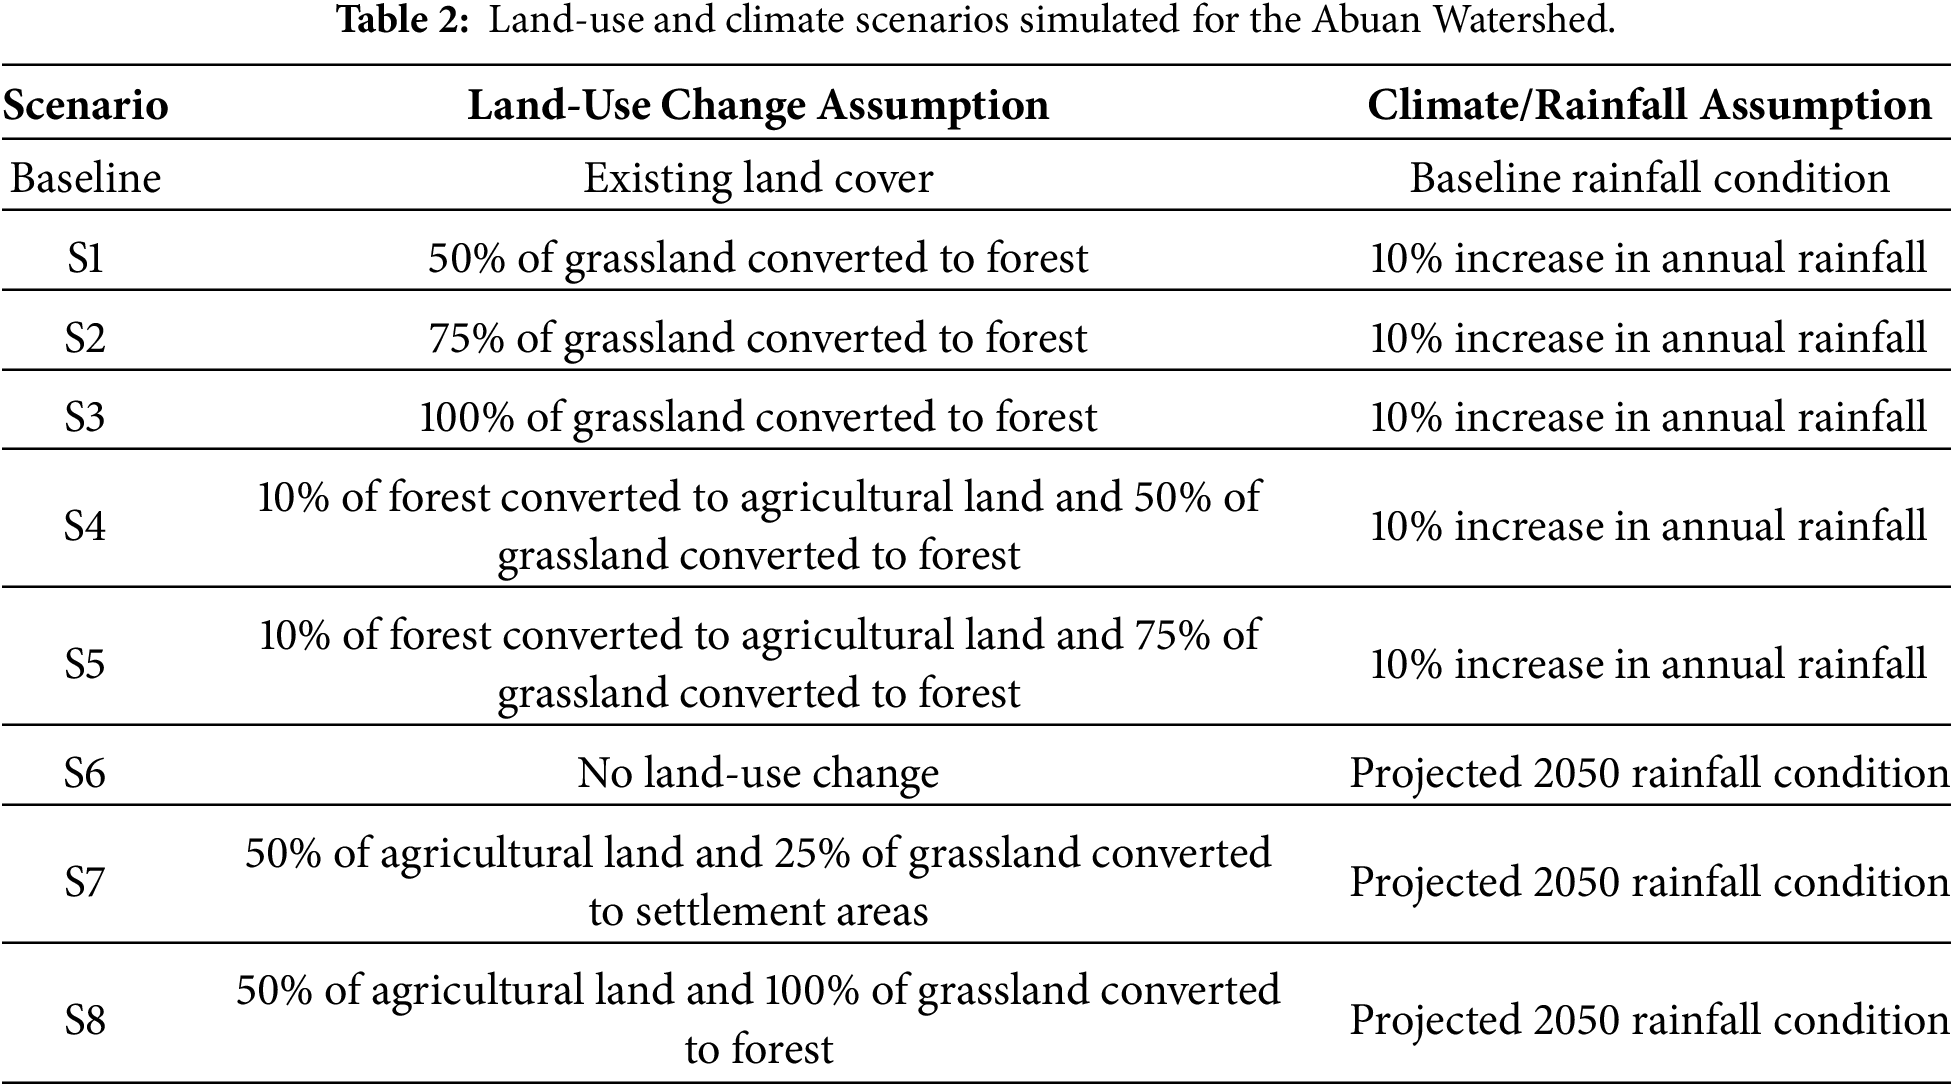
After calibration and validation, the SWAT model was employed to simulate land-use and climate scenarios in the Abuan Watershed. These scenarios represented reforestation, agricultural and urban expansion, and projected rainfall change. Scenarios 1 to 5 combined land-use conversion with a 10% increase in annual rainfall, whereas Scenarios 6 to 8 used projected 2050 rainfall conditions derived from Philippine Atmospheric, Geophysical and Astronomical Services Administration (PAGASA). The latter represented wetter wet-season conditions and drier dry-season conditions. The simulated scenario impacts were evaluated relative to the baseline simulation period of 1986–2016. Reforestation scenarios included the conversion of 2125, 3187, and 4250 ha of grassland to forest in Scenarios 1, 2, and 3, respectively. Under the mixed land-use scenarios, 5321 ha of forest area were converted to agriculture, while 2125 and 3187 ha of grassland were reforested in Scenarios 4 and 5, respectively. Under the projected 2050 rainfall condition, Scenario 7 converted 2867 ha of agricultural land and 1062 ha of grassland to settlements, whereas Scenario 8 represented reforestation of 2867 ha of cultivated land and 4250 ha of grassland. All scenarios were evaluated against the baseline simulation to assess the hydrologic effects of land-use and climate change. The simulated land-use and climate scenarios are hereafter referred to as Baseline and S1 to S8. The simulated scenarios are summarized in Table 2.
2.4.4 Simulated Hydrologic Outputs
The hydrologic outputs extracted and analyzed from the SWAT simulations included precipitation, surface runoff, evapotranspiration, percolation, groundwater-related components, and soil erosion. These variables were compared across baseline and scenario conditions to determine the effects of land-use and climate change on watershed hydrologic behavior and erosion response.
2.5 GIS-Based Hazard Vulnerability Assessment
2.5.1 Vulnerability Assessment Framework
Flood, drought, and soil-erosion vulnerability in the Abuan Watershed were assessed using a GIS-based framework based on sensitivity, exposure, and adaptive capacity. Sensitivity refers to the physical and environmental conditions associated with hazard occurrence, exposure refers to the elements likely to be affected, and adaptive capacity refers to the ability of the watershed and local communities to cope with or reduce hazard impacts. Each indicator was assigned a rating from 1 to 5, with higher values indicating greater vulnerability and lower adaptive capacity. For each hazard, the component layers were combined through weighted spatial overlay to generate the final vulnerability map.
For all three hazard assessments, indicators were rated on a five-level scale and grouped under sensitivity, exposure, and adaptive capacity. Component weights of 30% for sensitivity, 30% for exposure, and 40% for adaptive capacity were applied in the GIS-based overlay, and vulnerability was computed as a function of sensitivity, exposure, and adaptive capacity. Adaptive capacity was given slightly greater weight because it reflects the watershed’s and local communities’ ability to cope with or reduce hazard impacts. Within each component, the indicators were assigned equal weight and combined by averaging their reclassified ratings. The detailed rating criteria, data sources, and reclassification scheme for each hazard are provided in the Supplementary Tables S1–S3. For the final map generation, the composite vulnerability index was classified into five categories: very low, low, moderate, high, and very high. These classes corresponded to index ranges of 1.00–1.80, 1.81–2.60, 2.61–3.40, 3.41–4.20, and 4.21–5.00, respectively. The five-class scheme was adopted to maintain consistency with the original indicator rating scale and to provide an interpretable gradation of relative vulnerability across the watershed. This classification also aligns with the standard use of ordinal five-level rating scales in the underlying GIS-based vulnerability framework. Data were sourced from multiple agencies according to indicator type. PAGASA provided weather- and climate-related data, DENR provided environment- and forest-related data, OCD provided damage-related data, and Local Government Units and WWF provided watershed, exposure, and locally derived vulnerability information.
2.5.2 GIS Processing and Map Generation
The hazard layers were processed in a GIS environment using Quantum GIS to produce the final vulnerability maps. Thematic layers were rasterized, reclassified, and assigned ratings based on the adopted criteria. Indicator layers were reclassified according to the rating criteria and the resulting component layers were combined using weighted raster overlay. The digital elevation model was utilized to derive slope classes, while river-proximity layers were generated where relevant using Euclidean distance. Raster-based map algebra and weighted overlay were then applied to produce the sensitivity, exposure, and adaptive-capacity layers for each hazard. These layers were integrated to generate the final flood-, drought-, and soil-erosion-vulnerability maps, which were classified into five classes: very low, low, moderate, high, and very high.
2.5.3 Flood Vulnerability Indicators
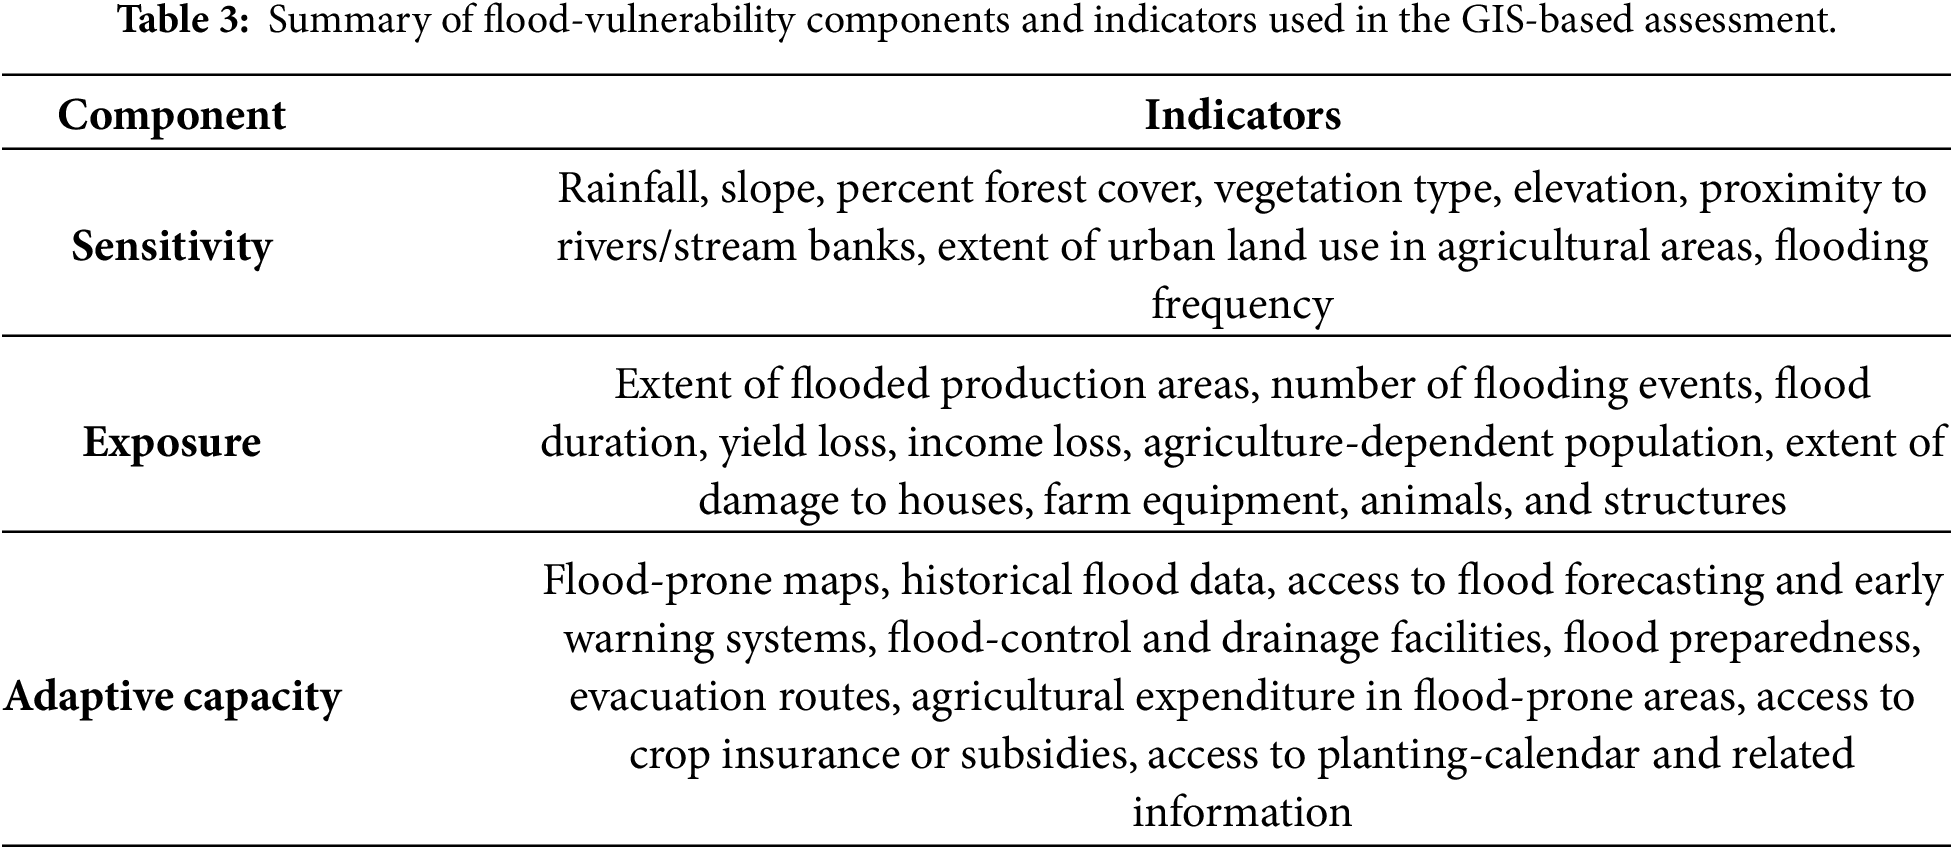
Flood vulnerability was assessed using indicators grouped under sensitivity, exposure, and adaptive capacity. The sensitivity component covered the physical conditions associated with flood occurrence. Exposure covered affected production areas, population, and damage-related conditions. Adaptive capacity covered the availability of planning, warning, infrastructure, and support mechanisms. The flood-vulnerability indicator groups used in the assessment are summarized in Table 3. For the flood assessment, the aggregation of sensitivity, exposure, and adaptive-capacity indicators through weighted raster overlay is illustrated in Supplementary Fig. S1.
2.5.4 Drought Vulnerability Indicators
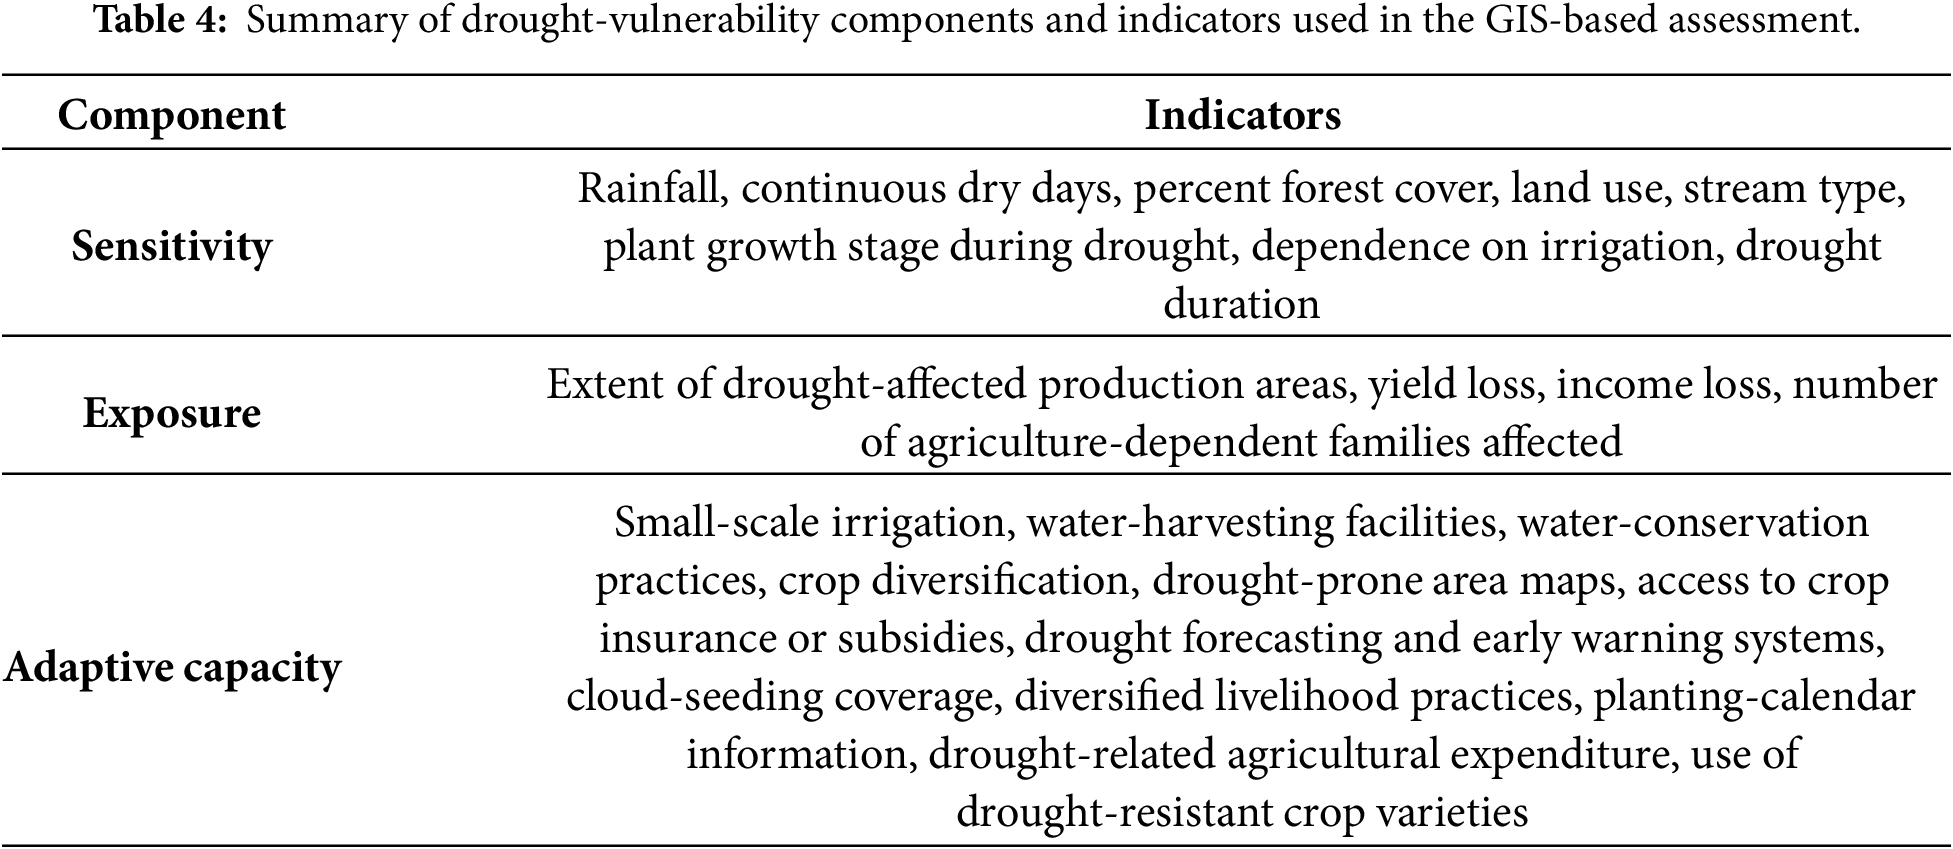
Drought vulnerability was likewise assessed using sensitivity, exposure, and adaptive-capacity indicators. Sensitivity focused on the biophysical conditions associated with drought occurrence, while exposure covered affected agricultural production and livelihoods. Adaptive capacity reflected the availability of irrigation, water-conservation measures, forecasting support, and other drought-related interventions. The drought-vulnerability indicator groups used in the assessment are summarized in Table 4. For the drought assessment, the aggregation of sensitivity, exposure, and adaptive-capacity indicators through weighted raster overlay is illustrated in Supplementary Fig. S2.
2.5.5 Soil-Erosion Vulnerability Indicators
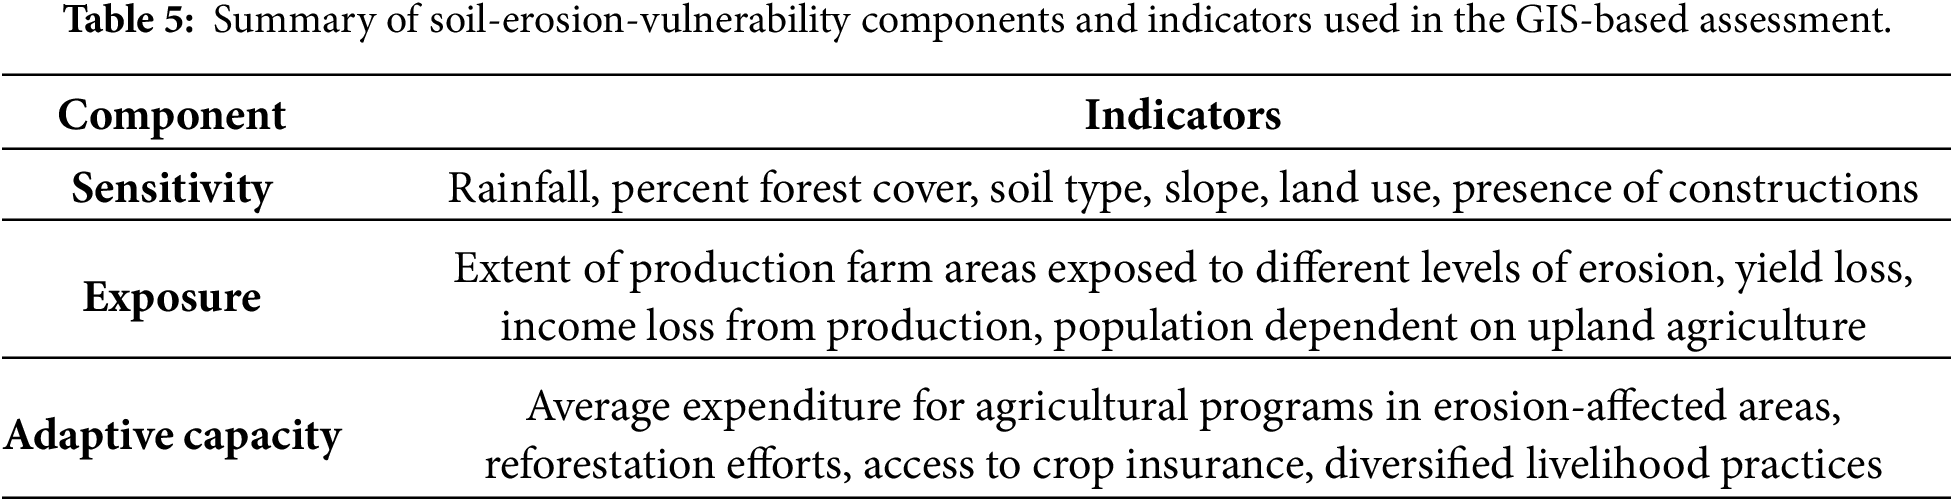
Soil-erosion vulnerability was assessed using the same three-component structure. Sensitivity indicators were associated with rainfall, forest cover, soil, slope, land use, and the presence of constructions. Exposure indicators covered production areas affected by erosion, yield and income losses, and the population dependent on upland agriculture. Adaptive-capacity indicators reflected erosion-related coping and conservation measures, including agricultural expenditure in erosion-affected areas, reforestation efforts, access to crop insurance, and diversified livelihood practices. The soil-erosion-vulnerability indicator groups used in the assessment are summarized in Table 5. For the soil-erosion assessment, the aggregation of sensitivity, exposure, and adaptive-capacity indicators through weighted raster overlay is illustrated in Supplementary Fig. S3.
2.6 Integration of Hydrologic and GIS-Based Results
The SWAT outputs and GIS-based hazard-vulnerability maps were integrated to examine the spatial relationship between modeled watershed response and mapped flood, drought, and soil-erosion vulnerability. Key hydrologic variables, including runoff, evapotranspiration, percolation, and soil-erosion response under baseline and scenario conditions, were compared with the corresponding vulnerability patterns across the watershed. This step was employed to identify areas where unfavorable hydrologic response coincided with high hazard vulnerability and to delineate priority areas for watershed management and environmental intervention.
2.7 Data Analysis and Interpretation
Hydrologic-model outputs were summarized through descriptive comparison of baseline and scenario results. Percent change analysis was conducted to assess the magnitude and direction of change in selected hydrologic variables under the different land-use and climate scenarios. The GIS-based flood, drought, and soil-erosion maps were analyzed by comparing the spatial distribution of vulnerability classes across the watershed. The integrated results were then interpreted to identify priority zones for management, hazard mitigation, and environmental planning.
3.1 Hydrologic Model Performance
The SWAT model showed reasonable calibration performance against the integrated downstream streamflow record of the Abuan–Pinacanauan system. Based on the calibration dataset, the model produced an R² of 0.61, nRMSE of 22%, and PBIAS of 3.1%. These values indicate a satisfactory match between the simulated and observed combined downstream streamflow under the available monitoring configuration. They support the use of the calibrated parameter set for comparative scenario simulation, while recognizing that the calibration does not independently validate the isolated discharge response of the Abuan Watershed. The calibration relationship between observed and simulated streamflow is shown in Fig. 3a.
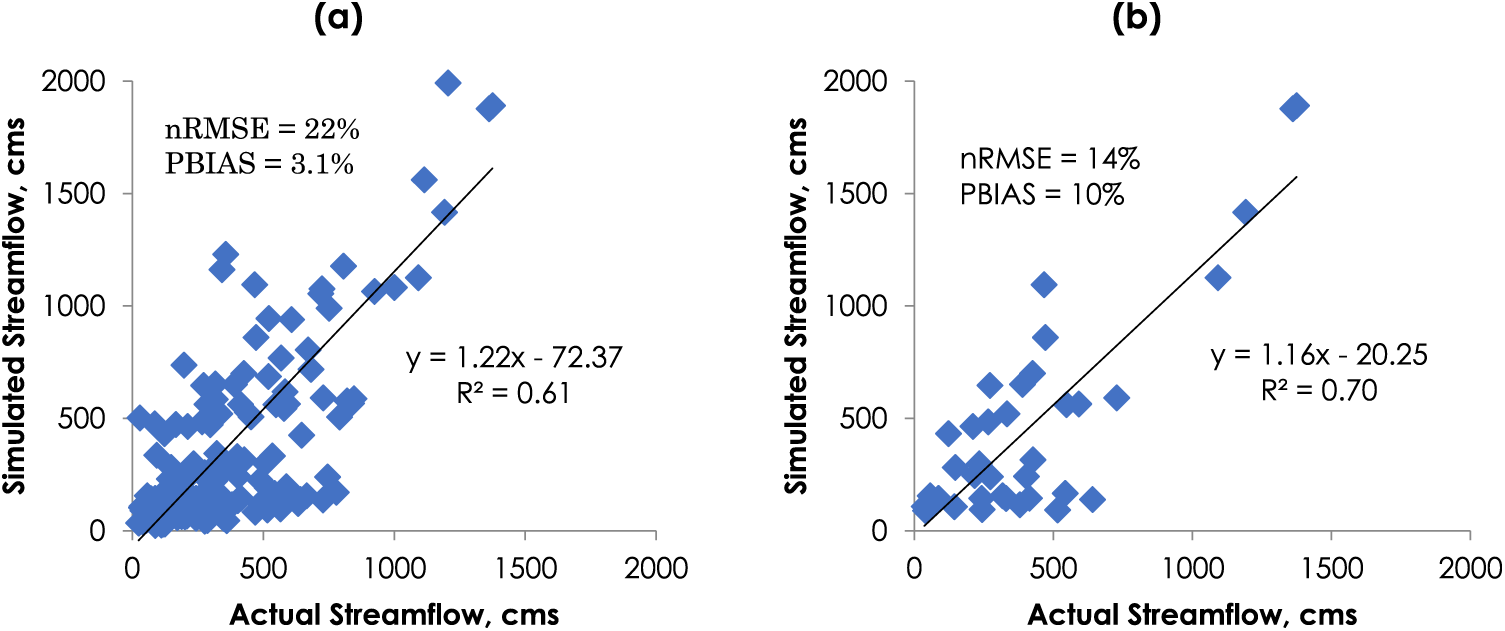
Figure 3: Streamflow-based SWAT model performance in the Abuan Watershed: (a) calibration and (b) validation.
Validation using an independent streamflow dataset also showed reasonable model performance. The model produced an R2 of 0.70, nRMSE of 14%, and PBIAS of 10%. These results indicate that the model was able to reproduce streamflow behavior with acceptable accuracy under a separate dataset. The validation relationship between observed and simulated streamflow is presented in Fig. 3b.
3.2 Baseline Hydrologic Characteristics of the Abuan Watershed
3.2.1 Average Monthly Hydrologic Behavior
Under baseline conditions, the hydrologic behavior of the Abuan Watershed followed the seasonal rainfall regime of the basin. Simulated rainfall, runoff, lateral flow, and water yield generally increased during the wet months, while evapotranspiration followed a different seasonal pattern and reached its highest levels from May to July. At the watershed scale, the rainy season was reflected by stronger hydrologic response during the latter part of the year, consistent with the observed climatic pattern in which mean monthly rainfall was highest in November (322 mm), and lowest in February (56.4 mm) and March (54.6 mm). This seasonal contrast indicates that runoff and water-yield responses were mainly rainfall-driven, whereas evapotranspiration was more pronounced during the warmer part of the year. The simulated monthly basin values under baseline conditions are shown in Fig. 4.
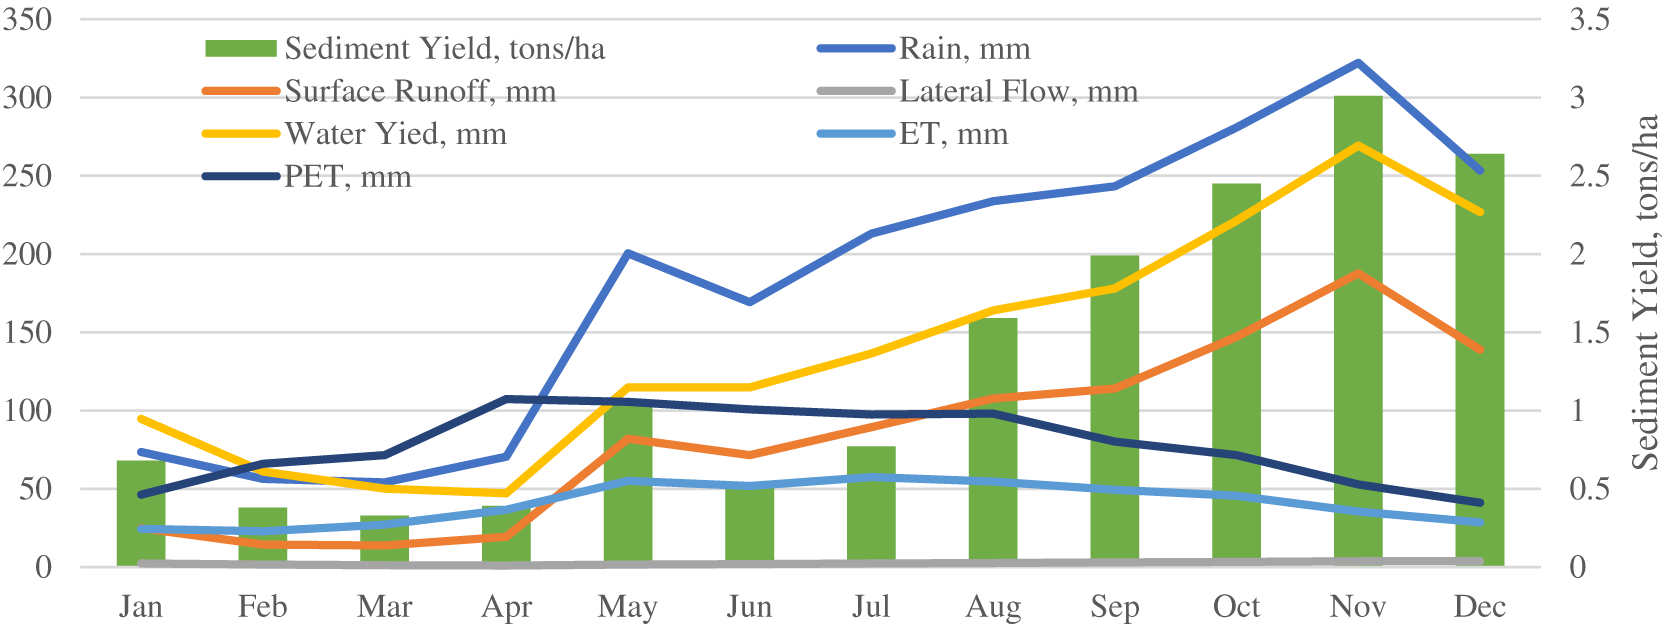
Figure 4: Average monthly simulated hydrologic variables in the Abuan Watershed under baseline conditions.
3.2.2 Baseline Annual Hydrologic Components
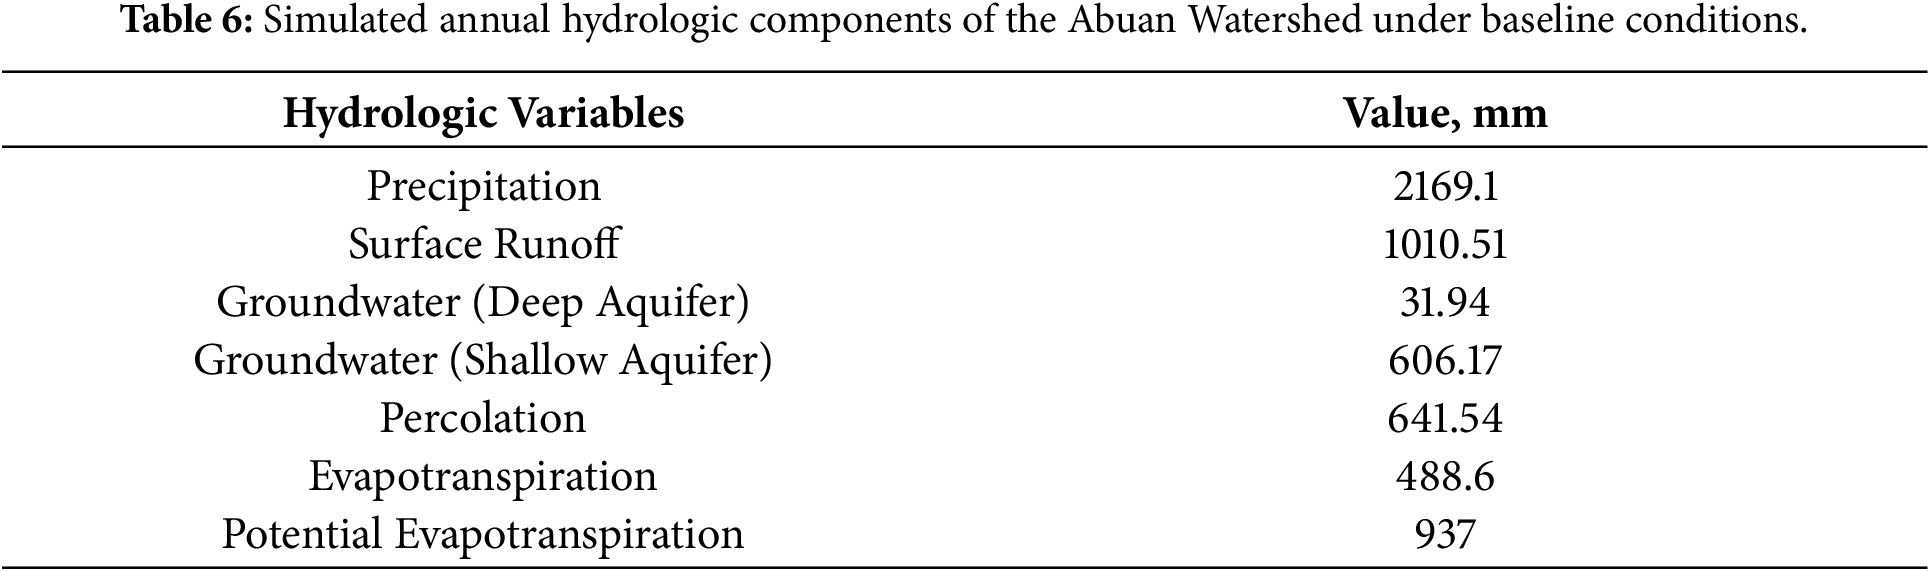
The baseline simulation indicated that the Abuan Watershed received an average annual precipitation of 2169.1 mm. Of this amount, 1010.5 mm was converted to surface runoff, 488.6 mm was lost through evapotranspiration, and 641.5 mm percolated into the soil profile (Table 6). Simulated groundwater contributions included 606.2 mm from the shallow aquifer and 31.9 mm from the deep aquifer, while deep aquifer recharge was estimated at 31.9 mm. Potential evapotranspiration reached 937.0 mm annually. In relative terms, surface runoff accounted for about 47% of annual rainfall, evapotranspiration for about 23%, and percolation for about 30%, indicating that runoff was the dominant hydrologic pathway under baseline conditions. The model also showed strong spatial variation in annual sediment yield, ranging from about 0.1 t ha−1 in mountainous areas to as much as 243 t ha−1 in hilly and sloping agricultural areas. These baseline values provided the reference condition for evaluating the effects of land-use and climate scenarios in the watershed.
3.3 Effects of Land-Use and Climate Scenarios on Watershed Hydrology
3.3.1 Scenario Effects on Runoff, Evapotranspiration, and Percolation
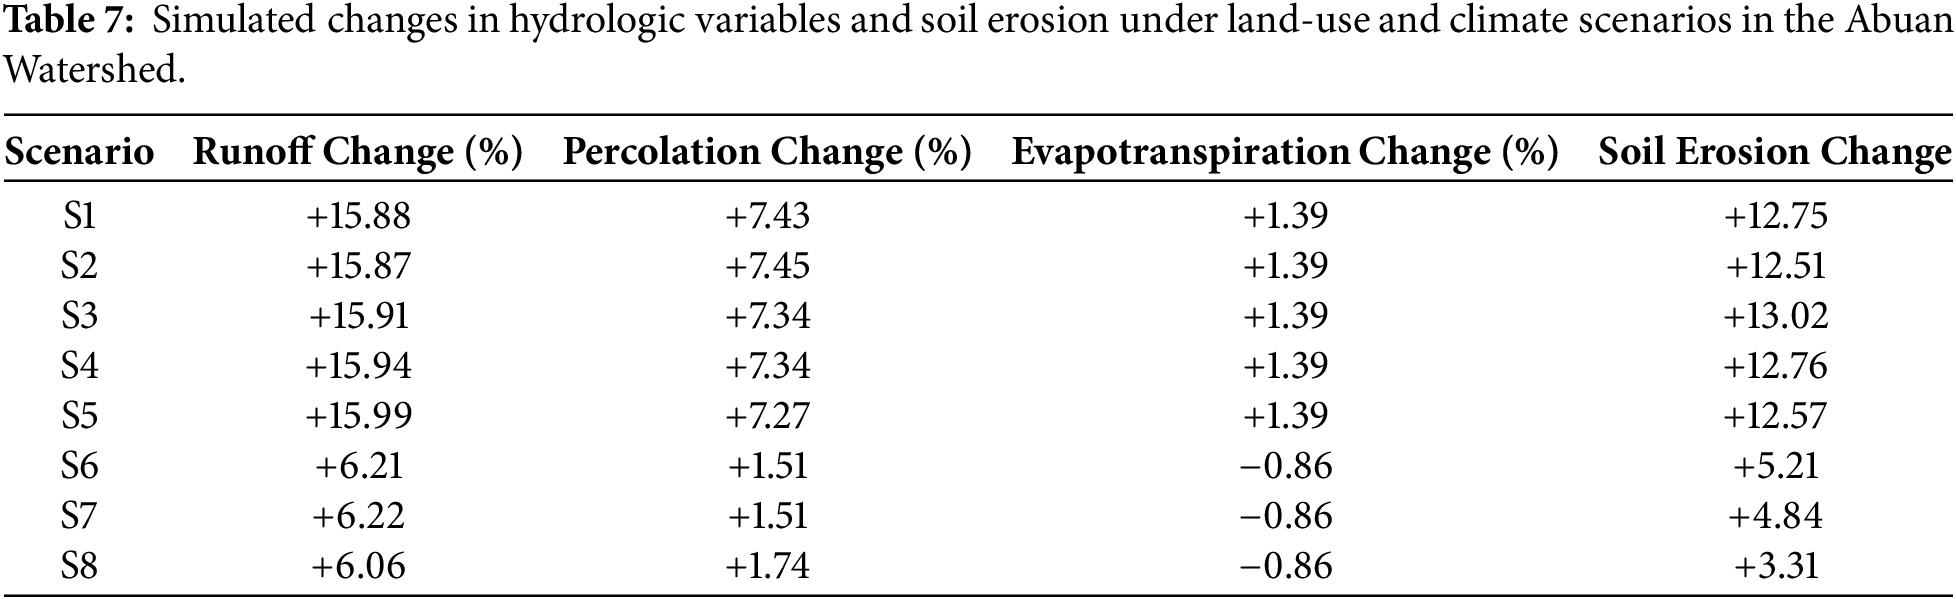
Scenario simulations showed that rainfall change produced the clearest hydrologic response in the Abuan Watershed (Table 7). Under S1 to S5, runoff increased by 15.87% to 15.99%, while percolation increased by 7.27% to 7.45% and evapotranspiration changed only slightly. Under S6 and S7, runoff increased by about 6.21% to 6.22%, while percolation increased by 1.51% and evapotranspiration decreased by 0.86%. Under S8, runoff remained above baseline but was slightly lower than under the urbanized 2050 scenario. Percolation was also slightly higher than under S7, while evapotranspiration remained unchanged. Wetter rainfall conditions exerted a stronger watershed-scale effect than the tested land-use changes.
3.3.2 Scenario Effects on Soil Erosion
Soil erosion also responded to the land-use and rainfall scenarios (Table 7). Under S1 to S5, erosion increased by 12.51% to 13.02%, with the largest increase observed under S3. Under S6 and S7, erosion increased by 5.21% and 4.84%, respectively. Under S8, soil erosion remained above baseline, but was lower than under the urbanized 2050 scenario. These results indicate that rainfall intensification and land disturbance increased erosion pressure, whereas reforestation provided a clearer benefit for erosion control than for basin-scale runoff reduction.
3.4 GIS-Based Hazard Vulnerability Patterns
3.4.1 Flood Vulnerability Pattern
The flood-vulnerability assessment showed that vulnerability in the Abuan Watershed ranged from very low to low. The more vulnerable zones were concentrated in the lower subcatchments, particularly in areas where agricultural land and settlements coincide. These areas were associated with higher exposure to repeated flooding, longer flood duration, and greater potential damage to production areas and physical assets. In contrast, the forested upper portions of the watershed generally showed lower flood vulnerability. The results also suggest that existing adaptive-capacity measures helped reduce overall flood vulnerability in the basin. The spatial distribution of flood vulnerability is shown in Fig. 5.
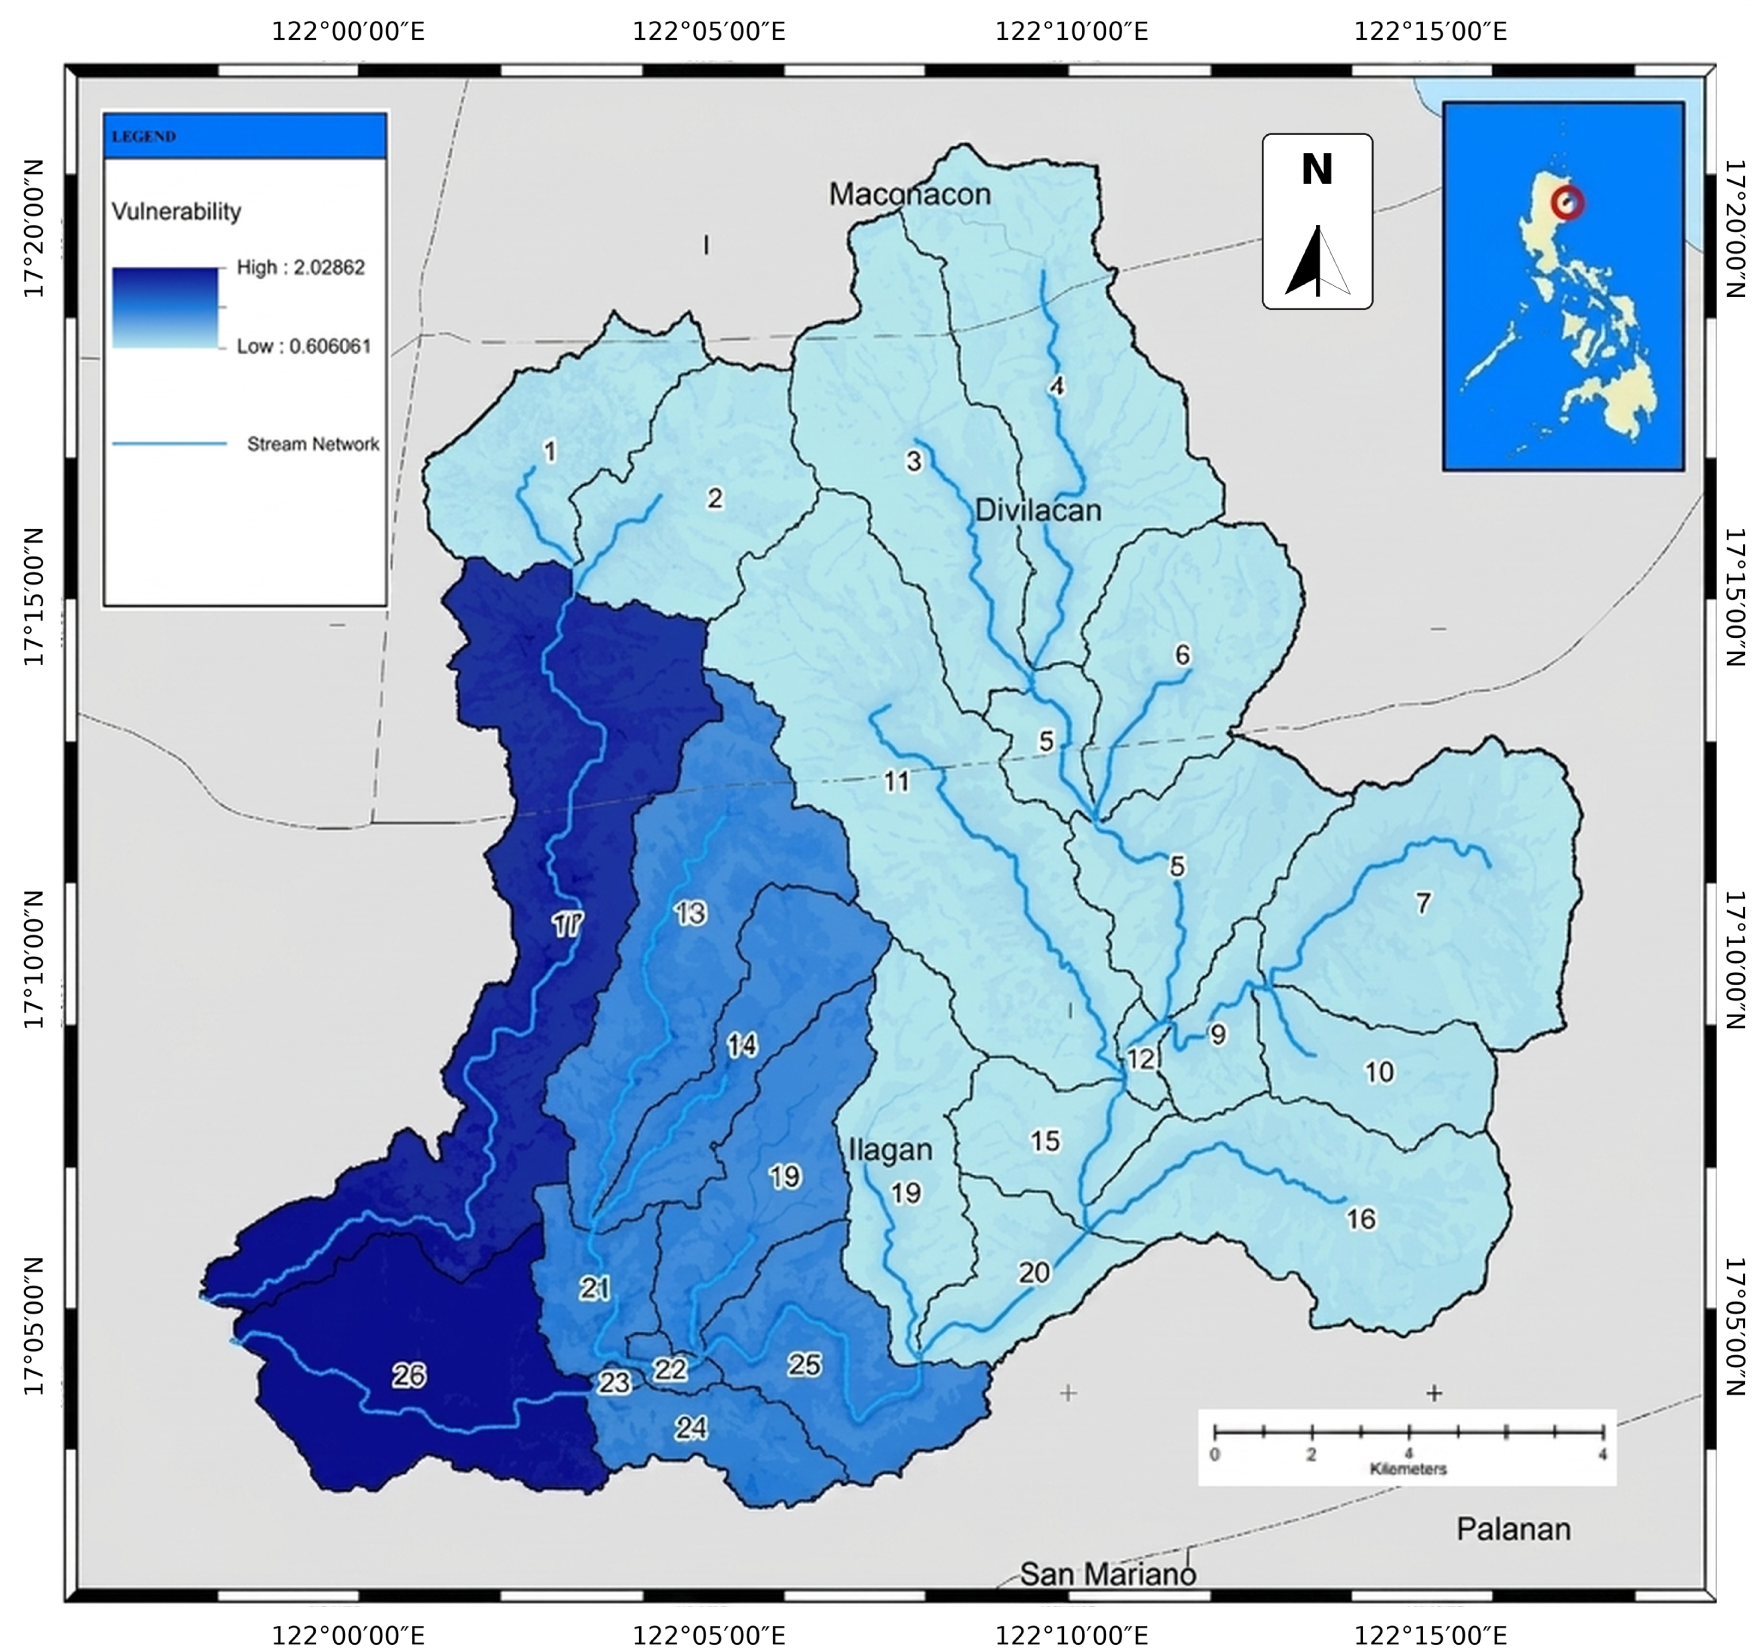
Figure 5: GIS-based flood-vulnerability map of the Abuan Watershed.
3.4.2 Drought Vulnerability Pattern
The drought-vulnerability assessment indicated very low vulnerability across the watershed under the adopted five-class scale, although spatial variation was observed within this class. The highest relative drought-vulnerability values occurred in agricultural areas, particularly in subbasin 26, where cultivated lands were more exposed to limited irrigation, production losses, and livelihood sensitivity during prolonged dry periods. Most of the forested portions of the watershed showed very low drought vulnerability. The results suggest that drought impacts were more pronounced in rainfed agricultural areas than in the more vegetated or less cultivated parts of the basin. The spatial pattern of drought vulnerability is presented in Fig. 6.
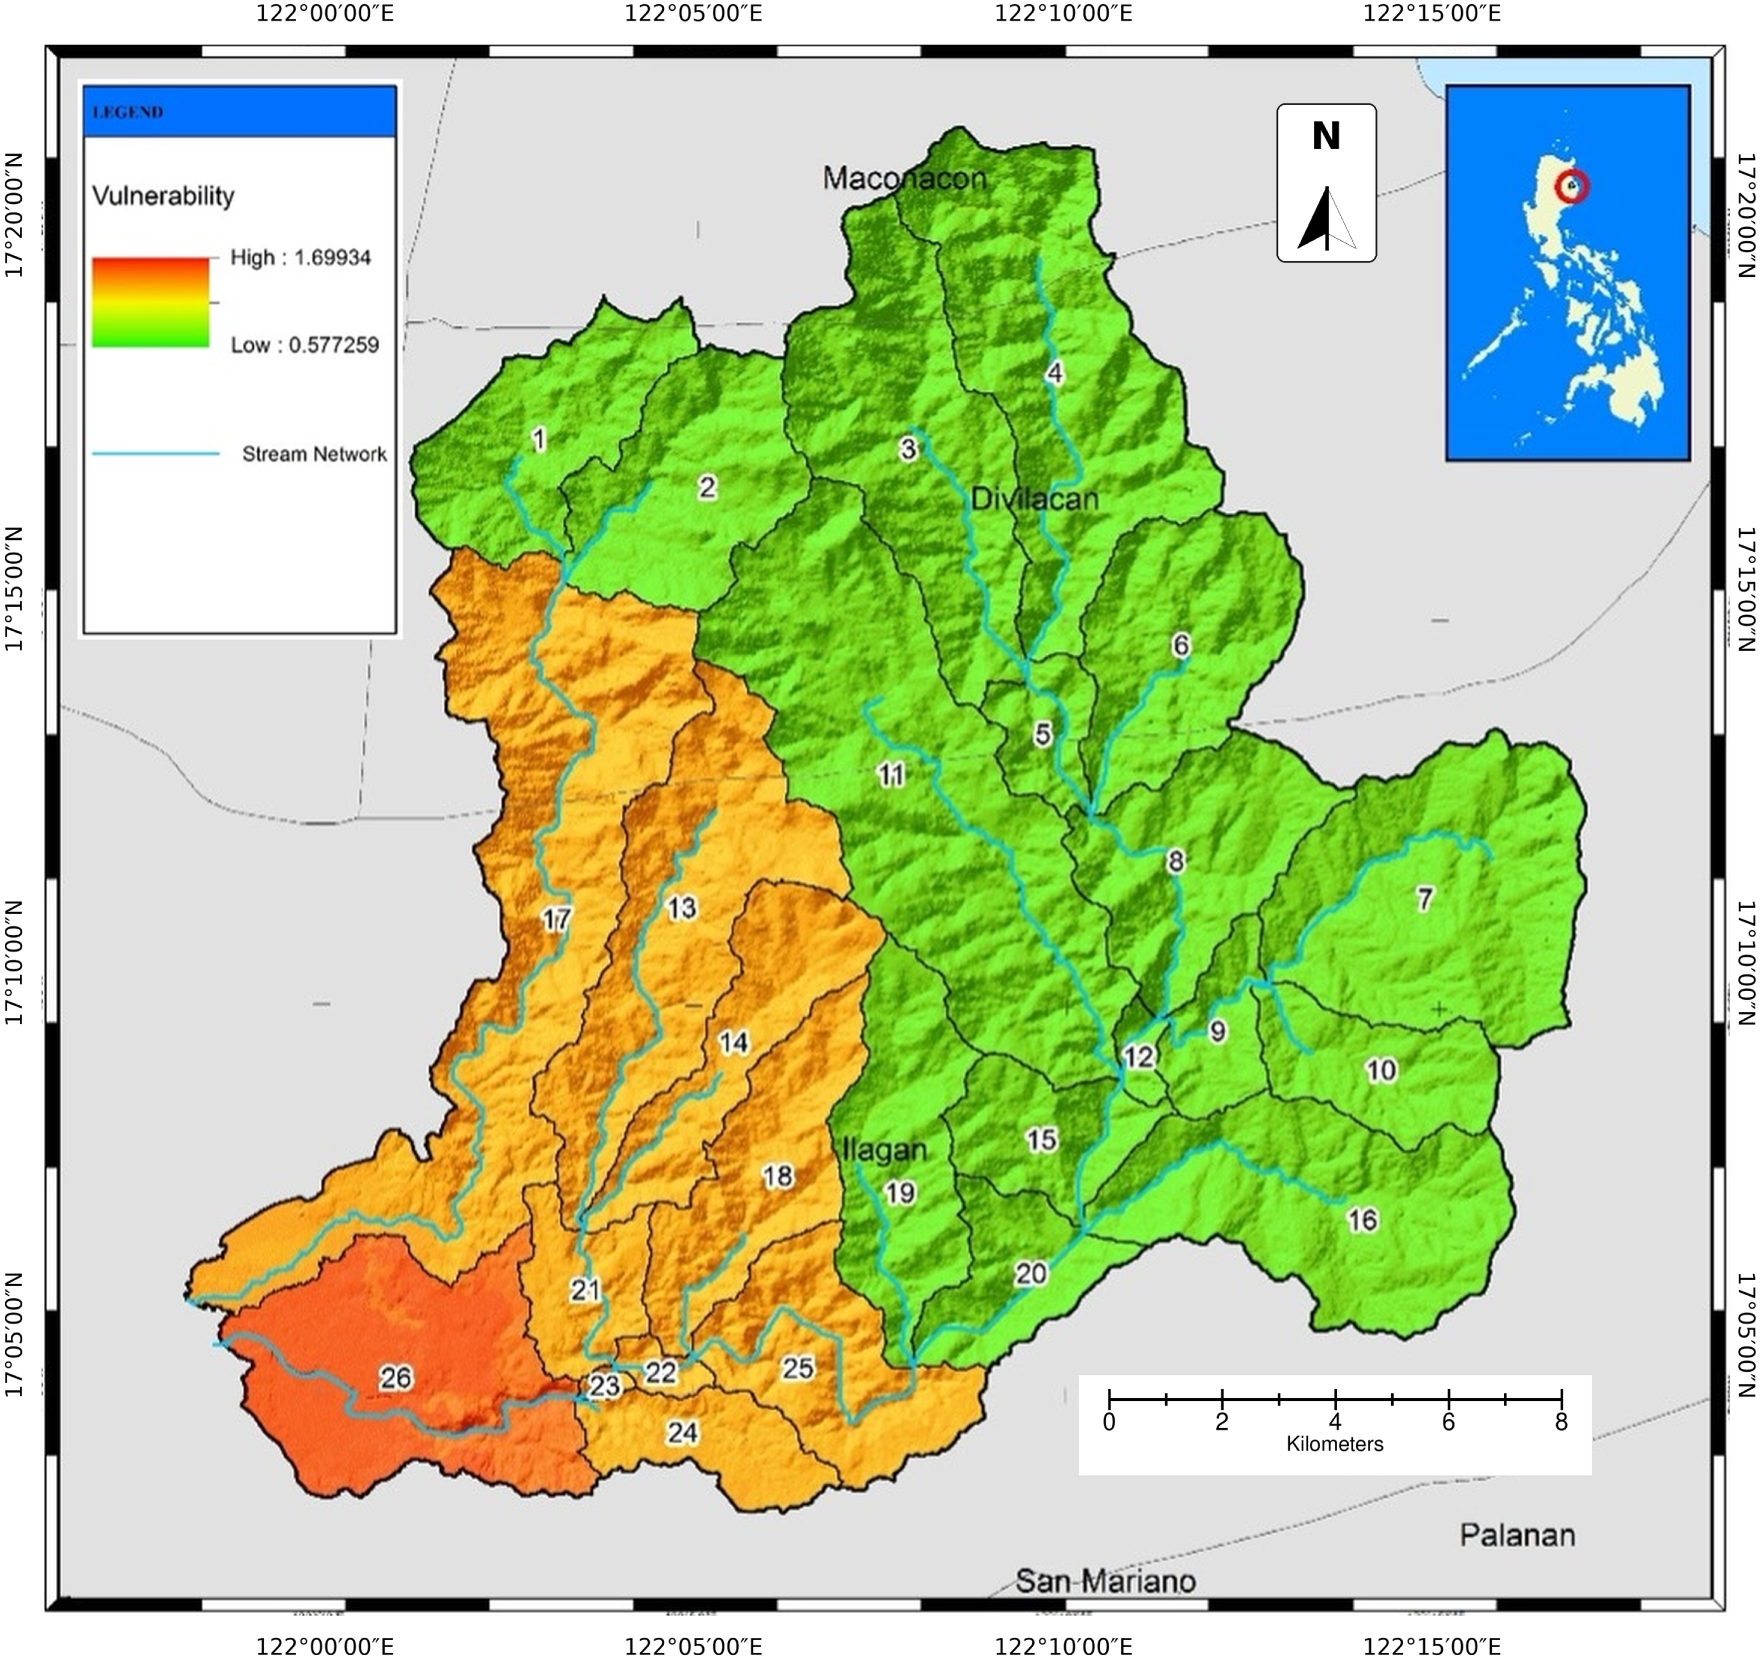
Figure 6: GIS-based drought-vulnerability map of the Abuan Watershed.
3.4.3 Soil-Erosion Vulnerability Pattern
The soil-erosion assessment indicated greater vulnerability in cultivated upland and sloping areas than in the forested portions of the watershed. Areas planted to corn and other agricultural crops in rolling and hilly terrain were more exposed to erosion because of their slope, land-cover condition, and production use. In contrast, forested areas showed relatively lower erosion vulnerability. These results are consistent with the broader physical and land-use setting of the watershed, in which erosion risk is concentrated in disturbed uplands and cultivated areas rather than in closed-forest zones. The spatial distribution of soil-erosion vulnerability is shown in Fig. 7. Spatially, the more erosion-vulnerable areas were concentrated in the southwestern to south-central part of the watershed. Based on the sub-basin delineation shown in Fig. 7, subbasins 20, 24, 25, and 26 together cover about 8578 ha. This is equivalent to 13.4% of the total watershed area. Among these, subbasin 26 showed the most pronounced erosion vulnerability. It covers about 3994 ha, or 6.2% of the watershed. By contrast, much of the northern and eastern subbasins remained within the lower vulnerability range. This indicates that erosion sensitivity is spatially concentrated rather than uniformly distributed across the basin.
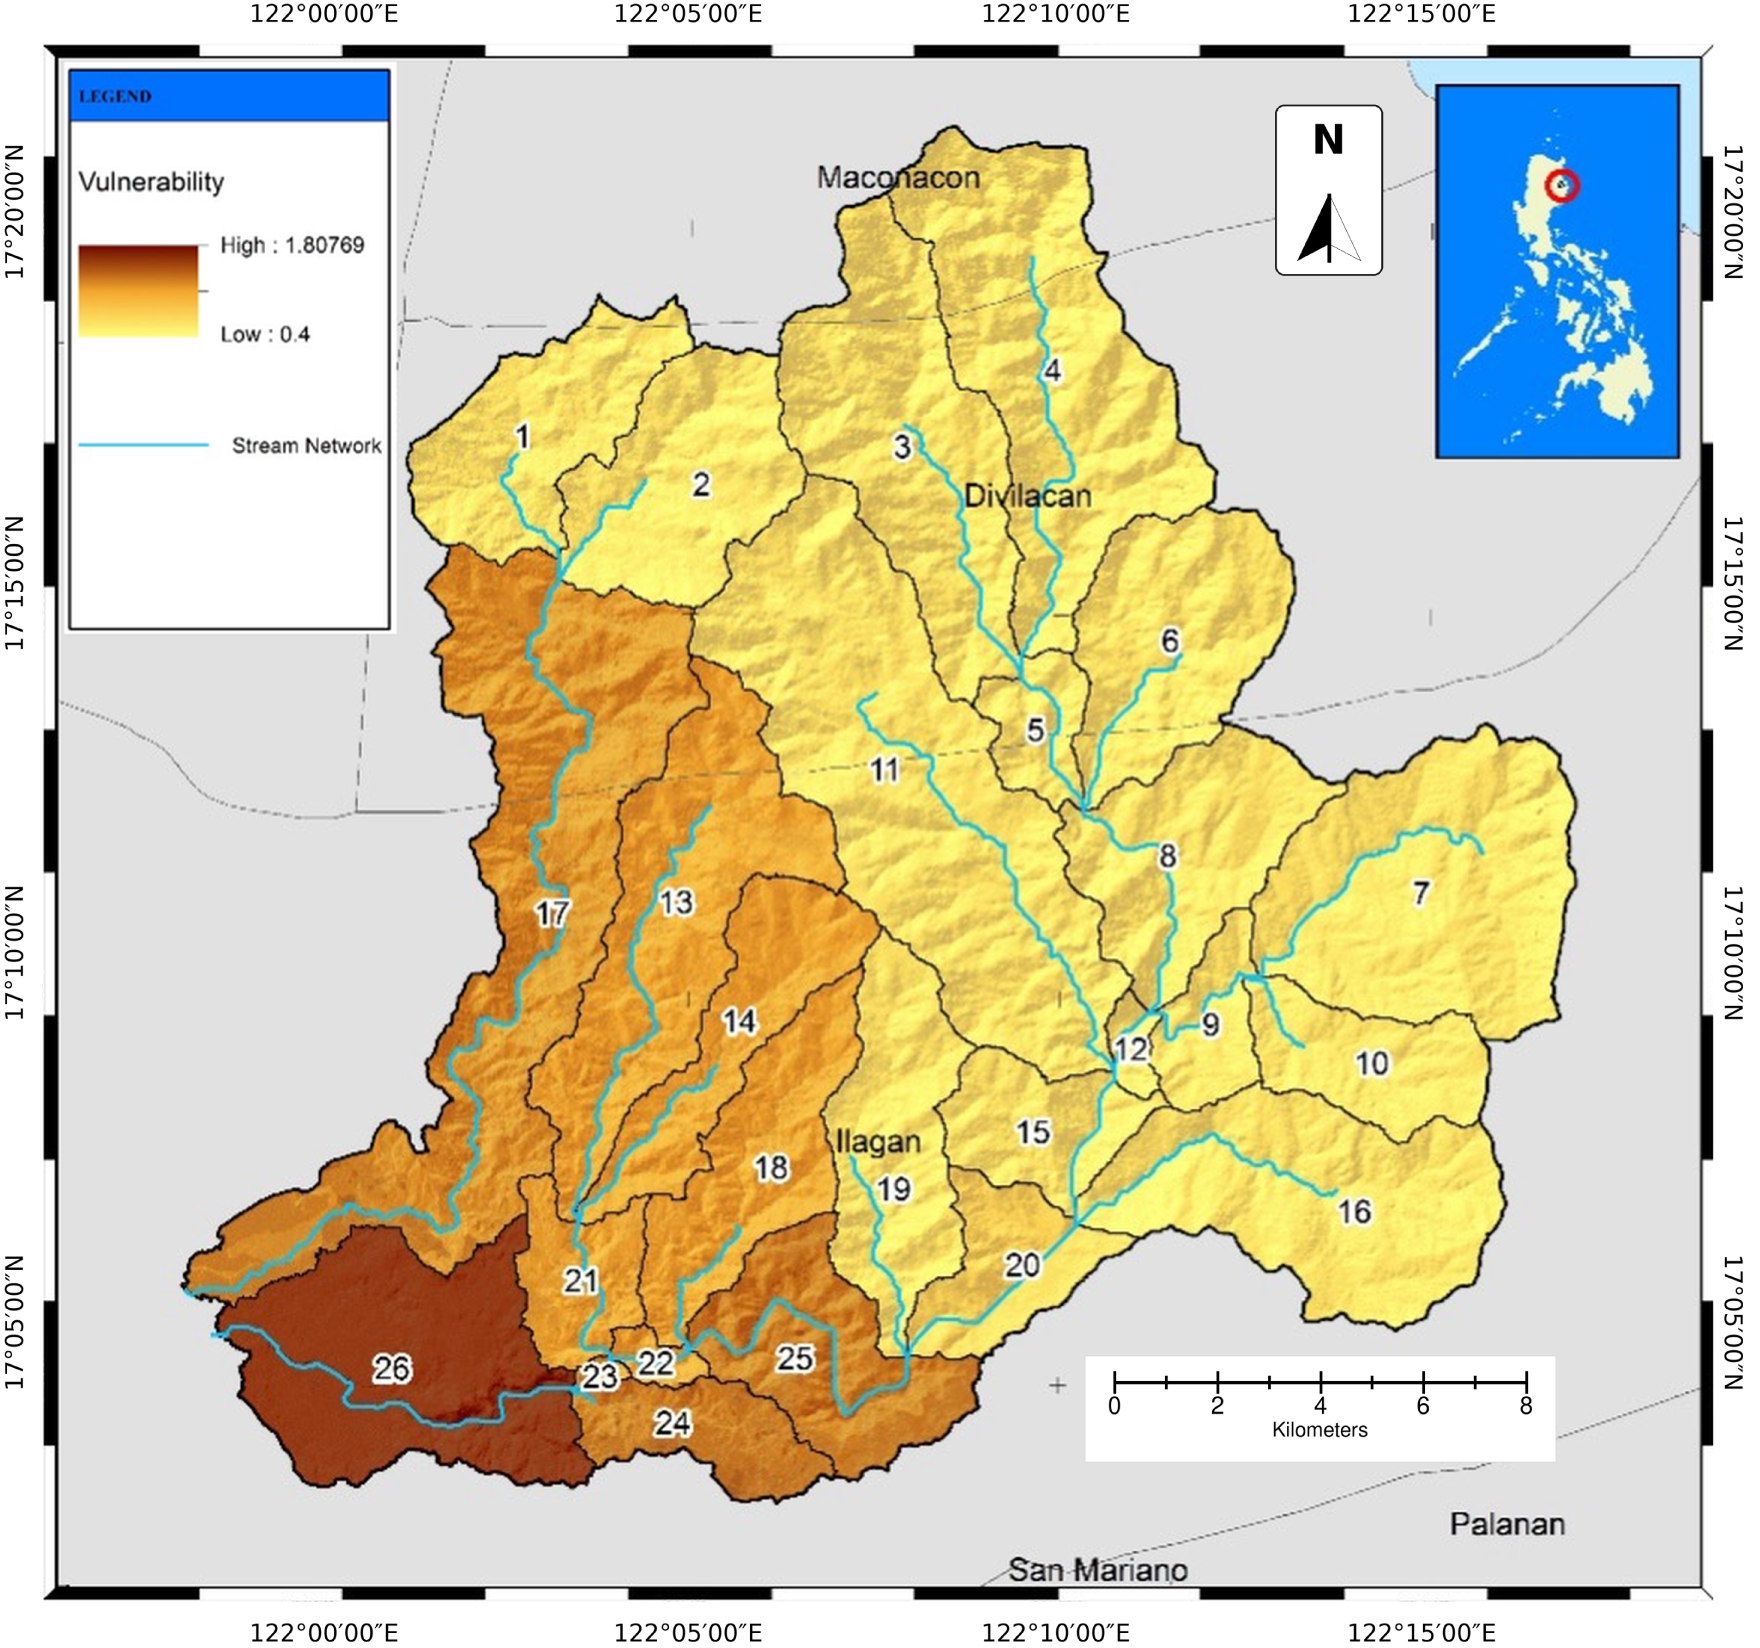
Figure 7: GIS-based soil-erosion-vulnerability map of the Abuan Watershed.
3.5 Integrated Interpretation of Hydrologic and Spatial Results
3.5.1 Spatial Correspondence of Modeled Hydrologic Response and Mapped Vulnerability
This subsection examines the spatial correspondence between modeled hydrologic response and mapped baseline vulnerability patterns. The comparison was interpretive and spatial, rather than based on formal statistical coincidence, correlation, or ranking analysis. The integrated results showed that hydrologic change and spatial vulnerability were concentrated in specific parts of the Abuan Watershed rather than distributed evenly across the basin. Under the land-use and climate scenarios, surface runoff increased by up to 15.99%, equivalent to about 161.6 mm above the baseline annual runoff of 1010.5 mm. This increase is hydrologically meaningful at the watershed scale because it indicates a substantial rise in excess water available for downstream routing and flood exposure. In general, wetter rainfall scenarios produced the clearest watershed-scale hydrologic response, while reforestation showed a more distinct benefit for soil-erosion control than for basin-scale runoff reduction. The discussion below focuses on how these hydrologic responses correspond to the mapped spatial patterns of flood, drought, and soil-erosion vulnerability.
These hydrologic responses are consistent with the mapped hazard patterns, although the comparison was interpretive rather than based on a quantified overlap metric. Flood vulnerability was concentrated in the lower agricultural and settlement areas and ranged overall from very low to low. The more exposed zones were those with higher flooding frequency, longer flood duration, and greater potential damage to production areas and physical assets. Drought vulnerability remained within the very-low class across the watershed. The highest subbasin-level average was observed in subbasin 26, with a drought-vulnerability index of 1.70, which is near the upper limit of the very-low class under the adopted five-class scale. This subbasin also had the largest agricultural area and the greatest exposure to limited supplemental irrigation. Soil-erosion vulnerability likewise ranged from very low to low, but higher sensitivity was associated with cultivated hilly and rolling terrain, particularly in subbasins 20, 24, 25, and 26, where land disturbance and road construction increased erosion sensitivity. Although the mapped vulnerability classes ranged mainly from very low to low, their concentration in exposed agricultural and settlement areas still indicates management-sensitive parts of the watershed. Although the mapped vulnerability classes ranged mainly from very low to low, their concentration in exposed agricultural and settlement areas, together with the projected hydrologic changes under the scenario analysis, still indicates management-sensitive parts of the watershed.
Two main zones emerged from the integrated assessment. The downstream floodplain emerged as the clearest area of overlap. Wetter scenarios increased runoff at the watershed scale, while the mapped flood-vulnerability pattern was concentrated in low-lying agricultural and settlement areas. In this context, increased runoff is interpreted as increasing the likelihood of greater surface-water accumulation and flood exposure. This is especially important in areas that are already physically and socially susceptible. The study did not define a specific runoff threshold for flood occurrence. The linkage was interpreted through the spatial correspondence between modeled hydrologic intensification and mapped flood-prone conditions. The second zone was the cultivated upland and sloping terrain, where increased erosion response under rainfall-change scenarios corresponded with mapped drought and soil-erosion vulnerability in rainfed agricultural areas. These results show that the areas most exposed to hydrologic deterioration are also the areas most vulnerable to hazard impacts.
3.5.2 Priority Areas for Watershed Management
Priority management areas were identified where scenario-driven increases in runoff or soil erosion overlapped with baseline zones of higher flood, drought, or soil-erosion vulnerability. These areas also included exposed agricultural or settlement zones. The integrated results indicate that priority management areas in the Abuan Watershed include both the downstream floodplain zones and the cultivated hilly to rolling areas of the middle and lower watershed. The downstream zones require priority attention because they combine relatively high flood exposure with scenario-driven increases in runoff of up to 15.99% under intensified rainfall conditions and more than 6% under the projected 2050 rainfall scenarios. These areas include agricultural lands and settlements that were identified as more vulnerable to repeated flooding, longer flood duration, and greater damage to production areas and assets.
The cultivated hilly to rolling areas also emerged as priority zones because they combine drought sensitivity, rainfed farming dependence, and elevated erosion risk. In this study, priority designation refers to the most management-sensitive areas within the watershed rather than only to areas that fall under high or very high vulnerability classes. The drought assessment showed that subbasin 26 had the highest subbasin-level average drought-vulnerability index (1.70), although this value remained within the very-low category. Its priority relevance therefore arises from its relative position within the watershed, its large agricultural extent, and its limited supplemental irrigation, rather than because it was classified in a higher vulnerability category. For soil erosion, the more sensitive cultivated and disturbed uplands were concentrated particularly in subbasins 20, 24, 25, and 26. This interpretation is reinforced by the SWAT simulations, which showed that soil erosion increased by as much as 13.02% under the land-use and rainfall-change scenarios. Under the projected 2050 rainfall condition, reforestation produced only marginal changes in runoff and percolation relative to the urbanized scenario, with runoff decreasing by 0.17% and percolation increasing by 0.23%. Its more defensible management value in this study is therefore related to soil-erosion reduction rather than basin-scale flood mitigation. Its more notable effect was on soil erosion, which decreased by as much as 1.16 t ha−1 yr−1.
These findings suggest that watershed management in Abuan should prioritize flood-risk reduction and runoff moderation in the lowlands while strengthening reforestation, vegetation recovery, and soil-conservation measures in cultivated uplands. Reforestation emerges as the most consistent intervention from the integrated assessment because it improves both hydrologic response and spatial hazard conditions. In this sense, the combined use of SWAT simulation and GIS-based vulnerability mapping provides a more spatially explicit basis for management prioritization in Abuan.
4.1 Hydrologic Response under Baseline and Scenario Conditions
The baseline water balance suggests that the Abuan Watershed behaves as runoff-dominated, with about 47% of annual precipitation expressed as surface runoff, compared with about 23% as evapotranspiration and 30% as percolation. This partitioning suggests a relatively rapid rainfall-to-runoff response at the basin scale. In the present study, this interpretation is broadly consistent with the watershed’s strong rainfall seasonality, steep terrain, and relatively high drainage density, as indicated by the DEM-based geomorphic characterization. More generally, runoff and flood response are shaped by the interaction between rainfall characteristics and catchment properties [23]. However, the modeled water-balance partitioning is treated with caution because calibration and validation were based on streamflow, whereas evapotranspiration and subsurface fluxes were not independently validated. In addition, the available soil and geologic information suggests spatial variability in subsurface conditions, but it is not sufficient to confirm the exact magnitude of infiltration, percolation, or baseflow contributions. The relatively low evapotranspiration share should therefore be regarded as a model-based estimate under the available data conditions rather than as an independently confirmed watershed characteristic.
A major implication of the scenario results is that rainfall change produced the clearest hydrologic signal among the tested conditions. Runoff increased by as much as 15.99% in the scenarios that combined land-cover change with a 10% increase in rainfall, while the projected 2050 rainfall condition still raised runoff by more than 6%. These responses suggest that, under the conditions examined, Abuan is especially sensitive to wetter climate inputs. This pattern agrees with broader tropical evidence showing that although both land-use change and climate change affect basin hydrology, substantial precipitation shifts often exert the strongest short-term control on streamflow and runoff response [1]. It is also consistent with previous work in Abuan, which showed that streamflow and water-resources risk are sensitive to both climate and land-use change [24].
The weaker response of evapotranspiration and percolation is also hydrologically important. In the present study, evapotranspiration changed only slightly across the tested scenarios, while percolation increased more modestly than runoff. This means that additional rainfall in Abuan is more readily converted to surface flow than redistributed through atmospheric loss or deeper subsurface storage. This pattern is important because wetter conditions may intensify flood and erosion pressure more quickly than they improve infiltration-related benefits. Related sensitivity to climate-driven hydrologic change has also been reported in other Philippine SWAT applications, including the Maasin River Watershed, where shifts in rainfall altered dependable flow and water-availability indicators relevant to irrigation planning [14].
The results suggest that the principal contribution of reforestation in Abuan lies in strengthening watershed regulation and reducing erosion under climatically stressed conditions rather than in producing large immediate changes in basin-scale runoff. This interpretation is consistent with broader forest-hydrology studies showing that restoration effects are often context-dependent and may be expressed more clearly through flow regulation, dry-season support, and erosion control than through short-term changes in annual runoff totals [25,26]. In Abuan, this interpretation is reinforced by the erosion results, which show strong concentration of sediment yield in cultivated sloping terrain and a clearer reduction in erosion under reforestation than in runoff. These findings further suggest that vegetation recovery may provide its greatest benefit through slope protection, sediment retention, and improved landscape stability rather than through large immediate reductions in annual streamflow response. This view is consistent with evidence that vegetation restoration can reduce runoff and soil loss while producing stronger gains in erosion-control services [27].
4.2 Spatial Vulnerability to Flood, Drought, and Soil Erosion
The mapped hazard patterns indicate that vulnerability in the Abuan Watershed is strongly shaped by watershed position, land use, and terrain rather than distributed uniformly across the basin. Flood vulnerability is concentrated in the downstream agricultural and settlement areas, where low-lying terrain, proximity to channels, repeated inundation, and exposure of production areas combine to increase susceptibility. This pattern is hydrologically plausible because flood impacts typically accumulate in lower landscape positions, where runoff converges and agricultural and built-up land uses are more concentrated. Comparable GIS-based flood assessments in the Philippines have likewise shown that flood-prone conditions are most evident where topographic setting, drainage proximity, and land use interact to amplify exposure and hazard intensity [15]. In Abuan, the downstream floodplain therefore emerges not merely as a low-elevation zone, but as a part of the watershed where biophysical susceptibility and land-use exposure reinforce one another.
Although drought vulnerability remained within the very-low class across the watershed, relatively higher values were associated with cultivated lands, limited supplemental irrigation, and production systems sensitive to prolonged dry periods. Subbasin 26 had the highest subbasin-level average drought-vulnerability index, but its value remained within the very-low category. This indicates that drought vulnerability in Abuan is shaped less by inherently dry climatic conditions than by agricultural dependence and limited buffering capacity in rainfed zones. This interpretation is consistent with Philippine river-basin studies showing that drought vulnerability tends to intensify where crop production is closely tied to rainfall variability and where irrigation access, adaptive support, or water-storage options remain limited [16]. The overlap between subbasin 26 in the drought assessment and subbasins 20, 24, 25, and 26 in the soil-erosion assessment suggests that parts of the cultivated uplands are sensitive to both water stress and land-degradation processes. In this sense, the implication is not that these areas already fall under high vulnerability classes, but that they represent the more management-sensitive portions of the watershed under current land-use and hydroclimatic conditions.
The spatial pattern of soil-erosion vulnerability is likewise consistent with the watershed’s physical and land-use setting. Higher erosion vulnerability is concentrated in cultivated uplands and sloping terrain rather than in the more densely forested parts of the basin. This reflects the combined influence of slope, vegetation condition, soil exposure, and agricultural disturbance, all of which increase the likelihood that rainfall will be translated into sediment detachment and transport. Similar spatial tendencies have been reported in Philippine erosion studies, where cultivated and sparsely protected slopes consistently emerge as the more erosion-prone parts of the landscape [17]. Erosion-susceptibility mapping in the Philippines has shown that rainfall change can further intensify this risk in already sensitive sloping terrain [18]. In Abuan, the erosion map therefore supports the view that land disturbance in hilly and rolling agricultural areas remains a central driver of watershed degradation.
The three hazard maps suggest that different parts of the watershed are vulnerable for different reasons. Flood vulnerability is concentrated where runoff accumulates and exposed land uses are located in the downstream zone. Drought vulnerability is tied more closely to agricultural dependence and limited water buffering in cultivated areas. Soil-erosion vulnerability is governed mainly by slope, disturbance, and land-cover condition in upland terrain. This spatial differentiation is important because it shows that watershed management in Abuan cannot rely on a single uniform intervention. Although the mapped vulnerability classes were generally in the very low to low range, these classifications do not imply negligible management concern. In Abuan, even lower vulnerability classes remain important when they are concentrated in exposed agricultural and settlement areas. In such areas, recurrent hazard impacts can still lead to production losses, infrastructure damage, and environmental degradation. Responses need to be tailored to the physical and land-use context of each zone within the basin.
4.3 Integrated Interpretation and Priority Management Areas
The main value of this study lies in linking modeled hydrologic response with mapped spatial vulnerability rather than treating them as separate lines of evidence. In this study, the integrated interpretation was based on comparative spatial analysis of modeled hydrologic changes and baseline GIS-based vulnerability patterns. It was not derived from a formal optimization or ranking procedure. The relationship between the hydrologic simulations and the vulnerability maps was therefore interpreted spatially rather than operationalized through a quantitative coupling or statistical integration framework. The SWAT simulations show that wetter scenarios increase runoff and erosion pressure. The GIS-based assessments show that vulnerability is concentrated in specific parts of the watershed rather than spread evenly across the basin. These results show that hydrologic intensification becomes most critical where it overlaps with already exposed land uses and sensitive terrain. This integrated reading is important because watershed decisions are shaped not only by the magnitude of hydrologic change, but also by where that change is most likely to translate into flood damage, drought stress, or erosion risk. Integrated watershed assessments have likewise been recommended because land-use and climate effects are better understood when hydrologic processes and spatial response are examined together rather than in isolation [19].
In Abuan, the clearest area of convergence is the downstream floodplain, where modeled runoff increases under wetter scenarios align with the mapped concentration of flood vulnerability in agricultural and settlement areas. This means that the importance of increasing runoff is not only hydrologic but also spatially consequential, because it is expressed in the part of the basin where exposure is already highest. A second area of convergence is the cultivated hilly and rolling terrain of the middle and lower watershed. For drought and soil erosion, the main overlap occurred in subbasin 26 and in the cultivated uplands of subbasins 20, 24, 25, and 26. In these areas, mapped vulnerability coincided with rainfed farming dependence, land disturbance, and greater erosion sensitivity. This overlap is important because it identifies areas where land degradation and production risk may reinforce one another. Similar GIS–hydrologic frameworks have been shown to improve the identification of flood-prone and management-sensitive areas by connecting process-based simulation with explicit spatial exposure patterns [21].
These convergences suggest that priority areas should be differentiated by hazard type and watershed position. These patterns indicate that management priority is greatest where scenario-driven increases in runoff or soil erosion coincide with baseline zones of higher mapped vulnerability and concentrated agricultural or settlement exposure. The downstream zone requires stronger attention to runoff moderation, flood-risk reduction, and protection of exposed agricultural and settlement areas. The cultivated uplands require greater emphasis on reforestation, vegetation recovery, and soil-conservation measures because these areas combine slope-related sensitivity with agricultural disturbance and drought exposure. This interpretation is consistent with integrated watershed planning studies showing that land-use interventions are more effective when they are targeted to parts of the basin where environmental response and management need overlap most strongly [22]. The combined use of SWAT simulation and GIS-based vulnerability mapping provides a more spatially explicit basis for management prioritization in Abuan. The integrated interpretation should therefore be viewed as a relative spatial prioritization framework under the available data conditions, and its methodological limitations are discussed further in Section 4.4.
4.4 Study Limitations and Implications for Watershed Management
The findings of this study should be interpreted in light of several limitations. Formal model evaluation was based on observed streamflow, while erosion- and runoff-related information was used mainly to support parameter adjustment rather than independent validation. In addition, the streamflow record used for calibration and validation was derived from the Abuan–Pinacanauan system, which introduces uncertainty in representing the isolated hydrologic response of the Abuan Watershed. The GIS-based flood, drought, and soil-erosion assessments were also based on indicator rating and weighted overlay. The resulting vulnerability maps should therefore be interpreted as relative indices of spatial susceptibility and management sensitivity rather than as direct predictions of hazard occurrence or damage magnitude. The mapped patterns were interpreted in relation to known watershed conditions, but they were not independently validated against a separate historical event inventory, and no formal sensitivity analysis of indicator weighting was performed. These methods are useful for spatial prioritization, but they remain sensitive to the selected indicators, rating criteria, and weighting assumptions. The integration of SWAT outputs and hazard-vulnerability maps was based on comparative spatial interpretation rather than formal statistical coupling. For this reason, the results are more robust for identifying broad management-sensitive zones than for defining exact quantitative priority rankings. The findings that carry the greatest uncertainty are the exact magnitude of some calibrated hydrologic partitioning values and the strength of the inferred link between simulated hydrologic change and mapped vulnerability. These uncertainties could be reduced through additional watershed-specific discharge records, observed sediment data, and more detailed socio-economic and exposure datasets.
Despite these limitations, the study provides a useful basis for watershed management in Abuan. The integrated results consistently indicate that the downstream floodplain and the cultivated hilly to rolling areas require different forms of intervention. In practical terms, flood-risk reduction, runoff moderation, and protection of exposed agricultural and settlement areas should be prioritized in the lowlands. In cultivated uplands, greater emphasis should be placed on reforestation, vegetation recovery, and soil-conservation measures. The implementation of these measures should also consider socio-economic feasibility, including land-use constraints, agricultural dependence, local capacity for maintenance, and the availability of institutional support. In this sense, the study does not prescribe a fixed intervention ranking. Rather, it provides a spatially explicit basis for targeting watershed management actions and for guiding subsequent planning with more detailed biophysical and socio-economic evaluation.
This study showed that the Abuan Watershed is highly responsive to rainfall variability and that its hydrologic and spatial hazard conditions are not distributed uniformly across the basin. The SWAT simulations indicated that runoff is the dominant hydrologic pathway under baseline conditions and that wetter scenarios generally increased runoff and soil erosion more clearly than the tested land-use changes alone. Reforestation showed its most meaningful benefit through erosion reduction rather than large immediate changes in basin-scale runoff. In the present study, reforestation reduced soil erosion by as much as 1.16 t ha−1 yr−1, indicating a clearer erosion-control effect in cultivated and disturbed uplands than an immediate basin-scale runoff response. The GIS-based assessments further showed that flood vulnerability is concentrated in the downstream agricultural and settlement areas, whereas drought and soil-erosion vulnerability are more evident in cultivated and rainfed upland zones. These results identify two principal management priorities in the watershed which are flood-risk reduction and runoff moderation in the downstream lowlands, and vegetation recovery, reforestation, and soil-conservation measures in cultivated hilly and rolling terrain. The study shows that combining hydrologic simulation with GIS-based hazard mapping provides a more spatially explicit basis for watershed prioritization and intervention planning in the Abuan Watershed.
Acknowledgement: The authors acknowledge the assistance of the Department of Public Works and Highways, Department of Environment and Natural Resources—National Mapping and Resource Information Authority, and Department of Agriculture—Bureau of Soils and Water Management for technical support and access to data used in this study.
Funding Statement: This research was funded by the Department of Science and Technology–Philippine Council for Agriculture, Aquatic and Natural Resources Research and Development (DOST–PCAARRD).
Author Contributions: The authors confirm contribution to the paper as follows: conceptualization, methodology, software, validation, formal analysis, investigation, data curation, writing—original draft preparation, writing—review and editing, and visualization, Lanie A. Alejo; methodology, resources, project administration, and funding acquisition, Orlando F. Balderama; methodology, resources, project administration, and funding acquisition, Rex Victor O. Cruz. All authors reviewed and approved the final version of the manuscript.
Availability of Data and Materials: The authors confirm that the data supporting the findings of this study are available within the article and its Supplementary Materials.
Ethics Approval: Not applicable.
Conflicts of Interest: The authors declare no conflicts of interest.
Supplementary Materials: The supplementary material is available online at https://www.techscience.com/doi/10.32604/rig.2026.084091/s1. Figure S1: Aggregation framework used to derive the flood vulnerability map from sensitivity, exposure, and adaptive-capacity indicators through weighted raster calculation; Figure S2: Aggregation framework used to derive the drought vulnerability map from sensitivity, exposure, and adaptive-capacity indicators through weighted raster calculation; Figure S3: Aggregation framework used to derive the soil-erosion vulnerability map from sensitivity, exposure, and adaptive-capacity indicators through weighted raster calculation; Table S1: Flood vulnerability indicators and rating criteria; Table S2: Drought vulnerability indicators and rating criteria; Table S3: Soil erosion vulnerability indicators and rating criteria.
References
1. Kayitesi NM, Guzha AC, Mariethoz G. Impacts of land use land cover change and climate change on river hydro-morphology—a review of research studies in tropical regions. J Hydrol. 2022;615:128702. doi:10.1016/j.jhydrol.2022.128702. [Google Scholar] [CrossRef]
2. Teklay A, Dile YT, Asfaw DH, Bayabil HK, Sisay K. Impacts of climate and land use change on hydrological response in gumara watershed, Ethiopia. Ecohydrol Hydrobiol. 2021;21(2):315–32. doi:10.1016/j.ecohyd.2020.12.001. [Google Scholar] [CrossRef]
3. Avcıoğlu A, Vandromme R, Grangeon T, Minella JPG, Evrard O, Tassano M, et al. Hydrological responses to land use changes and precipitation variability in Southern Brazil. J Hydrol Reg Stud. 2025;61:102705. doi:10.1016/j.ejrh.2025.102705. [Google Scholar] [CrossRef]
4. Eekhout JPC, de Vente J. Global impact of climate change on soil erosion and potential for adaptation through soil conservation. Earth Sci Rev. 2022;226:103921. doi:10.1016/j.earscirev.2022.103921. [Google Scholar] [CrossRef]
5. Dash SS, Maity R. Effect of climate change on soil erosion indicates a dominance of rainfall over LULC changes. J Hydrol Reg Stud. 2023;47:101373. doi:10.1016/j.ejrh.2023.101373. [Google Scholar] [CrossRef]
6. Kross A, Kaur G, Jaeger JAG. A geospatial framework for the assessment and monitoring of environmental impacts of agriculture. Environ Impact Assess Rev. 2022;97:106851. doi:10.1016/j.eiar.2022.106851. [Google Scholar] [CrossRef]
7. Layati E, Elkbichi O, Choukri B, El Ghachi M. Detection, analysis, and mapping of potential groundwater areas in the oued lakhdar watershed (Moroccousing GIS and AHP techniques. Rev Int De Géomatique. 2025;34(1):277–300. doi:10.32604/rig.2025.063846. [Google Scholar] [CrossRef]
8. Gacul LA, Ferrancullo D, Gallano R, Fadriquela KJ, Mendez KJ, Morada JR, et al. GIS-based identification of flood risk zone in a rural municipality using fuzzy analytical hierarchy process (FAHP). Rev Int De Géomatique. 2024;33(1):295–320. doi:10.32604/rig.2024.055085. [Google Scholar] [CrossRef]
9. Habib M, Habib A, Abboud M. Multi-aspect critical assessment of applying digital elevation models in environmental hazard mapping. Rev Int De Géomatique. 2024;33(1):247–71. doi:10.32604/rig.2024.053857. [Google Scholar] [CrossRef]
10. Musikhin I. Spatial analysis tool for urban environmental quality assessment: leveraging geoinformatics and GIS. Rev Int De Géomatique. 2025;34(1):939–57. doi:10.32604/rig.2025.071168. [Google Scholar] [CrossRef]
11. Arnold JG, Moriasi DN, Gassman PW, Abbaspour KC, White MJ, Srinivasan R, et al. SWAT: model use, calibration, and validation. Trans ASABE. 2012;55(4):1491–508. [Google Scholar]
12. Gassman PW, Reyes MR, Green CH, Arnold JG. The soil and water assessment tool: historical development, applications, and future research directions. Trans ASABE. 2007;50(4):1211–50. doi:10.13031/2013.23637. [Google Scholar] [CrossRef]
13. Arceo MGAS, Cruz RVO, Tiburan CL Jr, Balatibat JB, Alibuyog NR. Modeling the hydrologic responses to land cover and climate changes of selected watersheds in the Philippines using soil and water assessment tool (SWAT) model. DLSU Bus Econ Rev. 2018;28:84–101. doi:10.59588/2243-786x.1554. [Google Scholar] [CrossRef]
14. Alejo LA, Ella VB. Assessing the impacts of climate change on dependable flow and potential irrigable area using the SWAT model. The case of Maasin River watershed in Laguna, Philippines. J Agric Eng. 2019;50(2):88–98. doi:10.4081/jae.2018.941. [Google Scholar] [CrossRef]
15. Cabrera JS, Lee HS. Flood-prone area assessment using GIS-based multi-criteria analysis: a case study in Davao oriental, Philippines. Water. 2019;11(11):2203. doi:10.3390/w11112203. [Google Scholar] [CrossRef]
16. Felipe AJB, Alejo LA, Balderama OF, Rosete EA. Climate change intensifies the drought vulnerability of river basins: a case of the Magat River Basin. J Water Clim Change. 2023;14(3):1012–38. doi:10.2166/wcc.2023.005. [Google Scholar] [CrossRef]
17. Dapin IG, Ella VB. GIS-based soil erosion risk assessment in the watersheds of Bukidnon, Philippines using the RUSLE model. Sustainability. 2023;15(4):3325. doi:10.3390/su15043325. [Google Scholar] [CrossRef]
18. Tehrany MS, Shabani F, Javier DN, Kumar L. Soil erosion susceptibility mapping for current and 2100 climate conditions using evidential belief function and frequency ratio. Geomat Nat Hazards Risk. 2017;8(2):1695–714. doi:10.1080/19475705.2017.1384406. [Google Scholar] [CrossRef]
19. Mensah JK, Ofosu EA, Yidana SM, Akpoti K, Kabo-bah AT. Integrated modeling of hydrological processes and groundwater recharge based on land use land cover, and climate changes: a systematic review. Environ Adv. 2022;8:100224. doi:10.1016/j.envadv.2022.100224. [Google Scholar] [CrossRef]
20. Li H, Zhang S, Zhang J, Zhang W, Song Z, Yu P, et al. A framework for identifying priority areas through integrated eco-environmental risk assessment for a holistic watershed management approach. Ecol Indic. 2023;146:109919. doi:10.1016/j.ecolind.2023.109919. [Google Scholar] [CrossRef]
21. Tsegaye S, Kebedew MG, Albrecht KK, Missimer TM, Thomas S, Elshall AS. Integrated GIS-hydrologic-hydraulic modeling to assess combined flood drivers in coastal regions: a case study of Bonita Bay, Florida. Front Water. 2024;6:1468354. doi:10.3389/frwa.2024.1468354. [Google Scholar] [CrossRef]
22. Rajaei F, Dahmardeh Behrooz R, Ahmadisharaf E, Galalizadeh S, Dudic B, Spalevic V, et al. Application of integrated watershed management measures to minimize the land use change impacts. Water. 2021;13(15):2039. doi:10.3390/w13152039. [Google Scholar] [CrossRef]
23. Breinl K, Lun D, Müller-Thomy H, Blöschl G. Understanding the relationship between rainfall and flood probabilities through combined intensity-duration-frequency analysis. J Hydrol. 2021;602:126759. doi:10.1016/j.jhydrol.2021.126759. [Google Scholar] [CrossRef]
24. Araza A, Perez M, Cruz RV, Aggabao LF, Soyosa E. Probable streamflow changes and its associated risk to the water resources of Abuan watershed, Philippines caused by climate change and land use changes. Stoch Environ Res Risk Assess. 2021;35(2):389–404. doi:10.1007/s00477-020-01953-3. [Google Scholar] [CrossRef]
25. Bruijnzeel LA, Peña-Arancibia JL, Sheil D, Ziegler AD, Zhang J, Zwartendijk BW, et al. Potential for improved groundwater recharge and dry-season flows through forest landscape restoration on degraded lands in the tropics. For Ecosyst. 2025;14:100376. doi:10.1016/j.fecs.2025.100376. [Google Scholar] [CrossRef]
26. Liu W, Xu Z, Wei X, Li Q, Fan H, Duan H, et al. Assessing hydrological responses to reforestation and fruit tree planting in a sub-tropical forested watershed using a combined research approach. J Hydrol. 2020;590:125480. doi:10.1016/j.jhydrol.2020.125480. [Google Scholar] [CrossRef]
27. Yang R, Yang S, Chen LL, Yang Z, Xu L, Zhang X, et al. Effect of vegetation restoration on soil erosion control and soil carbon and nitrogen dynamics: a meta-analysis. Soil Tillage Res. 2023;230:105705. doi:10.1016/j.still.2023.105705. [Google Scholar] [CrossRef]
Cite This Article
 Copyright © 2026 The Author(s). Published by Tech Science Press.
This work is licensed under a Creative Commons Attribution 4.0 International License , which permits unrestricted use, distribution, and reproduction in any medium, provided the original work is properly cited.
 Downloads
 Citation Tools
