
 Submit a Paper
 Propose a Special lssue
 Open Access
ARTICLE

Are the two polymorphic sites of anti-Marek’s disease in White Leghorn chickens also suitable for Partridge Shank chickens?
1 Animal Genetic Engineering Laboratory, College of Life Science, Henan Agricultural University, Zhengzhou, 450002, China
2 Shennong Laboratory, Zhengzhou, 450002, China
3 Institute of Animal Husbandry and Veterinary Sciences, Henan Academy of Agricultural Sciences, Zhengzhou, 450002, China
* Corresponding Author: Guozhi Zhang,
BIOCELL 2023, 47(5), 1127-1134. https://doi.org/10.32604/biocell.2023.027863
Received 11 November 2022; Accepted 07 February 2023; Issue published 10 April 2023
 View Full Text
 Download PDF
Abstract
Background: The selection of Marek’s disease (MD)-resistant breeds in Partridge Shank chicken, a popular local chicken breed in Henan Province of China, has practical value. We hypothesized that the two polymorphic sites (rs14527240 located in SMOC1 and GGaluGA156129 located in PTPN3) related to MD resistance in White Leghorn chickens are also applicable to Partridge Shank chickens. Methods: In this experiment, we screened 10 live hens and 2 live roosters with the double GG genotype by genotyping the two sites from 6500 Partridge Shank chickens. Nineteen one-day-old chicks with the double GG genotype were obtained by artificial insemination. Seventy-two one-day-old chickens (19 from the population expansion test and 53 randomly selected from chicken farms) were injected with 2000 plaque-forming units of the Md5 virus strain. After 100 days of infection, all chickens were examined by pathological anatomical examination, histological sectioning, genotyping, and a quantitative polymerase chain reaction of SMOC1 and PTPN3. Results: There was only one site (rs14527240 located in SMOC1) associated with MD in Partridge Shank chickens (p < 0.05), but the GG genotype of SMOC1 in Partridge Shank chickens indicated susceptibility to MD. SMOC1 expression in MD-susceptible chickens was also significantly higher than that in MDresistant chickens (p < 0.05). Conclusion: Therefore, the MD resistance sites selected from White Leghorn chickens were not completely suitable for Partridge Shank chickens, but they can be used as a reference. This study indicated that SMOC1 plays an important role in screening for MD resistance in poultry.Keywords
Marek’s disease (MD) is an infectious disease caused by Marek’s disease virus (MDV), an oncogenic avian herpesvirus. This disease is characterized by lymphomas and high mortality in susceptible chickens (McPherson et al., 2018). Worldwide, MD causes serious economic losses in the poultry industry every year. Although the use of vaccines can prevent and control epidemics to some extent, they cannot eradicate and reduce the spread of MDV.
To improve the disease resistance of poultry, genes related to MD resistance need to be found and breeding for disease resistance be carried out. Currently, in most studies of MD resistance in poultry, White Leghorns are used as the research object (Luo et al., 2013; Bai et al., 2020). However, there are only a few reports about MD resistance breeding in Partridge Shank chickens, an important local chicken breed in China. Partridge Shank chickens are a kind of meat-type breed with stable performance and strong disease resistance (Zhao et al., 2019). These chickens are characterized by green feet and hemp feathers. In Henan Province, Partridge Shank chickens account for a considerable share of the free-range chickens.
Through a genome-wide association study (GWAS), two SNPs (single nucleotide polymorphisms) were found to be associated with White Leghorn resistance to MD (Li et al., 2013). These SNPs are rs14527240 located in intron 7 of SPARC-related modular calcium-binding 1(SMOC1) and GGaluGA156129 located on intron 22 of protein tyrosine phosphatase, nonreceptor type 3 (PTPN3) (Li et al., 2013). We hypothesize that these two sites are also resistance sites for MD in Partridge Shank chickens, and allele G of SMOC1 and PTPN3 might contribute to resistance to MD. Therefore, the aim of this study was to determine whether the two SNP sites with MD resistance in White Leghorn chickens have the same function in Partridge Shank chickens.
Seventy-day-old Partridge Shank chickens (n = 6500) were selected from Wugang Farm in Henan Province, China. A one-milliliter blood sample per chicken was collected from the underwing vein by the negative pressure method, and the chicken was placed on the leg ring to prepare for the screening process.
The extraction of genomic DNA from blood samples was carried out according to the protocol of the Animal Tissue/Cell/Blood Genomic DNA extraction kit (Dingguo Biology Company, China, No. NEP062). The DNA quality and concentration were detected on a NanoDrop 2000 UV-Vis spectrometer. Chicken genotypes related to the two SNP sites (Sr represents rs14527240 and Pr represents GGaluGA156129) were identified by polymerase chain reaction-restriction fragment link polymorphism (PCR-RELP). The forward and reverse primers for Sr were 5′-TACTTCTATGTCTACGGGTCA-3′ and 5′-AGGGCAGTGAAAGGTGA-3′. The forward and reverse primers for Pr were 5′-CAAGCAAAGCAATCCCTAC-3′ and 5′-TTACATGGCAATGGCAGA-3′ (Li et al., 2013). With blood genomic DNA as a template (Clark et al., 2020), we expected to amplify 451 bp and 607 bp fragments, respectively, of Sr and Pr. According to the protocol of 2 × Power Taq PCR MasterMix (Tiangen Company, China, No. KT201), the PCR procedure was as follows: 94°C, 5 min; 94°C, 20 s, 60°C, 20 s, 72°C, 30 s, 36 cycles; 72°C, 10 min. Then, the PCR product was digested with Rsa1 (sites on Sr) (NEB Company, China, No. R0167V ) or Bsm1 (sites on Pr) (NEB Company, China, No. R0134V ) restriction enzyme. In detail, 1 μL of the premixed solution was added to 10 μL of PCR liquid. The premixed solution of Rsa1 included 0.25 μL of restriction endonuclease, 0.1 μL of bovine serum albumin, and 1 μL of buffer C. The reaction conditions were a 37°C water bath for 4 h. The premixed solution of Bsm1 was 0.3 μL of restriction endonuclease and 1 μL of Cutsmart buffer. The reaction was performed in a 65°C water bath for 4 h. RFLP products were analyzed on 1.5% agarose gels stained with ethidium bromide.
Double GG mutant genotype chicken to expand the breeding population
After a comparison of the leg ring number with the corresponding blood genotyping, chickens with double GG mutant genes were selected. By artificial insemination, the chicken population was expanded for the Md5 infection test. The hatchability was recorded.
Md5 infection, pathological anatomy, and genotyping
One-day-old Partridge Shank chicks were injected with the Md5 virus strain. The Md5 strain of MDV was donated by the Key Laboratory of Animal Immunology, Henan Academy of Agricultural Sciences. All experimental chickens were intraperitoneally injected with Md5-containing viral fluid at a dose of 2000 PFUs/0.1 mL per bird. In the positive pressure isolation room with a filter air device, chicks were reared in individual cages with free access to food and water. After the experiment was over, the chicken manure and feathers were collected for incineration treatment.
The infection experiment lasted 100 days. The vaccination procedure for chickens during the experiment is shown in Suppl. Table S1. The growth state of the experimental chickens was observed every day. On the 100th day, the chickens were exsanguinated. Spleen tissues of all experimental chickens were collected and stored in liquid nitrogen for gene expression and genotyping. The genotype was still detected by PCR-RFLP as described above. The association between genotype and incidence of MD was analyzed by using the cross-table program in SPSS2.1 descriptive statistic. The liver and heart tissues were collected to make pathological sections.
The heart and liver tissues of chickens with and without obvious pathological changes were fixed in 10% neutral buffered formalin, routinely embedded in paraffin, cut into 5 μm thick sections, and processed for hematoxylin and eosin staining. Sections of the heart and liver of the chickens were microscopically examined.
The genomic DNA of the spleen was extracted using an Animal Tissue/cell/blood Genomic DNA extraction kit (Dingguo Biology Company, China, No. NEP062). The forward and reverse primers of meq were 5′-ATGTCTCAGGAGCCAGAG-3′ and 5′-TCAGGGTCTCCCGTCACC-3′, respectively (Yu et al., 2014). A 1020 bp specific fragment of the meq gene could be amplified using this specific primer pair. The PCR system was 20 μL, including 10 μL of 2 × Power Taq PCR MasterMix, 0.4 μL of forward primer, 0.4 μL of reverse primer, 8.8 μL of ddH2O, and 0.4 μL of DNA template. The PCR program was 94°C for 5 min, 36 cycles of 94°C for 20 s, 60°C for 20 s, and 72°C for 30 s, and one cycle of 72°C for 10 min. The PCR product was detected by 1% agarose gel electrophoresis. Whether the electrophoretic bands appeared was used to determine the infection rate of Md5 (Lian et al., 2018).
RT-qPCR detection of SMOC1 and PTPN3 genes
Md5-infected chickens were divided into two groups according to typical symptoms: the case group (with typical MD symptoms) and the control group (without typical MD symptoms). The relative expression of SMOC1 and PTPN3 mRNA in the chicken spleen was detected by RT-qPCR. The total RNA of the spleen was extracted using a TRIzol® Plus RNA Purification Kit (Invitrogen, Grand Island, NY, USA). The concentration and qualities of RNA were measured by a NanoDrop One Spectrophotometer. First-strand cDNA was synthesized according to the protocol of the FastKing RT Kit (with gDNase). The reverse transcription reaction system included 2 μL of 10 × King RT buffer, 1 μL of FastKing RT enzyme mix, 2 μL of FQ-RT primer mix, and 5 μL of RNase-free ddH2O. The primer sequences of β-actin, SMOC1, and PTPN3 are shown in Suppl. Table S2. Quantitative PCR (qPCR) was performed according to the product specifications of SuperReal PreMix Plus (SYBR Green). The PCR program was 95°C for 90 s and 40 cycles of 95°C for 10 s, 60°C for 20 s, and 72°C for 20 s. For confirmation of the specificity of the PCR, melting curves were examined. The relative expression level of each gene was calculated according to the 2−ΔΔCt method, with β-actin as an internal control for data normalization.
Statistical data were analyzed using SPSS 21.0. The link between the genotype and onset of MD was detected by Pearson correlation analysis using cross-tables in descriptive statistics. The relative expression level of the gene was analyzed by Student’s t-test. The data are expressed as the means ± SD (SDM). A p value < 0.05 indicated significant differences.
Determination of allelic frequencies
Blood samples were collected from 6500 Partridge Shank chickens, and the genotype of the SNP site was determined by PCR-RELP. The results of Sr and Pr genotyping in all experimental chickens are shown in Fig. 1. The GG type of Sr had the lowest abundance (1.93%), while the AA type of Sr had the highest abundance (71.78%). The GG type of Pr was found in 28.03% of the samples, and the hybrid type of GA showed the greatest percentage, up to 59.51%. The homozygous individuals with double GG type accounted for 0.246% of the total sample size. Specifically, there were only 16 chickens: 13 hens and 3 roosters.
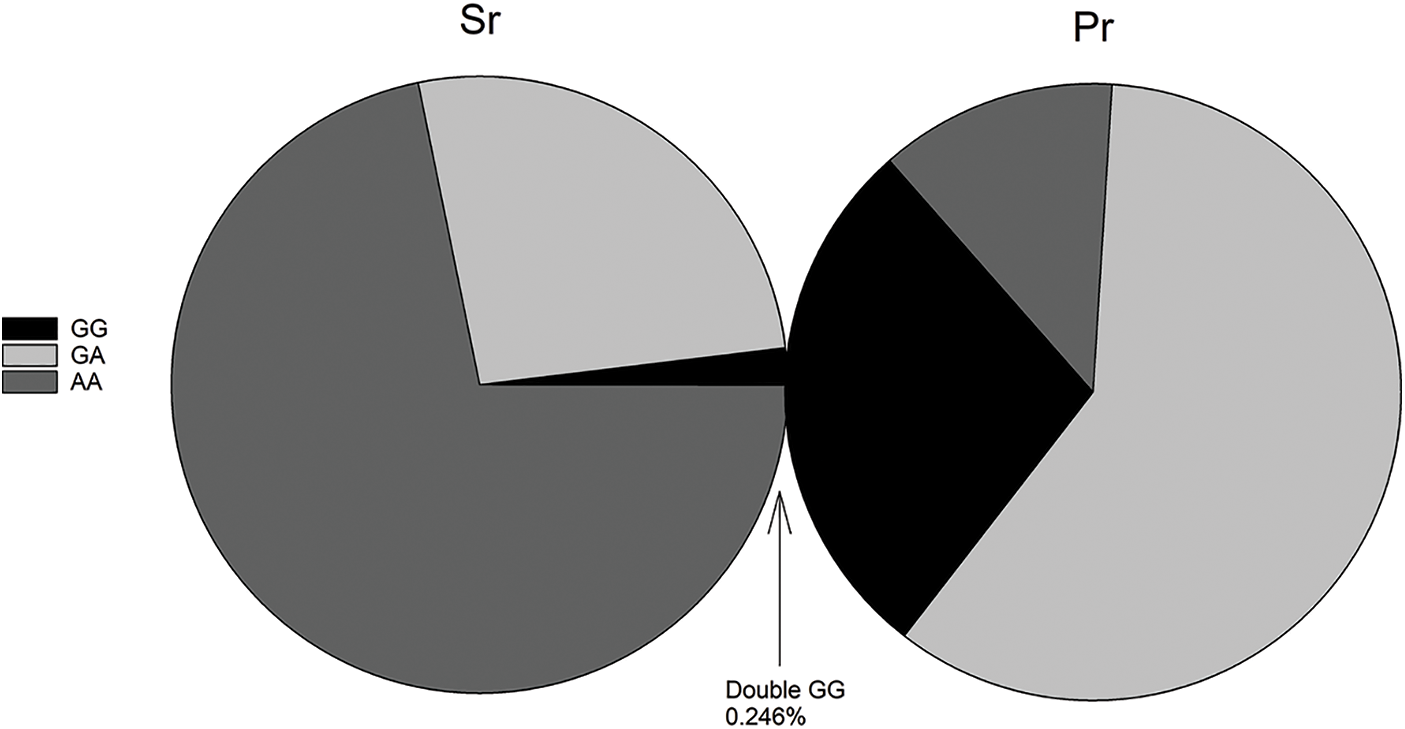
Figure 1: Percentage of different genotypes of Sr and Pr single nucleotide polymorphisms. Sr and Pr genotypes were detected in 6500 Partridge Shank chickens. The GG, GA, and AA genotypes of Sr were 1.93%, 26.29%, and 71.78%, respectively. The GG, GA, and AA genotypes of Pr were 28.03%, 59.51%, and 12.46%, respectively. The double GG type accounted for 0.246%.
Expanding the population of double GG genotype chickens
After genotype identification, 10 living hens and 2 living roosters with the double GG genotype were selected to expand the population by artificial insemination. A total of 60 breeding eggs were collected, and 19 chicks were produced. The hatching rate was 31.7%. These 19 chicks were used for subsequent infection with the Md5 strain.
Clinical symptoms and pathological anatomy
Md5 virus strain was injected in 72 one-day-old Partridge Shank chicks, of which 19 were from the expanding population and 53 were randomly selected from the chicken farm. In addition to obvious emaciation, the chickens had the clinical symptoms of lethargy, soft feet, discharge of green feces, and erect feathers. On the 100th day of the experiment, all the experimental chickens were slaughtered and dissected. Chickens with obvious clinical symptoms and pathological changes of MD were selected as the case group, and the other chickens were selected as the control group. The anatomical changes in the pathological and control chickens are shown in Fig. 2. The liver of the pathological chickens was highly enlarged, and covered the entire abdominal cavity in contrast to that of the control chickens (Fig. 2A). The liver was gray-red and firm, with large areas of gray-white needle-like or millet-like nodules (Fig. 2B). The heart was surrounded by cellulose, and the shape was irregular (Fig. 2C). There were hard gray-white nodules at the apex and wall of the heart. The spleen tissue was enlarged to some extent, approximately 3–4 times the normal size (Fig. 2D). On the surface, there were gray-white tumor nodules the size of corn grains and on the cut surface, diffuse gray‒white tumor foci were observed. No obvious anatomical changes were observed in the healthy chickens (Figs. 2E and 2F). According to the clinical symptoms of MD, the chickens were categorized into a control group and a case group.
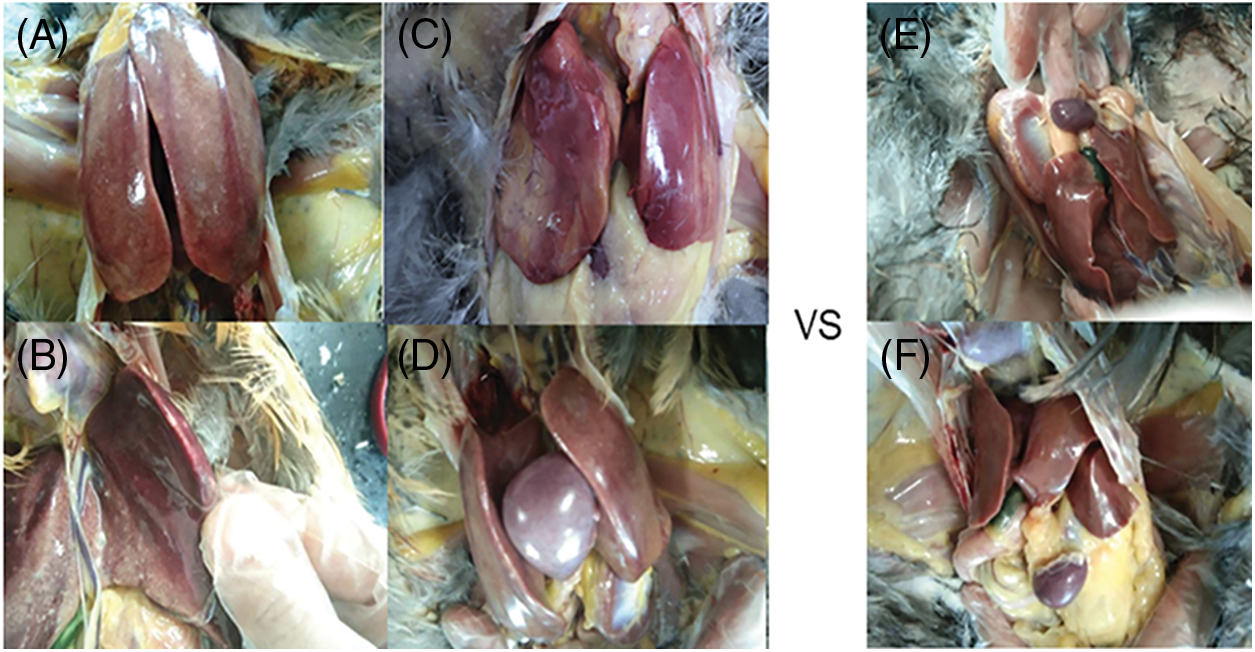
Figure 2: Comparison of pathological anatomy of pathological chickens and healthy chickens. (A–D) pathological tissues of chickens. (E and F) normal liver and spleen tissues of chickens. The liver is highly enlarged and fills the abdominal cavity (A). There are hard and white nodules on the liver surface (B). The heart is completely surrounded by fibrin (C). The spleen is enlarged and approximately three times its normal size (D).
The tumor tissue and normal tissue showed marked differences under a microscope. Most of the tumor tissue was made up of large and nuclear-shaped lymphocytes. A cell can have more than one nucleus, and overall, it shows pleomorphism, a disordered arrangement, and loss of normal cell arrangement. The liver cells were denatured with substantial lymphoid cell infiltration (Fig. 3B) compared with those in Fig. 3A. The histological structure of the diseased myocardium was disordered (Fig. 3D) compared with that in Fig. 3C.
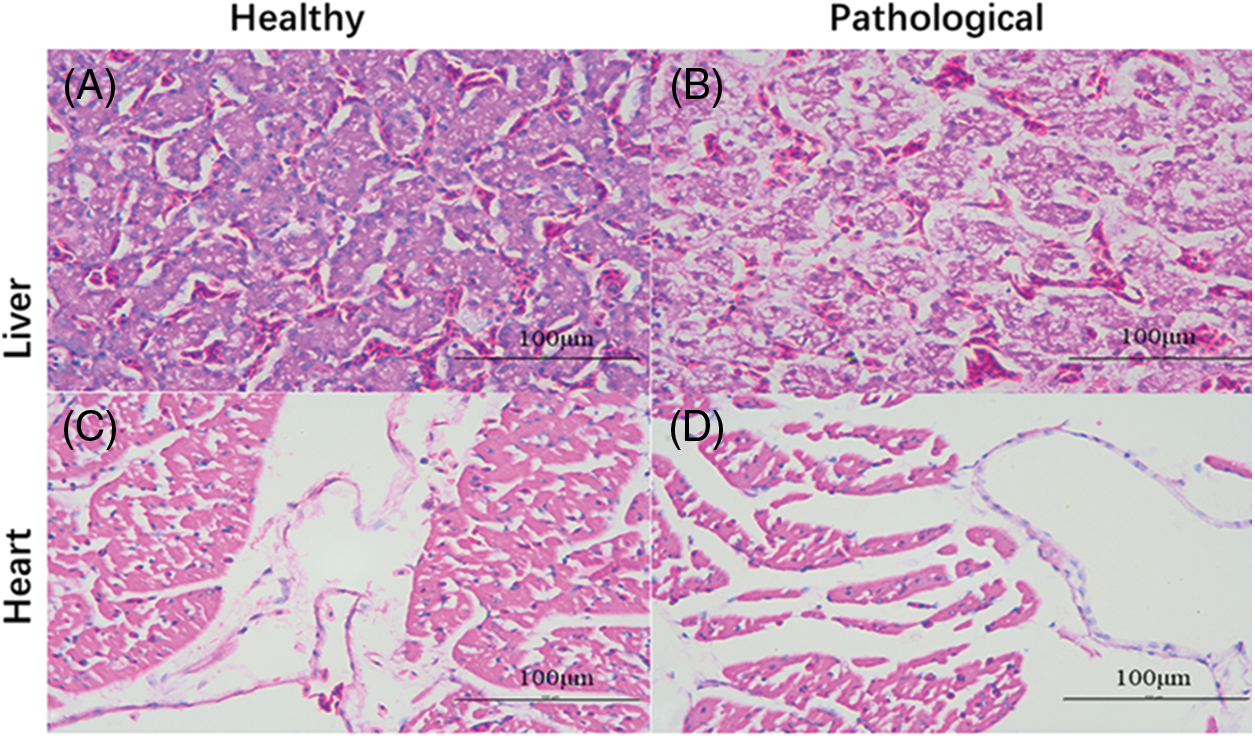
Figure 3: Histopathological section of chicken (H&E staining, 40 × 10). (A and C) Normal liver and heart tissues of chickens. (B and D) Pathological liver and heart tissues of chickens. In contrast to the normal tissue in (A), the hepatocytes in (B) are denatured and heavily infiltrated with lymphoid cells. The structure of the myocardium in (D) is disordered compared with that in (C).
Rates of infection, mortality, and tumorigenicity
The genomic DNA of the chicken spleen was extracted, and a 1020 bp specific fragment of meq was amplified by PCR (Fig. 4). The results showed that all the chickens were successfully infected with MDV, with an infection rate of 100%. As the DNA was used to amplify meq with the same volume of DNA and not the same concentration, the amplified bands of meq only indicated the presence or absence of the gene, not copy numbers of meq. During the whole 100-day infection period, no deaths occurred. On the 100th day, a total of 27 chickens with tumors were found through pathological anatomical examination. The incidence of tumors was 37.5%.
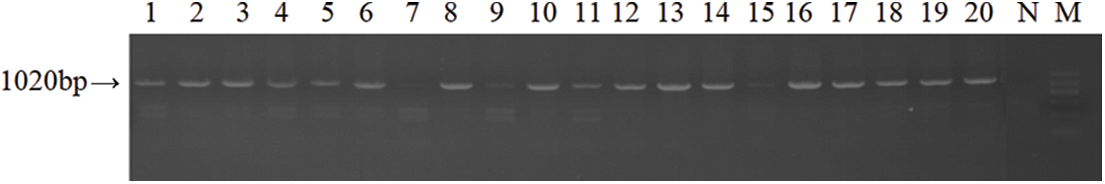
Figure 4: Detection of the meq gene. Lanes 1–20 represent meq bands, which were amplified from the spleen tissue DNA of infected chickens. The N lane is the negative control, in which meq was amplified from the spleen tissue DNA of uninfected chickens. Lane M represents the DNA molecular weight standard.
Correlation between genotype and tumorigenesis in Marek’s disease-infected chickens
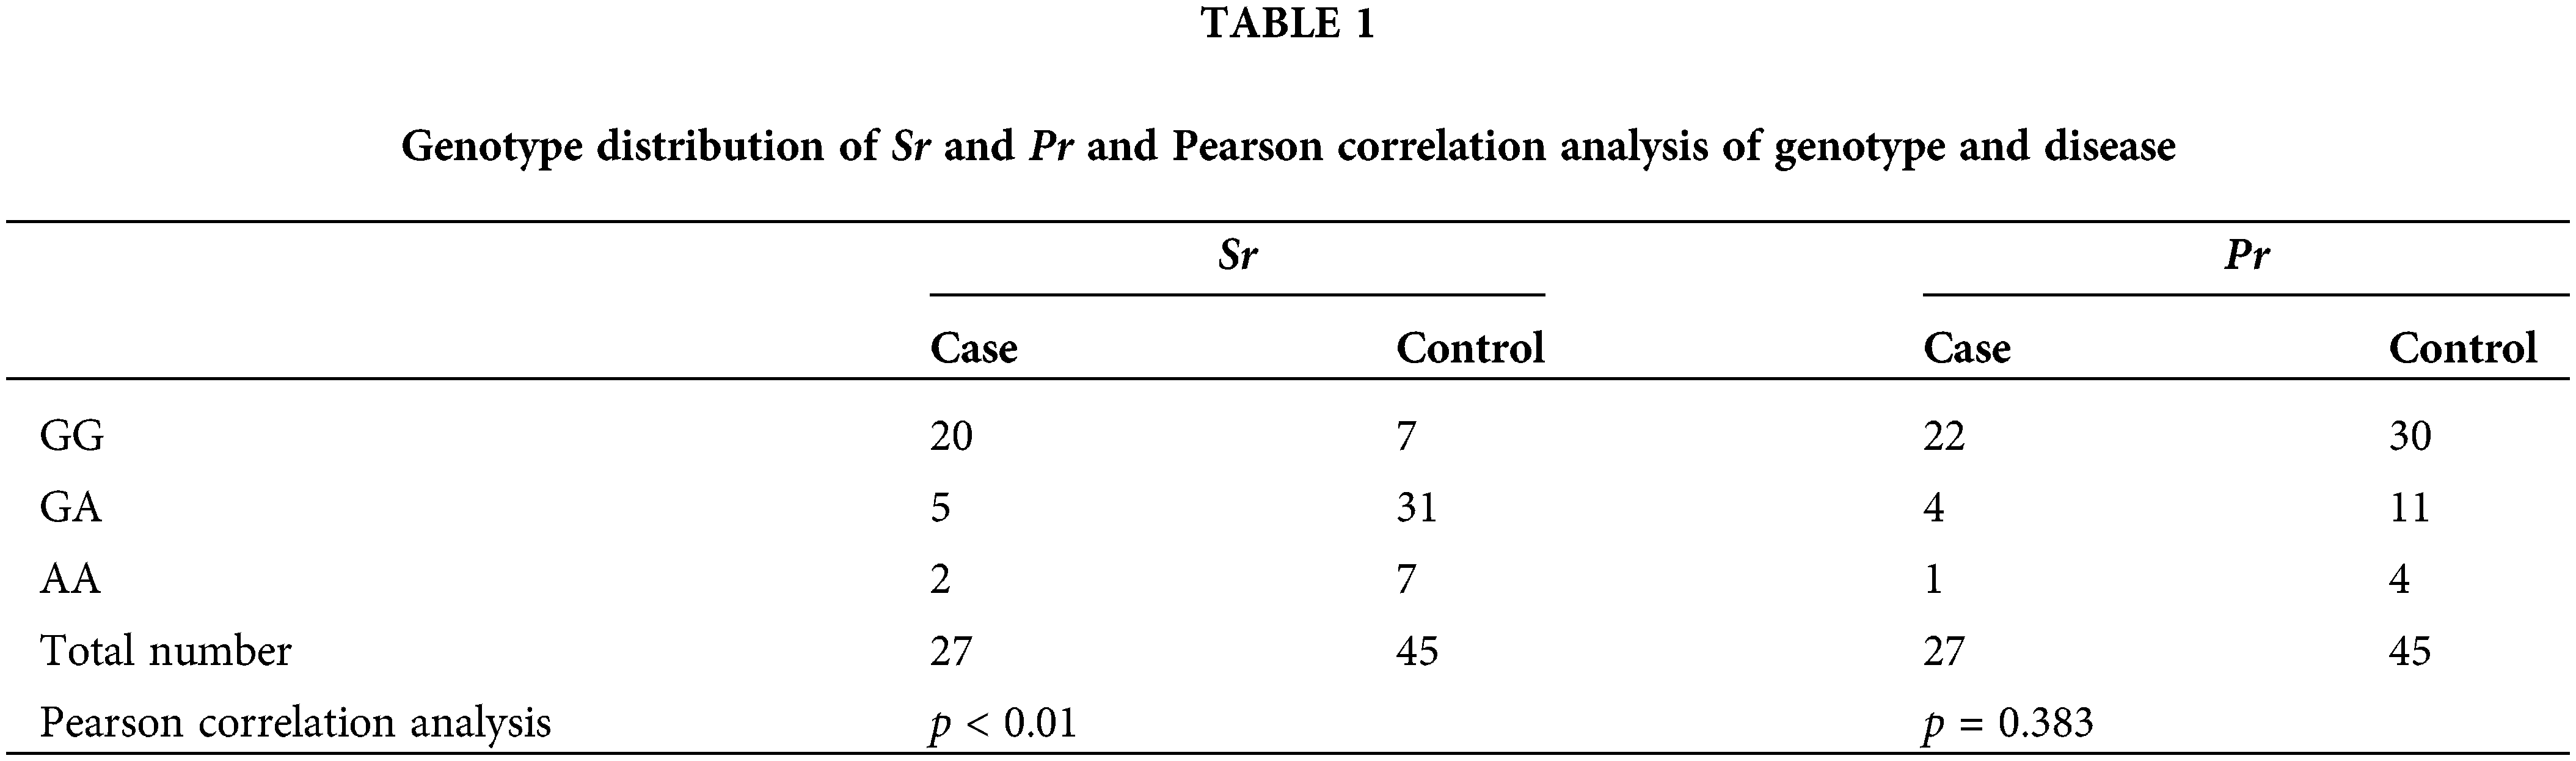
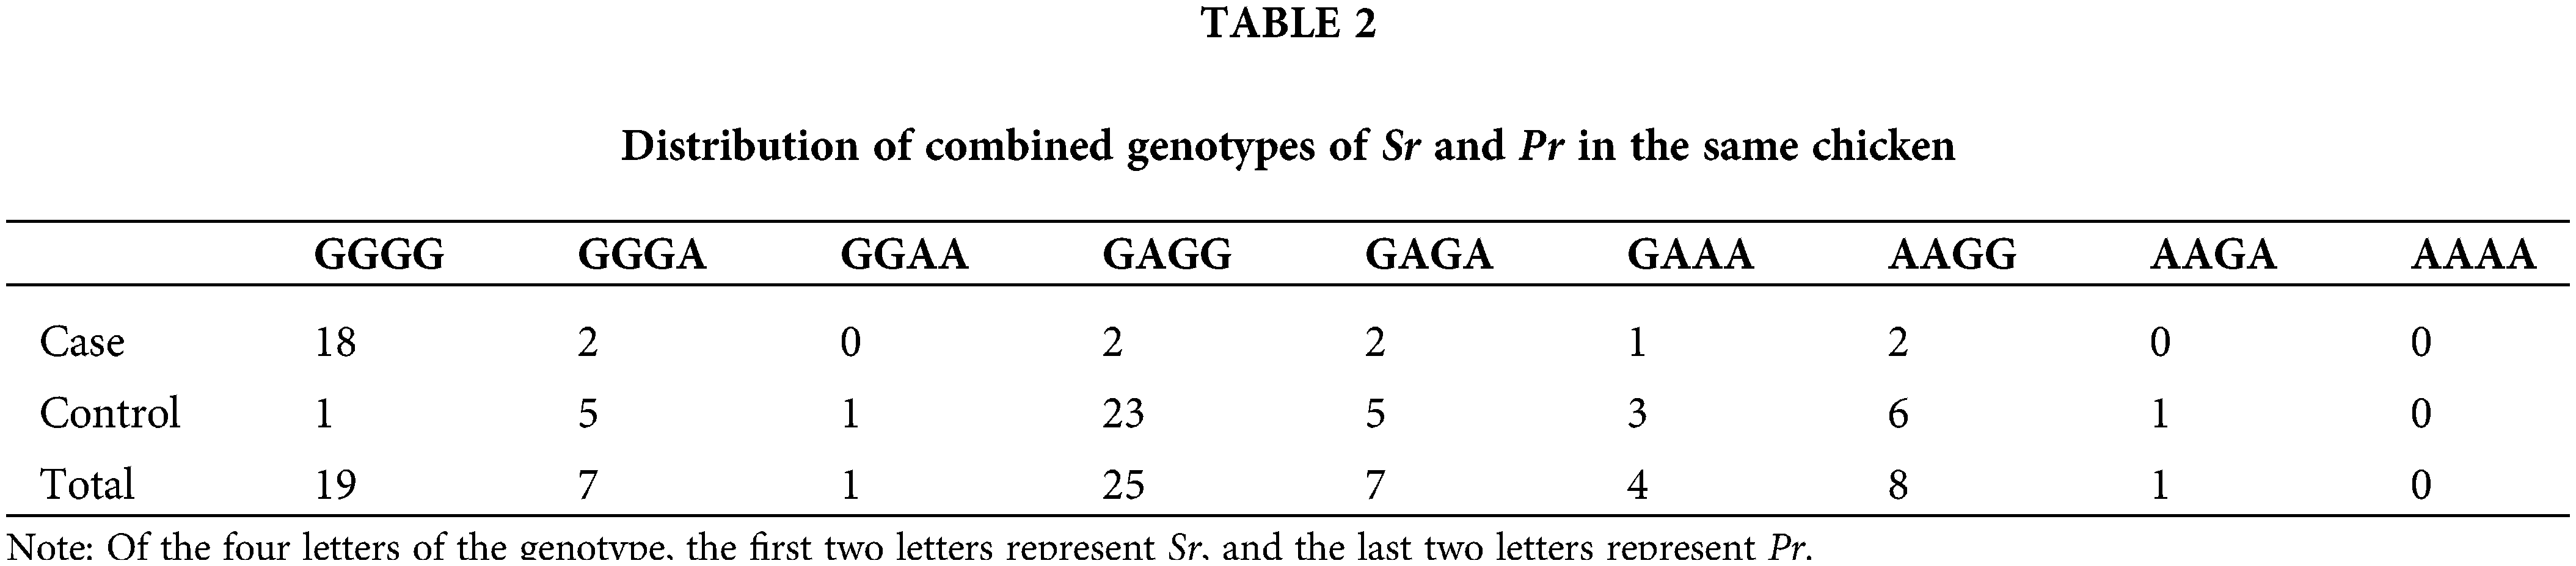
The genotypes of Sr and Pr of 72 chickens were identified by the PCR-RELP method (see Suppl. Fig. S1). Among 72 chickens, 27 were tumor-bearing (case group) and 45 were normal chickens (control group). Pearson correlation analysis was conducted between the genotypes of Sr and Pr and resistance to MD in Partridge Shank chicks. The results (Table 1) showed that the genotype of Sr was significantly correlated with the susceptibility (or resistance) to MD (p < 0.01), and the genotype of Pr had no significant correlation with MD susceptibility (or resistance) (p > 0.05). Statistical analysis revealed that the GA and AA genotypes of Sr were associated with resistance and the GG genotype of Sr was associated with susceptibility to MD. The genotype of Pr appeared to have no association with resistance to MD. The combined distribution of genotypes of Sr and Pr in 72 chickens is shown in Table 2. Nineteen chickens had a double GG genotype, and most of them were sick. The double AA genotype was absent in all 72 chickens.
Changes in SMOCI and PTPN3 expression in the spleen
Fluorescence qPCR was used to detect the differences in the expression of PTPN3 and SMOC1 in the control group and the case group to analyze the relationship between their expression patterns and MD resistance. Five samples each were selected from the control group and the case group. The genotypes of the two loci in each sample are shown in Suppl. Table S3. Compared with the control group, the expression of SMOC1 in the case group was significantly increased (p = 0.014 < 0.05) (Fig. 5). There was no significant difference in PTPN3 expression between the two groups (p = 0.74).
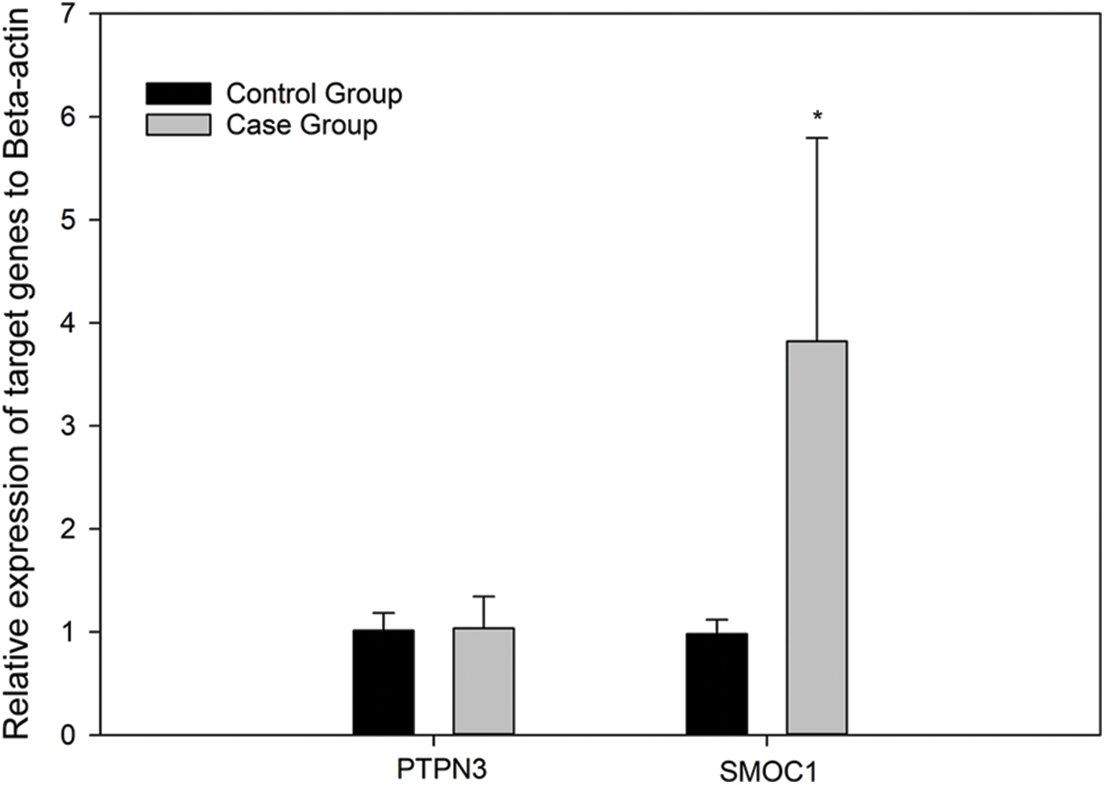
Figure 5: Relative expression of PTPN3 and SMOC1 in spleen tissues of the control group (n = 5) and the case group (n = 5) after Marek’s disease virus infection. The β-actin gene was chosen as an internal control to normalize the data. The relative expression level of each gene was calculated according to the 2−ΔΔCt method. Error bars represent the standard deviation of the means. * represents p < 0.05. There was no significant difference in PTPN3 expression between the two groups. The expression of SMOC1 in the case group was significantly higher than that in the control group.
GWASs are often used in animal breeding, but they are very costly. In breeding for disease-resistance, does the selection of disease-resistance genotypes from different varieties of the same species have some reference value for other varieties? According to Li’s study through GWAS, allele G of Sr (rs14527240) and Pr (GGaluGA156129) contribute to resistance to MD in White Leghorn chickens (Li et al., 2013). We hypothesized that these two highly correlated disease-resistance loci in White Leghorn chickens might also play a role in Partridge Shank chickens. We performed genotyping on 6,500 Partridge Shank chickens, and only 12 live chickens with the double GG genotype were obtained. Furthermore, the experimental chicken population was expanded through artificial insemination, and one-day-old chickens were used in the infection test. The goal was twofold: to increase the number of experimental animals with the double GG genotype and to reduce antibody interference in adult chickens. According to the farm immunization program, all the previous one-day-old chickens on the farm had been vaccinated against MD.
Clinical signs of MD include bursal/thymic atrophy, neurologic disorders, and T-cell lymphomas (Heidari et al., 2020). In this study, one-day-old nonvaccinated chickens were challenged with the vvMDV strain, and a typical model of visceral tumors was established. We also observed multiple organ enlargement and emaciation in the chickens. The expression of the meq gene was detected in the spleen of all experimental chickens, thus, the infection rate of this experiment was 100%. In contrast to 40% mortality and 60% tumorigenesis in MDV-infected Leghorn chickens (Zhou et al., 2018), no lethality was noted in this experiment, and the rate of tumorigenicity was low. This finding may be related to the fact that the one-day-old chicks contained maternal antibodies to resist the attack of some viruses; in addition, the experimental chicken is a native chicken of Henan Province in China. The difference between the two breeds may be one of the reasons for the low mortality and tumorigenicity.
In contrast to two SNP sites (Sr and Pr) related to MD resistance in White Leghorn chickens (Li et al., 2013), only the Sr site was associated with MD resistance in Partridge Shank chickens, and not the Pr site. In addition, the double GG genotype of the Sr site in Partridge Shank chickens was related to susceptibility to MD, which was contrary to the conclusion that allele G of the Sr site contributes to MD resistance in White Leghorn chickens. According to the observation of feeding status, chickens with a homozygous GG mutant of Sr were weaker. This phenomenon may be the reason that individuals with the homozygous GG genotype after MDV infection were more prone to tumorigenicity. Furthermore, in the genotyping of large samples (n = 6500), we found that chickens with the GG genotype of Sr accounted for only 1.93%, and those with the GG genotype of both Sr and Pr accounted for only 0.246% of cases. This finding may be because individuals with the GG genotype of Sr are less adaptive and are eliminated by natural selection. There was no significant association between the different genotypes of Pr and resistance to MD. This result was probably due to the small sample size of the chicken (n = 72) that we used in the infection test. However, the selection of the MD-resistant genotype in White Leghorn chickens is not completely suitable for Partridge Shank chickens.
Both SMOC1 and PTPN3 were implicated in tumorigenesis. SMOC1 was found to be related to tumor diseases, such as colorectal tumorigenesis (Suzuki et al., 2019), brain tumors (Brellier et al., 2011), and glioma (Zhang et al., 2019). In this study, SMOC1 was upregulated in the susceptible chickens, which was in agreement with Li et al. (2013). These results suggest that SMOC1 plays an important role in MD tumorigenesis. Many cancer studies found that PTPN3 acts as a tumor suppressor (Yuan et al., 2019; Peng et al., 2020). There was no significant difference in PTPN3 expression in the case group and the control group. We speculated that there might be no direct relationship between the expression of PTPN3 and MDV-induced tumor formation.
Our findings indicated that the MD resistance sites selected from White Leghorn chickens were not completely suitable for Partridge Shank chickens. We also found that the disease resistance site can be used for reference to different breeds of the same species. SMOC1 plays an important role in the formation of MD tumors in chickens.
Funding Statement: The study was supported by grants from Key Research Project of the Shennong Laboratory (Grant Number SN01-2022-05), the Tackling Key Projects in Science and Technology in Henan Province (Grant Number 162102110039), and the Independent Innovation Project of Henan Academy of Agricultural Sciences (Grant Number 2022ZC46). The funding sources had no involvement in study design, data analysis, writing, and article submission.
Author Contributions: Study design, data acquisition, and analysis: Wenqing Li, Guozhi Zhang, and Wanli Li. Drafting the manuscript: Wanli Li, Bei Wang, Lin Zhang and Guoqing Yang. Manuscript review and revision: Shengli Li, Chenwan Li, Bei Wang, Lin Zhang and Pinhui Wu. Manuscript review and substantive revision: Wenqing Li. Statistical analysis of data: Guozhi Zhang and Pinhui Wu. All authors have read and approved the final manuscript.
Availability of Data and Materials:: The datasets used and/or analyzed during the current study are available from the corresponding author upon reasonable request.
Ethics Approval: All animal experiments were performed in accordance with the regulations of the Chinese National Research Council (1994) and were approved by the Animal Care and Use Committee of Henan Agricultural University (Permit Number: 11-0085).
Conflicts of Interest: The authors declare that they have no conflicts of interest to report regarding the present study.
References
Bai Y, Yuan P, Zhang HM, Ramachandran R, Yang N, Song JZ (2020). Adiponectin and its receptor genes expression in response to MDV infection of White Leghorns. Poultry Science 99: 4249–4258. https://doi.org/10.1016/j.psj.2020.06.004 [Google Scholar] [PubMed] [CrossRef]
Brellier F, Ruggiero S, Zwolanek D, Martina E, Hess D et al. (2011). SMOC1 is a tenascin-C interacting protein over-expressed in brain tumors. Matrix Biology 30: 225–233. https://doi.org/10.1016/j.matbio.2011.02.001 [Google Scholar] [PubMed] [CrossRef]
Clark DJ, Moore CM, Flanagan M, Bocxlaer KV, Piperaki ET et al. (2020). An efficient and novel technology for the extraction of parasite genomic DNA from whole blood or culture. Biotechniques 68: 79–84. https://doi.org/10.2144/btn-2019-0086 [Google Scholar] [PubMed] [CrossRef]
Heidari M, Zhang L, Zhang H (2020). MicroRNA profiling in the bursae of Marek’s disease virus-infected resistant and susceptible chicken lines. Genomics 112: 2564–2571. https://doi.org/10.1016/j.ygeno.2020.02.009 [Google Scholar] [PubMed] [CrossRef]
Li DF, Lian L, Qu LJ, Chen YM, Liu WB, Chen SR, Zheng JX, Xu GY, Yang N (2013). A genome-wide SNP scan reveals two loci associated with the chicken resistance to Marek’s disease. Animal genetics 44: 217–222. https://doi.org/10.1111/j.1365-2052.2012.02395.x [Google Scholar] [PubMed] [CrossRef]
Lian X, Ming X, Xu J, Cheng W, Zhang X, Chen H, Ding C, Jung YS, Qian Y (2018). First molecular detection and characterization of Marek’s disease virus in red-crowned cranes (Grus japonensisA case report. BMC Veterinary Research 14: 122. https://doi.org/10.1186/s12917-018-1437-9 [Google Scholar] [PubMed] [CrossRef]
Luo J, Yu Y, Mitra A, Chang S, Zhang H, Liu G, Yang N, Song JZ (2013). Genome-wide copy number variant analysis in inbred chickens lines with different susceptibility to Marek’s disease. G3 Genes/Genomes/Genetics 3: 217–223. https://doi.org/10.1534/g3.112.005132 [Google Scholar] [PubMed] [CrossRef]
McPherson MC, Cheng HH, Smith JM, Delany ME (2018). Vaccination and host Marek’s disease-resistance genotype significantly reduce oncogenic gallid alphaherpesvirus 2 telomere integration in host birds. Cytogenetic and Genome Research 156: 204–214. https://doi.org/10.1159/000495174 [Google Scholar] [PubMed] [CrossRef]
Peng XS, Yang JP, Qiang YY, Sun R, Cao Y et al. (2020). PTPN3 inhibits the growth and metastasis of clear cell renal cell carcinoma via inhibition of PI3K/AKT signaling. Molecular Cancer Research 18: 903–912. https://doi.org/10.1158/1541-7786.MCR-19-1142 [Google Scholar] [PubMed] [CrossRef]
Suzuki H, Yamamoto E, Yamano HO, Nakase H, Sugai T (2019). Integrated analysis of the endoscopic, pathological and molecular characteristics of colorectal tumorigenesis. Digestion 99: 33–38. https://doi.org/10.1159/000494410 [Google Scholar] [PubMed] [CrossRef]
Yu ZH, Teng M, Ding K, Min YJ, Yu LL, Su JW, Cheng XC, Luo J (2014). Cloning and phylogenetic analysis of Meq gene of Marek’s disease virus isolates from Henan province. Journal of Northwest A&F University (Natural Science Edition) 42: 15–20. https://doi.org/10.13207/j.cnki.jnwafu.2014.08.027 [Google Scholar] [CrossRef]
Yuan B, Liu J, Cao J, Yu Y, Zhang H et al. (2019). PTPN3 acts as a tumor suppressor and boosts TGF-beta signaling independent of its phosphatase activity. The EMBO Journal 38: e99945. https://doi.org/10.15252/embj.201899945 [Google Scholar] [PubMed] [CrossRef]
Zhang GH, Zhong QY, Gou XX, Fan EX, Shuai Y, Wu MN, Yue GJ (2019). Seven genes for the prognostic prediction in patients with glioma. Clinical & Translational Oncology 21: 1327–1335. https://doi.org/10.1007/s12094-019-02057-3 [Google Scholar] [PubMed] [CrossRef]
Zhao YR, Chen YP, Cheng YF, Qu HM, Li J, Wen C, Zhou YM (2019). Effects of dietary phytosterols on growth performance, antioxidant status, and meat quality in Partridge Shank chickens. Poultry Science 98: 3715–3721. https://doi.org/10.3382/ps/pez059 [Google Scholar] [PubMed] [CrossRef]
Zhou J, Zhao GL, Wang XM, Du XS, Su S, Li CG, Nair V, Yao YX, Cheng ZQ (2018). Synergistic viral replication of marek’s disease virus and avian leukosis virus subgroup J is responsible for the enhanced pathogenicity in the superinfection of chickens. Viruses 10: 271. https://doi.org/10.3390/v10050271 [Google Scholar] [PubMed] [CrossRef]
Supplementary Materials
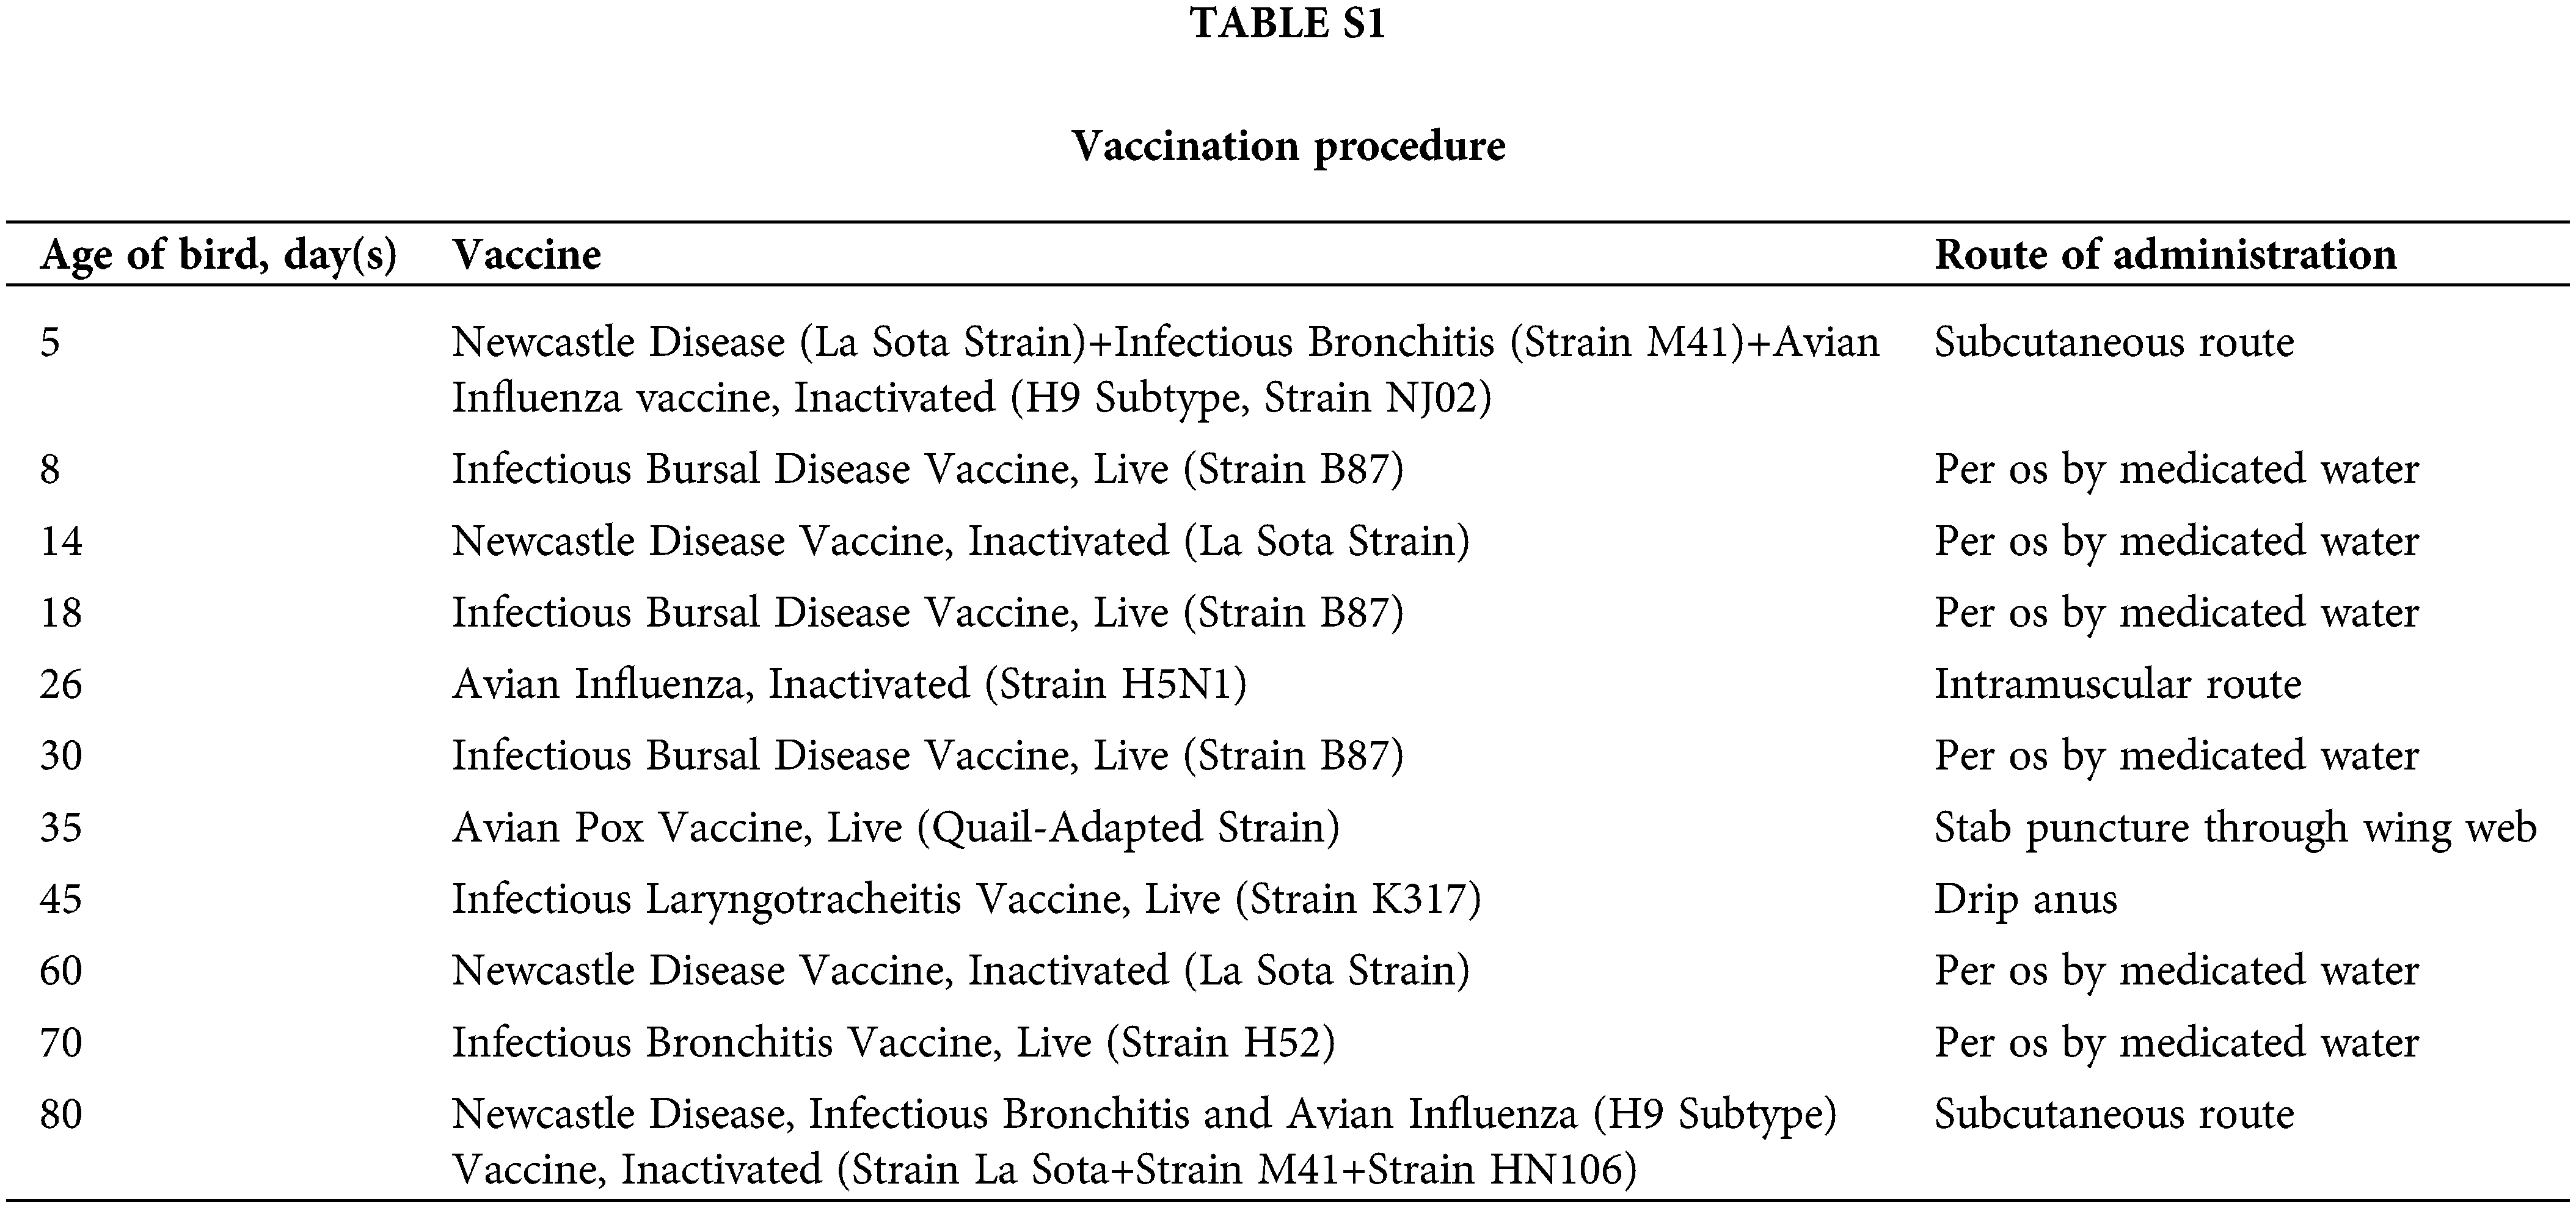
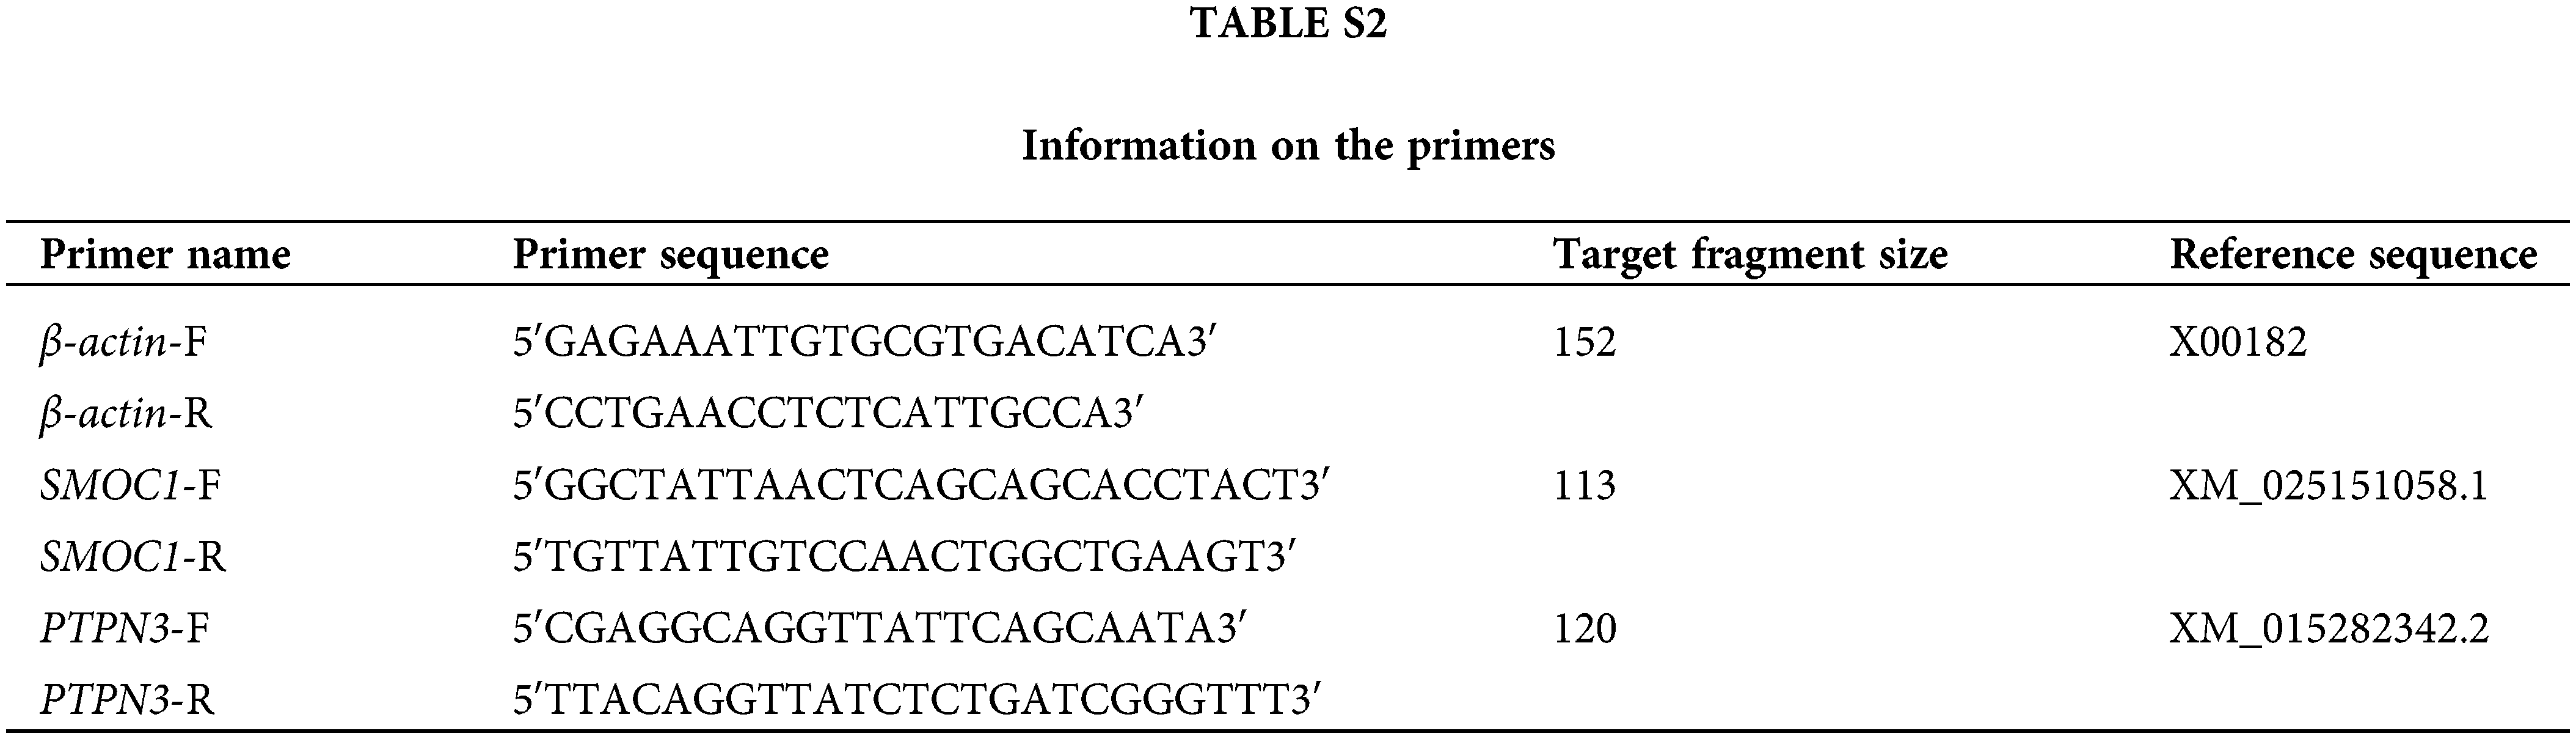
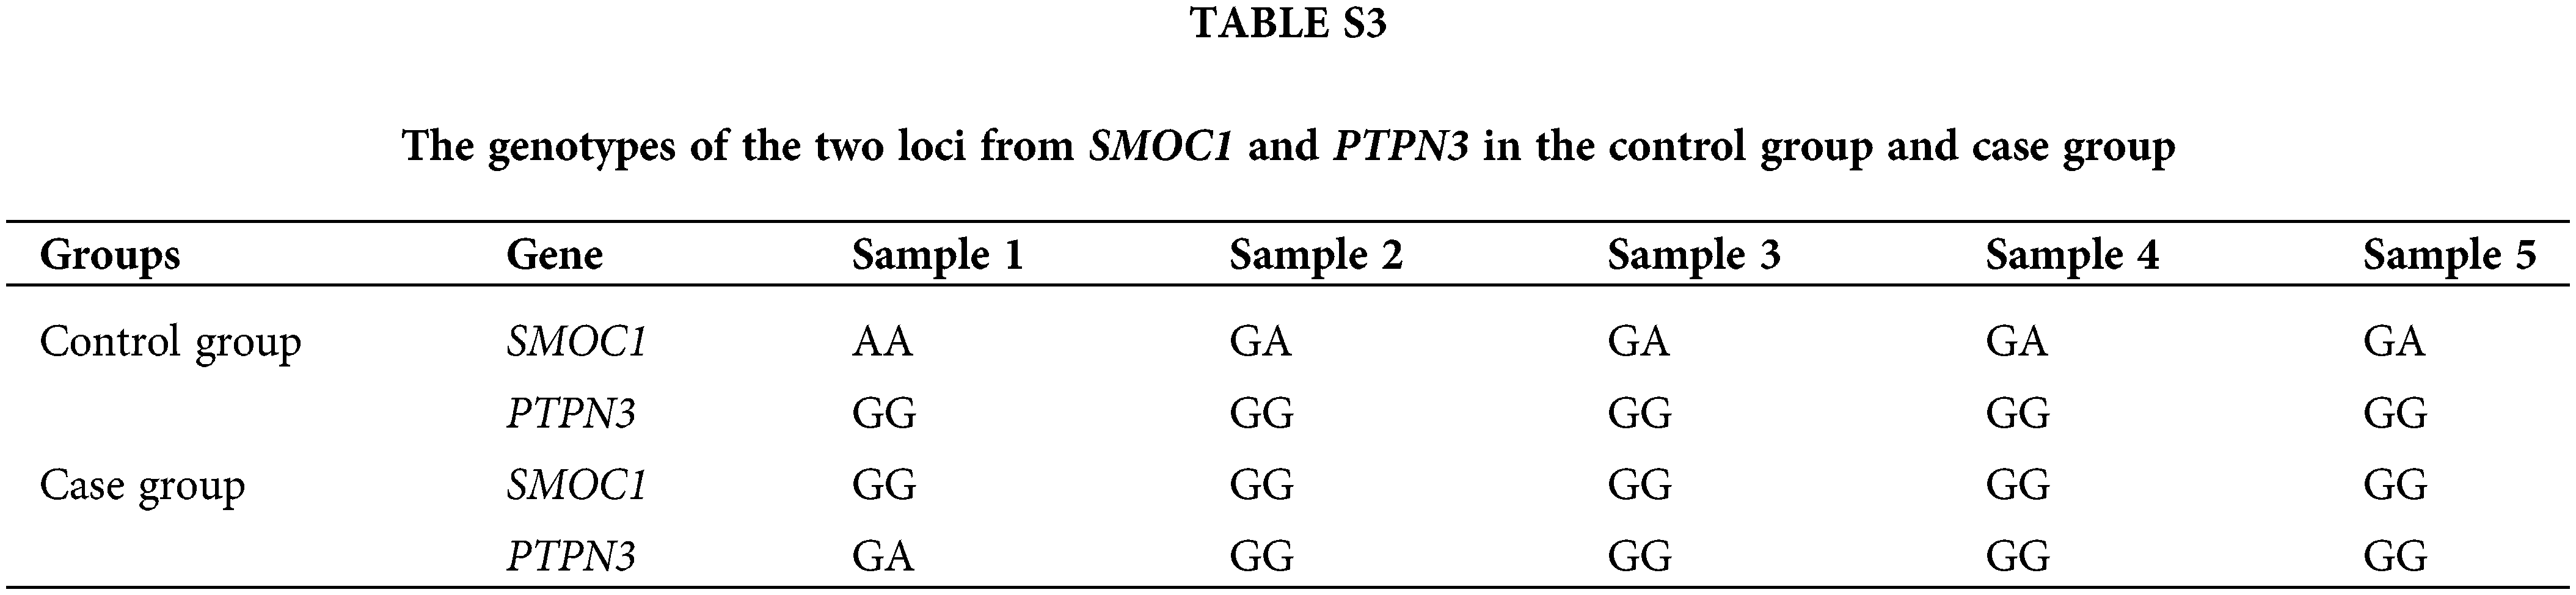
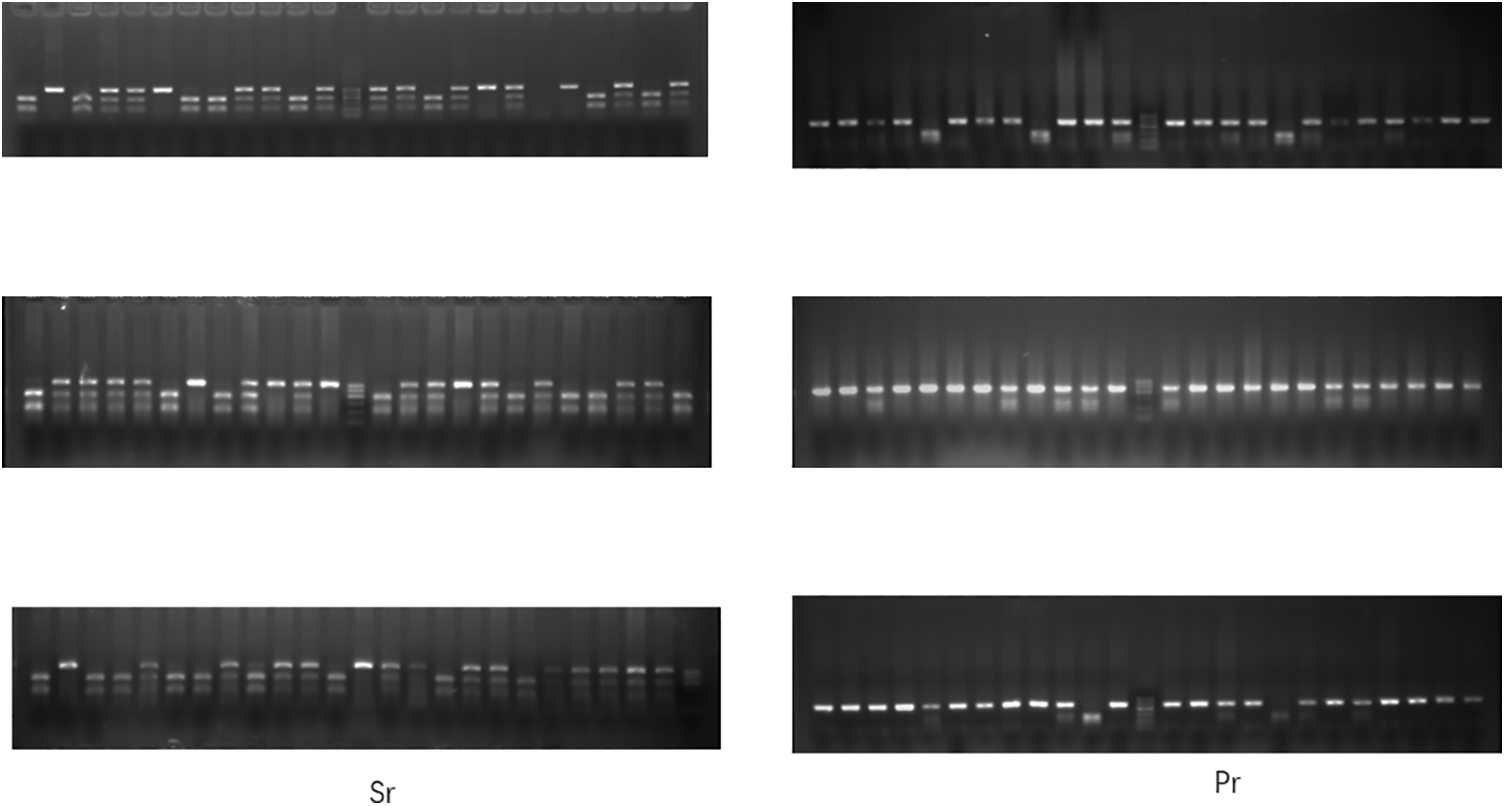
Figure S1: Electropherograms of Sr and Pr after restriction enzyme digestion. The first column represents Sr, and the second column represents Pr.
Cite This Article
 Copyright © 2023 The Author(s). Published by Tech Science Press.
This work is licensed under a Creative Commons Attribution 4.0 International License , which permits unrestricted use, distribution, and reproduction in any medium, provided the original work is properly cited.
 Downloads
 Citation Tools