
 Submit a Paper
 Propose a Special lssue
 Open Access
ARTICLE

Genetic algorithm-optimized backpropagation neural network establishes a diagnostic prediction model for diabetic nephropathy: Combined machine learning and experimental validation in mice
1 Division of Nephrology, Renmin Hospital of Wuhan University, Wuhan, China
2 Nephrology and Urology Research Institute of Wuhan University, Wuhan, China
3 The First College of Clinical Medical Science, Three Gorges University, Yichang, China
4 School of Life Science and Engineering, Southwest Jiaotong University, Chengdu, China
* Corresponding Author: Wei Liang,
(This article belongs to the Special Issue: Bioinformatics Study of Diseases)
BIOCELL 2023, 47(6), 1253-1263. https://doi.org/10.32604/biocell.2023.027373
Received 27 October 2022; Accepted 11 January 2023; Issue published 19 May 2023
 View Full Text
 Download PDF
Abstract
Background: Diabetic nephropathy (DN) is the most common complication of type 2 diabetes mellitus and the main cause of end-stage renal disease worldwide. Diagnostic biomarkers may allow early diagnosis and treatment of DN to reduce the prevalence and delay the development of DN. Kidney biopsy is the gold standard for diagnosing DN; however, its invasive character is its primary limitation. The machine learning approach provides a non-invasive and specific criterion for diagnosing DN, although traditional machine learning algorithms need to be improved to enhance diagnostic performance. Methods: We applied high-throughput RNA sequencing to obtain the genes related to DN tubular tissues and normal tubular tissues of mice. Then machine learning algorithms, random forest, LASSO logistic regression, and principal component analysis were used to identify key genes (CES1G, CYP4A14, NDUFA4, ABCC4, ACE). Then, the genetic algorithm-optimized backpropagation neural network (GA-BPNN) was used to improve the DN diagnostic model. Results: The AUC value of the GA-BPNN model in the training dataset was 0.83, and the AUC value of the model in the validation dataset was 0.81, while the AUC values of the SVM model in the training dataset and external validation dataset were 0.756 and 0.650, respectively. Thus, this GA-BPNN gave better values than the traditional SVM model. This diagnosis model may aim for personalized diagnosis and treatment of patients with DN. Immunohistochemical staining further confirmed that the tissue and cell expression of NADH dehydrogenase (ubiquinone) 1 alpha subcomplex, 4-like 2 (NDUFA4L2) in tubular tissue in DN mice were decreased. Conclusion: The GA-BPNN model has better accuracy than the traditional SVM model and may provide an effective tool for diagnosing DN.Keywords
In recent years, the incidence of diabetes has increased significantly. Diabetes is an increasingly common chronic disease characterized by the body’s inability to metabolize glucose and chronic hyperglycemia (Lai et al., 2019). This disease occurs globally and is caused by spontaneous metabolic disorders (Horikoshi et al., 2020). The International Diabetes Federation estimated that by 2045, 642 million people worldwide will have diabetes (Wang et al., 2022). Diabetes tends to cause multiple complications, such as nephropathy (Younas et al., 2022). Diabetic nephropathy (DN) shortens the lifespan of patients with diabetes. When a patient is diagnosed with DN, the function of the kidney is significantly impaired (Tsai et al., 2020). Therefore, risk prediction may be advantageous for implementing early treatment and prevention (Liang et al., 2022). Understanding the factors related to DN is of great significance in controlling the occurrence of DN and improving the quality of life of patients.
Recent studies have reported that urinary microalbumin, serum creatinine levels, estimated glomerular filtration rate (eGFR), and urinary microalbumin/creatinine ratio (UACR) serve as diagnostic markers for DN (Zou et al., 2022). However, these markers do not yet provide a comprehensive diagnostic performance. Furthermore, the diagnosis of DN is challenging because this condition is non-proteinuric (Huang et al., 2022). It is difficult for clinicians to apply the biomarkers directly when making clinical decisions. Therefore, the identification of diagnostic biomarkers and establishment of a simpler prediction model will help clinicians make early diagnoses and appropriate interventions to improve prognosis. Over the past 20 years, several studies have identified linkage peaks in different genome regions and have demonstrated an association between genes and diabetic complications, especially kidney disease (Tang et al., 2020). Quantitative measures of DN-related traits showed moderate to high estimated heritability (Blech et al., 2011). Therefore, combining genetic information to predict DN may lead to more effective prevention or treatment.
As a type of artificial intelligence, machine learning uses statistical techniques to allow computers to learn specific tasks without being explicitly programmed (Dhiman et al., 2022; Xu et al., 2022). Previously, researchers used decision trees, random forests, naive Bayesian classification, neural networks, regression and support vector machines to identify novel diagnostic markers to establish risk prediction for DN (Leung et al., 2013; Currie et al., 2018; Kapoula et al., 2020). Wu et al. (2009) conducted candidate gene analysis on 345 patients with type 2 diabetes and analyzed its correlation with 20 candidate genes and associated complications such as obesity and DN. Huang et al. (2015) also confirmed that combining genetic information can aid in better clinical differentiation of patients with diabetic and non-DN. DN is characterized by both glomerulus and tubular damage (Wilson et al., 2019). Early-stage DN is characterized by podocyte disease and alterations in the filtration barrier, and the evolution of the disease is associated with irreversible renal fibrosis. Part of this process is triggered and is associated with damage to the tubular epithelial cells (Garrido et al., 2019).
Therefore, in-depth studies based on key tubular genes will help elucidate the molecular mechanisms of DN pathogenesis and provide new insights for developing new therapeutic targets. This study aimed to identify key genes and combine this with various algorithms to explore an effective diagnosis model of DN. We used high-throughput RNA sequencing (RNA-seq) to obtain the transcriptome data of the tubular tissue of mice. First, the differentially expressed genes (DEGs) between DN and non-diabetic tubular samples were identified. The dimensionality reduction screening of DEGs was performed by least absolute shrinkage and selection operator (LASSO) logistics and random forest to diagnose key genes. The classification effect of key genes was verified by principal component analysis (PCA). For key genes, gene enrichment analysis was implemented. Finally, the DN diagnosis model was constructed and validated by the GA-BPNN model, which demonstrated improved diagnostic performance.
Data collection and processing
Male db/m mice and db/db mice (20-week-old) were randomly selected and sacrificed by cervical dislocation. The mouse kidneys were taken out, minced, and filtered using 100, 80, and 40 µm filters to obtain renal tubules. Renal tubules were extracted from the kidneys of nine mice per group, and then the tubules of three mice were pooled as an independent sample. Transcriptome sequencing of RNA was performed by Myhalic Biotechnological Co., Ltd. (Wuhan, China). Per group, three independent biological replicates were sequenced. As external validation data, GSE106841 was downloaded from the high-throughput gene expression database (GEO) (https://www.ncbi.nlm.nih.gov/geo/) to verify the prediction effect of the model. The GSE106841 validation set has 30 samples, 15 db/db mice, 15 db/m mice.
Analysis of differentially expressed genes
The differential analysis was performed on the combined data set through the Limma package in the R language, and |logFC| > 1, p < 0.05 was selected as the threshold.
Least absolute shrinkage and selection operator logistic analysis
The principle of LASSO is to penalize the coefficients based on ordinary least squares estimation (OLS) (Xu et al., 2022). LASSO logistic analysis was developed based on the traditional logistic model, which selects variables by tuning the parameter λ and then reduces the estimates of uncorrelated variables to zero. A ten-fold cross-validation method was used to determine the optimal value of λ (Xu et al., 2022). We first performed 10-fold cross-validation to select candidate variables (“glmnet” package). The LASSO algorithm was used to analyze the key prognosis-related genes. The complexity of LASSO is governed by λ, which penalizes the model with more variables with greater power. We defined λ1se as the criterion for obtaining the optimal model with the smallest variable. Second, we plotted the partial likelihood deviation curve concerning the logarithm (λ). Vertical dashed lines were drawn at the optimum. Finally, the coefficient distribution of the logarithmic (λ) series was plotted.
Random forest is an ensemble learning method based on decision trees. The first step uses the bootstrap resampling technique. The second step employs random feature selection when growing the tree. So instead of using all variables to split the nodes, a randomly selected subset of variables is used. Both randomization steps aim to decorrelate the tree, encouraging low variance ensembles due to bagging. Combined with a strategy that uses deep trees reduces generalization error, giving ensembles superior performance (Yang et al., 2020). In this study, we generated a new set of training samples from the data-augmented sequencing data. We randomly sampled m feature sets from each training bootstrap sample and then generated B decision trees based on the bootstrap sample set. When splitting a decision tree, the optimal feature set is selected from m features. The B decision tree constitutes a random forest, and new data classification is determined by the number of votes in the decision tree (Ishwaran and Lu, 2019).
PCA is a multivariate technique that analyzes the observations in a data table described by several interrelated quantitative dependent variables. The goal of PCA is to extract important information from a table, represent it as a new set of orthogonal variables called principal components, and display the similarity patterns of observations and variables as points in a map (Xu et al., 2014). In this study, we used PCA for identification of the classification to verify that the genes screened by LASSO-Logistic and random forest have an excellent classification effect.
Signature gene set enrichment analysis
We applied the Clusterprofiler package in R4.1.2 software to find the biological function of signature genes. The results were visualized using the “ggplot2” package in the R4.1.2 software. GO functional enrichment is a widely used bioinformatics tool to study gene and protein annotation. It includes three aspects: biological process (BP), cellular component (CC), and molecular function (MF) (p < 0.05).
SVM is a supervised learning model frequently used in regression analysis, pattern recognition, and classification (Liu et al., 2022). The 10-fold cross-validated classification was performed using different kernels (Mehta and Sebro, 2020). The resulting five signature genes were analyzed, and the sequencing dataset was split into training (80%) and test (20%) datasets. Next, 10-fold cross-validation and support vector machines with different kernel functions were used to identify the best kernel function. The SVM with the best kernel was then applied to evaluate the accuracy based on the validation dataset (Song-men, 2022).
Genetic algorithm optimized backpropagation neural network (GA)-BPNN neural network algorithm
A group of solutions (individuals) are developed over numerous generations in a GA. Those solutions that perform very well are chosen to join the next generation under the survival of the fittest theory. Under the impact of genetic crossover, the solution recombines and mutates to create a new genotype (Lu et al., 2022). GAs have been widely used to optimize the weights and thresholds of neural networks. This study used the GA to optimize the weights and thresholds to establish the GA-BPNN model. The backpropagation (BP) algorithm is essentially a multilayer perceptron. The BP neural network is trained using the error backpropagation algorithm (Xu and Zhao, 2022). During training, data is continuously transmitted through forwarding propagation. The weight thresholds can be updated in real-time through error backpropagation (Wu and Shen, 2021). The BP neural network (BPNN) is divided into three components: the input layer, which receives information and processes the hidden layer information, and the output layer, which obtains the results (Zhao, 2021). In this study, there were five input layers. The number of output layers was set to 2, and then the number of hidden layers was set to 11. After optimizing the weights and thresholds of the GA, three components were imported, and connected to form a complete BPNN, and a 5-gene DN prediction model was established based on the GA-BPNN algorithm.
Anti- NADH dehydrogenase (ubiquinone) 1 alpha subcomplex, 4-like 2 (anti-NDUFA4L2) antibody (16480-1-AP, 1:100) was used for immunofluorescence staining and immunohistochemistry (IHC). The DAPI (4′,6-diamidino-2-phenylindole) and Alexa Flour 488,594 conjugated anti-mouse, anti-rabbit IgG were obtained from Antgene (Wuhan, China).
Immunofluorescence staining and immunohistochemical staining
Renal slices were dewaxed at room temperature. After washing, the slices were blocked with 5% albumin bovine V (Servicebio, Wuhan, China) for 1 h and then incubated with NDUFA4L2 primary antibody at 4°C overnight. Subsequently, the indicated fluorescent-labeled secondary antibody was added at room temperature for 1 h. Cell nuclei were visualized by co-staining with DAPI. Representative photographs (five visual fields for each tissue were analyzed, with five measurements per field) were captured using a laser scanning confocal microscope (Olympus, Tokyo, Japan). For IHC staining, sections were incubated with NDUFA4L2 primary antibody. Five visual fields (×400 magnification) from individual groups were randomly selected.
After treatment, HK-2 cells were homogenized in RIPA lysis buffer with phenylmethylsulfonyl fluoride and protease inhibitor cocktail (Roche) for 30 min at 4°C. Total proteins were separated by electrophoresis on an 8%–10% sodium dodecyl sulfate-polyacrylamide gel and transferred onto polyvinylidene fluoride membranes. Then, the membranes were blocked with 5% milk for 1 h. After blocking with milk, the membranes were incubated overnight with primary antibodies (anti-NDUFA4L2) at 4°C. The next day, the membranes were incubated with a secondary antibody (Antgene, China). After washing the membranes three times, bands were revealed by an ECL chemiluminescent kit (Biosharp, Hefei, China). Finally, the bands were analyzed using a ChemiDocTM MP Imaging system (Olympus, Hercules, USA).
After the indicated treatment, human renal tubular epithelial cells (HK-2) were fixed with 4% paraformaldehyde and blocked with 5% bovine serum albumin. Specific primary antibodies (anti-NDUFA4L2) were then applied overnight at 4°C. Next, the samples were incubated with fluorescent secondary antibodies for 1 h. After washing, the nuclei of the samples were counterstained with DAPI. Fluorescence results were analyzed using a confocal laser microscope (Olympus, Japan).
Differential genes and data augmentation
After normalizing the data, bioinformatics analysis was performed for DEGs diabetic and non-diabetic renal tubular samples (p < 0.01 and |logFC| > 1). A total of 297 DEGs were obtained using the limma package, and a volcano plot was drawn for the results of differential analysis. The red part indicates the up-regulated gene, the green part presents the down-regulated gene, and the black part is the non-differential gene (Fig. 1A). By linear interpolation of the samples in the group: Saug = xS1 + (1−X)S2, x = 0.1, 0.2, ..., 0.9, the sum of interpolation samples and real samples was 60.
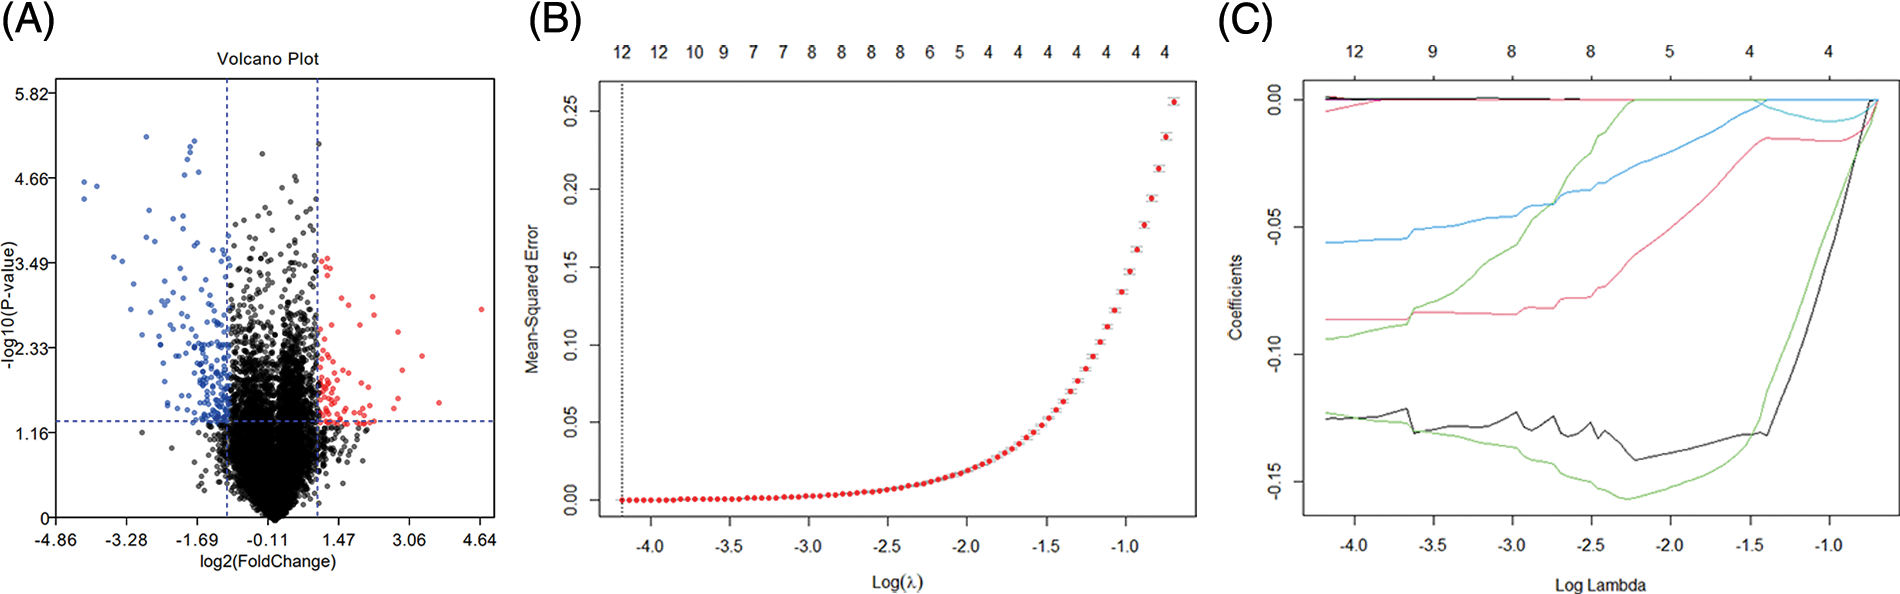
Figure 1: Volcano plot and data augmentation. (A) Differential genes between db/db and dbm mice. Genes with log2(FC) > 1 and p < 0.05 were selected, and a total of 297 differential genes were obtained. Red and blue present up-regulation and down-regulation, respectively, and black indicates indifference (B) log(λ) vs. mean squared error, λ with the smallest MSE (C) log(λ) vs. lasso coefficient.
Key Genes Identified by Least Absolute Shrinkage and Selection Operator Logistic Regression
We used the LASSO logistics to screen for potential biomarkers. Figs. 1B and 1C are the lambda and minimum values of the LASSO logistic regression algorithm, which identified 12 DEGs.
Random forest model screened out diagnostic biomarkers
We divided the augmented data in a 7:3 ratio and used it as a training set and a test set, respectively. For feature selection, a random forest was used, exploiting the relationship between the error rate and the number of classification trees. The number of trees was chosen to be 500, and the depth of the decision tree defaulted to an unrestricted depth. Based on the 12 genes screened out, we established a random forest model and visualized the classification effect of random forest. Fig. 2A shows the receiver operating characteristic (ROC) curve of the 12-gene random forest model, which demonstrated an area under the ROC curve (AUC) value of 0.895 (Fig. 2B). Five genes (CES1G, CYP4A14, NDUFA4, ABCC4, ACE) were obtained as diagnostic markers for DN. Fig. 2C, shows that the unsupervised clustering of the random forest model using the selected genes can effectively distinguish the normal group from the DN group. The 12-gene random forest model has a good classification effect. Also, in the random forest model, all input variables have a certain weight. We screened the top five key genes in the model. Finally, PCA was used to verify the classification effect of the five genes. Fig. 2D shows that the five key genes have a good classification effect.
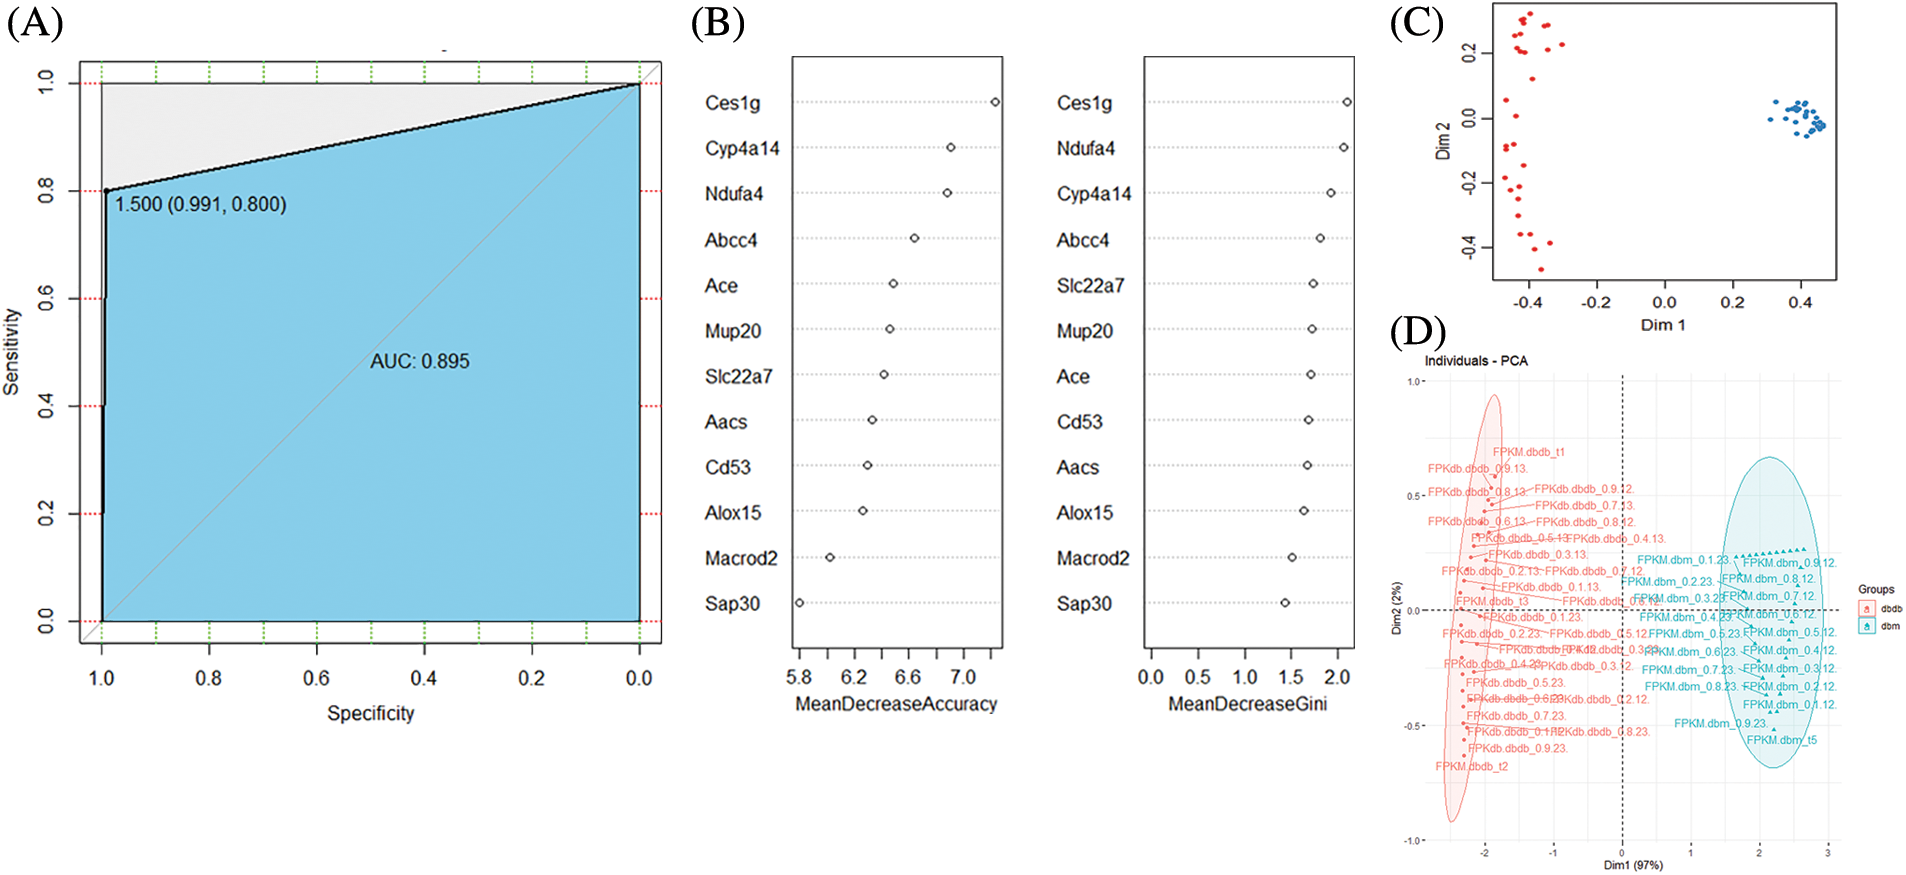
Figure 2: (A) Receiver operating characteristic (ROC) curve of random forest classification power. (B) Random forest gene importance ranking. (C) Unsupervised clustering of 12-gene random forest. (D) Validation diagram of the five-gene PCA classification effect. Bi-line and loading plots for PC1 and PC2, project lines for all pretreated samples, and sample loading is represented as a vector radiating from the origin. Sample scores are represented by symbols (according to each protocol), chemically similar samples are clustered together, and samples are color-coded according to matrix origin.
Gene ontology (GO) enrichment analysis
GO analysis was performed on the five screened genes. The first eight items with p < 0.05 were selected for visualization (Fig. 3). The BP analysis of key genes was enriched mainly in fatty acid metabolism and organic ion transport. The composition of cells was mainly manifested in the basal plasma membrane, basal part of cell, and plasma membrane. The reactions related to MF were mainly manifested in carboxylic acid transmembrane transport activity, carboxylate anion transmembrane transport activity, organic acid transmembrane transport activity, etc.
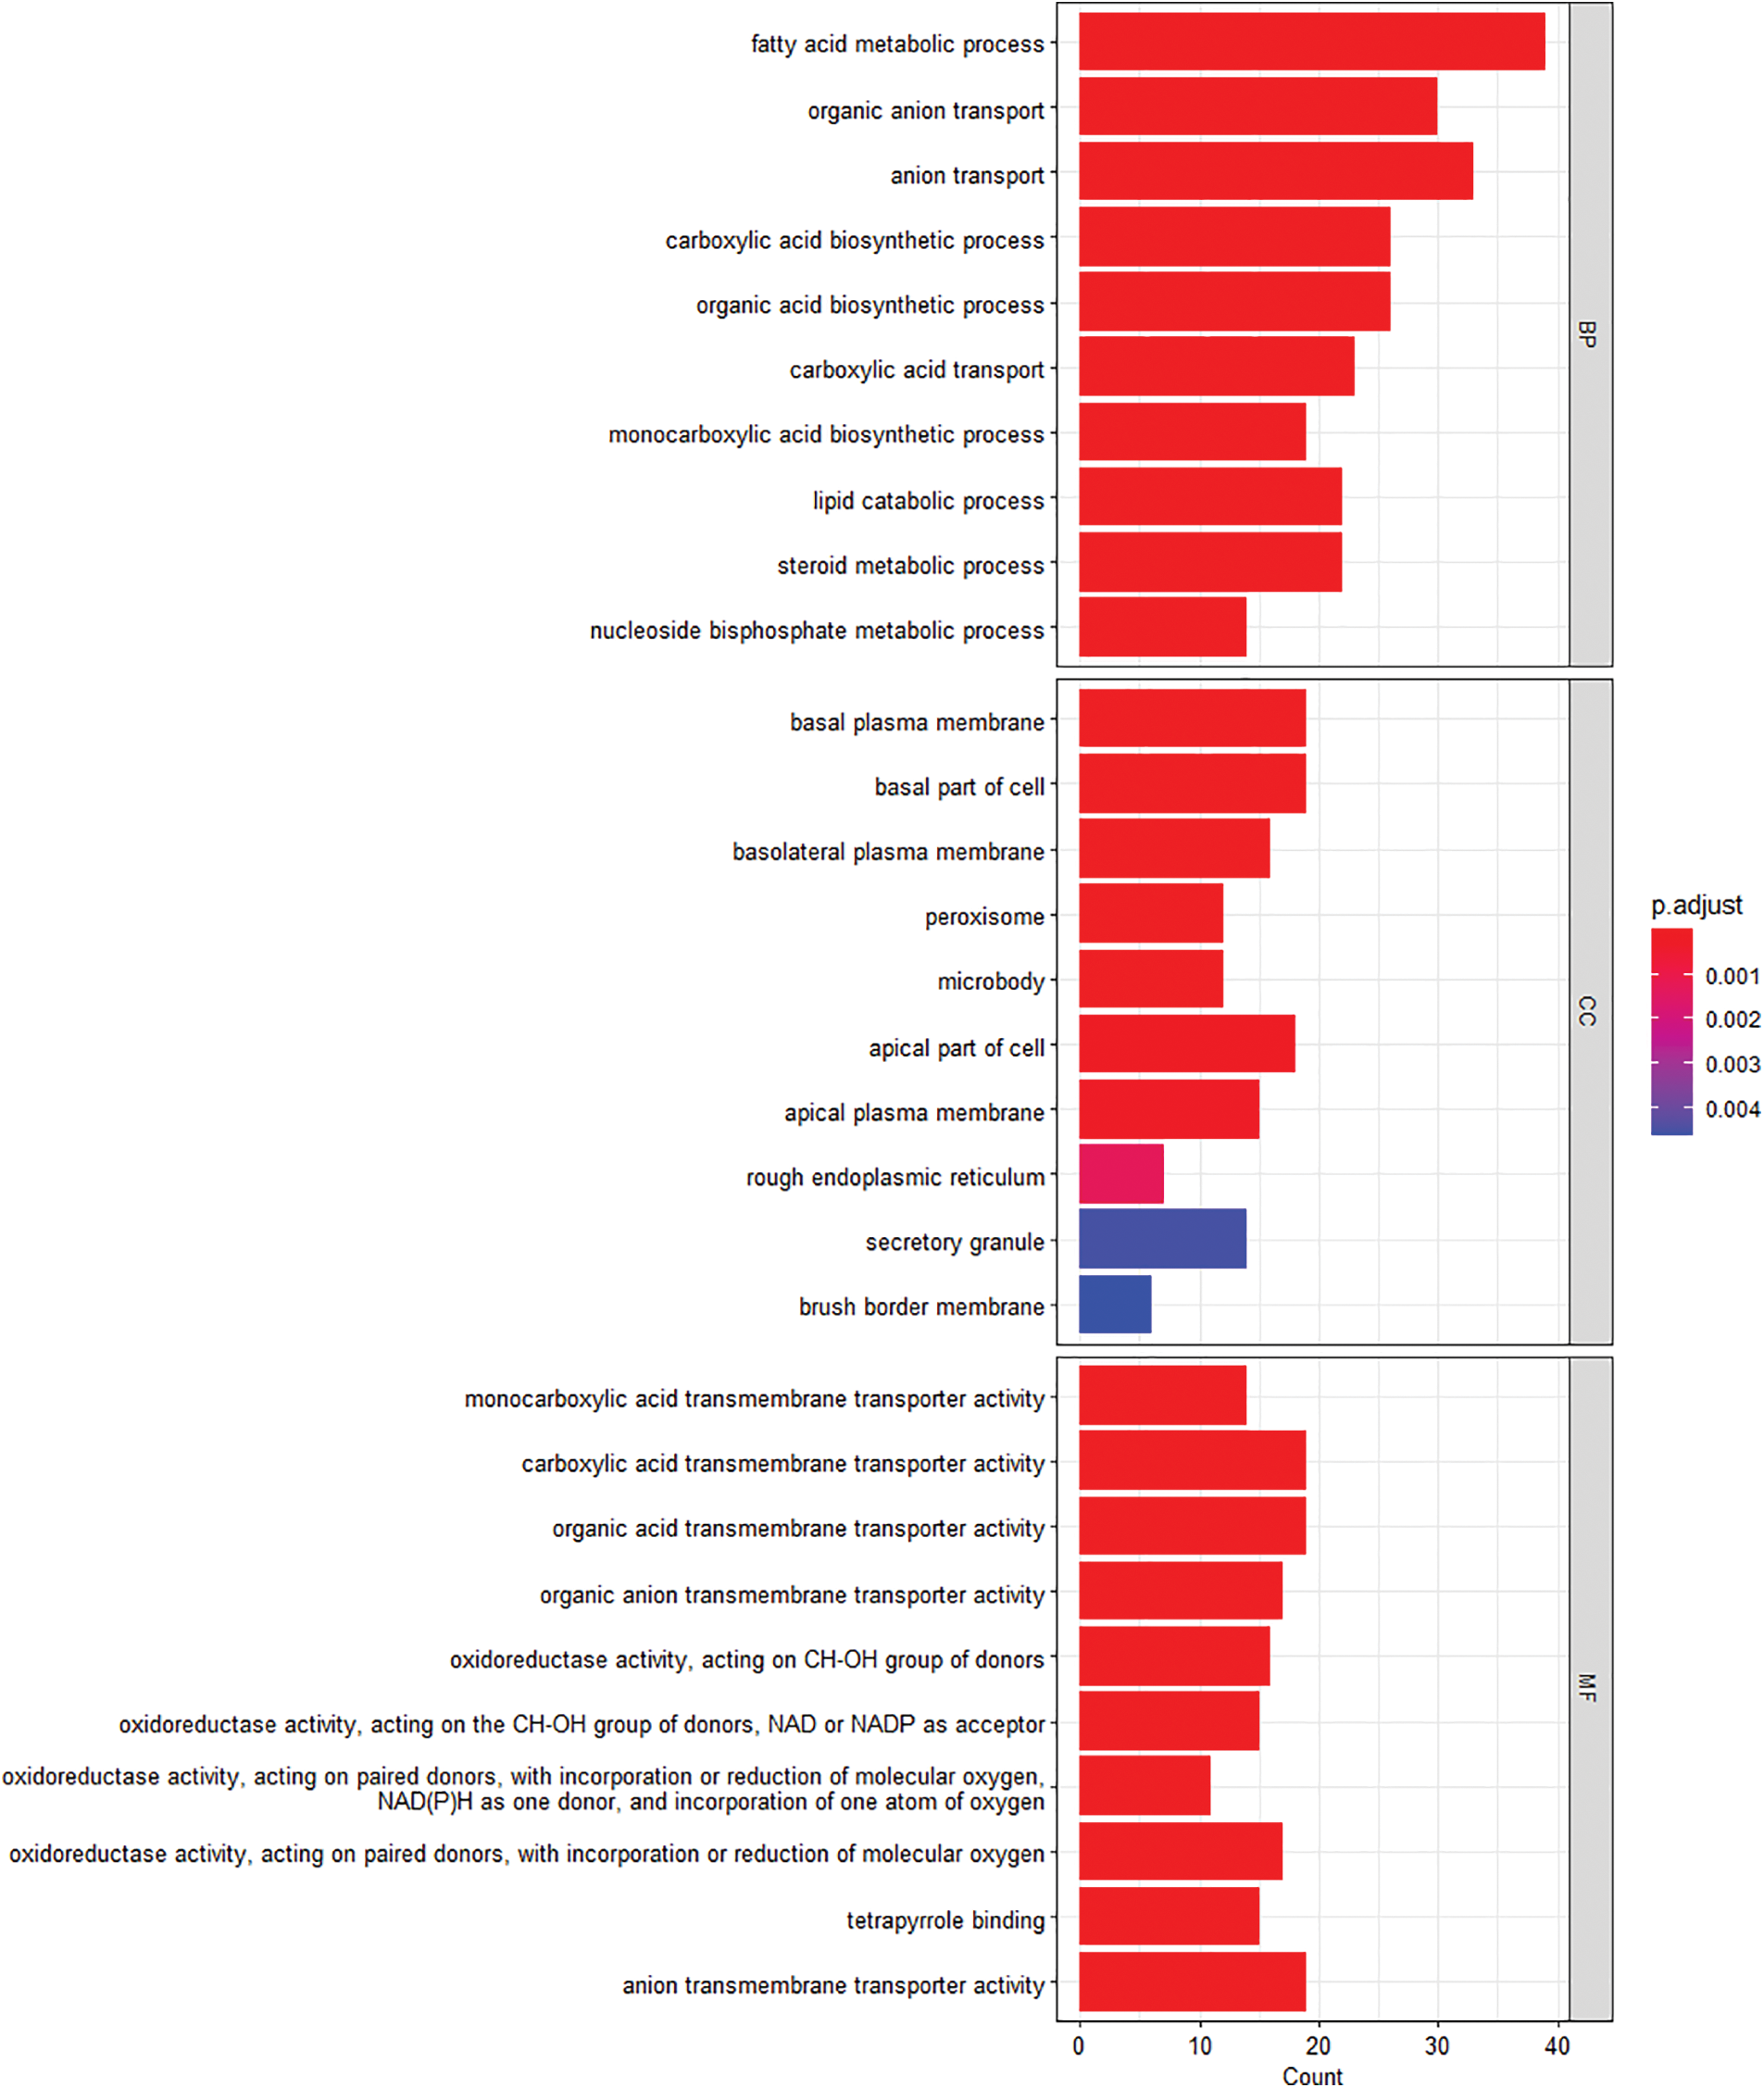
Figure 3: Gene ontology enrichment analysis of key gene differentially expressed genes. The length of the bars represents the number of enriched genes, and the color represents significance, gradually increasing from blue to red; MF, molecular function; CC, cellular assembly; BP, biological process.
Establishment of a five-gene genetic algorithm optimized backpropagation neural network model
Figs. 4A and 5A present the regression curve and AUC curve of the prediction effect of the GA-BPNN model of the RNA-seq data and external data GSE106841. The AUC values of the prediction effect of the GA-BPNN model in the RNA-seq dataset and external validation data were 0.83 (Fig. 4B) and 0.81 (Fig. 5B), respectively. The results show that our model has a good classification effect in both datasets.
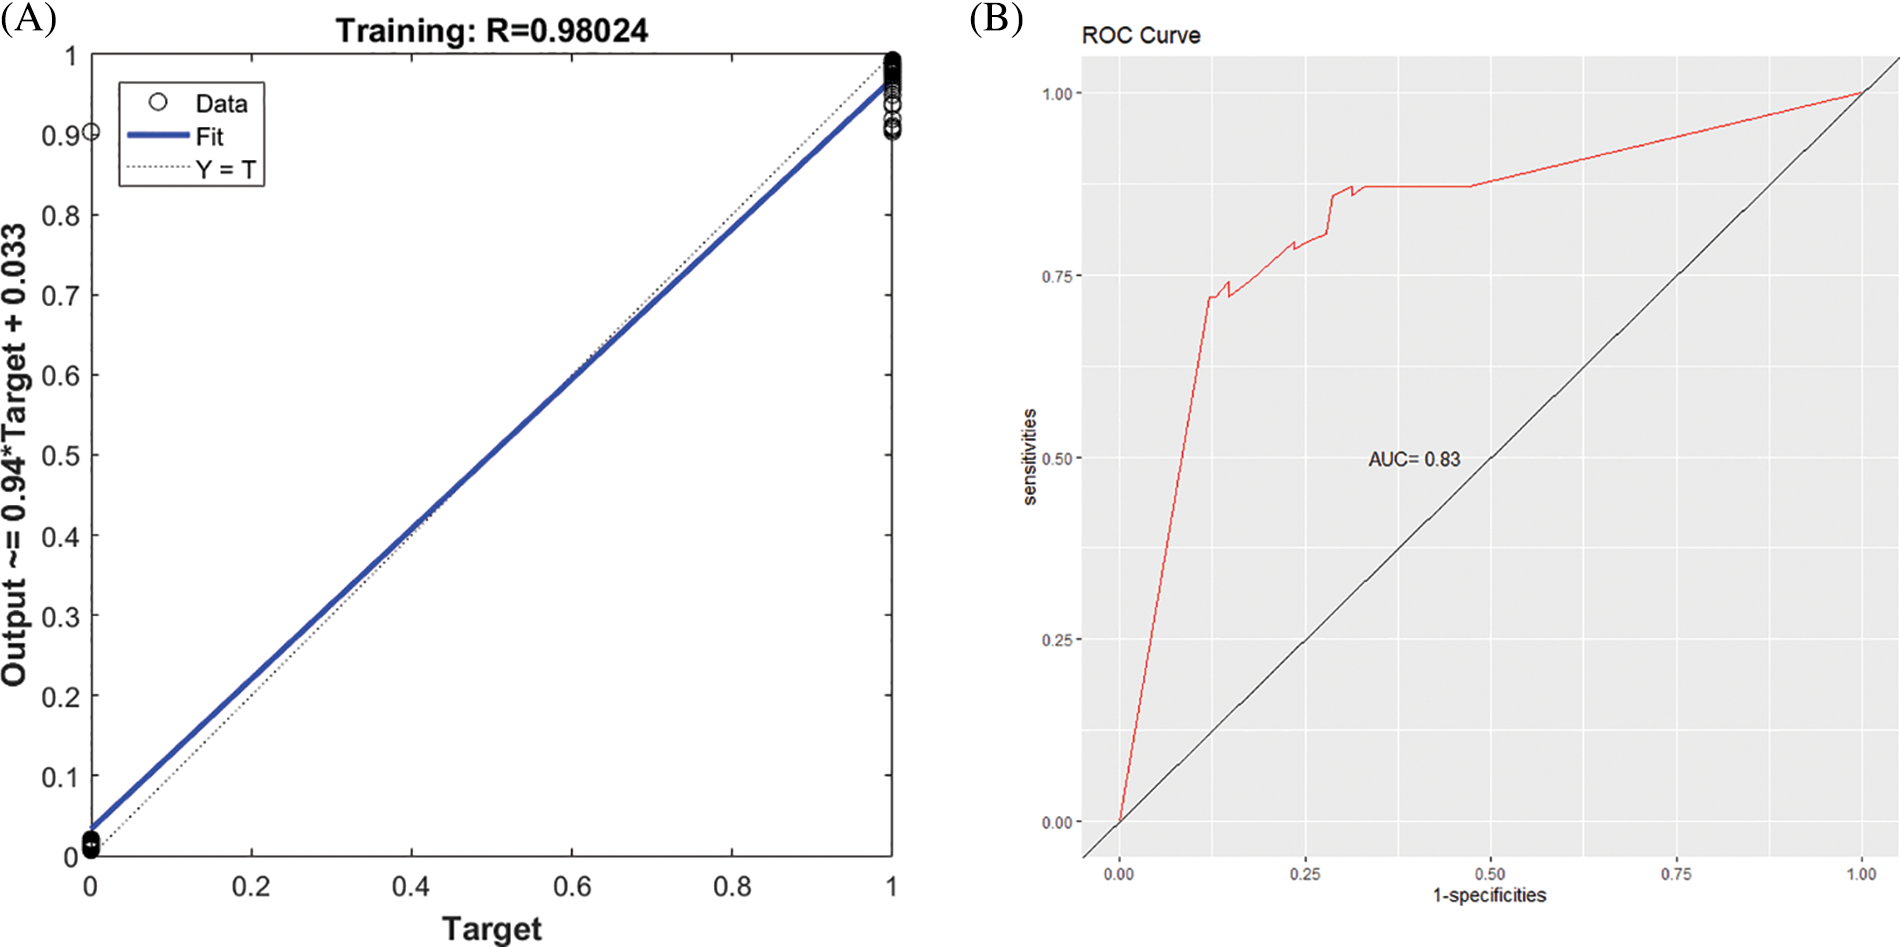
Figure 4: The five-gene genetic algorithm optimized backpropagation neural network (GA-BPNN) model of the RNA-seq dataset after data enhancement. (A) Regression curve of the GA-BPNN linear model. (B) Area under the ROC curve (AUC) curve of the GA-BPNN model.
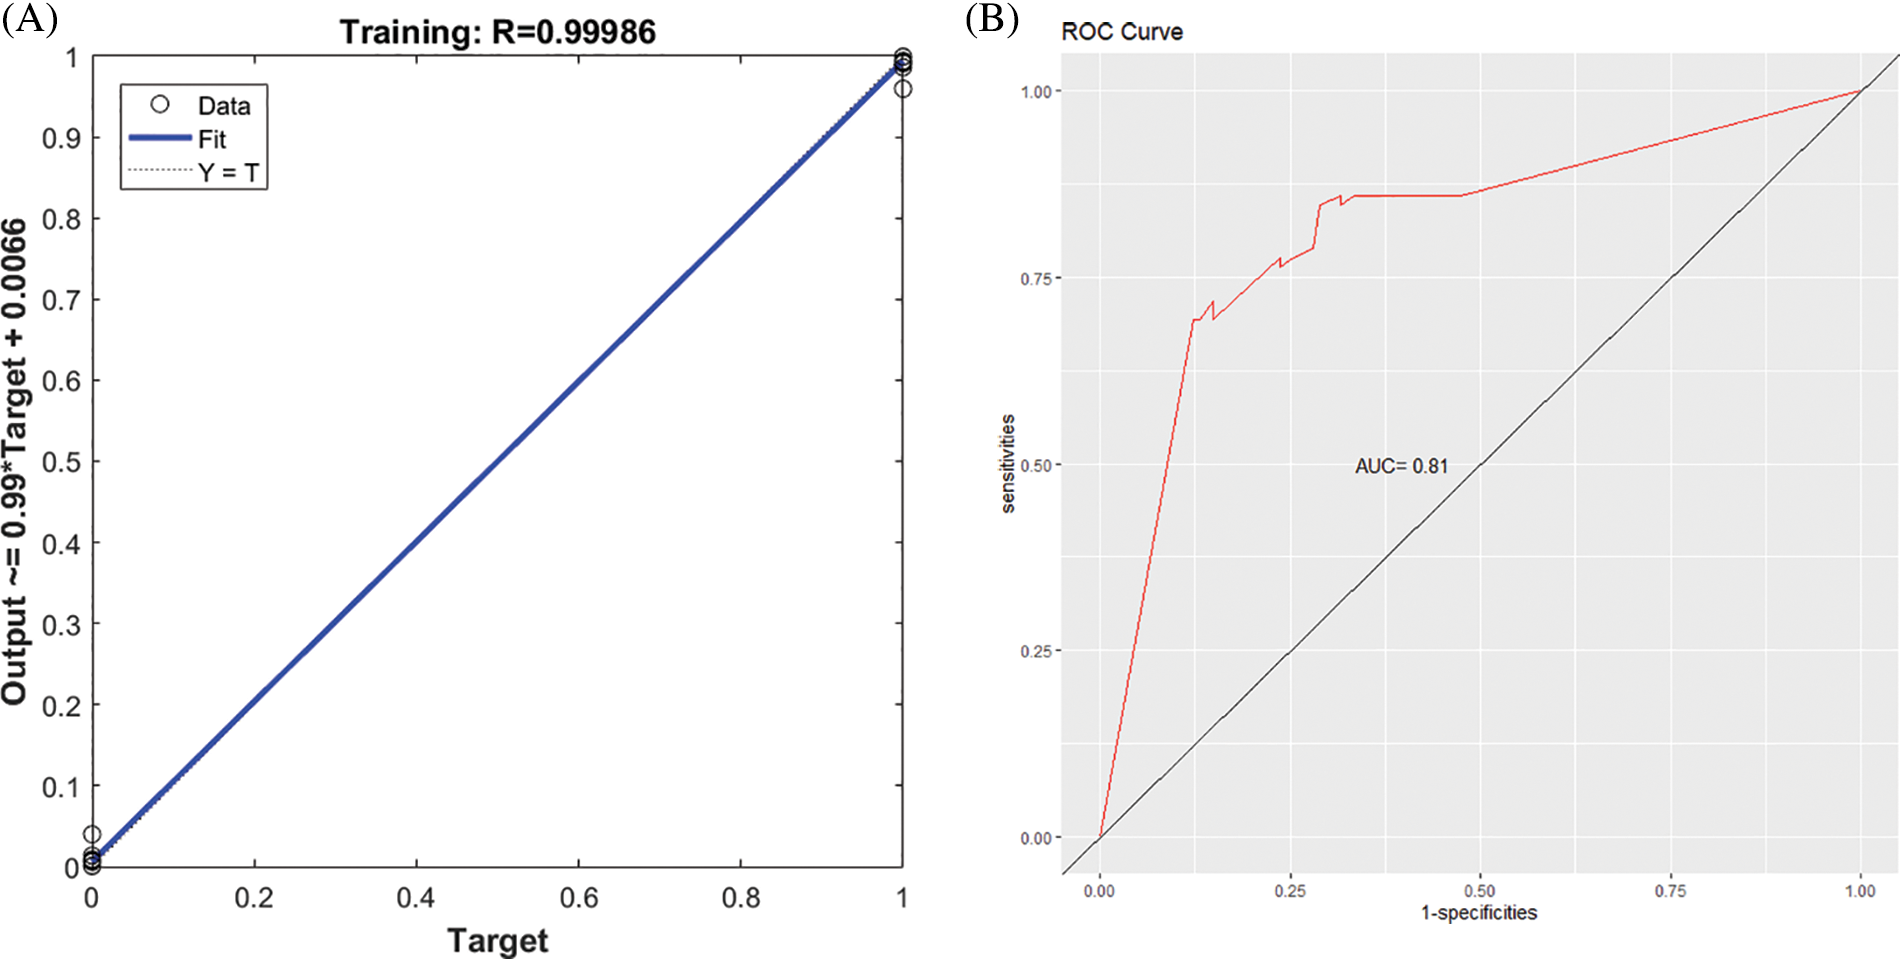
Figure 5: Performance of genetic algorithm optimized backpropagation neural network (GA-BPNN) five-gene model in the external validation dataset GSE106841. (A) Regression curve of GA-BPNN model (B) Area under the ROC curve (AUC) curve of the GA-BPNN model.
Fig. 6 presents the AUC curve of the SVM classification model established based on the signature genes. The AUC values of the classification effect of the SVM model in the RNA-seq and external validation dataset are 0.756 (Fig. 6A) and 0.650 (Fig. 6B), respectively. The GA-optimized backpropagation neural network (GA-BPNN) exhibited a better classification effect and higher recognition accuracy in diagnosing DN. Compared to the SVM model, the proposed model also exhibited better stability and convergence speed. This is because the algorithm of the GA-BPNN neural network does not fall into a locally optimal solution during the search iteration and optimizes the initialization weights and actual thresholds of GA-BPNN during the iterative process. Besides, the optimal vector of the neural network algorithm obtained is inverse transformation, enabling a higher data processing efficiency.
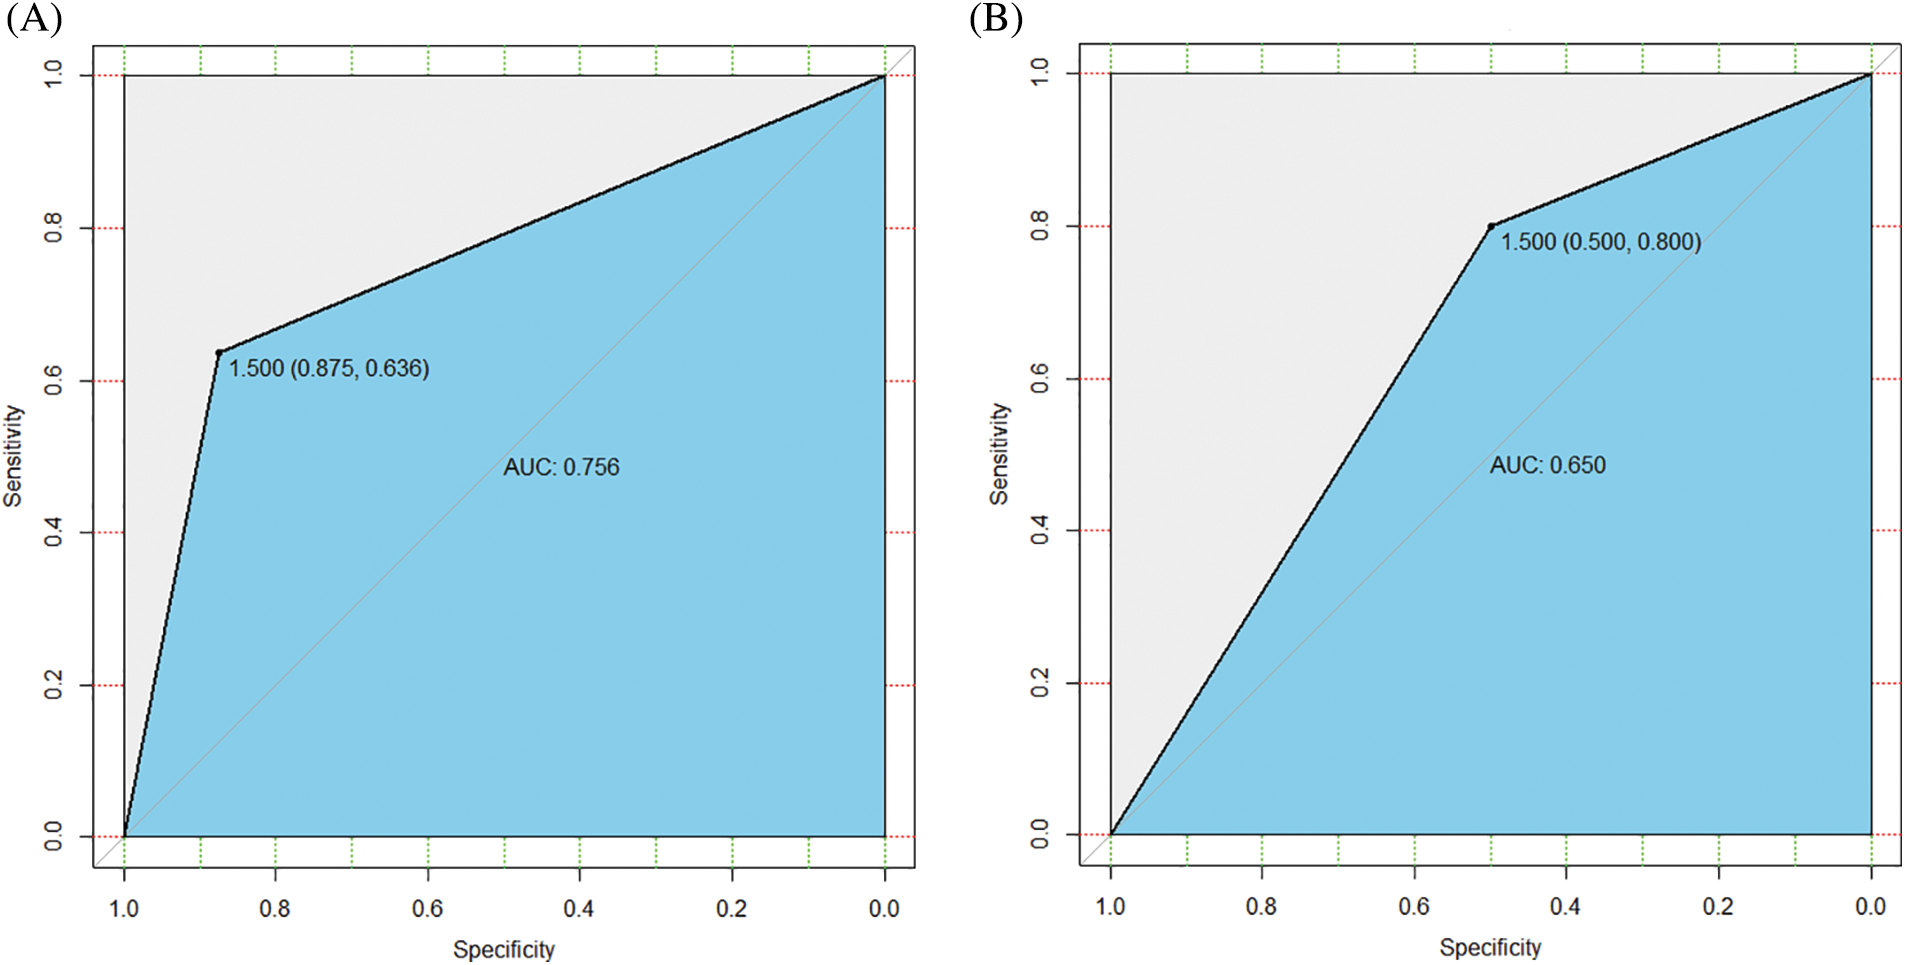
Figure 6: The area under the ROC (AUC) curve of the classification effect of the support vector machines (SVM) model. (A) RNA-seq data. (B) External validation dataset GSE106841.
In vivo and in vitro validation of NDUFA4L2
Immunohistochemistry staining revealed that the expression levels of NDUFA4L2 (Figs. 7A and 7B) were significantly decreased under high glucose (HG) stimulation in mice. We further confirmed at the cellular level that diabetes can lead to decreased expression of NDUFA4L2 (Figs. 7C and 7D). HG-stimulated HK-2 cells demonstrated decreased fluorescence intensity compared to the control and mannitol groups (Figs. 8A and 8C), the expression of NDUFA4L2 protein was reduced (Fig. 8B).
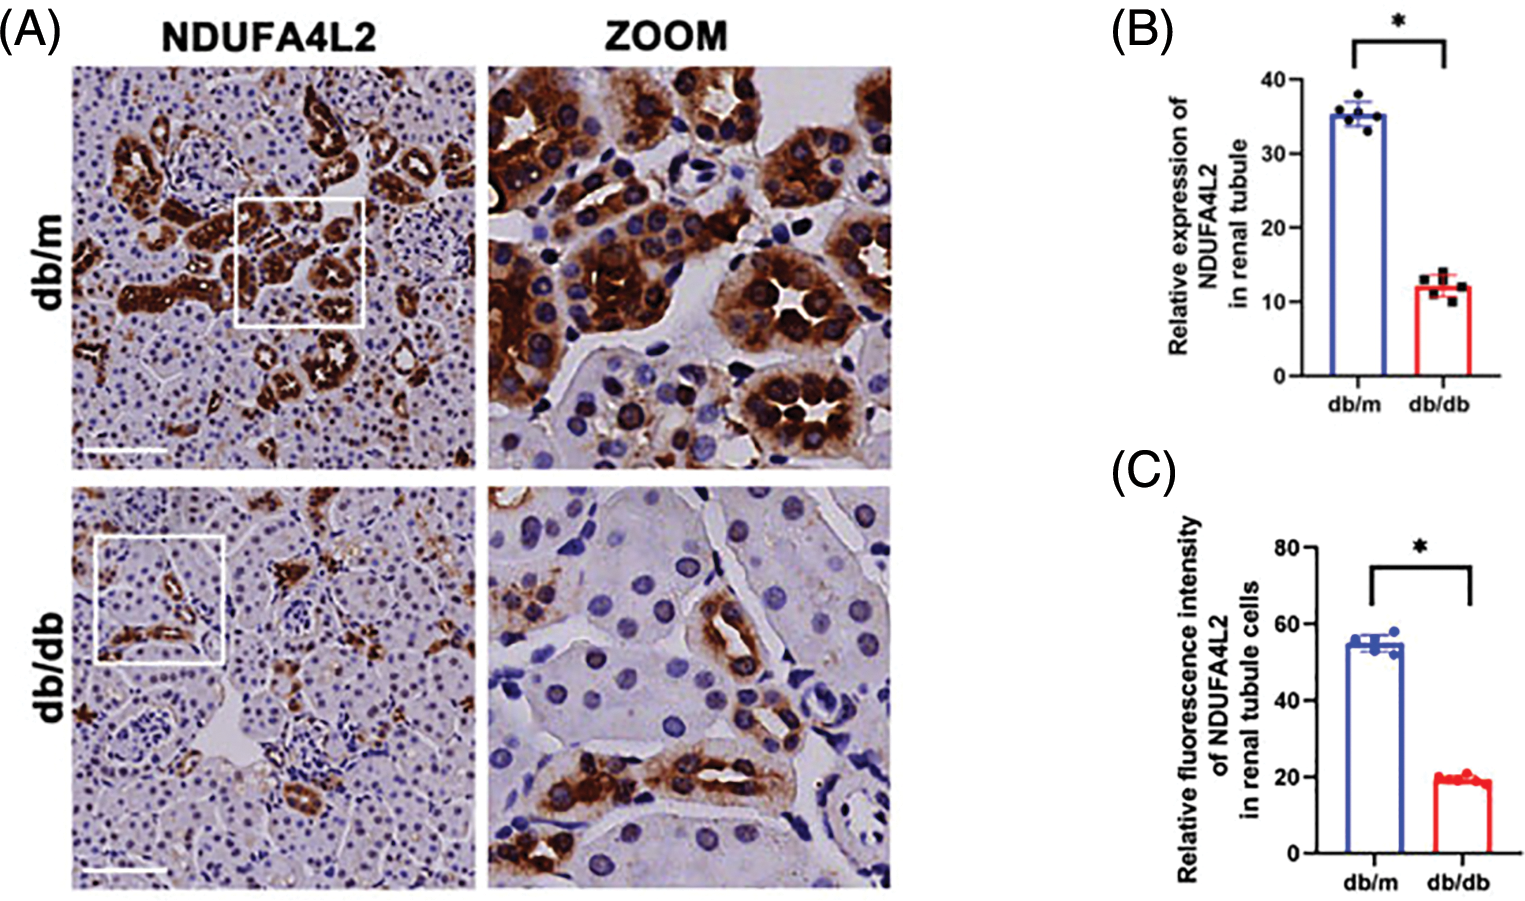
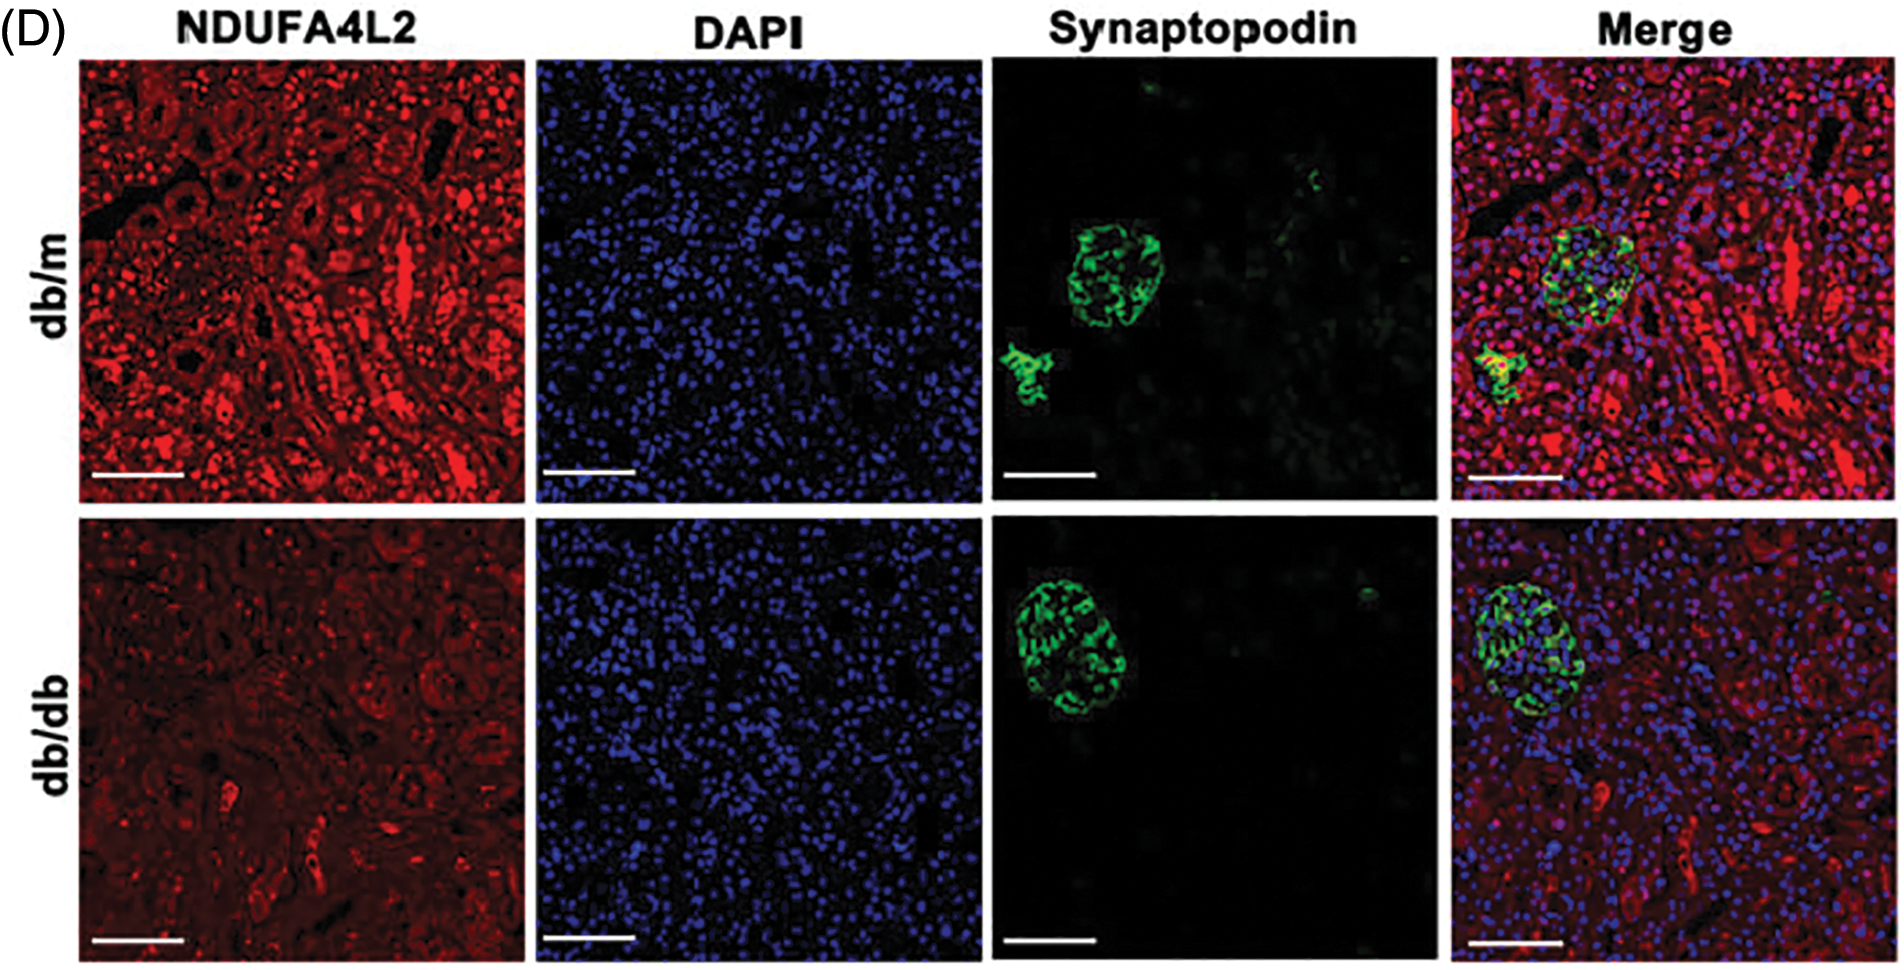
Figure 7: Experimental validation of NDUFA4L2. (A and B) Representative immunohistochemistry staining and relative quantitation of tubular NDUFA4L2 in db/m and db/db mice. (C and D) Representative immunofluorescent staining and relative quantitation of NDUFA4L2 in tubular cells in db/m and db/db mice. n = 6. *p < 0.05. Scale bars: 20 μm. NDUFA4L2: NADH dehydrogenase (ubiquinone) 1 alpha subcomplex, 4-like 2.
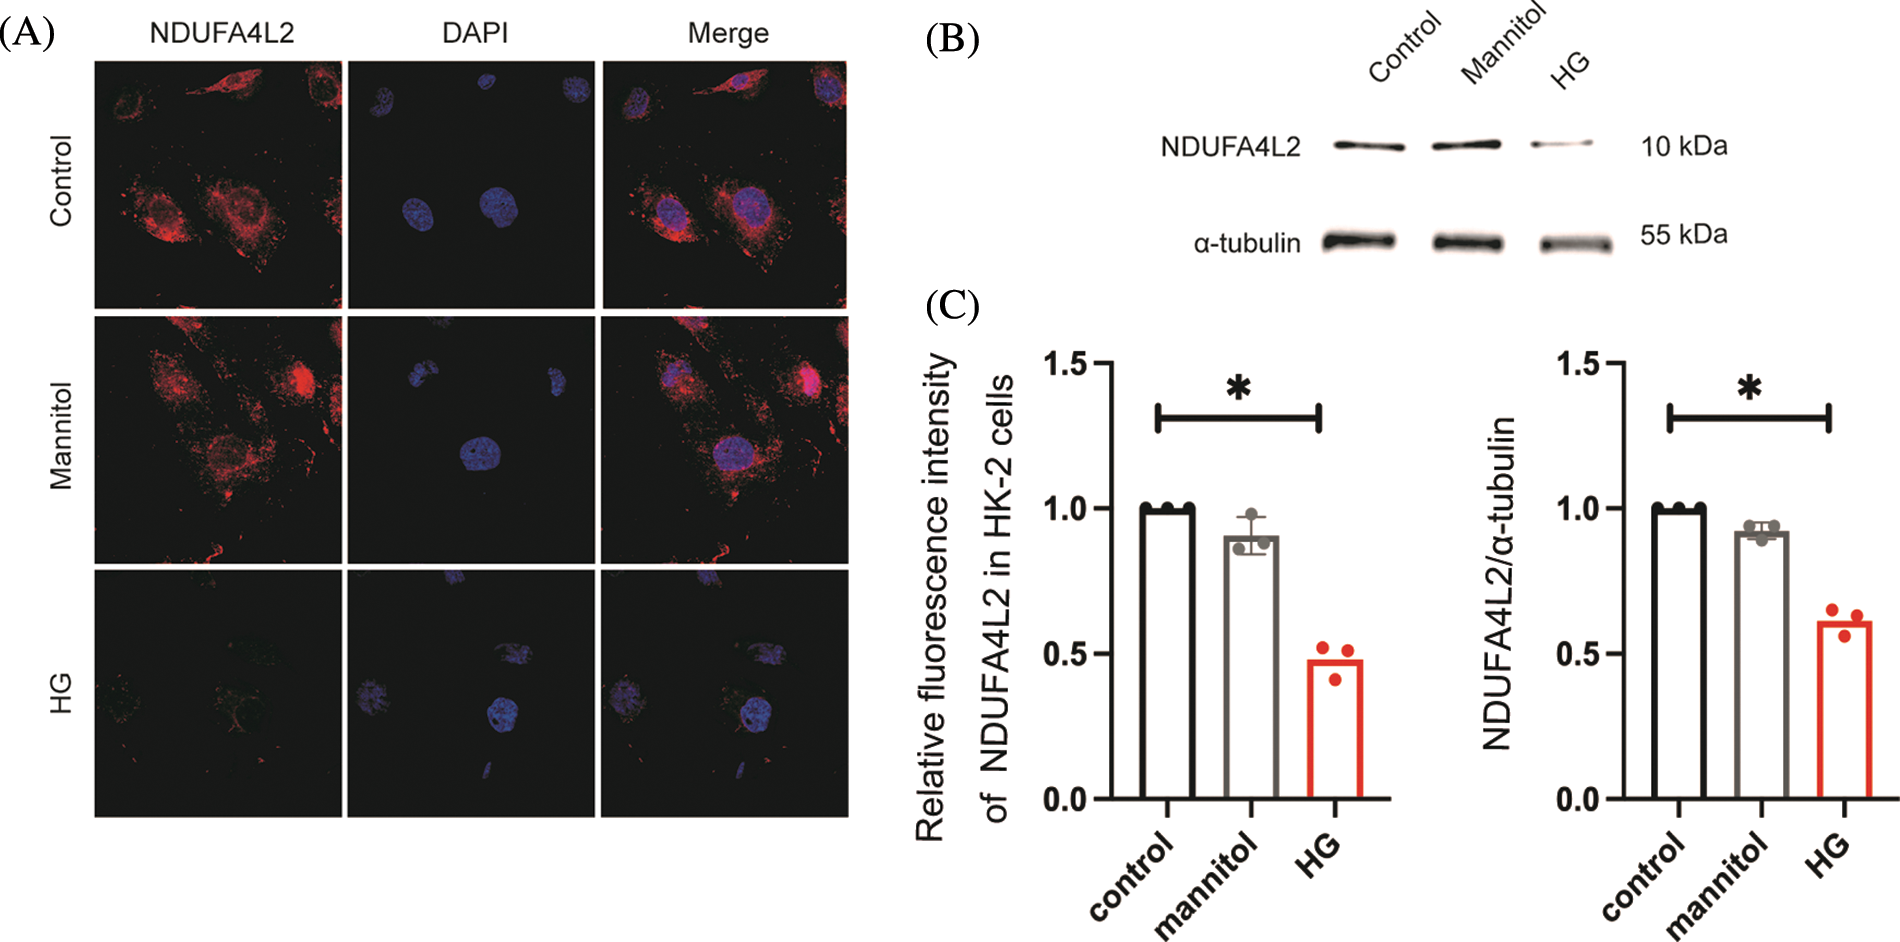
Figure 8: High glucose (HG) stimulation can downregulate the expression of NADH dehydrogenase (ubiquinone) 1 alpha subcomplex, 4-like 2 (NDUFA4L2) in HK-2 cells. (A) Immunofluorescence staining of NDUFA4L2 in each group. (B) Representative western blotting images of each group of NDUFA4L2. (C) Quantitative analysis of fluorescence intensity of NDUFA4L2. * p < 0.05, in comparison with the control.
Diabetes is the main contributing factor to DN and a significant global public health issue. Renal impairment affects 20%–30% of individuals with type 2 diabetes mellitus. (Tsai et al., 2020). DN may be the disease pathology in patients with diabetes and chronic kidney disease (CKD). The gold standard for DN diagnosis is a kidney biopsy. However, it is invasive, and many people cannot have it done because of the contraindications. We need a new non-invasive evaluation model for DN as an early diagnosis method (Zhang et al., 2022). There is a growing need for Internet of Things (IoT)-based mobile medical applications to help predict a disease (Padhy et al., 2022).
In this study, we used machine learning to find key genes as diagnostic markers for DN. The basic unit of function of the kidney is the renal unit, which in adults contains between 400,000 and 1.2 million kidney units. Renal units can be divided into renal tubules, which include the glomerulus and the renal capsule, and renal tubules, which include the proximal tubules (which can be divided into the zona and the rectum), the medullary collaterals and the distal tubules (which can be divided into the zona and the rectum). The function of the tubules is to reabsorb, secrete, and concentrate or dilute the urine, which is an essential process in the formation of urine. The primary urine, formed after glomerular filtration, enters the tubules for reabsorption and drains into the collecting ducts to form the final urine.
The pathological process of DN mainly includes changes in glomerular and renal tubules. Therefore, in this study, we obtained gene expression data in tubules by RNA-seq and obtained 297 DEGs by Limma differential analysis for subsequent analysis. We used machine learning algorithms (random forest, LASSO logistic regression, PCA) to identify key genes and used GA-BPNN to establish a DN diagnostic model. The final model was validated against external data.
The vast potential of machine learning lies in the ability to automate real-time data updates to continually teach models to improve predictive accuracy. However, real-world applications require adequate trade-offs between model accuracy, interpretability, and ease of use (Wang et al., 2021a). In this study, the ROC curve was generated based on the GA-BPNN prediction model, and an AUC value of 0.83 was obtained. The AUC value of 0.81 in the validation set indicates a good discrimination ability of the GA-BPNN prediction model. In previous studies, immune-related genes were used to identify diagnostic biomarkers. The predicted AUC value of the model was around 0.83 (Wang et al., 2021b), indicating high feasibility of finding key genes as a new non-invasive evaluation model as an early diagnosis method for DN.
In addition, an early DN nomogram prediction model was established, and the model AUC value was 0.744 (Hu et al., 2020; Zhou et al., 2022). In the future, key genes combined with clinical features as biomarkers for early biodiagnosis of DN are expected to be non-invasive and specific methods for diagnosing DN.
The GA-BPNN model contains five genetic predictors, CES1G, CYP4A14, NDUFA4, ABCC4, and ACE. Human carboxylesterase 1 (CES1), primarily expressed in the liver, has triglyceride (TG) hydrolase activity3. CES1/CES1G also contributes to metabolic regulation (Xu et al., 2017). Recent research has shown that lipid metabolism abnormalities are frequently present in patients with diabetes. Peroxisome proliferator-activated receptors (PPARs) play an essential role in insulin signal transduction and regulation of glucose and lipid metabolism (Lu et al., 2014).
Previous clinical studies have shown that siRNA-CYP4A14 can inhibit the proliferation and fibrosis of mesangial cells, which can be considered a therapeutic target for DN. Ahmed et al. (2022) found that the renin-angiotensin-aldosterone system has a key regulatory role locally, particularly in the liver and body circulation, and is also involved in the pathogenesis of type II diabetes by downregulating the phosphatidylinositol-3-kinase/protein kinase B/mammalian target of rapamycin (PI3K/AKT/mTOR) signaling pathway. The hypoglycemic effect of benzenesulfonamide derivatives is to enhance the sensitivity of the liver to regulate blood glucose levels through the PI3K/AKT/mTOR pathway (Ahmed et al., 2022). Taken together, these studies indicate that the five genes we identified may provide new therapeutic targets for the treatment of DN.
In conclusion, our study shows that the GA-BPNN model based on Lasso-logistic regression, random forest, and PCA algorithm is feasible for the diagnosis of DN. The GA-BPNN model has better accuracy than the traditional SVM model and may provide an effective tool for diagnosing DN.
Funding Statement: These studies were supported by grants from the National Natural Science Foundation of China (Grant Number: 81970631 to W.L.).
Author Contributions: The authors confirm contribution to the paper as follows: Study conception and design: Wei Liang; data collection: Zongwei Zhang, Keju Yang, Hongtu Hu; analysis and interpretation of results: Qiang Luo, Ankang Yang, Li Chang; draft manuscript preparation: Wei Liang, Li Chang; Yuanyuan Zeng. All authors reviewed the results and approved the final version of the manuscript.
Availability of Data and Materials: The datasets analyzed in the paper are available from the corresponding author on reasonable request.
Ethics Approval: All experimental protocols for animal studies were approved by the Laboratory Animal Welfare and Ethics Committee (Ethical permission number of Renmin Hospital of Wuhan University: WDRM20200603).
Conflicts of Interest: The authors declare that they have no conflicts of interest to report regarding the present study.
References
Ahmed YM, Abdelgawad MA, Shalaby K, Ghoneim MM, AboulMagd AM, Abdelwahab NS, Hassan HM, Othman AM (2022). Pioglitazone synthetic analogue ameliorates streptozotocin-induced diabetes mellitus through modulation of ACE 2/angiotensin 1-7 via PI3K/AKT/mTOR signaling pathway. Pharmaceuticals 15: 341. https://doi.org/10.3390/ph15030341 [Google Scholar] [PubMed] [CrossRef]
Blech I, Katzenellenbogen M, Katzenellenbogen A, Wainstein J, Rubinstein A, Harman-Boehm I, Cohen J, Pollin TI, Glaser B (2011). Predicting diabetic nephropathy using a multifactorial genetic model. PLoS One 6: e18743. https://doi.org/10.1371/journal.pone.0018743 [Google Scholar] [PubMed] [CrossRef]
Currie GE, von Scholten BJ, Mary S, Flores Guerrero J, Lindhardt M et al. (2018). Urinary proteomics for prediction of mortality in patients with type 2 diabetes and microalbuminuria. Cardiovascular Diabetology 17: 50. https://doi.org/10.1186/s12933-018-0697-9 [Google Scholar] [PubMed] [CrossRef]
Dhiman P, Ma J, Andaur Navarro CL, Speich B, Bullock G et al. (2022). Methodological conduct of prognostic prediction models developed using machine learning in oncology: A systematic review. BMC Medical Research Methodology 22: j2099. https://doi.org/10.1186/s12874-022-01577-x [Google Scholar] [PubMed] [CrossRef]
Garrido W, Jara C, Torres A, Suarez R, Cappelli C, Oyarzún C, Quezada C, San Martín R (2019). Blockade of the adenosine A3 receptor attenuates caspase 1 activation in renal tubule epithelial cells and decreases interleukins IL-1β and IL-18 in diabetic rats. International Journal of Molecular Sciences 20: 4531. https://doi.org/10.3390/ijms20184531 [Google Scholar] [PubMed] [CrossRef]
Horikoshi S, Fukuda N, Tsunemi A, Okamura M, Otsuki M, Endo M, Abe M (2020). Contribution of TGF-β1 and effects of gene silencer pyrrole-imidazole polyamides targeting TGF-β1 in diabetic nephropathy. Molecules 25: 950. https://doi.org/10.3390/molecules25040950 [Google Scholar] [PubMed] [CrossRef]
Hu Y, Shi R, Mo R, Hu F (2020). Nomogram for the prediction of diabetic nephropathy risk among patients with type 2 diabetes mellitus based on a questionnaire and biochemical indicators: A retrospective study. Aging 12: 10317–10336. https://doi.org/10.18632/aging.103259 [Google Scholar] [PubMed] [CrossRef]
Huang GM, Huang KY, Lee TY, Weng J (2015). An interpretable rule-based diagnostic classification of diabetic nephropathy among type 2 diabetes patients. BMC Bioinformatics 16: S5. https://doi.org/10.1186/1471-2105-16-S1-S5 [Google Scholar] [PubMed] [CrossRef]
Huang M, Zhu Z, Nong C, Liang Z, Ma J, Li G (2022). Bioinformatics analysis identifies diagnostic biomarkers and their correlation with immune infiltration in diabetic nephropathy. Annals of Translational Medicine 10: 669. https://doi.org/10.21037/atm-22-1682 [Google Scholar] [PubMed] [CrossRef]
Ishwaran H, Lu M (2019). Standard errors and confidence intervals for variable importance in random forest regression, classification, and survival. Statistics in Medicine 38: 558–582. https://doi.org/10.1002/sim.7803 [Google Scholar] [PubMed] [CrossRef]
Kapoula GV, Kontou PI, Bagos PG (2020). Diagnostic performance of biomarkers urinary KIM-1 and YKL-40 for early diabetic nephropathy, in patients with type 2 diabetes: A systematic review and meta-analysis. Diagnostics 10: 909. https://doi.org/10.3390/diagnostics10110909 [Google Scholar] [PubMed] [CrossRef]
Lai H, Huang H, Keshavjee K, Guergachi A, Gao X (2019). Predictive models for diabetes mellitus using machine learning techniques. BMC Endocrine Disorders 19: 101. https://doi.org/10.1186/s12902-019-0436-6 [Google Scholar] [PubMed] [CrossRef]
Leung RK, Wang Y, Ma RC, Luk AO, Lam V, Ng M, So WY, Tsui SK, Chan JC (2013). Using a multi-staged strategy based on machine learning and mathematical modeling to predict genotype-phenotype risk patterns in diabetic kidney disease: A prospective case-control cohort analysis. BMC Nephrology 14: 162. https://doi.org/10.1186/1471-2369-14-162 [Google Scholar] [PubMed] [CrossRef]
Liang W, Luo Q, Zhang Z, Yang K, Yang A, Chi Q, Hu H (2022). An integrated bioinformatics analysis and experimental study identified key biomarkers CD300A or CXCL1, pathways and immune infiltration in diabetic nephropathy mice. BIOCELL 46: 1989–2002. https://doi.org/10.32604/biocell.2022.019300 [Google Scholar] [CrossRef]
Liu W, Liang S, Qin X (2022). Weighted p-norm distance t kernel SVM classification algorithm based on improved polarization. Scientific Reports 12: 6197. https://doi.org/10.1038/s41598-022-09766-w [Google Scholar] [PubMed] [CrossRef]
Lu S, Jiang H, Li C, Hong B, Zhang P, Liu W (2022). Genetic algorithm for TMS coil position optimization in stroke treatment. Frontiers in Public Health 9: 794167. https://doi.org/10.3389/fpubh.2021.794167 [Google Scholar] [PubMed] [CrossRef]
Lu Y, Xu Y, Jin F, Wu Q, Shi J, Liu J (2014). Icariin is A PPARα activator inducing lipid metabolic gene expression in mice. Molecules 19: 18179–18191. https://doi.org/10.3390/molecules191118179 [Google Scholar] [PubMed] [CrossRef]
Mehta SD, Sebro R (2020). Computer-aided detection of incidental lumbar spine fractures from routine dual-energy X-ray absorptiometry (DEXA) studies using a support vector machine (SVM) classifier. Journal of Digital Imaging 33: 204–210. https://doi.org/10.1007/s10278-019-00224-0 [Google Scholar] [PubMed] [CrossRef]
Padhy S, Dash S, Routray S, Ahmad S, Nazeer J, Alam A (2022). IoT-based hybrid ensemble machine learning model for efficient diabetes mellitus prediction. Computational Intelligence and Neuroscience 2022: 1–11. https://doi.org/10.1155/2022/2389636 [Google Scholar] [PubMed] [CrossRef]
Song-men S (2022). Intelligent diagnosis method for new diseases based on fuzzy SVM incremental learning. Computational and Mathematical Methods in Medicine 2022: 1–11. https://doi.org/10.1155/2022/7631271 [Google Scholar] [PubMed] [CrossRef]
Tang B, Li W, Ji TT, Li XY, Qu X, Feng L, Bai S (2020). Circ-AKT3 inhibits the accumulation of extracellular matrix of mesangial cells in diabetic nephropathy via modulating miR-296-3p/E-cadherin signals. Journal of Cellular and Molecular Medicine 24: 8779–8788. https://doi.org/10.1111/jcmm.15513 [Google Scholar] [PubMed] [CrossRef]
Tsai I, Wu C, Hung W, Lee T, Hsuan C et al. (2020). FABP1 and FABP2 as markers of diabetic nephropathy. International Journal of Medical Sciences 17: 2338–2345. https://doi.org/10.7150/ijms.49078 [Google Scholar] [PubMed] [CrossRef]
Wang Q, Li B, Chen K, Yu F, Su H, Hu K, Liu Z, Wu G, Yan J, Su G (2021a). Machine learning-based risk prediction of malignant arrhythmia in hospitalized patients with heart failure. ESC Heart Failure 8: 5363–5371. https://doi.org/10.1002/ehf2.13627 [Google Scholar] [PubMed] [CrossRef]
Wang J, Liu F, Kong R, Han X (2022). Association between globulin and diabetic nephropathy in type2 diabetes mellitus patients: A cross-sectional study. Frontiers in Endocrinology 13: S8. https://doi.org/10.3389/fendo.2022.890273 [Google Scholar] [PubMed] [CrossRef]
Wang Y, Zhao M, Zhang Y (2021b). Identification of fibronectin 1 (FN1) and complement component 3 (C3) as immune infiltration-related biomarkers for diabetic nephropathy using integrated bioinformatic analysis. Bioengineered 12: 5386–5401. https://doi.org/10.1080/21655979.2021.1960766 [Google Scholar] [PubMed] [CrossRef]
Wilson PC, Wu H, Kirita Y, Uchimura K, Ledru N, Rennke HG, Welling PA, Waikar SS, Humphreys BD (2019). The single-cell transcriptomic landscape of early human diabetic nephropathy. Proceedings of the National Academy of Sciences 116: 19619–19625. https://doi.org/10.1073/pnas.1908706116 [Google Scholar] [PubMed] [CrossRef]
Wu LSH, Hsieh CH, Pei D, Hung YJ, Kuo SW, Lin E (2009). Association and interaction analyses of genetic variants in ADIPOQ, ENPP1, GHSR, PPAR and TCF7L2 genes for diabetic nephropathy in a Taiwanese population with type 2 diabetes. Nephrology Dialysis Transplantation 24: 3360–3366. https://doi.org/10.1093/ndt/gfp271 [Google Scholar] [PubMed] [CrossRef]
Wu D, Shen Y (2021). English feature recognition based on GA-BP neural network algorithm and data mining. Computational Intelligence and Neuroscience 2021: 1–10. https://doi.org/10.1155/2021/1890120 [Google Scholar] [PubMed] [CrossRef]
Xu R, Wu Q, Gong Y, Wu Y, Chi Q, Sun D (2022). A novel prognostic target-gene signature and nomogram based on an integrated bioinformatics analysis in hepatocellular carcinoma. BIOCELL 46: 1261–1288. https://doi.org/10.32604/biocell.2022.018427 [Google Scholar] [CrossRef]
Xu J, Xu Y, Xu Y, Yin L, Zhang Y (2017). Global inactivation of carboxylesterase 1 (Ces1/Ces1g) protects against atherosclerosis in Ldlr −/− mice. Scientific Reports 7: 948. https://doi.org/10.1038/s41598-017-18232-x [Google Scholar] [PubMed] [CrossRef]
Xu J, Zhao Y (2022). Stability analysis of geotechnical landslide based on GA-BP neural network model. Computational and Mathematical Methods in Medicine 2022: 1–10. https://doi.org/10.1155/2022/3958985 [Google Scholar] [PubMed] [CrossRef]
Xu S, Zhou Z, Lu H, Luo X, Lan Y (2014). Improved algorithms for the classification of rough rice using a bionic electronic nose based on PCA and the wilks distribution. Sensors 14: 5486–5501. https://doi.org/10.3390/s140305486 [Google Scholar] [PubMed] [CrossRef]
Yang L, Wu H, Jin X, Zheng P, Hu S, Xu X, Yu W, Yan J (2020). Study of cardiovascular disease prediction model based on random forest in Eastern China. Scientific Reports 10: 5245. https://doi.org/10.1038/s41598-020-62133-5 [Google Scholar] [PubMed] [CrossRef]
Younas H, Ijaz T, Choudhry N (2022). Investigation of angiotensin-1 converting enzyme 2 gene (G8790A) polymorphism in patients of type 2 diabetes mellitus with diabetic nephropathy in Pakistani population. PLoS One 17: e264038. https://doi.org/10.1371/journal.pone.0264038 [Google Scholar] [PubMed] [CrossRef]
Zhang W, Liu X, Dong Z, Wang Q, Pei Z et al. (2022). New diagnostic model for the differentiation of diabetic nephropathy from non-diabetic nephropathy in Chinese patients. Frontiers in Endocrinology 13: 382. https://doi.org/10.3389/fendo.2022.913021 [Google Scholar] [PubMed] [CrossRef]
Zhao S (2021). Optimization of human motion recognition information processing system based on GA-BP neural network algorithm. Computational Intelligence and Neuroscience 2021: 1–10. https://doi.org/10.1155/2021/1110503 [Google Scholar] [PubMed] [CrossRef]
Zhou DM, Wei J, Zhang TT, Shen FJ, Yang JK (2022). Establishment and validation of a nomogram model for prediction of diabetic nephropathy in type 2 diabetic patients with proteinuria. Diabetes, Metabolic Syndrome and Obesity 15: 1101–1110. https://doi.org/10.2147/DMSO.S357357 [Google Scholar] [PubMed] [CrossRef]
Zou Y, Zhao L, Zhang J, Wang Y, Wu Y et al. (2022). Development and internal validation of machine learning algorithms for end-stage renal disease risk prediction model of people with type 2 diabetes mellitus and diabetic kidney disease. Renal Failure 44: 562–570. https://doi.org/10.1080/0886022X.2022.2056053 [Google Scholar] [PubMed] [CrossRef]
Cite This Article
 Copyright © 2023 The Author(s). Published by Tech Science Press.
This work is licensed under a Creative Commons Attribution 4.0 International License , which permits unrestricted use, distribution, and reproduction in any medium, provided the original work is properly cited.
 Downloads
 Citation Tools