
 Submit a Paper
 Propose a Special lssue
 Open Access
ARTICLE

Hepatitis B virus X protein-mediated upregulation of miR-221 activates the CXCL12-CXCR4 axis to promote NKT cells in HBV-related hepatocellular carcinoma
Department of Laboratory Medicine, The First Affiliated Hospital of Chongqing Medical University, Chongqing, 400016, China
* Corresponding Author: YISHU TANG. Email:
(This article belongs to the Special Issue: Recent Advancement in Cancer Molecular Signaling)
BIOCELL 2023, 47(7), 1537-1548. https://doi.org/10.32604/biocell.2023.027205
Received 20 October 2022; Accepted 01 March 2023; Issue published 21 June 2023
 View Full Text
 Download PDF
Abstract
Backgrounds: Both hepatitis B virus X protein (HBx) and microRNA-221 (miR-221) have been implicated in the development of hepatitis B virus (HBV)-related hepatocellular carcinoma (HCC). The present study demonstrates that HBx promotes HCC cell proliferation via the C-X-C motif chemokine ligand 12-C-X-C chemokine receptor type 4 (CXCL12-CXCR4) axis. We predict that HBx/miR-221-mediated CXCL12/CXCR4 signaling induces NKT cells to promote HBV-related HCC. Methods: After miR-221 mimic, miR-221 mimic negative control, miR-221 inhibitor, miR-221 inhibitor negative control were transfected into cells, the expression of CXCL12 and miR-221 was detected by qPCR and western blot. Then we constructed a stable HBV-HCC cell line. HBV-HCC cells were injected into the nude mice, thus a HBV-HCC mouse model was constructed. Q-PCR and western blot were used to detect the expression of HBx, miR-221, CXCL12 and CXCR4 in tumor tissues. The expression of CXCL12 was detected by immunohistochemistry, and the expression of CXCR4, CD3 and CD56 was detected by immunofluorescence. The levels of CXCL12, IL-2 and TNF-α in serum of mice were detected by ELISA. Sixty-one patients with HBV-related HCC, 61 patients with HBV-related cirrhosis, 61 patients with chronic hepatitis B (CHB) and 30 healthy people were enrolled. CXCL12, cytokine levels, and clinicopathological parameters were tested. Results: Hepatitis B virus X protein upregulates the expression of miR-221 and CXCL12 in lentivirus (LV5)-HBx-transfected HepG2 cells. HBx protein promotes HepG2 cell proliferation in vitro. HBx protein promoted tumor growth via the miR-221/CXCL12/CXCR4 pathway in a mouse tumor model. HBx protein upregulated natural killer T cell expression via the CXCR4/CXCL12 pathway to promote tumor growth. The data demonstrated a positive correlation between CXCL12 concentration with Cre levels and Child-Pugh scores. CXCL12 had an inferior diagnostic efficiency compared to IL-2 and IL-6 for HBV-related HCC. Conclusions: We present evidence that HBx/miR-221-mediated CXCL12/CXCR4 signaling induces NKT cells to promote HBV-related HCC.Keywords
Hepatocellular carcinoma (HCC) is the most common type of primary liver cancer, with hepatitis B virus (HBV) infection being a major risk factor (Torre et al., 2015). The hepatitis virus X (HBx) protein, a multifunctional protein encoded by the HBV X gene, is important for HBV replication and also for the occurrence and development of HCC (Chen et al., 2015).
MicroRNAs (miRNAs) are a group of noncoding RNAs of ~21–25 nucleotides that interfere with protein translation or mRNA stability to mediate the posttranscriptional regulation of mRNAs (Li et al., 2019). Accumulating evidence suggests that miRNAs are involved in HCC tumorigenesis (Ye et al., 2020). Our earlier study confirmed that HBx could upregulate microRNA-221(miR-221) expression to promote HBV-related HCC proliferation by targeting estrogen receptor-α (Chen et al., 2015). However, the molecular mechanisms involved in the association of HBx with HBV-related hepatocarcinogenesis remain elusive.
Serum chemokines and cytokines are small proteins that are produced by various immune cells. Based on current research, chemokines and cytokines play important roles in inflammation and tumor immunity in HCC patients.
C-X-C motif chemokine ligand 12 (CXCL12) is a member of the CXC chemokine family (Zhong et al., 2019). CXCL12 promotes the survival or growth of various normal and malignant cells, including leukemia B cells, germ cells, hematopoietic progenitors, and breast carcinoma cells (Wang et al., 2017). C-X-C chemokine receptor type 4 (CXCR4), a G-protein coupled receptor for CXCL12, is expressed on the surface of pericytes and endothelial precursor cells (Qin et al., 2018). The expression of CXCR4 can be affected by CXCL12 in cancer cells. Interaction of CXCL12 with its receptor CXCR4 can induce chemotaxis, cell survival, and/or proliferation (Gao et al., 2018; Liu et al., 2019). Studies have recently shown that the CXCL12/CXCR4 interaction increases tumorigenesis, invasion, proliferation, and metastasis to various organs, such as the lung, liver, and bone marrow (Tatituri et al., 2013).
Natural killer T (NKT) cells are a group of special T lymphocytes that express both T-cell receptors and NK cell receptors. NKT cells recognize lipid antigens presented by CD1d molecules (Zhang et al., 2017; Ma et al., 2018). The liver is an immune organ that contains 20~100 times more NKT cells than other organs, and these NKT cells in the liver could participate in the immune response of liver cancer (Liu et al., 2015). NKT cells can induce both pro- and antitumor effects in the immune response of HCC (Pinato et al., 2016; Gao et al., 2018).
However, the understanding of the molecular mechanisms of the CXCL12/CXCR4 pathway and NKT cells in the invasion and metastasis of HBV-related HCC is still limited. The relationship of miR-221, the CXCL12/CXCR4 axis, and NKT cells is also not clear in HBV-related HCC. The findings of this study demonstrated that the HBx/miR-221/CXCL12/CXCR4/NKT cell axis could serve as a prognostic indicator for patients with HBV-related HCC.
Sixty-one patients with HBV-related HCC were enrolled at The First Affiliated Hospital of Chongqing Medical University. The diagnostic standard was based on the current guidelines by the American Association for the Study of Liver Diseases (AASLD) and included alpha-fetoprotein (AFP) >200 ng/mL, magnetic resonance imaging (MRI), and contrast-enhanced computed tomography (CT). None of the patients had undergone surgery, radiotherapy, or chemotherapy. Patients with concomitant autoimmune disease or other cancer history within the last 5 years were excluded from the study. Moreover, 61 patients with HBV-related cirrhosis were enrolled in our study. The diagnostic criteria included measurements of indicators of liver function, such as procollagen type III, collagen type IV, laminin, and hyaluronidase and HBV-DNA and ultrasound images. A total of 61 patients with chronic hepatitis B (CHB) were recruited in this study. The criteria for CHB consisted of HBsAg positivity, HBV-DNA ≥1000 copies/mL, and increased aspartate aminotransferase (AST) or alanine aminotransferase (ALT) levels (>40 IU/mL). Patients with autoimmune liver disease, other viral infections, other tumors, alcoholic liver disease, and other infectious diseases were excluded from our study. In total, 30 healthy people (mean age 53.72 ± 9.56 years) with no liver disease history were recruited as random controls. The study was approved by the hospital ethics committee. Consent was obtained from all individuals enrolled in this study.
Data acquisition and sample procession
The clinical characteristics of HBV-related HCC patients, HBV-related cirrhosis patients, CHB patients, and healthy controls were obtained from electronic medical records. Laboratory parameters of the patients were acquired from the hospital system. Serum was separated from the peripheral venous blood of each group and stored at −80°C. Serum samples were thawed only once.
Enzyme-linked immunosorbent assay (ELISA)
The levels of serum CXCL12 in each group, including the healthy control group, were detected using ELISA kits (R&D Systems, Inc., Minneapolis, MN, USA). Each sample was assayed in triplicate, and the average value was calculated. The concentrations of CXCL12 were analyzed on the basis of the standard curve.
Chemiluminescent enzyme immunoassay (CLEIA)
The levels of cytokines such as interleukin (IL)-2, IL-6, and tumor necrosis factor-alpha (TNF-α) were detected by the IMMULITE® 1000 system (Siemens, Erlangen, Germany), which is a small benchtop immunoassay analyzer. Each sample was assayed in triplicate, and the mean value was calculated.
HepG2 cells were purchased from the American Type Culture Collection. The cells were cultured in minimum essential medium (HyClone, Logan, USA) supplemented with 10% fetal calf serum, 1 mM sodium pyruvate, 100 U/ml penicillin-streptomycin, and 2 mmol/L glutamine solution at 37°C in a 5% CO2 incubator.
Hepatic tissue specimens were obtained from HCC patients chronically infected with HBV at the First Affiliated Hospital of Chongqing Medical University. The specimens were formalin-fixed and paraffin-embedded. All of the tissue specimens were collected after consent was obtained from the patients.
Construction of the adenovirus-hepatitis B virus X protein (Ad-HBx) adenovirus and infection of HepG2 cells
Ad-HBx adenoviruses were established using the AdEasy system. HepG2 cells in 2 mL of complete medium were added to a 6-well plate at 2.0 × 10⁵ cells/well and incubated overnight. Ad-HBx adenoviruses were transfected into HepG2 cells at an MOI of 50. The transfection efficiency was assessed by evaluating enhanced green fluorescent protein (EGFP) expression under a fluorescence microscope after 48 h.
Semiquantitative reverse transcription-polymerase chain reaction (PCR)
Cells transfected with adenovirus were harvested after 48 h. We used TRIzol reagent (Invitrogen, Carlsbad, USA) to extract total RNA. First-strand cDNA was synthesized using oligo (dT) 12-18 primers and SuperScript II RNase H-Reverse Transcriptase (both from Invitrogen, Carlsbad, USA) according to the manufacturer’s instructions. The target cDNA was amplified with Taq polymerase (Invitrogen, Carlsbad, USA) for 28–30 cycles. PCR was performed using the following primers: P1 and P2 for HBx and P3 and P4 for GAPDH: P1, 5′-ACCGACCTTGAGGCCTACTT-3′ and P2, 5′-GCTTGGCAGAGGTGAAAAAG-3′; P3, 5′-GAGTCAACGGATTTGGTCGT-3′ and P4, 5′-TTGATTTTGGAGGGATCTCG-3′. Each sample was analyzed by electrophoresis, and the resulting gel was imaged using a gel documentation system (Bio-Rad, Hercules, USA).
MiRNA isolation and quantitative reverse transcription-polymerase chain reaction
We used the mirVana PARIS kit (Applied Biosystems, Inc., Carlsbad, USA) to isolate total RNA from HepG2 cells according to the manufacturer’s recommendation. miR-221 was quantified with the TaqMan miRNA assay kit (Applied Biosystems, Inc., Carlsbad, USA). We used U6 small nuclear RNA as an internal control to analyze the relative expression level of miRNA with the 7500HT Sequence Detection System (P/N: 4329002) (both from Applied Biosystems, Inc., Carlsbad, USA). The miR-221 expression level was determined by calculating Δ Ct (Ct of miR-221-Ct of U6).
We used a protein extraction reagent (Cell Signaling Technology, Inc., Boston, USA) to lyse the cells. The lysates were resolved by sodium dodecyl sulfate-polyacrylamide gel electrophoresis and transferred to PVDF membranes (Millipore, Billerica, MA, USA). The membranes were blocked with 5% nonfat dry milk and incubated with antibodies (sc-2004 and sc-2005, Santa Cruz Biotechnology, Santa Cruz, USA) according to the standard western blot protocol. Bands were visualized using an ECL detection system (GE, Healthcare, Chalfont St Giles, UK).
HepG2 cells were infected with the miR-221 inhibitor, miR-221 mimic, and negative control pre-miR (Qiagen, Valencia, CA, USA) using HiPerFect transfection reagent (Qiagen, Valencia, CA, USA).
HepG2 cells (4 × 10³) were seeded in 96-well plates and then infected. Cell proliferation was documented every 24 h for 3 days using a cell counting kit (Dojindo, Shanghai, China), and absorbance at 450 and 610 nm was evaluated using a SpectraMax 190 microplate reader (Molecular Devices, Sunnyvale, CA, USA).
Cells obtained from HBV-related HCC patients were washed and incubated with NK1.1-allophycocyanin (apc), anti–NK1.1-P-phycoerythrin(PE), anti–β-TCR-fluorescein isothiocyanate (FITC), and anti–CD4-peridinin chlorophyll protein (PerCP) antibodies. For intracellular staining, the cells were fixed with 4% paraformaldehyde, washed, permeabilized using the Cytofix/Cytoperm BD kit following the manufacturer’s instructions, and then further incubated with anti–IL-4 or anti–IFN-γ (both were Alexa Fluor 488- or PE-conjugated) (BD Biosciences, San Jose, USA). The cells were washed and analyzed by fluorescence-activated cell sorting (FACS) on a FACS Calibur flow cytometer using CellQuest software (BD Biosciences, San Jose, USA).
Nonobese diabetic/severe combined immunodeficiency (NOD-SCID) mice aged 6–8 weeks were purchased from and housed at Chongqing Medical University. All mice were housed under specific pathogen-free conditions. All animal experiments were approved by the Animal Care and Use Committee of Chongqing Medical University and performed according to the animal protection laws of China and applicable guidelines.
Female HepG2-HBx mice (6–8 weeks old, n = 5) were injected subcutaneously with AMD3100 (1.25 mg/kg in 100 µL of phosphate buffered-saline (PBS), n = 5) or PBS (n = 3).
Tumor models and treatment protocol
For the in vivo therapeutic experiment, 5 × 10⁵ HepG2-HBV cells were inoculated subcutaneously into the right flanks of NOD-SCID mice on day 0. When the tumor reached an average diameter of ~5 mm on day 4, the mice were randomized and treated with AMD 3100 (anti-CXCR4) in 0.1 mL of PBS or PBS alone. Similar treatments were repeated on days 8 and 12. Tumors were monitored every 3 days by measuring their dimensions using calipers and calculating their volumes according to the following formula: tumor volume (mm3) = 0.52 × (length × width2).
The cells from each well were harvested 48 h after transfection, washed, and then fixed with 70% cold ethanol for at least 1 h. The cells were stained with propidium iodide. The cell cycle distribution was examined by a FACS flow cytometer, and DNA histograms were analyzed with modified software.
The 3′-upstream translated region (3′UTR) of the candidate gene was cloned and inserted downstream of the luciferase gene in the pGL3/luciferase vector. The mutant 3′UTR of the candidate gene was cloned using the wild-type 3′UTR as a template and inserted into pGL3/luciferase as described for the wild-type 3′UTR. The cells were cotransfected with miRNA mimics and the wild-type or mutant 3′UTR of the candidate gene. Luciferase activity was determined 48 h after transfection using the Dual-Luciferase Reporter Assay System (Promega).
The resected specimens of mouse tumors were fixed with 10% formaldehyde and embedded in paraffin. The sections were dewaxed for antigen retrieval, inactivated, and sealed. The slides were blocked in PBS plus 10% normal goat serum for 30 min and then incubated with anti-CXCR4, anti-CD3, anti-CD56, and anti-CXCL12 antibodies (Cell Signaling Technology, Inc., Boston, USA) for 2 h at 37°C. Polymer Hepler (Santa Cruz Biotechnology, Santa Cruz, CA, USA) was incubated for 20 min at room temperature, followed by incubation with polyperoxidase-anti-mouse/rabbit IgG (Santa Cruz Biotechnology, Santa Cruz, CA, USA) for 30 min. After rinsing with PBS, all sections were visualized with 0.05% 3,3′-diaminobenzidine. The sections were then counterstained with hematoxylin. The immunohistochemically stained tissue sections were reviewed based on the intensity and the number of cells stained.
RNA isolation and reverse-transcription polymerase chain reaction from tumor samples
Total RNA was extracted with TRIZOL (Invitrogen, Carlsbad, USA), and 0.05 µg of total RNA was used for reverse transcription using the TaqMan MicroRNA reverse transcription kit (Applied Biosystems, Inc., Carlsbad, USA). PCR was performed using the following primers P1 and P2 for HBx: P1: 5′-ACCGACCTTGAGGCCTACTT-3′ and P2: 5′-GCTTGGCAGAGGTGAAAAAG-3′. The upstream and downstream primer sequences for CXCL12 were 5′-TCCCCTTGTGTGTTTTGGCAGT-3′ and 5′-TTGCATCTCCCACGGATGTC-3′, respectively, and the amplified fragment length was 226 bp. The upstream and downstream primer sequences for CXCR4 were 5′-TCAGTGGCTGACCTCCTCTT-3′ and 5′-TTTCAGCCAGCAGTTTCCTT-3′, respectively, and the length of the amplified fragment was 219 bp. The upstream and downstream primer sequences for GAPDH were 5′-ACCCAGAAGACTGTGGATGG-3′ and 5′-TCTAGACGGCAGGTCAGGTC-3′, respectively, and the length of the amplified fragment was 209 bp. After reverse transcription, PCR was performed with the following conditions: 94°C for 3 min; 94°C for 30 s; 60°C for 30 s; 72°C for 30 s; 35 cycles; 72°C for 1 min.
All results were analyzed using SPSS 19.0 (SPSS, Inc.). Measured data are expressed as the mean ± standard error of the mean. The differences between groups were compared using a t-test. The differences among multiple groups were compared using one-way ANOVA with Tukey’s multiple comparison post hoc test. A value of p < 0.05 was considered to indicate a statistically significant difference.
Hepatitis B virus X protein upregulates the expression of miR-221 and C-X-C motif chemokine ligand 12 in lentivirus (LV5)-HBx-transfected HepG2 cells
We transfected LV5-HBx or LV5-GFP into HepG2 cells at an MOI of 50 and evaluated the infection efficiency using a fluorescence microscope (Fig. 1A). Western blotting analysis indicated that the LV5-HBx-infected cell model was successfully established for subsequent studies (Fig. 2D). We used semiquantitative reverse transcription-PCR to confirm the expression levels of CXCL12 and miR-221. As shown in Figs. 1B and 1C, the expression of miR-221 and CXCL12 was upregulated after the HBx transfection of HepG2 cells.
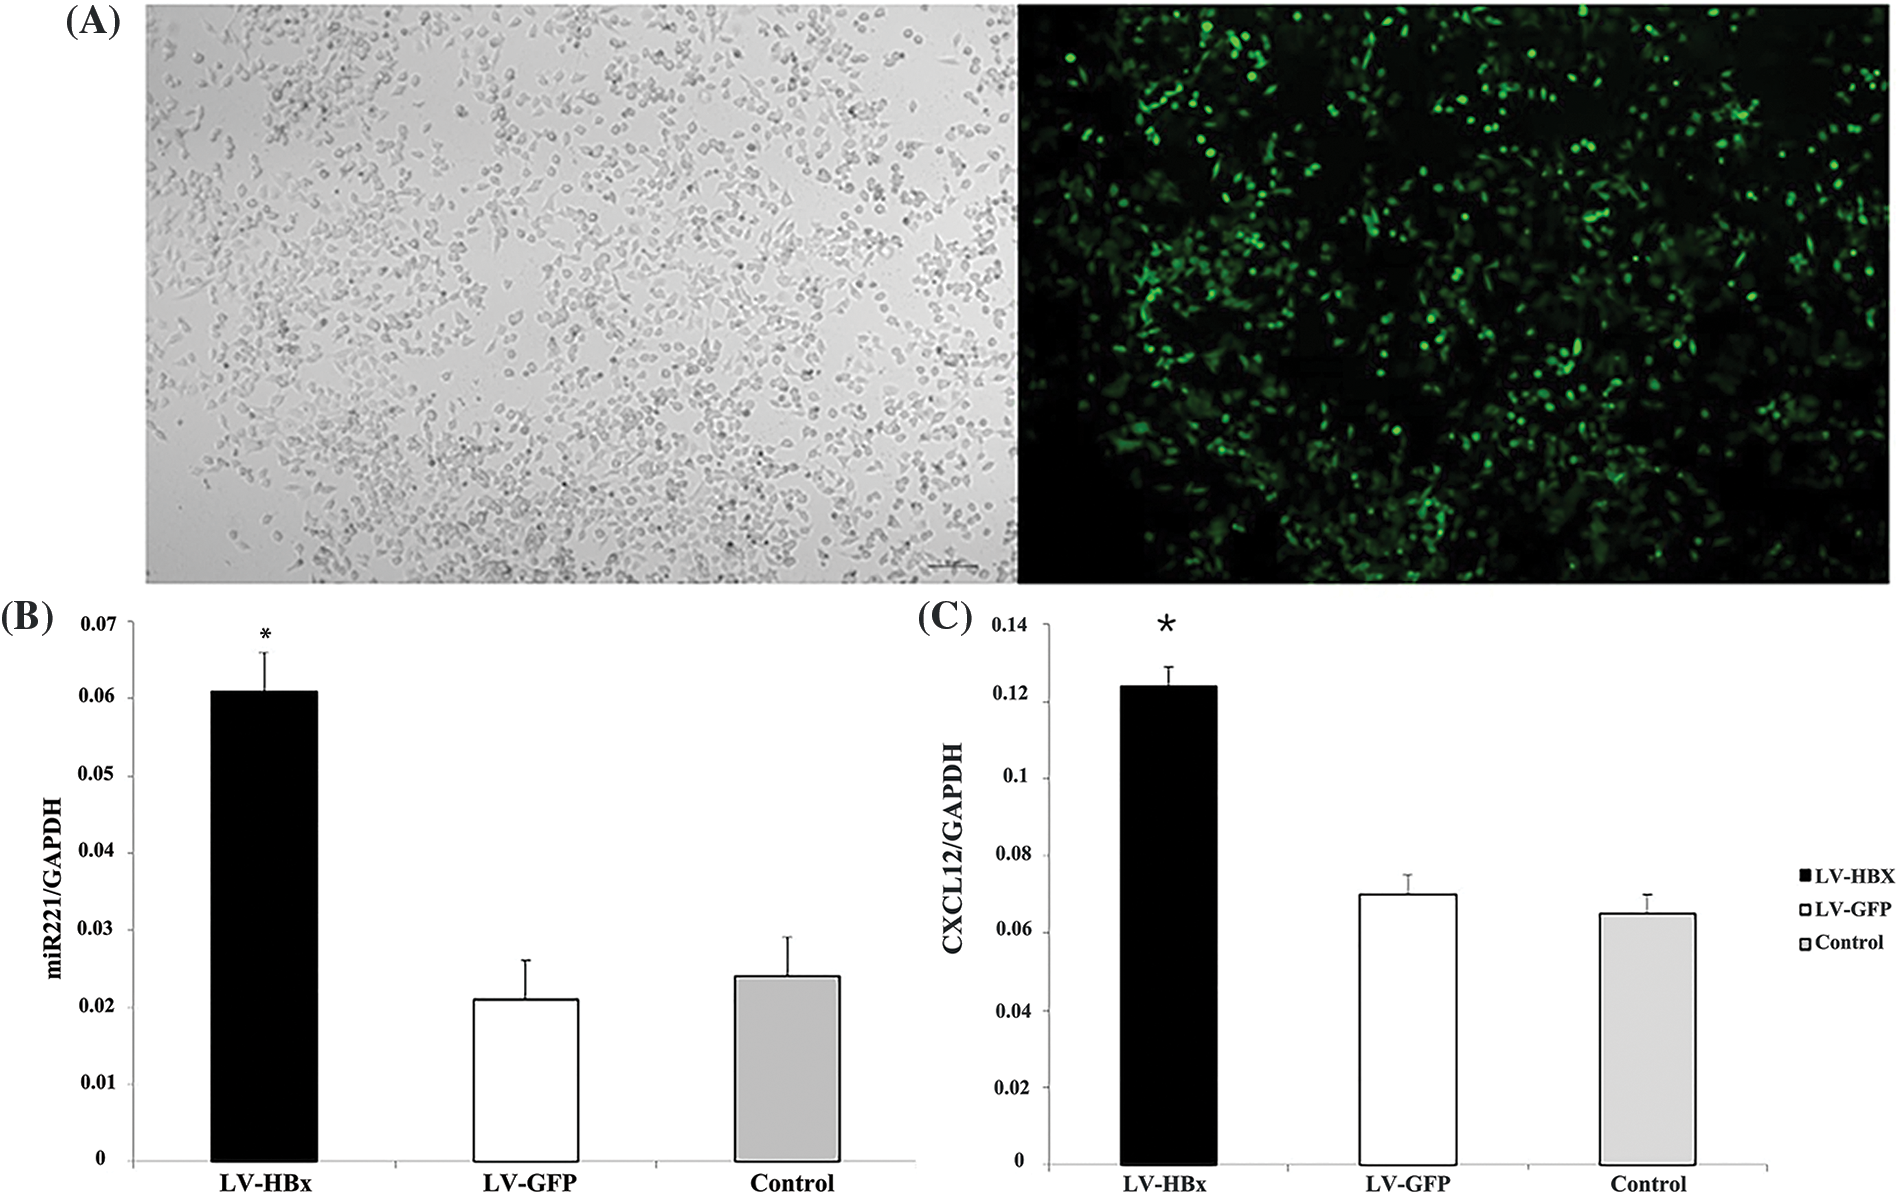
Figure 1: Lentivirus (LV5)-HBx-infected HepG2 cells. HepG2 cells were infected with the LV5-HBx virus or the control LV5-GFP virus. (A) The infection efficiency was evaluated by observing green fluorescent protein (GFP) expression under a fluorescence microscope. (B) The expression of miR-221 was determined by quantitative real-time-polymerase chain reaction (qRT‒PCR) analysis in HepG2 cells. The glyceraldehyde 3-phosphate dehydrogenase gene (GAPDH) was used as an internal control. The experiment was repeated three times. (C) C-X-C motif chemokine ligand 12 (CXCL12) expression in the HepG2 cells was determined by RT‒PCR analysis. GAPDH was used as an internal control. LV-HBx: Ad-HBx-infected HepG2 cell group; LV-GFP: GFP-infected HepG2 cell group; control: HepG2 cell group. *p < 0.05 vs. the LV-GFP group. The experiment was repeated three times.
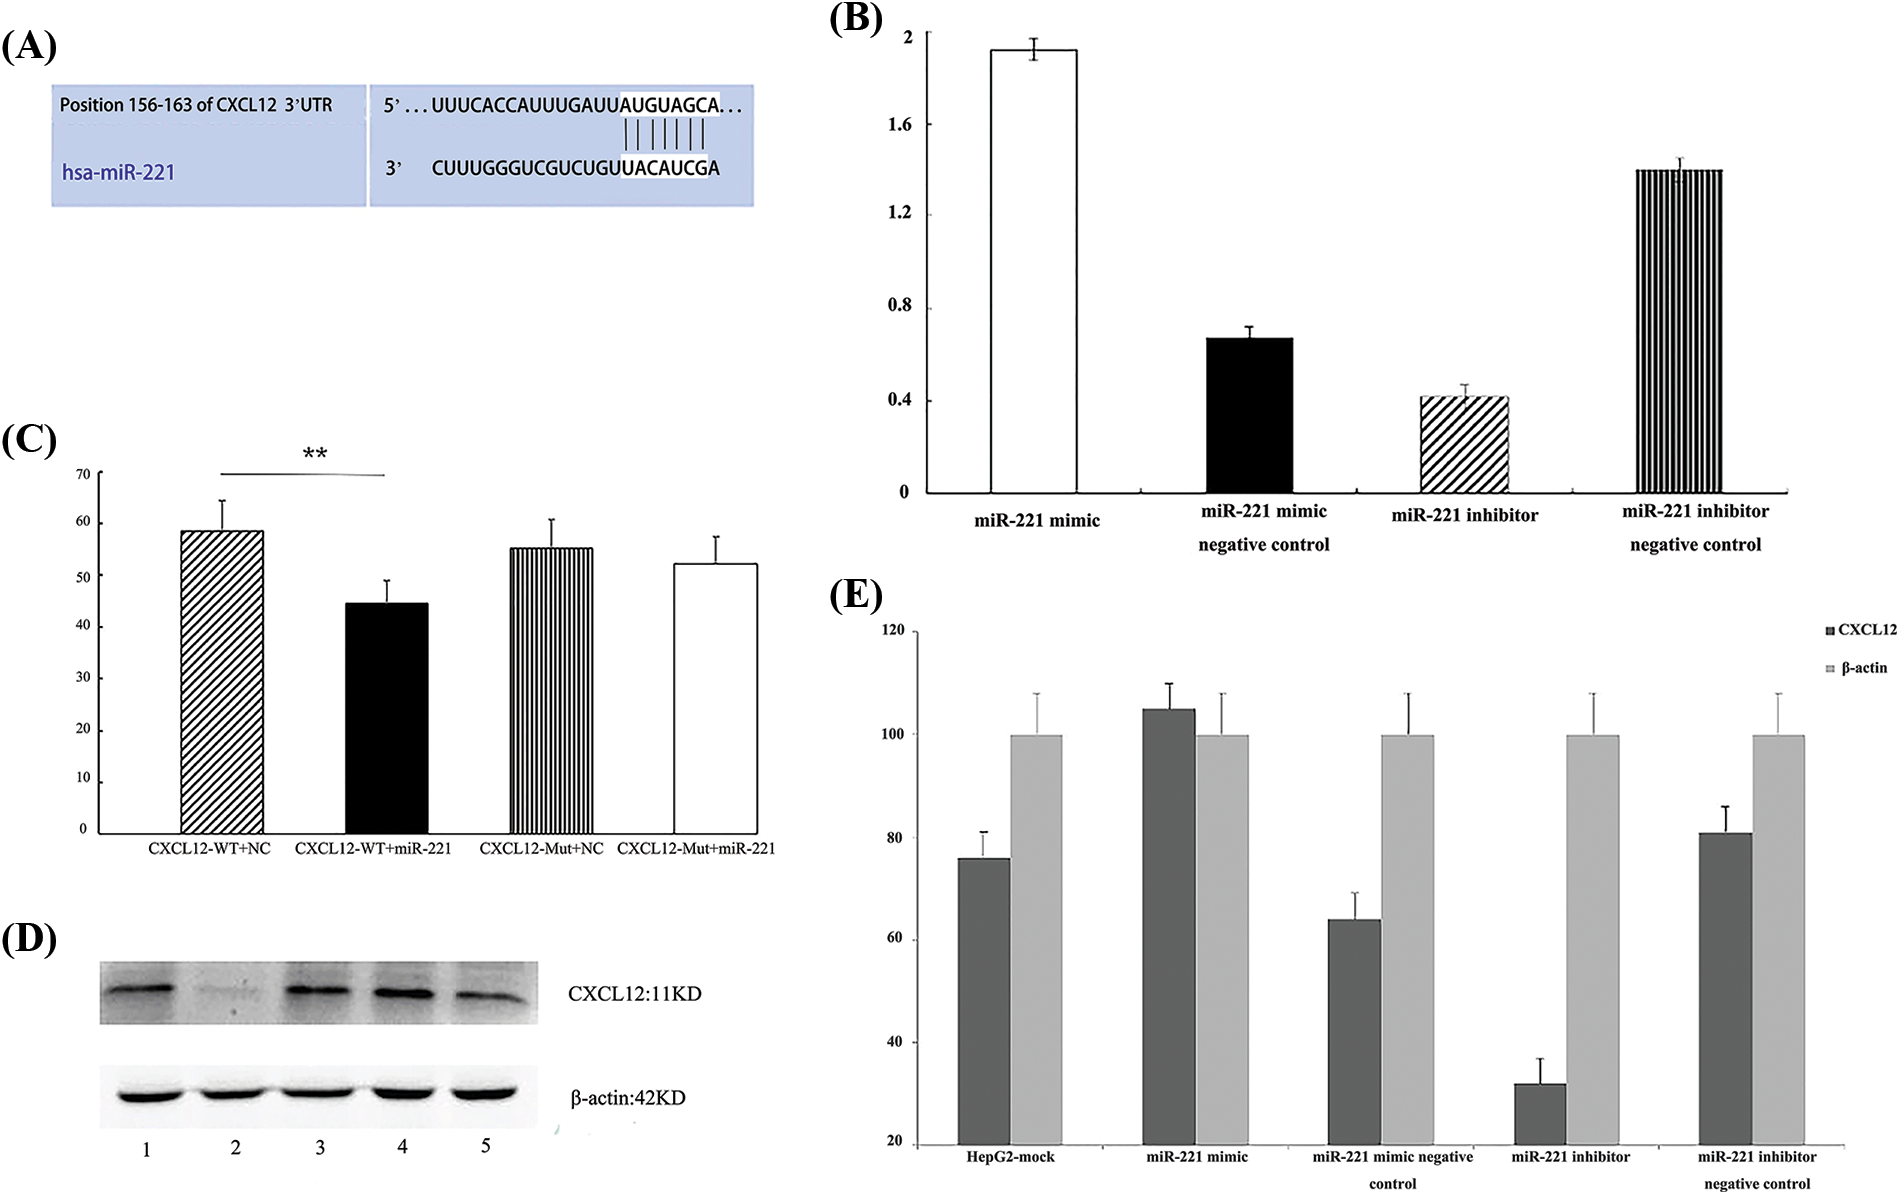
Figure 2: C-X-C motif chemokine ligand 12 (CXCL12) is a direct target of miR-221. (A) The predicted duplex formation between human CXCL12 and miR-221 is shown, and the 3′-upstream translated region (3′UTR) of human CXCL12 contains a conserved binding site for miR-221 from different species. (B) Real-time-polymerase chain reaction (RT‒PCR) results demonstrated the effect of the miR-221 mimic and miR-221 inhibitor on the RNA level of CXCL12 in HepG2 cells. The experiment was repeated three times. (C) A luciferase assay indicated that miR-221 targeted the CXCL12 wild-type 3′UTR but not the CXCL12 mutant 3′UTR; *p < 0.05. (D and E) The effects of the miR-221 mimic and miR-221 inhibitor on the protein level of CXCL12 were determined by western blot in HepG2 cells. 1: HepG2-mock; 2: miR-221 inhibitor; 3: miR-221 inhibitor negative control; 4: miR-221 mimic; 5: miR-221 mimic negative control. The experiment was repeated three times.
C-X-C motif chemokine ligand 12 is a direct target of miR-221
Bioinformatic analysis demonstrated that the 3′UTR of CXCL12-encoding mRNA contains a sequence partially complementary to the miR-221 sequence (Fig. 2A). Next, the miR-221 mimic or the inhibitor was transiently transfected into cells. The luciferase reporter assay demonstrated that miR-221 inhibited the luciferase activity of the wild-type 3′UTR reporter, but it had no effect on the luciferase activity of the mutant 3′UTR reporter (Fig. 2C).
Furthermore, cells were transfected with the miR-221 mimic, miR-221 mimic negative control, miR-221 inhibitor, and miR-221 inhibitor negative control to establish the roles of miR-221 in regulating CXCL12. The results demonstrated that miR-221 upregulated CXCL12 at the gene (Fig. 2B) and protein (Figs. 2D and 2E) levels.
Hepatitis B virus X protein promotes HepG2 cell proliferation in vitro and tumor growth in vivo via the CXCL12/CXCR4 axis
After HepG2 cells were transfected with LV5-HBx, cell proliferation assays indicated significant promotion growth in LV5-HBx-infected cells (Fig. 3B). To determine whether HBx promoted the proliferation of HCC cells via CXCL12/CXCR4 axis, we blocked this axis with an anti-CXCR4 antibody. Cell viability assays and FACS cell cycle analysis indicated that the growth of LV5-HBx-infected cells was inhibited in the anti-CXCR4 antibody-treated group (Figs. 3A and 3B). To evaluate the effect of HBx transfection on the cell cycle profile, the cells were examined by flow cytometry. A clear increase in the proportion of cells in the S-phase was observed in the HBx transfection group compared with the control transfection group (43.6% vs. 23.1%). However, when we used an anti-CXCR4 antibody to block the CXCL12/CXCR4 axis, the proportion of cells in the S-phase decreased to 19.8% (Fig. 3B). Western blot after LV5-HBx infection of HepG2 cells showed that the CXCL12 protein level decreased after anti-CXCR4 antibody was added to HBx-transfected HepG2 cells (Figs. 3C and 3D). Our results confirmed that HBx promoted HCC cell proliferation via the CXCL12/CXCR4 axis.
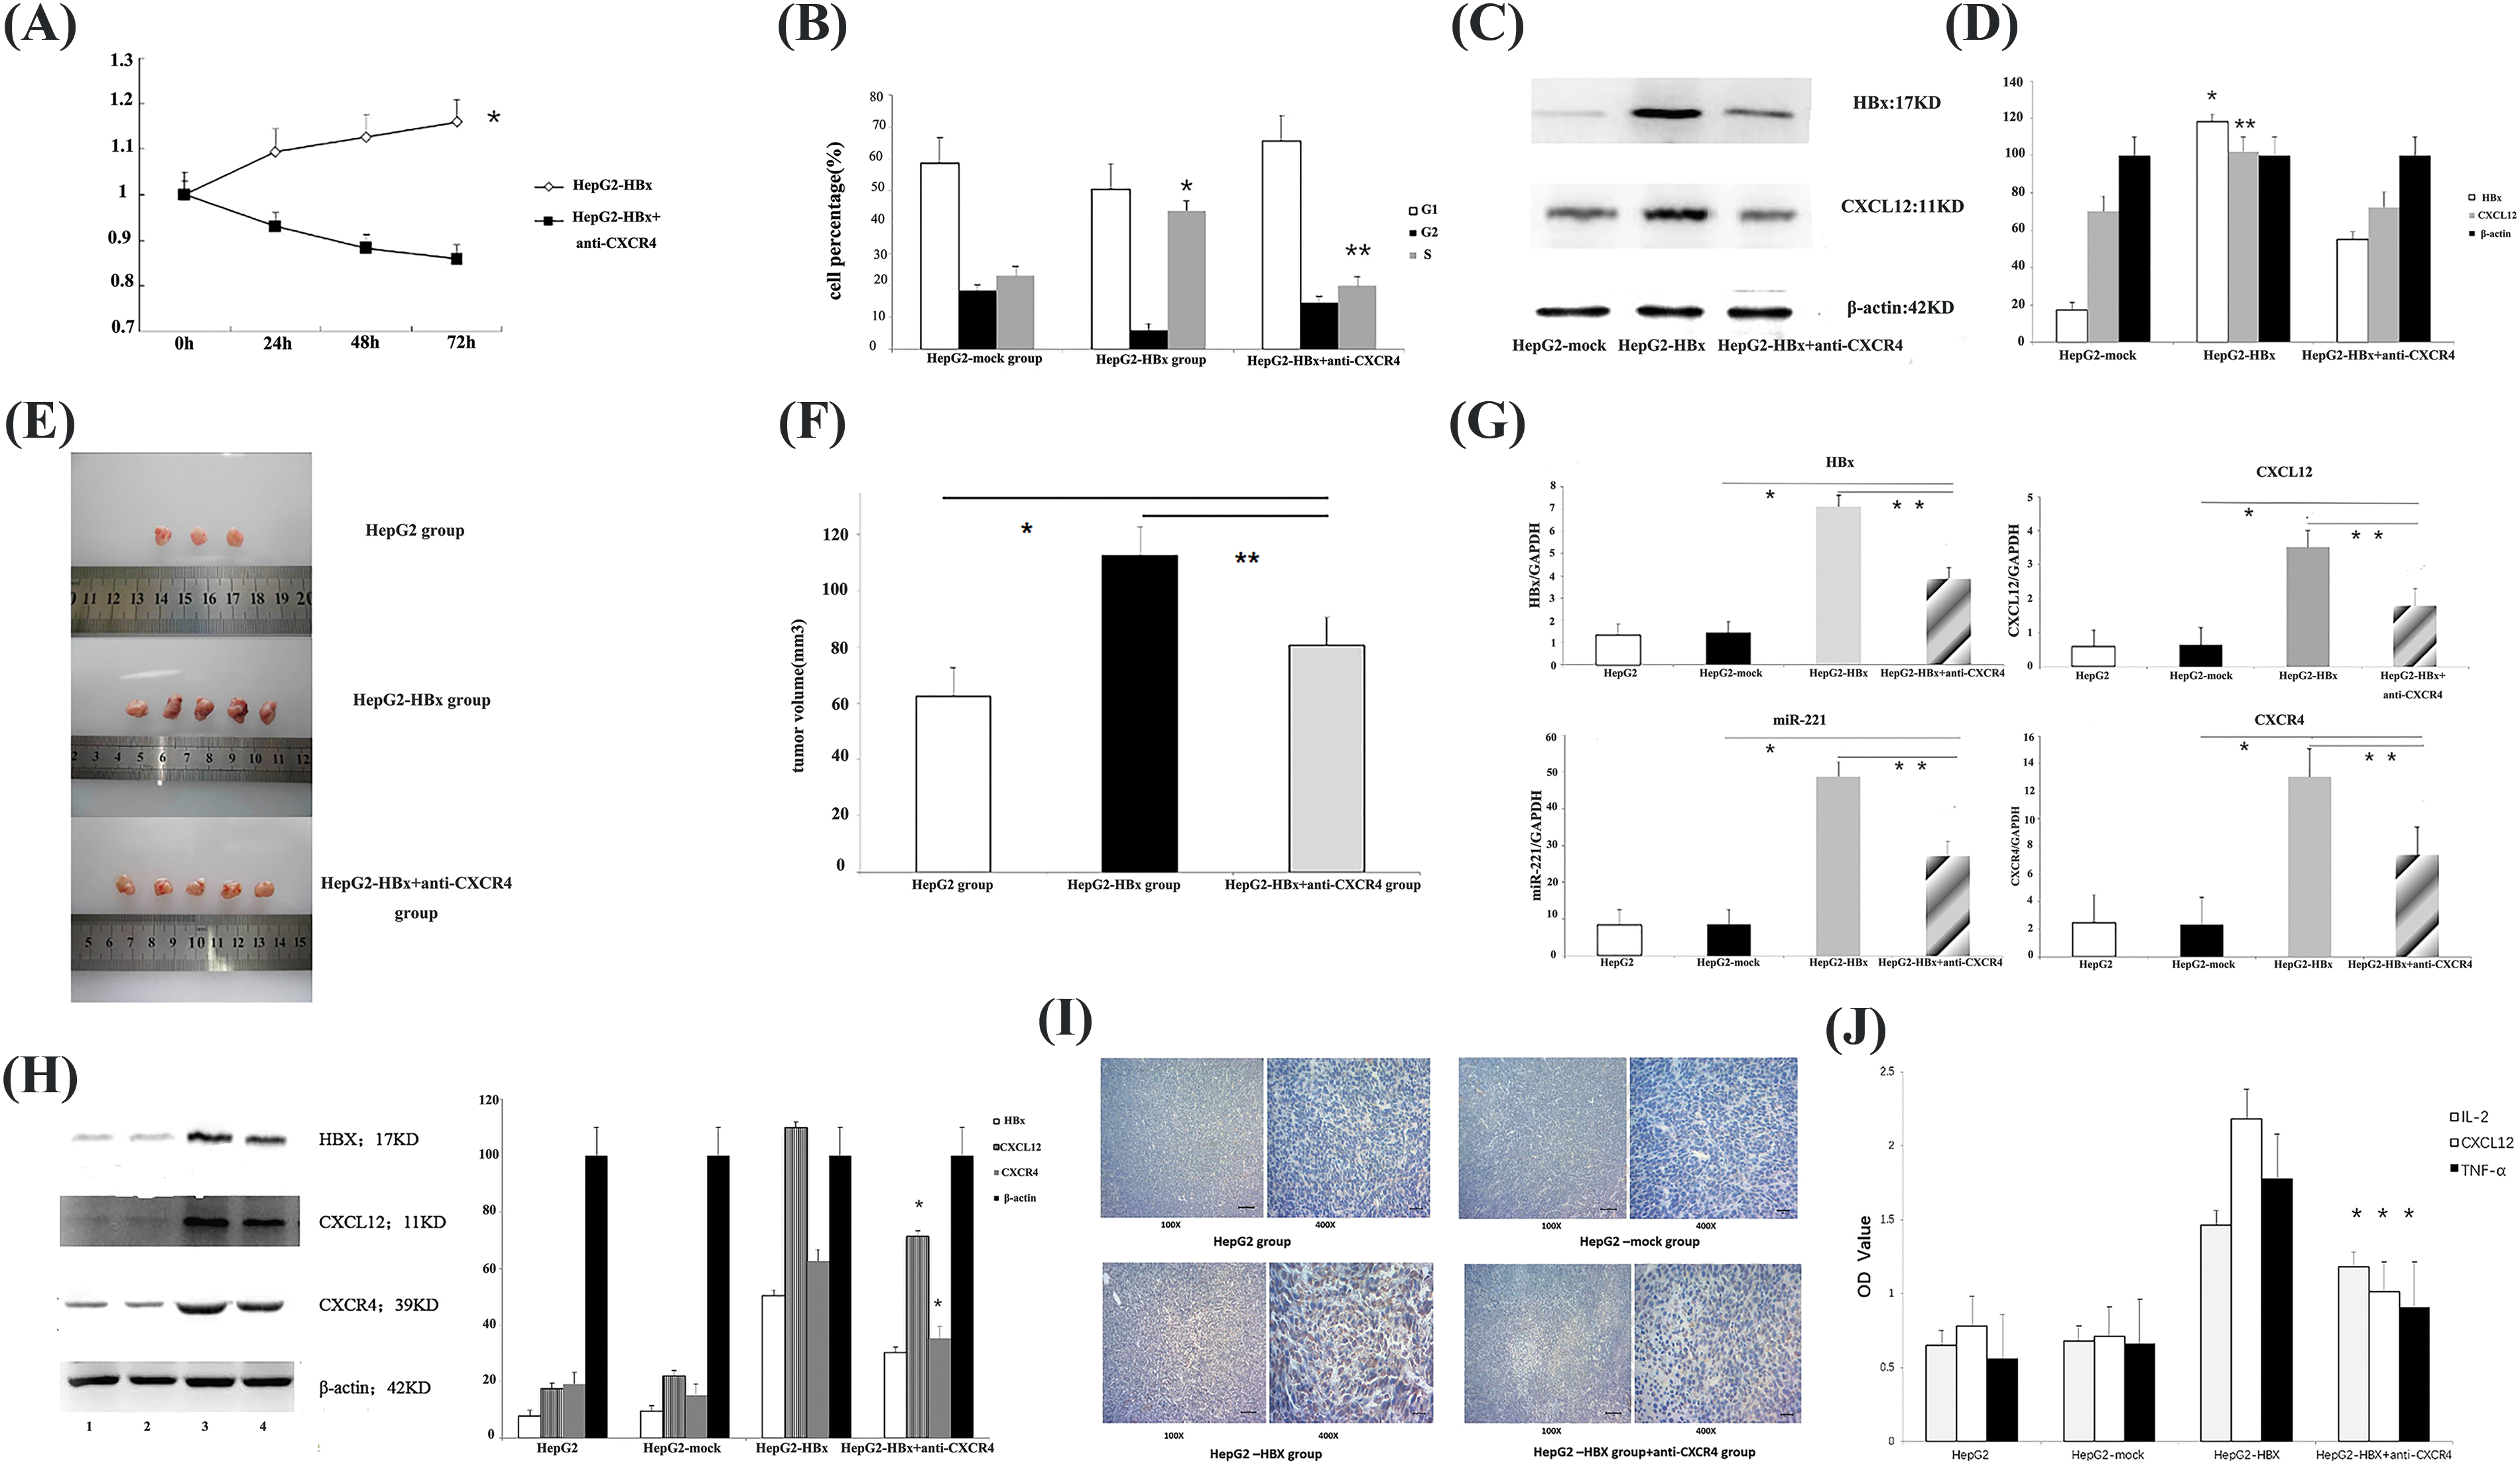
Figure 3: HBx promoted HepG2 cell proliferation in vitro and tumor growth in vivo via the miR-221-C-X-C motif chemokine ligand 12/C-X-C chemokine receptor type 4 (miR-221-CXCL12/CXCR4) pathway. (A) Following incubation for 24, 48 and 72 h, cell proliferation was examined to assess cell viability using a Cell Counting Kit-8. *p < 0.05. The experiment was repeated three times. (B) Fluorescence-activated cell-sorting (FACS) cell cycle analysis revealed the accumulation of cells at the S-phase. *p < 0.05 vs. HepG2-mock group. **p < 0.05 vs. the HepG2-HBx+anti-CXCR4 group. The experiment was repeated three times. (C) The protein expression of HBx and CXCL12 was determined by western blot analysis in HepG2 cells. β-actin was used as an internal control. The experiment was repeated three times. (D) The protein expression of HBx and CXCL12 was determined by qRT‒PCR analysis in the HepG2 cells. β-actin was used as an internal control. *p < 0.01, **p < 0.05 vs. the HepG2-HBx+anti-CXCR4 group. The experiment was repeated three times. (E) Female nonobese diabetic/severe combined immunodeficiency (NOD/SCID) mice were subcutaneously injected with the indicated tumor cells. Female HepG2-HBx mice were subcutaneously injected with anti-CXCR4 antibody (AMD 3100) or phosphate-buffered saline. Representative subcutaneous xenograft tumors from each group 6 weeks after transplantation are shown. The experiment was repeated two times. (F) The tumor volume of each group is shown. *p < 0.05, the HepG2-HBx+anti-CXCR4 group vs. the HepG2 group; **p < 0.05, the HepG2-HBx+anti-CXCR4 group vs. the HepG2-HBx group. (G) Quantitative polymerase chain reaction (qPCR) to quantify the gene expression of HBx, miR-221, CXCL12, and CXCR4 in the mouse tumors. *p < 0.05, the HepG2-HBx+anti-CXCR4 group vs. the HepG2-mock group; **p < 0.05, the HepG2-HBx+anti-CXCR4 group vs. the HepG2-HBx group. The experiment was repeated three times. (H) The expression of HBx, CXCL12, and CXCR4 proteins in different groups of tumor model mice was determined by western blotting assay. 1: HepG2 group; 2: HepG2-mock group; 3: HepG2-HBx group; 4: HepG2-HBx+anti-CXCR4 group. β-actin was used as an internal control. The experiment was repeated three times. (I) Immunohistochemistry was used to determine CXCL12 protein expression in each group of tumor model mice. The experiment was repeated three times. (J) The expression of CXCL12, interleukin (IL)-2, and tumor necrosis factor-alpha (TNF-α) is shown in the mouse serum of each group. *p < 0.05, the HepG2-HBx+anti-CXCR4 group vs. the HepG2-HBx group. The experiment was repeated three times.
To investigate the in vivo function of the CXCR4/CXCL12 axis, we established an HBx-HepG2 mouse model by subcutaneously injecting nude SCID mice with HBx-HepG2 tumor cells and then treated the mice with anti-CXCR4 antibody. The images showed that HBx could promote the growth of HepG2 tumors. However, when we treated the mice with the anti-CXCR4 antibody, the anti-CXCR4 antibody had an antitumor effect. The tumor volumes of the anti-CXCR4 antibody group were obviously smaller than those of the HBx-HepG2 tumor group (Figs. 3E and 3F). qPCR confirmed the upregulation of CXCL12 at the gene level in HBx-transfected tumor tissues compared with control tumor tissues (Fig. 3G). Western blot analysis confirmed the upregulation of CXCR4 and CXCL12 at the protein level. The data demonstrated that HBx could promote the growth of HepG2 tumors via the CXCL12/CXCR4 pathway.
Hepatitis B virus X protein promoted tumor growth via the miR-221/CXCL12/CXCR4 pathway in a mouse tumor model
Then, we used qPCR to quantify the gene expression of HBx, CXCL12, CXCR4, and miR-221 (Fig. 3G) in mouse tumors. The data demonstrated that HBx could upregulate the expression of HBx, CXCL12, CXCR4 genes, and miR-221 in the mouse tumor model, and the expression of HBx, CXCL12, CXCR4 genes, and miR-221 in mouse tumors was downregulated when the mice were treated with anti-CXCR4 antibody.
The same changes in the levels of HBx, CXCL12, and CXCR4 protein expression, were observed in the mouse tumor model. HBx upregulated the protein expression of CXCL12 and CXCR4 in the mouse tumor model, and when the tumor-bearing mice were treated with the anti-CXCR4 antibody, the protein expression of HBx, CXCL12, and CXCR4 in mouse tumor was downregulated (Fig. 3H).
Immunohistochemical analysis was performed to further examine CXCL12 protein expression in the mouse tumor model. HBx upregulated CXCL12 expression, but when an anti-CXCR4 antibody was used to treat tumor-bearing mice, CXCL12 expression was downregulated (Fig. 3I). These results suggested that HBx activated the miR-221/CXCL12/CXCR4 pathway in an HCC mouse tumor model.
We found similar changes in mouse serum. The use of ELISA to examine cytokine expression showed that HBx increased the levels of CXCL12, IL-2, and TNF-α in mouse serum. When we treated tumor-bearing mice with anti-CXCR4 antibody, the levels of CXCL12, IL-2, and TNF-α in the mouse serum were decreased (Fig. 3J).
Based on the above results, we found that HBx promotes tumor growth through the CXCL12/CXCR4 axis and that miR-221 directly targets CXCL12. We, therefore, infer that HBx activates the miR-221/CXCL12/CXCR4 pathway in the HCC mouse model.
Hepatitis B virus x protein upregulated natural killer T cell expression via the CXCR4/CXCL12 pathway to promote tumor growth
We used an immunofluorescence method to determine NKT cell expression in a mouse tumor model and found that HBx upregulated CXCR4 expression in NKT cells, but when an anti-CXCR4 antibody was used to treat tumor-bearing mice, CXCR4 expression in NKT cells was downregulated (Fig. 4). The data thus showed that HBx upregulated NKT cell expression via the CXCR4/CXCL12 pathway to promote tumor growth. The anti-CXCR4 antibody blocked the CXCR4/CXCL12 pathway to downregulate NKT cell expression and inhibit tumor growth (Fig. 4).
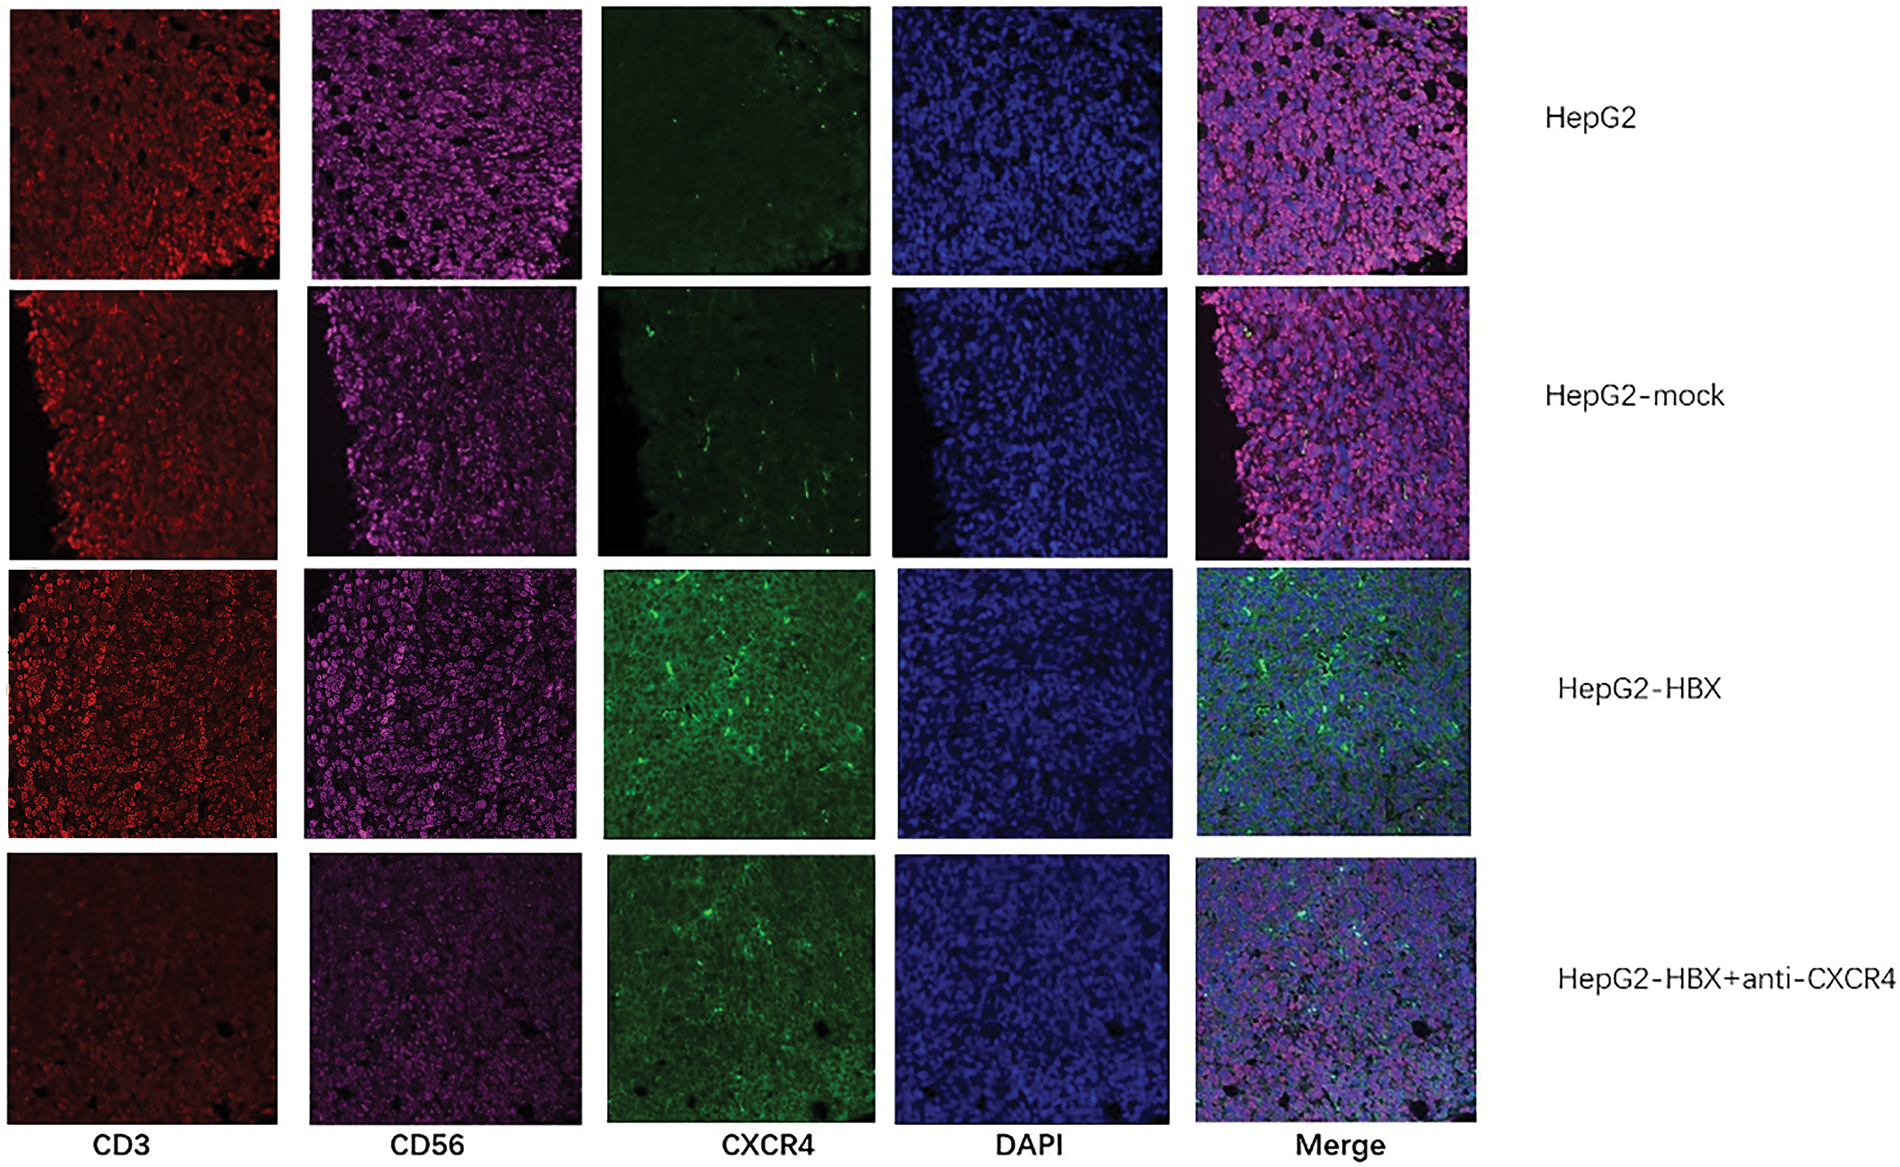
Figure 4: The natural killer T (NKT) cell proportion and C-X-C chemokine receptor type 4 (CXCR4) expression in each group of tumor model mice were determined by immunofluorescence analysis. The experiment was repeated three times.
The level of miR-221 and the percentage of NKT cells in peripheral blood increased significantly in HBV-associated HCC patients
The serum expression of miR-221 was higher in HBV-associated HCC patients than in normal controls (Fig. 5D). Moreover, the percentage of NKT cells in peripheral blood was significantly increased in HBV-associated HCC patients (Fig. 5C).
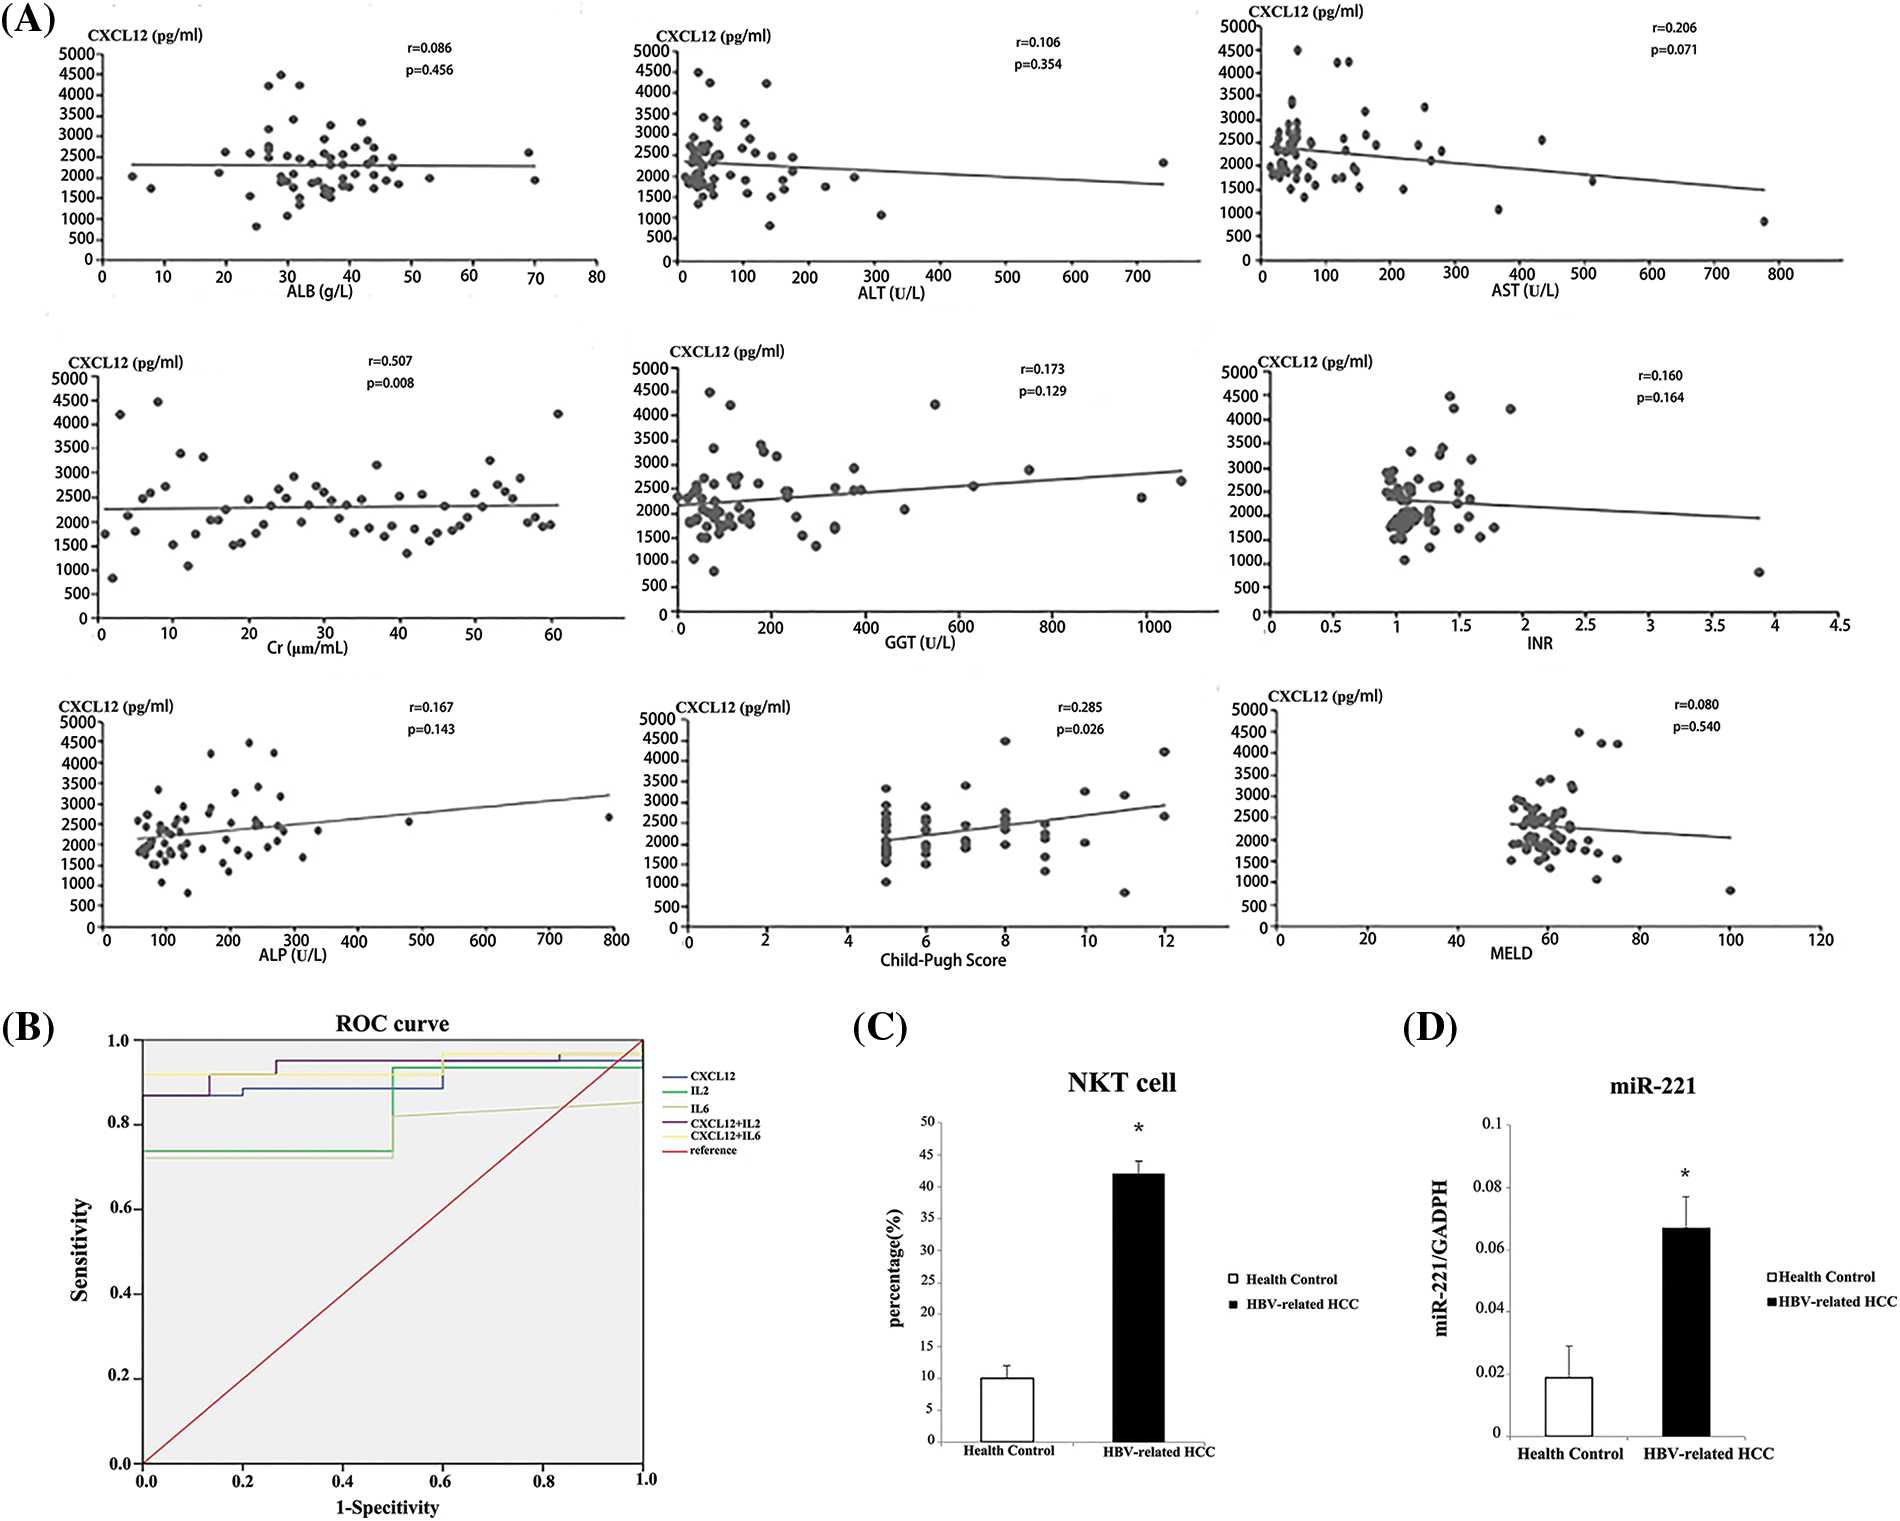
Figure 5: Analysis of serum indicators to distinguish patients with hepatitis B virus (HBV)-related hepatocellular carcinoma (HCC) from healthy people. (A) The Child-Pugh score was used to analyze the correlations between serum C-X-C motif chemokine ligand 12 (CXCL12) concentration and prognostic assessment indicators in HBV-related HCC patients. (B) Receiver operating characteristic (ROC) curves were used to analyze the performance of CXCL12 and cytokines in distinguishing patients with HBV-related HCC from healthy people. (C) The relative proportion of natural killer T (NKT) cells in peripheral blood from the HBV-related HCC patient group and the healthy control group is shown. The experiment was repeated three times. (D) The relative expression level of miR-221 in peripheral blood from the HBV-related HCC patient group and the healthy control group is shown. The experiment was repeated three times. The experiment was repeated three times.
Sixty-one HBV-related HCC patients were recruited in our study; their clinical characteristics are listed in Table 1. The average age was 51.70 years, and 53/61 of the enrolled patients were male (86.89%). For the biochemistry characteristics, the average values of AST and ALT were 115.23 U/L and 79.95 U/L, respectively. HBV-related HCC patients were categorized into three groups based on the Child-Pugh score (A: 29 patients; B: 19 patients; and C: 13 patients). According to the tumor, nodes, and metastases (TNM) staging, 29 patients were in phase I–II, and 32 were in phase III–IV (Table 2). In terms of liver-related complications, the most common clinical symptom in HBV-related HCC was ascites fluid (26.22%).
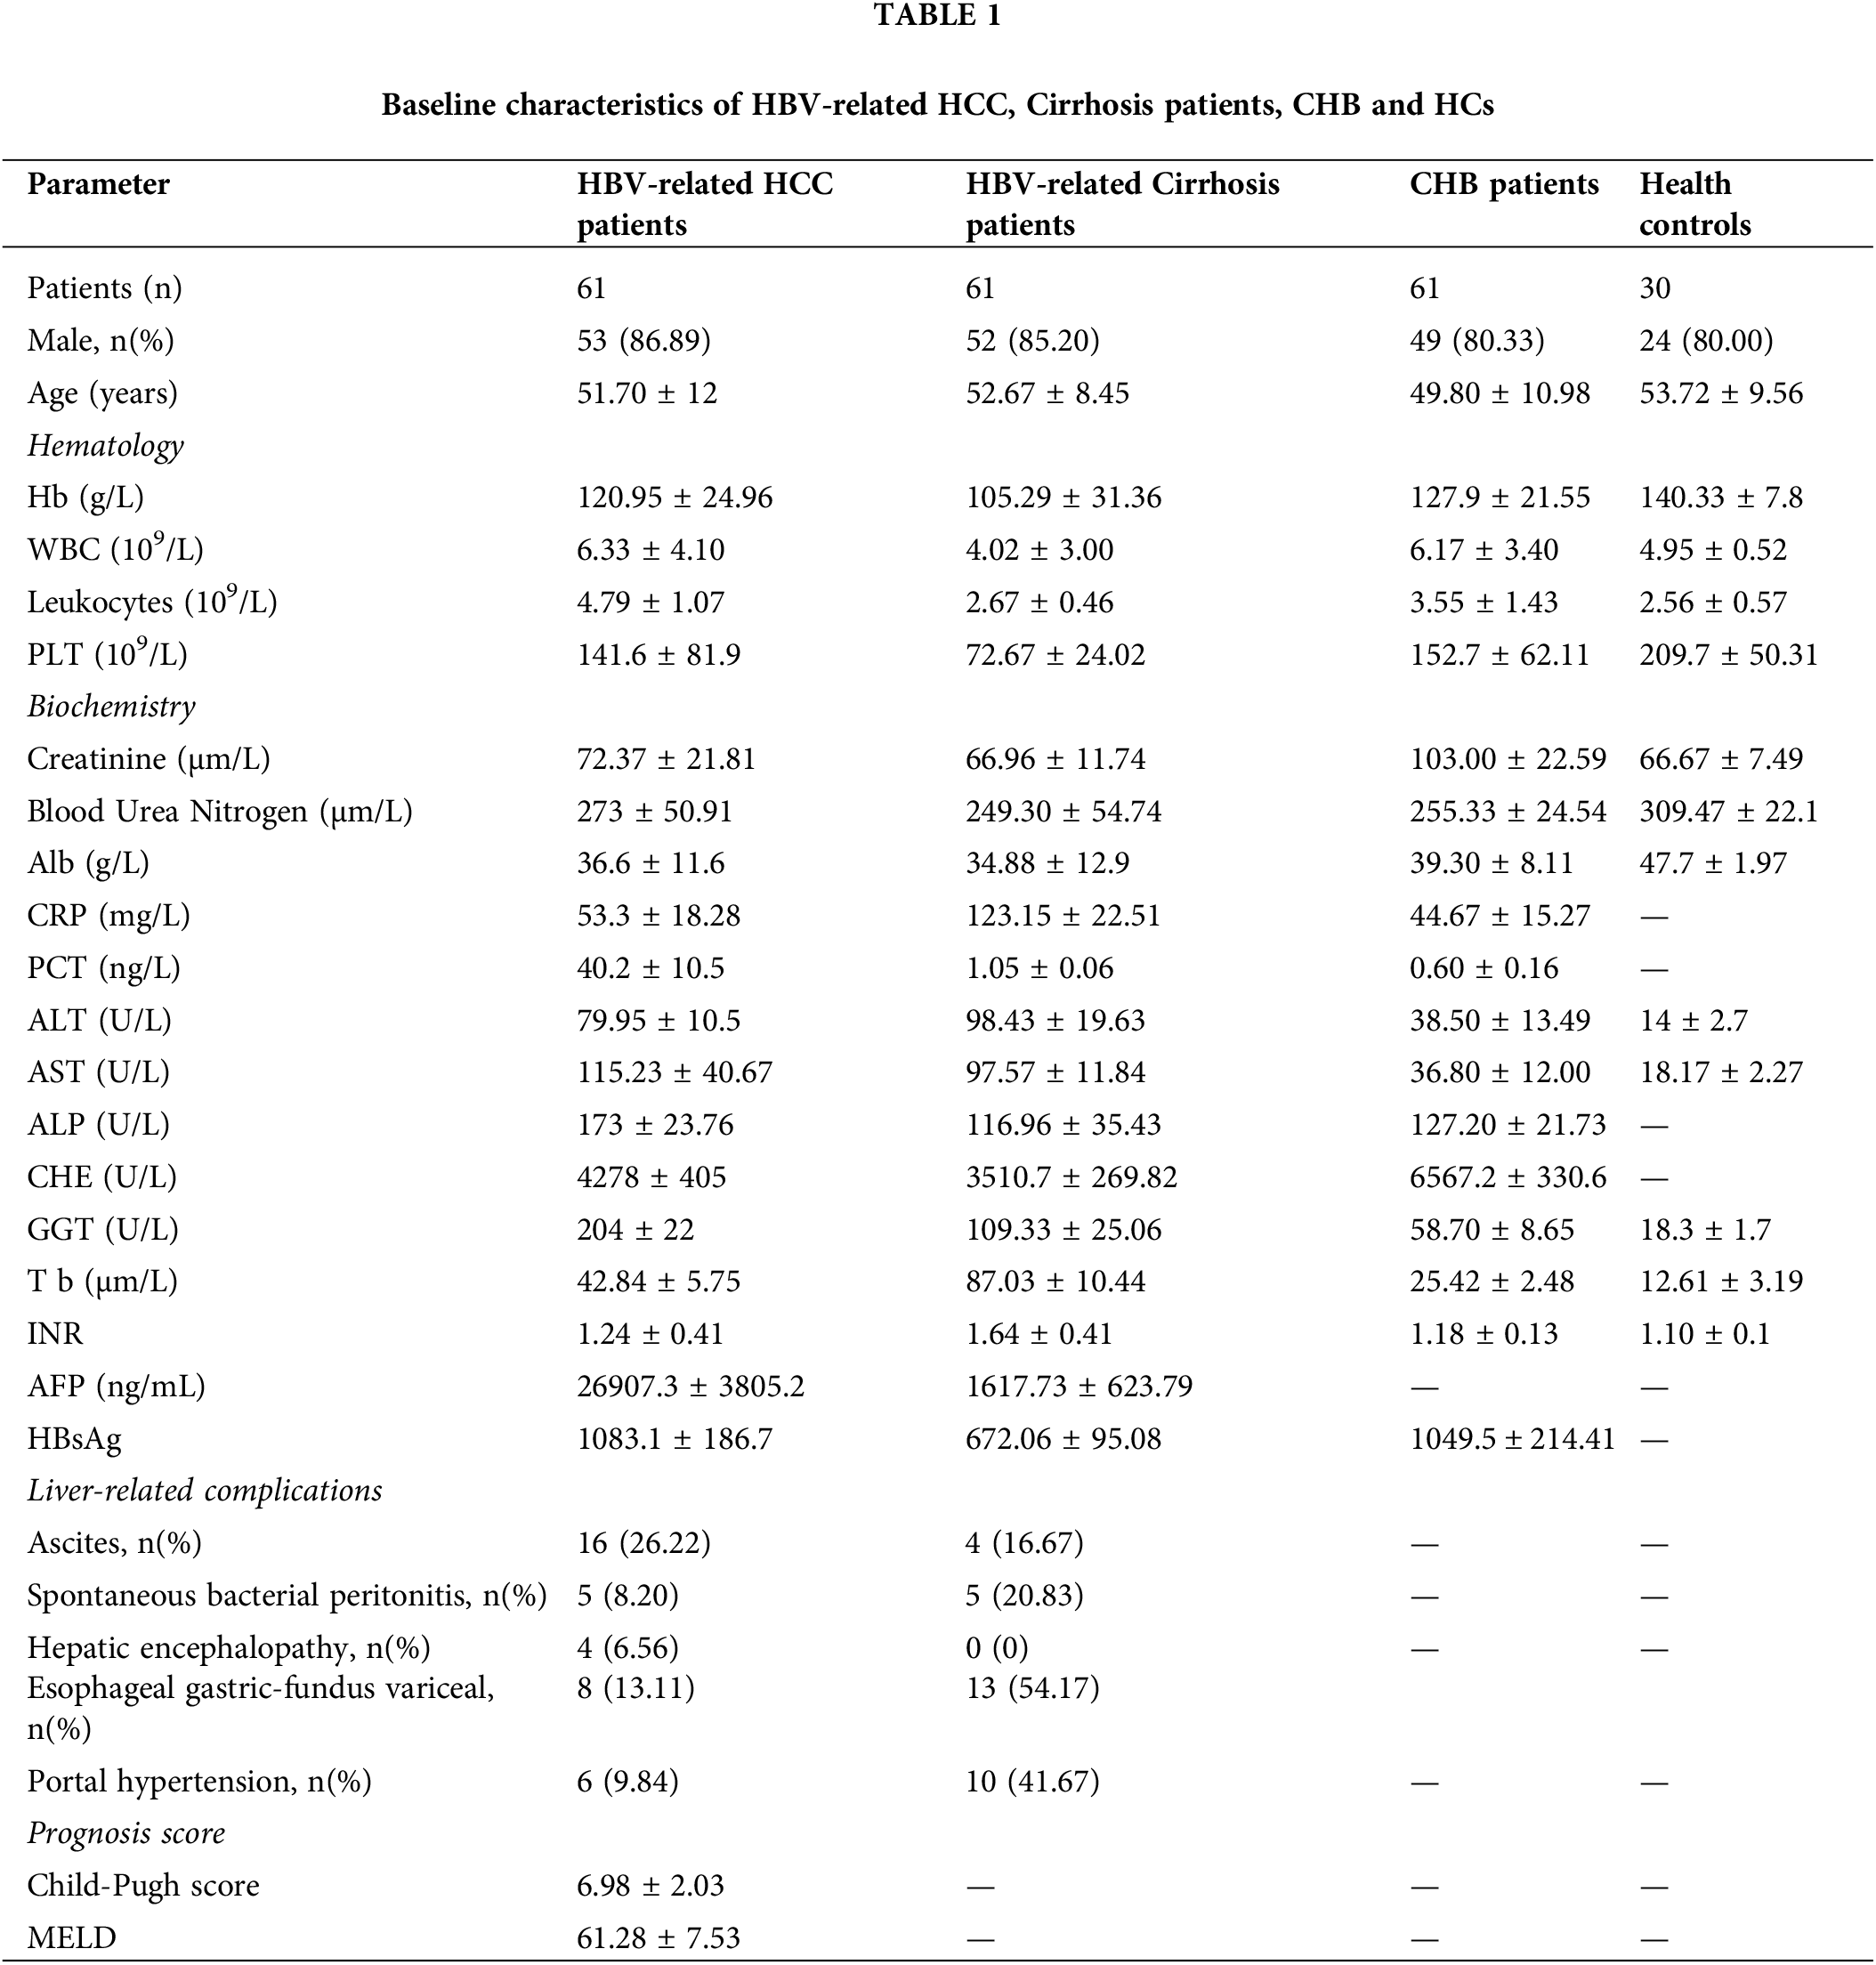
The basic characteristics of the 61 patients with HBV-related cirrhosis are shown in Table 1. The average age was 52.67 years, and 52/61 of the enrolled cirrhosis patients were male (85.20%). The average values of AST and ALT were 97.57 and 98.43 U/L, respectively. Finally, the basic clinical characteristics of the 61 CHB patients are shown in Table 1. The average age was 47.80 years, and 49 of the patients were male, accounting for 80.33%. The average values of AST and ALT were 36.80 and 38.50 U/L, respectively.
Serum cytokine levels in patients with hepatocellular carcinoma
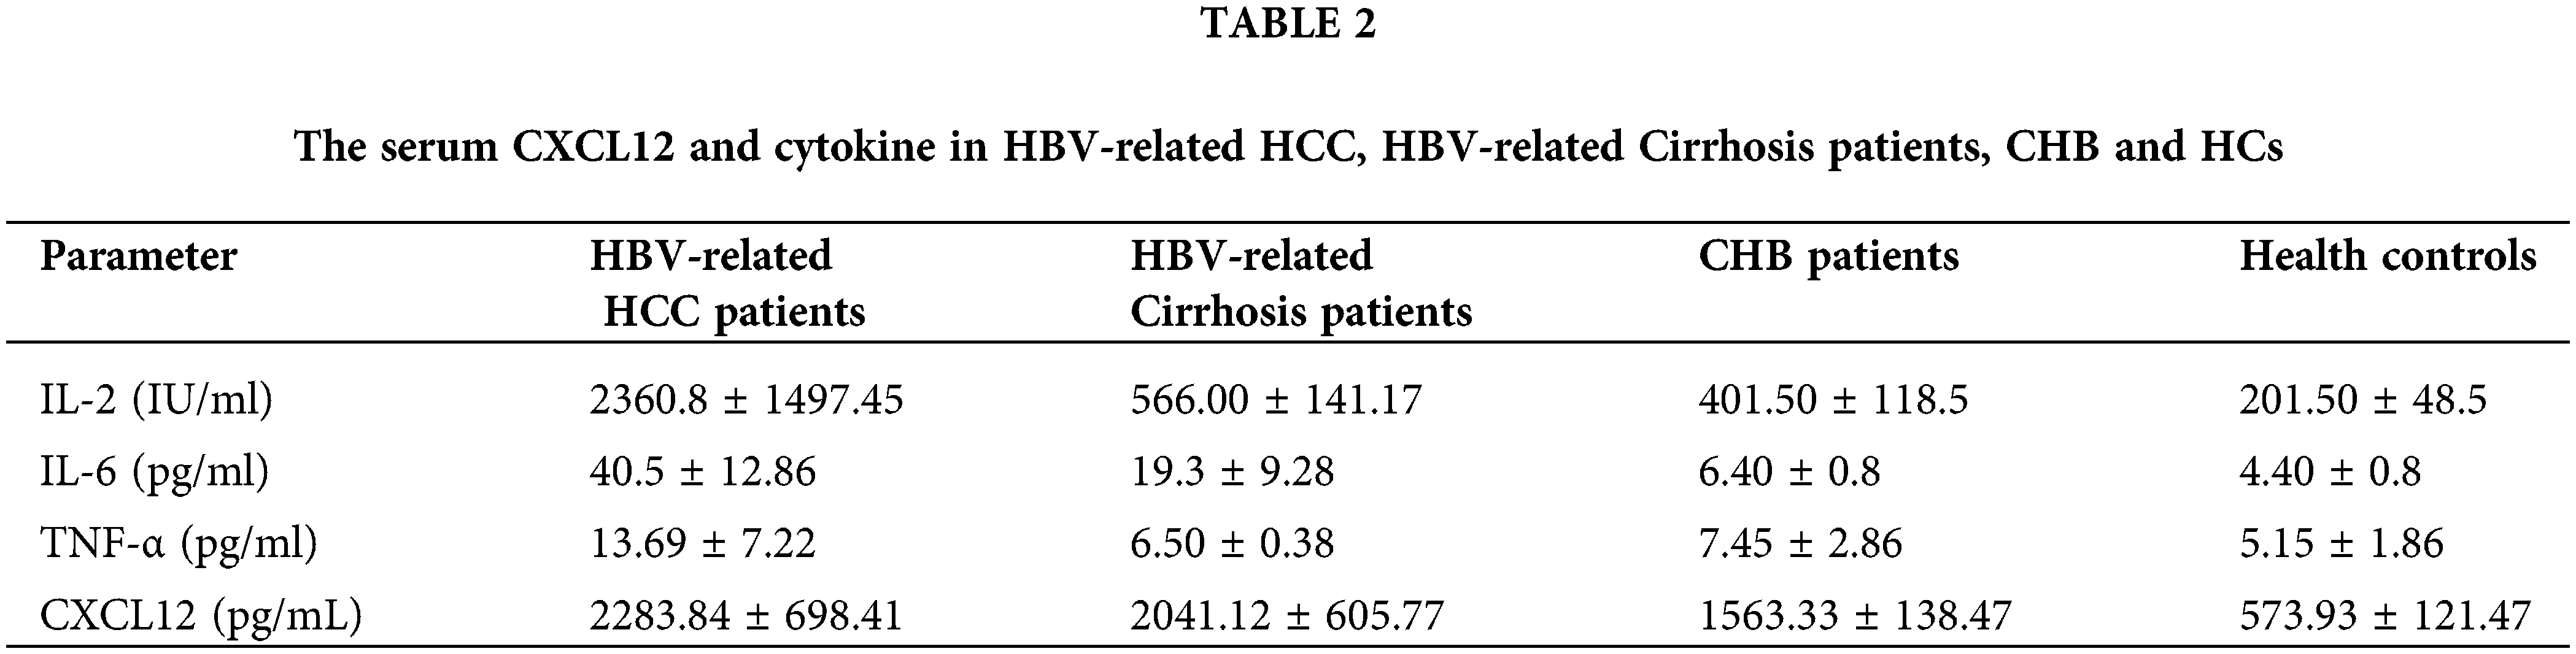
The level of serum CXCL12 in HBV-related HCC patients was higher than that in cirrhosis patients, CHB patients or healthy people (2283.84 ± 698.41 vs. 2041.12 ± 605.77 pg/L, p < 0.05; 2283.84 ± 698.41 vs. 1563.33 ± 138.47, p < 0.05; 2283.84 ± 698.41 vs. 573.93 ± 121.47, p < 0.05, respectively, Table 2). Furthermore, the level of serum IL-2 in HCC patients was higher than that in cirrhosis controls, CHB patients or healthy people (2360.8 ± 1497.45 vs. 566.00 ± 141.17; 2360.8 ± 1497.45 vs. 566.00 ± 141.17; 2360.8 ± 1497.45 vs. 201.50 ± 48.5, respectively, Table 2). The serum IL-6 level in HCC patients was higher than that in the other three groups of patients. However, the serum TNF-α level in HBV-related HCC patients was not significantly different from that in the other three groups.
Relationships between serum C-X-C motif chemokine ligand 12 levels and clinical parameters
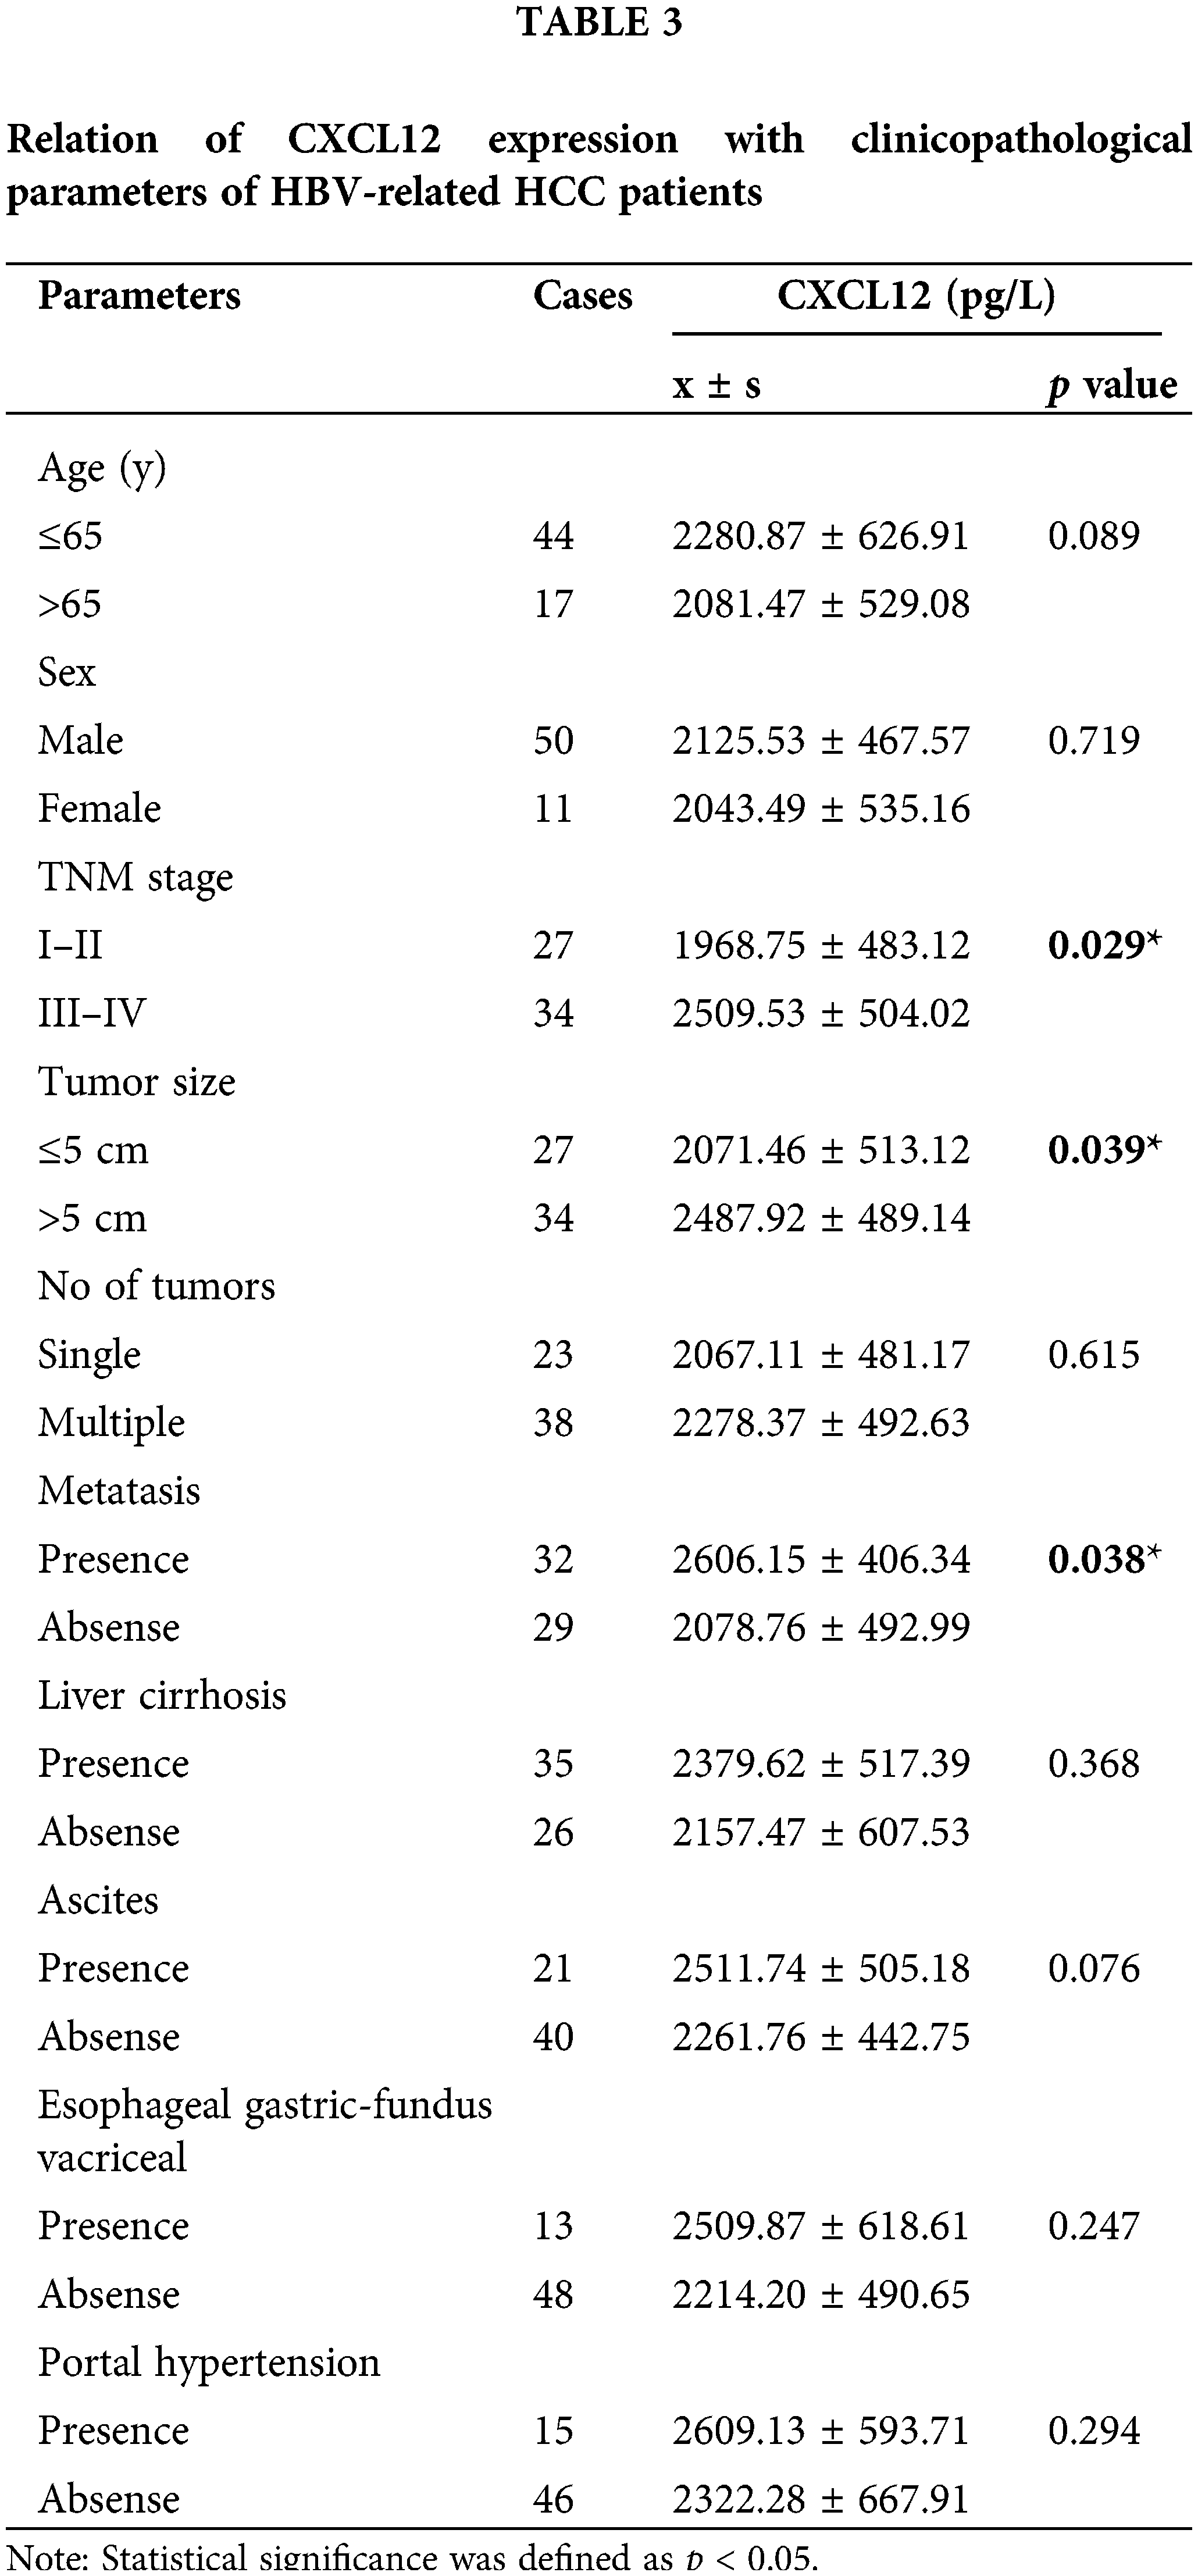
According to various characteristics, HBV-related HCC patients were separated into two groups. The level of serum CXCL12 in the two groups was statistically analyzed. Table 3 presents the correlation between the various clinical variables and serum CXCL12 levels. The late-stage HCC (III–IV) patients had a higher serum CXCL12 concentration than in early-stage HCC (I–II) patients (2509.53 ± 504.02 vs. 1968.75 ± 483.12, p = 0.029, p < 0.05). The level of serum CXCL12 in patients with tumor metastasis was higher than that in patients without tumor metastasis (2606.15 ± 406.34 vs. 2078.76 ± 492.99; p = 0.038, p < 0.05). The serum CXCL12 levels in people with tumor volumes >5 cm were higher than those in people with tumor volumes ≤5 cm (2487.92 ± 489.14 vs. 2071.46 ± 513.12; p = 0.039, p < 0.05).
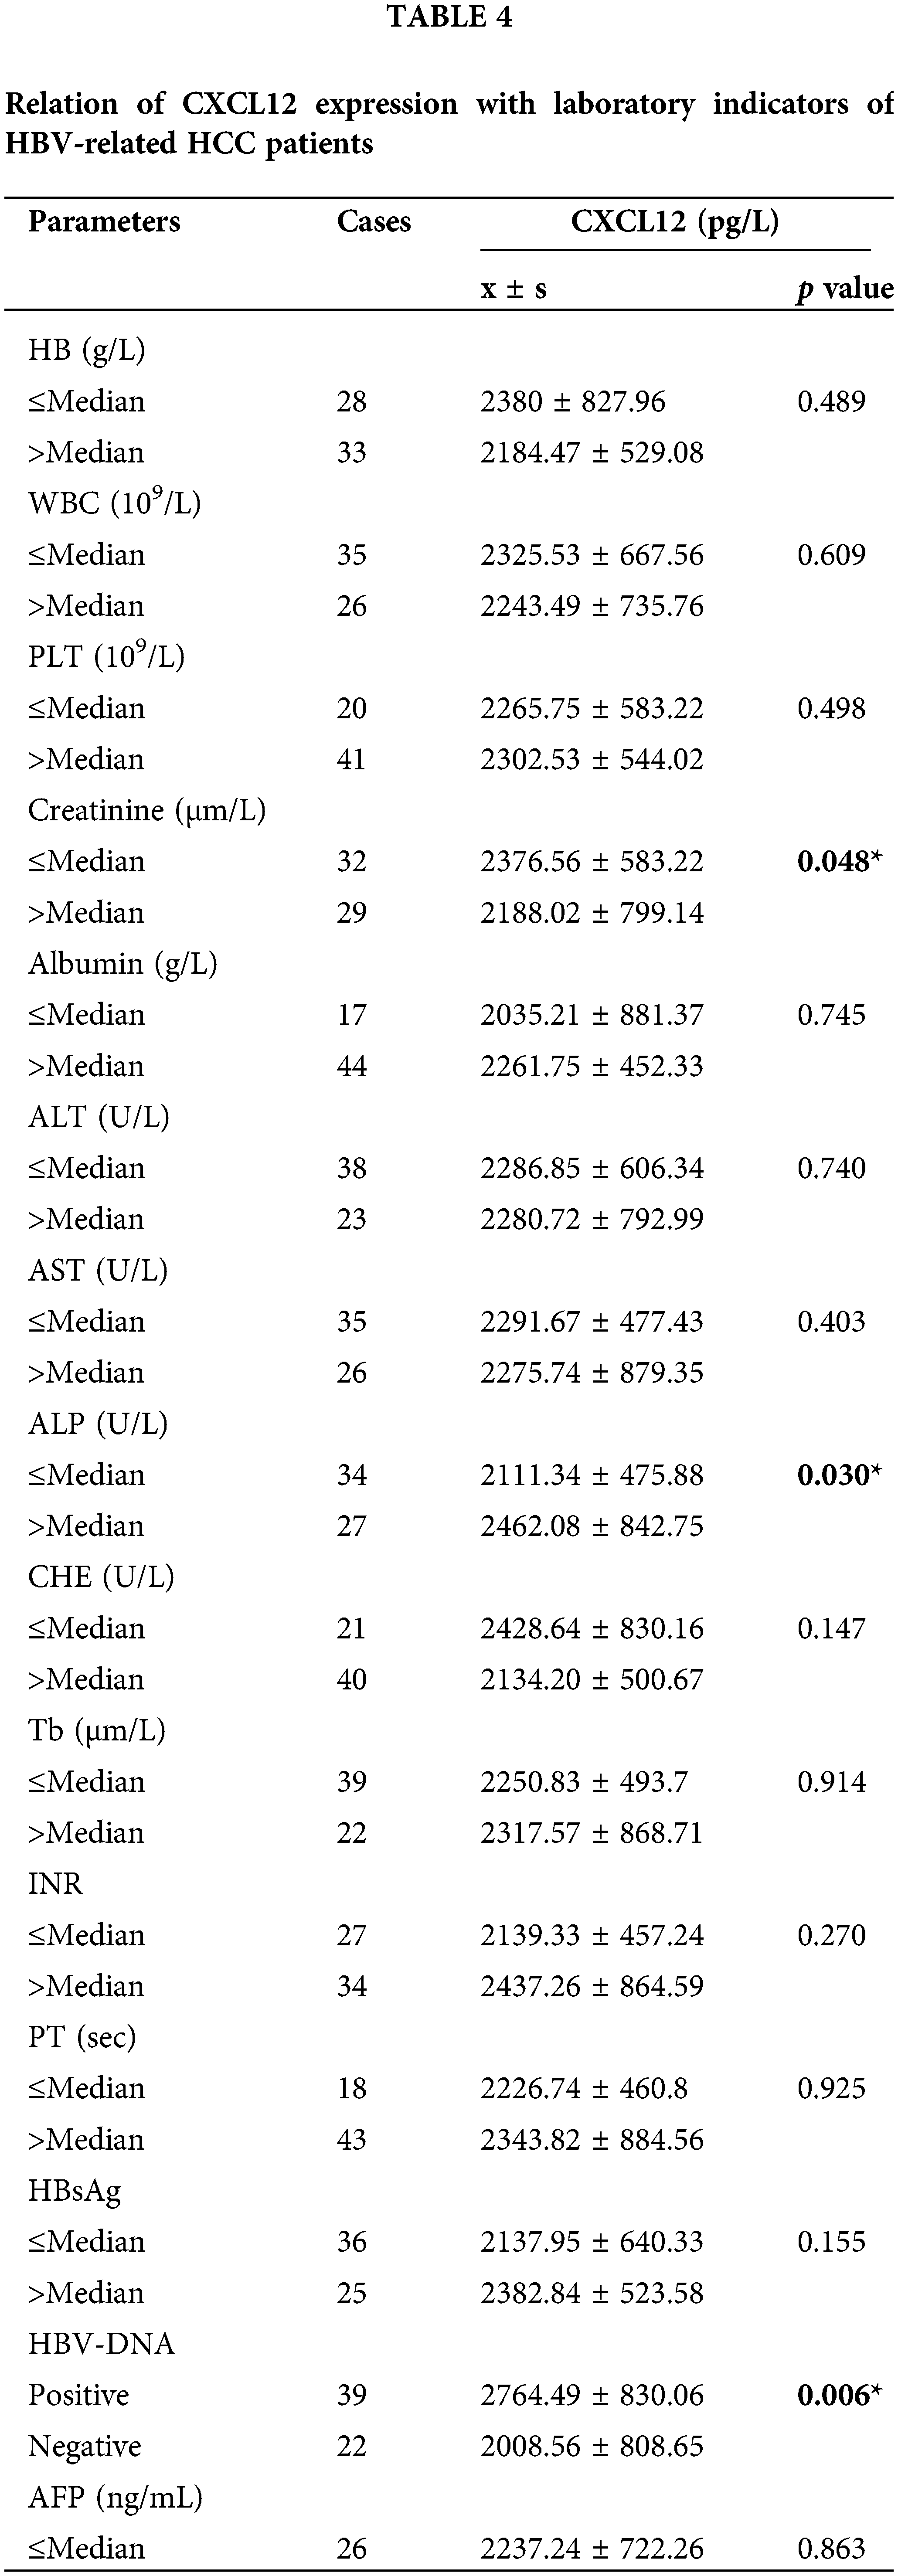
Correlation between C-X-C motif chemokine ligand 12 levels and laboratory characteristics
The HCC patients were separated into two groups based on the mean value of different laboratory variables, and the correlations with serum CXCL12 levels were statistically analyzed. Table 4 demonstrates that the levels of serum CXCL12 in the patients with reduced creatinine (Cre), cholinesterase (CHE), and albumin (ALB) levels were higher than those in patients with increased levels (p < 0.05, p = 0.048, p = 0.030, p = 0.047, respectively). The serum CXCL12 level in HBV-DNA-positive patients was higher than that in HBV-DNA-negative patients (p < 0.05, p = 0.006). The serum CXCL12 concentration had no correlation with the tumor marker AFP.
Correlation between C-X-C motif chemokine ligand 12 levels and parameters of liver prognosis
We investigated the relationship between CXCL12 with liver prognosis parameters. Fig. 5A demonstrates the correlation between serum CXCL12 concentration and prognostic assessment indicators in patients with HBV-related HCC. The data demonstrated a positive correlation between CXCL12 concentration with Cre levels and Child-Pugh scores, and no correlation between the level of serum CXCL12 with AST, ALT, ALB, alkaline phosphatase (ALP), gamma-glutamyl transpeptidase (GGT) or MELD.
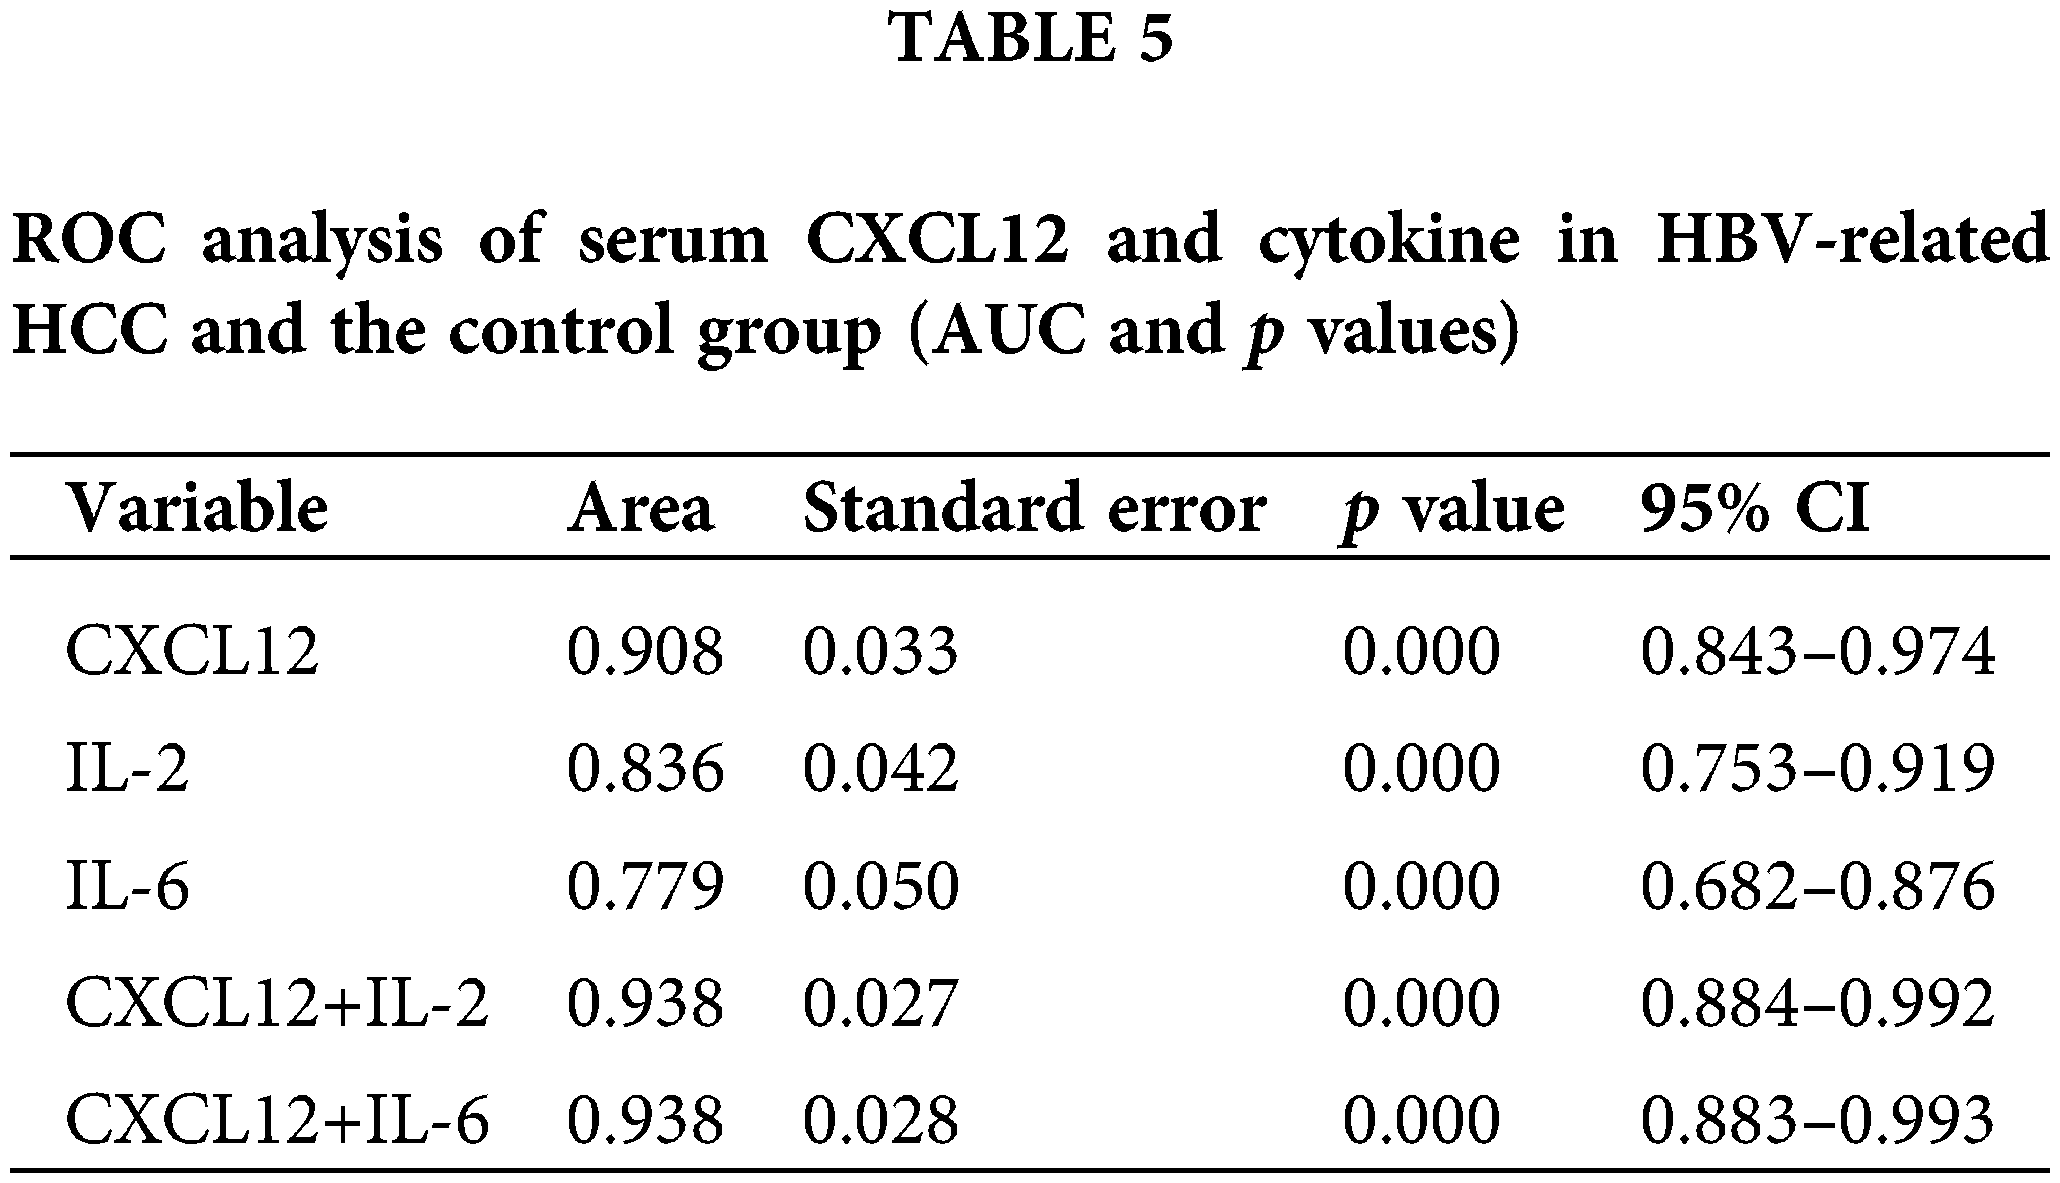
Analysis of the diagnostic effectiveness of C-X-C motif chemokine ligand 12, interleukin-2, and interleukin-6 in patients with hepatocellular carcinoma
We used receiver operating characteristic (ROC) curves to analyze the performance of CXCL12 and cytokines in distinguishing patients with HBV-related HCC from healthy people (Table 5 and Fig. 5B). Serum IL-2 and IL-6 had areas under the ROC curve (AUCs) of 0.836 and 0.779, respectively (p < 0.001), and that of serum CXCL12 was 0.908 (p < 0.001). When the cutoff value of CXCL12 was 1716.95 pg/mL, the specificity and sensitivity were 100% and 86.9%, respectively. The Z-test demonstrated that CXCL12 had an inferior diagnostic efficiency compared to IL-2 and IL-6 for HBV-related HCC. Moreover, the AUC of the combination of CXCL12 and IL-2 or IL-6 was 0.938. Therefore, the diagnostic effectiveness of the combined indicators was better than that of CXCL12, IL-2 or IL-6 alone.
HCC is one of the most lethal malignancies worldwide, with more than half a million new cases diagnosed annually (Tatituri et al., 2013). HBx has been demonstrated to play crucial roles in the relapse and metastasis of HCC. A previous study by our laboratory demonstrated that HBx could promote miR-221 expression, and acts as a tumor promoter to thus increase the proliferation of cells (Chen et al., 2015). However, the molecular mechanisms underlying how HBx regulates miR-221 to promote HCC remain elusive.
In the current study, the luciferase reporter assay and bioinformatic analysis showed that CXCL12 is a direct target of miR-221. The CXCL12/CXCR4 axis has a critical role in several key processes, including vascular formation, tumor cell dissemination, metastasis development, chemotaxis, and tumor cell proliferation. We next assessed whether HBx/miR-221 regulates CXCL12/CXCR4 signaling. As expected, our data indicate that HBx/miR-221 could influence the CXCL12/CXCR4 signaling axis. The effects of the CXCL12/CXCR4 axis on HCC were considered to be multidimensional and were associated with directing tumor cells to specific organs. CXCR4 plays an important role in tumor cell migration, invasion, and metastasis.
Our data also indicated a high expression of CXCL12 in the serum of HBV-related HCC patients and has possible clinical relevance to HBV-related HCC patients. Correlation analysis and ROC curve analysis showed that serum CXCL12 levels may have clinical value in the diagnosis and prognosis of HBV-related HCC.
NKT cells bidirectionally regulate the immune system in hepatocellular carcinoma by playing antitumor or protumor roles (Terabe and Berzofsky, 2018; Zhu et al., 2018). The antitumor and protumor effects of NKT cells depend on the structure and function of α-Galcer, which is an activator of NKT cells (Wolf et al., 2014).
In our study, NKT cells were highly increased in the tumor tissue and peripheral blood of HBV-related HCC. Earlier, Wolf et al. (2014) reported that the activation of intrahepatic NKT cells caused nonalcoholic steatohepatitis and liver cancer. Based on our data, we speculated that NKT cells play a role in promoting HCC. NKT cells express CXCR4. HBx could enhance miR-221 expression via the CXCL12/CXCR4 pathway, thus inducing NKT cells to promote HBV-related HCC. Our study did not analyze how NKT cells induce HCC or changes in downstream proteins. The related molecular mechanism will be discussed in depth in our future work.
We present evidence that HBx/miR-221-mediated CXCL12/CXCR4 signaling induces NKT cells to promote HBV-related HCC. Furthermore, increased expression of the indicators HBx, miR-221, CXCL12, CXCR4, and NKT cells could predict the clinicopathological characteristics and prognosis of HBV-related HCC patients.
Acknowledgement: We would like to acknowledge all coordinators and patients involved in this study.
Funding Statement: This study was supported by the National Natural Science Foundation of Chongqing, China (No. cstc2019jcyj-msxm0314 of Yishu Tang), the National Key R&D Program of China (No. 2017YFC0909902 of Yun Xia), and the Natural Science Foundation of China (No. 81501818 of Yishu Tang).
Author Contributions: The authors make the following contributions to the paper: study conception and design: Yishu Tang; data collection: Yue Cao, Li Hu; analysis and interpretation of results: Yue Cao; draft manuscript preparation: Yishu Tang. All authors reviewed the results and approved the final version of the manuscript.
Availability of Data and Materials: The datasets generated and/or analyzed during the current study are available from the corresponding author upon reasonable request.
Ethics Approval: The study was approved by the Ethics Committees of The First Affiliated Hospital of Chongqing Medical University (Approval Number: 20190743) prior to commencing this study. The clinical and demographic information of the patients were anonymized prior to analysis.
Conflicts of Interest: The authors declare that they have no conflicts of interest to report regarding the present study.
References
Chen JJ, Tang YS, Huang SF (2015). HBx protein-induced upregulation of microRNA-221 promotes aberrant proliferation in HBV-related hepatocellular carcinoma by targeting estrogen receptor-α. Oncology Reports 33: 792–798. https://doi.org/10.3892/or.2014.3647 [Google Scholar] [PubMed] [CrossRef]
Gao PT, Ding GY, Yang X (2018). Invasive potential of hepatocellular carcinoma is enhanced by loss of selenium-binding protein 1 and subsequent upregulation of CXCR4. American Journal of Cancer Research 8: 1040–1049. [Google Scholar] [PubMed]
Li R, Xu T, Wang H (2019). Dysregulation of the miR-325-3p/DPAGT1 axis supports HBV-positive HCC chemoresistance. Biochemical & Biophysical Research Communications 519: 358–365. https://doi.org/10.1016/j.bbrc.2019.08.116 [Google Scholar] [PubMed] [CrossRef]
Liu H, Liu Y, Liu W (2015). EZH2-mediated loss of miR-622 determines CXCR4 activation in hepatocellular carcinoma. Nature Communications 6: 8494. https://doi.org/10.1038/ncomms9494 [Google Scholar] [PubMed] [CrossRef]
Liu Y, Ren CC, Yang L, Xu YM, Chen YN (2019). Role of CXCL12-CXCR4 axis in ovarian cancer metastasis and CXCL12-CXCR4 blockade with AMD3100 suppresses tumor cell migration and invasion in vitro. Journal of Cellular Physiology 234: 3897–3909. https://doi.org/10.1002/jcp.27163 [Google Scholar] [PubMed] [CrossRef]
Ma C, Han M, Heinrich B (2018). Gut microbiome—mediated bile acid metabolism regulates liver cancer via NKT cells. Science 360: 5931. https://doi.org/10.1126/science.aan5931 [Google Scholar] [PubMed] [CrossRef]
Pinato DJ, Sharma R, Allara E, Yen C, Arizumi T, Kubota K (2016). The ALBI grade provides objective hepatic reserve estimation across each BCLC stage of hepatocellular carcinoma. Journal of Hepatology 66: 338–346. https://doi.org/10.1016/j.jhep.2016.09.008 [Google Scholar] [PubMed] [CrossRef]
Qin LF, Qin JM, Zhang JQ (2018). CXCL12 and CXCR4 polymorphisms and expressions in peripheral blood from patients of hepatocellular carcinoma. Future Oncology 14: 1261–1271. https://doi.org/10.2217/fon-2017-0613 [Google Scholar] [PubMed] [CrossRef]
Tatituri RV, Watts GF, Bhowruth V (2013). Recognition of microbial and mammalian phospholipid antigens by NKT cells with diverse TCRs. Proceedings of the National Academy of Sciences of the United States of America 110: 1827–1832. https://doi.org/10.1073/pnas.1220601110 [Google Scholar] [PubMed] [CrossRef]
Terabe M, Berzofsky JA (2018). Tissue—specific roles of NKT cells in tumor immunity. Frontiers in Immunology 9: 1838. https://doi.org/10.3389/fimmu.2018.01838 [Google Scholar] [PubMed] [CrossRef]
Torre LA, Bray F, Siegel RL (2015). Global cancer statistics, 2012. CA: A Cancer Journal for Clinicians 65: 87–108. https://doi.org/10.3322/caac.21262 [Google Scholar] [PubMed] [CrossRef]
Wang C, Wang MD, Cheng P (2017). Hepatitis B virus X protein promotes the stem-like properties of OV6+ cancer cells in hepatocellular carcinoma. Cell Death and Disease 8: e2560. https://doi.org/10.1038/cddis.2016.493 [Google Scholar] [PubMed] [CrossRef]
Wolf MJ, Adili A, Piotrowitz K (2014). Metabolic activation of intrahepatic CD8+ T cells and NKT cells causes nonalcoholic steatohepatitis and liver cancer via cross—talk with hepatocytes. Cancer Cell 26: 549–564. https://doi.org/10.1016/j.ccell.2014.09.003 [Google Scholar] [PubMed] [CrossRef]
Ye Y, Guo J, Xiao P (2020). Macrophages-induced long noncoding RNA H19 upregulation triggers and activates the miR-193b/MAPK1 axis and promotes cell aggressiveness in hepatocellular carcinoma. Cancer Letters 469: 310–322. https://doi.org/10.1016/j.canlet.2019.11.001 [Google Scholar] [PubMed] [CrossRef]
Zhang H, Li Z, Wang L (2017). Critical role of myeloid—derived suppressor cells in tumor—induced liver immune suppression through inhibition of NKT cell function. Frontiers in Immunology 8: 129. https://doi.org/10.3389/fimmu.2017.00129 [Google Scholar] [PubMed] [CrossRef]
Zhong J, Li J, Wei J (2019). Plumbagin restrains hepatocellular carcinoma angiogenesis by stromal cell—derived factor (SDF-1)/CXCR4-CXCR7 axis. Medical Science Monitor 25: 6110–6119. https://doi.org/10.12659/MSM.915782 [Google Scholar] [PubMed] [CrossRef]
Zhu S, Zhang H, Bai L (2018). NKT cells in liver diseases. Frontiers of Medicine 12: 249–261. https://doi.org/10.1007/s11684-018-0622-3 [Google Scholar] [PubMed] [CrossRef]
Cite This Article
 Copyright © 2023 The Author(s). Published by Tech Science Press.
This work is licensed under a Creative Commons Attribution 4.0 International License , which permits unrestricted use, distribution, and reproduction in any medium, provided the original work is properly cited.
 Downloads
 Citation Tools