
 Submit a Paper
 Propose a Special lssue
 Open Access
ARTICLE

Characterization of prognosis and immune infiltration by a novel glutamine metabolism-related model in cutaneous melanoma
1 Shanghai Clinical College, Anhui Medical University, Shanghai, 200040, China
2 The Fifth Clinical Medical College, Anhui Medical University, Hefei, 230032, China
3 Department of Nuclear Medicine, Shanghai Tenth People’s Hospital, Tongji University School of Medicine, Shanghai, 200040, China
4 Institute of Nuclear Medicine, Tongji University School of Medicine, Shanghai, 200040, China
5 National Genomics Data Center and CAS Key Laboratory of Genome Sciences and Information, Beijing Institute of Genomics, Chinese Academy of Sciences and China National Center for Bioinformation, Beijing, 100101, China
6 Department of Biomedical Engineering, Nanjing University of Aeronautics and Astronautics, Nanjing, 210000, China
* Corresponding Author: FEI YU. Email:
# These authors contributed equally to this work and should be considered as co-first authors
BIOCELL 2023, 47(9), 1931-1945. https://doi.org/10.32604/biocell.2023.028968
Received 19 January 2023; Accepted 24 May 2023; Issue published 28 September 2023
 View Full Text
 Download PDF
Abstract
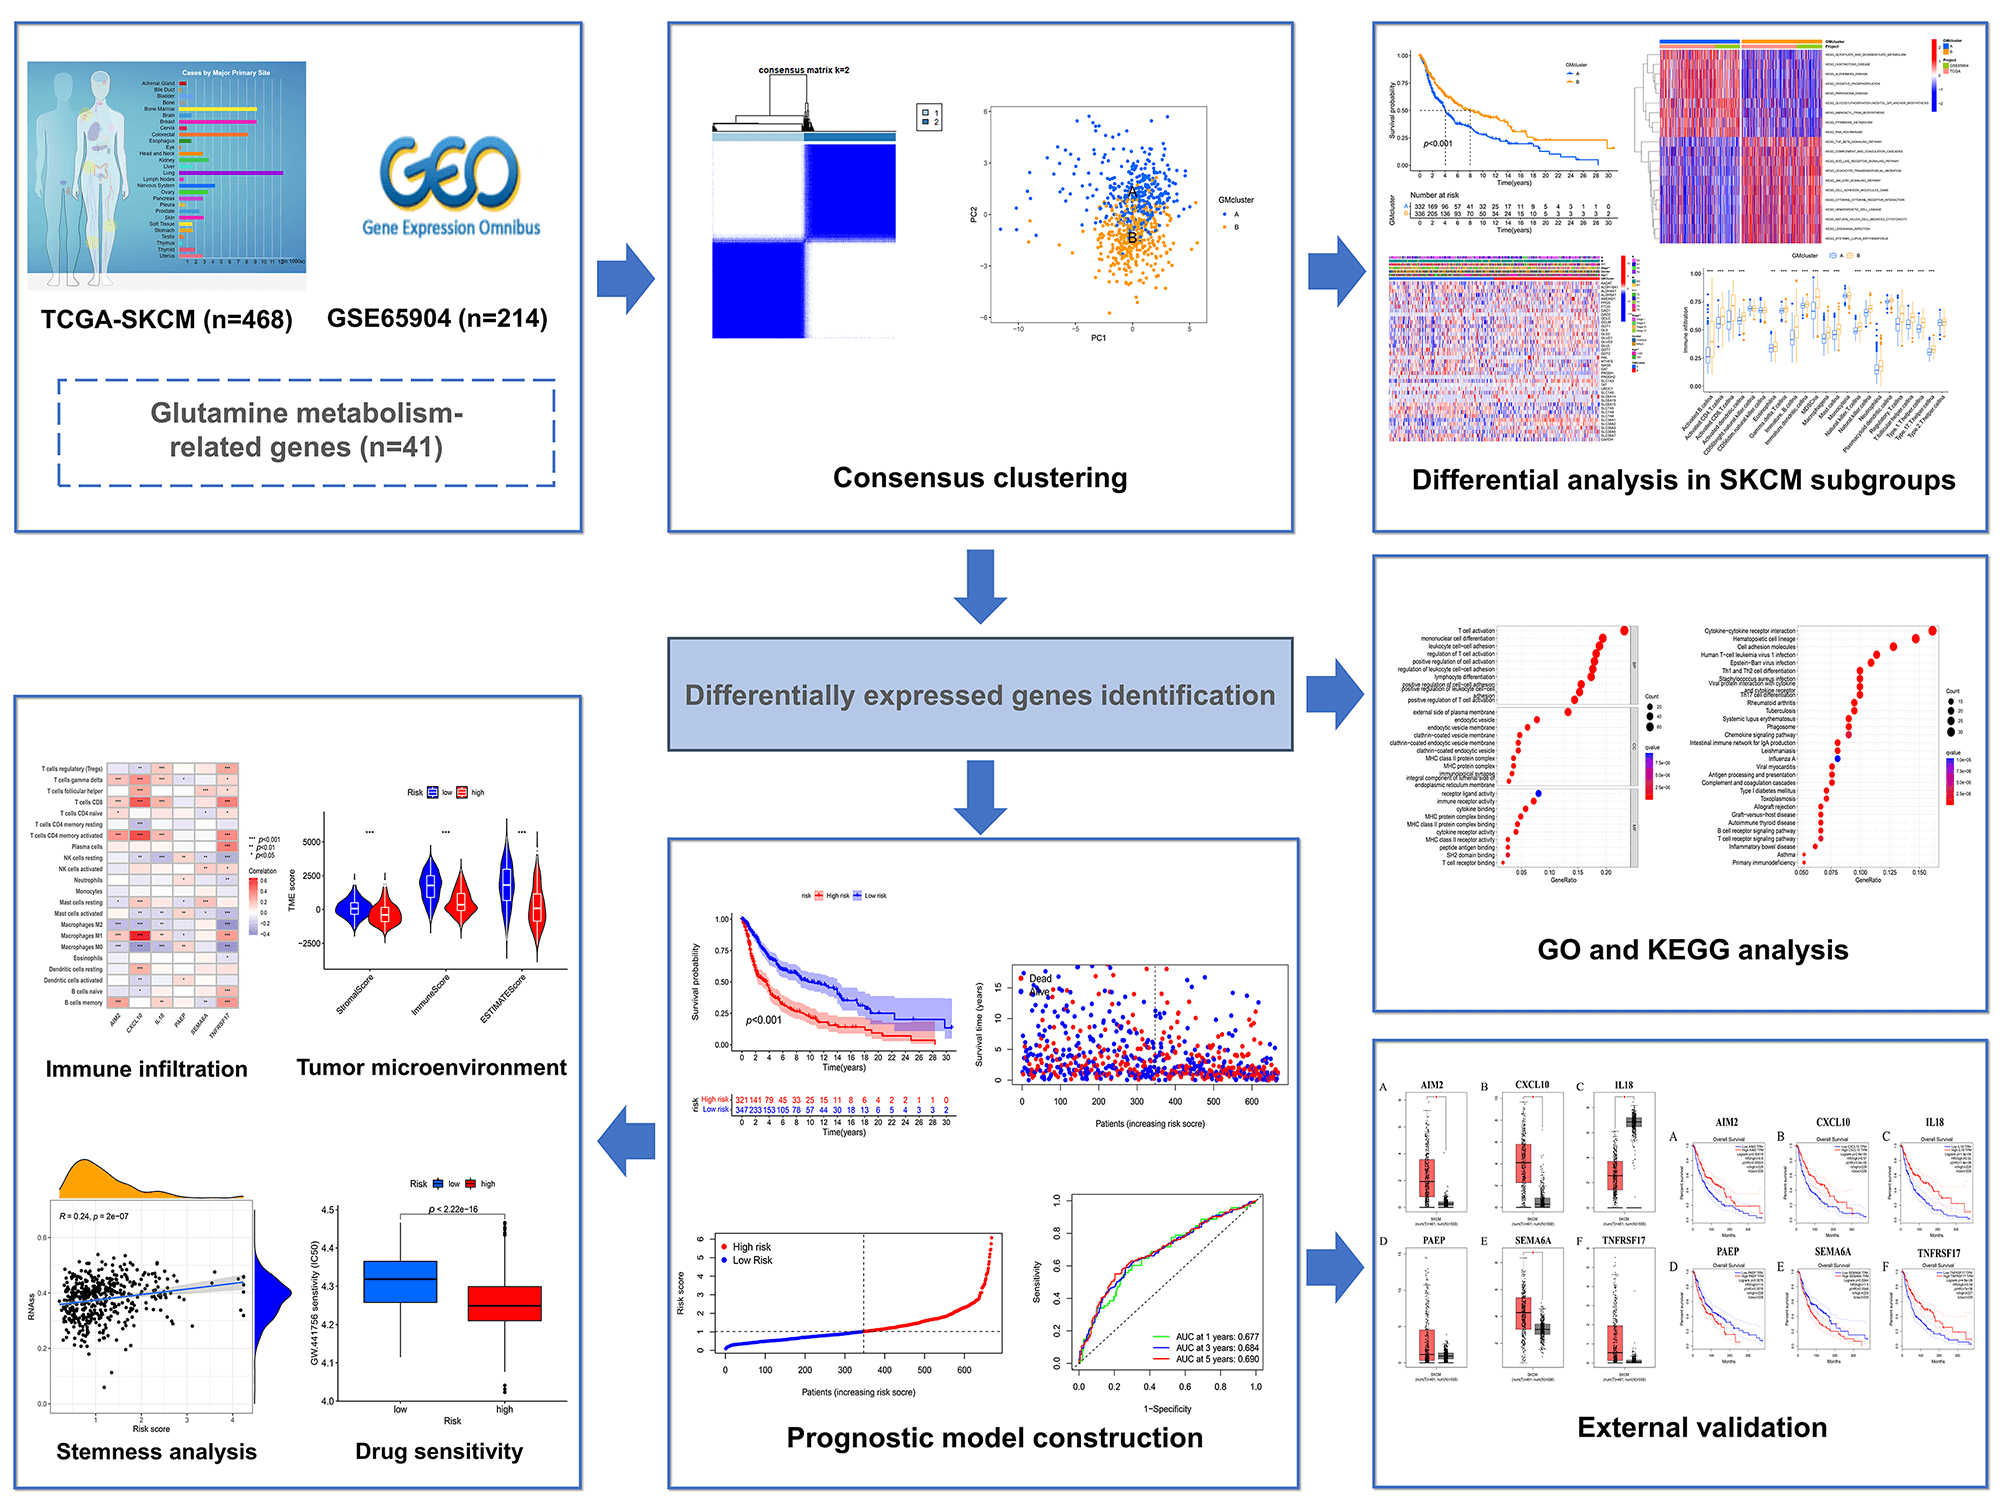
Glutamine metabolism (GM) plays an important role in tumor growth and proliferation. Skin cutaneous melanoma (SKCM) is a glutamine-dependent cancer. However, the molecular characteristics and action mechanism of GM on SKCM remain unclear. Therefore, we aimed to explore the effects of GM-related genes on survival, clinicopathological characteristics, and the tumor microenvironment in SKCM. In this study, 682 SKCM samples were obtained from the Cancer Genome Atlas (TCGA) and Gene Expression Omnibus (GEO) databases. Consensus clustering was used to classify SKCM samples into distinct subtypes based on 41 GM-related genes. Differences in survival, immune infiltration, clinical characteristics, and Kyoto Encyclopedia of Genes and Genomes (KEGG) pathways as well as differentially expressed genes (DEGs) between subgroups were evaluated. A prognostic model was constructed according to prognostic DEGs. Differential analyses in survival, immune infiltration, tumor microenvironment (TME), tumor mutation burden (TMB), stemness, and drug sensitivity between risk groups were conducted. We identified two distinct GM-related subtypes on SKCM and found that GM-related gene alterations were associated with survival probability, clinical features, biological function, and immune infiltration. Then a risk model based on six DEGs (IL18, SEMA6A, PAEP, TNFRSF17, AIM2, and CXCL10) was constructed and validated for predicting overall survival in SKCM patients. The results showed that the risk score was negatively correlated with CD8+ T cells, activated CD4+ memory T cells, M1 macrophages, and γ δ T cells. The group with a low-risk score was accompanied by a better survival rate with higher TME scores and lower stemness index. Moreover, the group with high- and low-risk score had a significant difference with the sensitivity of 75 drugs (p < 0.001). Overall, distinct subtypes in SKCM patients based on GM-related genes were identified and the risk model was constructed, which might contribute to prognosis prediction, guide clinical therapy, and develop novel therapeutic strategies.Graphic Abstract
Keywords
Supplementary Material
Supplementary Material FileSkin cutaneous melanoma (SKCM) is one of the most aggressive skin cancers, responsible for >75% of skin cancer-related deaths worldwide. Incidence rates of this malignancy have continued to rise annually (Mukunda et al., 2022). Early-stage SKCM can be managed effectively with timely surgical intervention, resulting in a 10-year survival probability of 95% (Song et al., 2022a). Regrettably, the 5-year survival rate for patients with advanced melanoma is less than 5% (Zhang et al., 2019). The current primary methods of treating advanced melanoma in clinical settings involve immune checkpoint blockade, targeted therapy using v-raf murine sarcoma viral oncogene homolog B1 (BRAF) and mitogen-activated protein kinase kinase (MEK) inhibitors, or a combination of these approaches (Jenkins and Fisher, 2021). Although these therapeutic strategies have significantly improved the clinical outcomes of patients with melanoma, their effectiveness can be hindered by inherent or acquired resistance that arises from the inhibitory tumor immune microenvironment and epigenetic regulators (Rubanov et al., 2022). Given the high fatality rate and poor treatment response, there is an urgent need to develop novel prognostic models for prognosis prediction and new therapeutic targets for clinical intervention.
Metabolic reprogramming is a critical hallmark of cancer cells, and glutamine serves as a crucial source of nitrogen that plays a pivotal role in driving tumor growth (Fasoulakis et al., 2023). Glutamine is intricately linked to several key aspects of tumor metabolism essential for promoting tumor proliferation, such as energy production, the biosynthesis of non-essential amino acids, nucleotides, fatty acids, and glutathione, as well as the uptake of essential amino acids (Bott et al., 2019; Feng et al., 2021). In the absence of this critical nutrient, cancer cells reliant on glutamine exhibit a heightened susceptibility to apoptosis (Wise and Thompson, 2010). Considering the pivotal role of glutamine in tumor growth and proliferation, targeting glutamine metabolism (GM) has emerged as a highly promising therapeutic strategy for the treatment of cancer. For example, glutaminase inhibitor (CB-839) has been employed in Phase I/II clinical trials as a cancer therapeutic since 2014, and melanoma patients could well tolerate CB-839 combined with Nivolumab with an overall response rate of 19% (Yang et al., 2021). DRP-104 is a promising anticancer agent that simultaneously targets multiple metabolic pathways involved in glutamine and has demonstrated potent anticancer activity in preclinical trials (Rais et al., 2022). Previous investigations have substantiated the notion of glutamine addiction in SKCM, characterized by upregulated expression of genes involved in glutamate biosynthesis, leading to enhanced proline generation by tumor cells relative to their normal counterparts (Ratnikov et al., 2017). In melanoma cells, glutamine serves as a potent anaplerotic input into the tricarboxylic acid (TCA) cycle (Chen et al., 2019). Moreover, Baenke et al. (2016) demonstrated that GM is indispensable for the proliferation, invasion, and metastasis of BRAF mutant and BRAF inhibitor-resistant melanoma cells. Another study has revealed that the aggressive characteristics induced by glutamine in melanoma cells are linked to increased expression of HIF1α and Bcl‑2/adenovirus E1B 19‑kDa protein‑interacting protein 3 (BNIP3) (Vara-Perez et al., 2019). However, the precise mechanism underlying GM-driven tumorigenesis and proliferation in SKCM has not yet been fully elucidated.
At present, the prediction of tumor prognosis through the mediation of GM-related genes has become a highly attractive research domain. In one particular study, a GM-related risk-score model was constructed with a total of five genes (ALDH5A1, ASNSD1, CPS1, GMPS, and PPAT). This model was found to possess an outstanding ability to predict prognosis in hepatocellular carcinoma patients (Jin et al., 2022). Liu et al. (2022) studied lung adenocarcinoma patients, and based on GM-related genes; these patients were categorized into high- and low-risk groups. The low-risk group exhibited lower GM levels, higher levels of immune infiltration, and a significant survival advantage (Liu et al., 2022). Nevertheless, the prognostic significance of GM-related regulators in SKCM patients remains uncertain. In addition, several studies have also demonstrated that GM exerts an influence on the anti-tumor immune response in the tumor microenvironment (TME). The activation of potent anti-tumor immunity can be achieved by using glutamine utilization inhibitors in combination with immune checkpoint blockade (Wang et al., 2021b; Byun et al., 2020; Li et al., 2022). The mechanism of action involves the promotion of programmed death-ligand 1 (PD-L1) expression on tumor cells through glutamine utilization inhibition, thereby preventing immune-killing effects of T cells. Consequently, GM inhibition in combination with anti-PD-L1 therapy can significantly enhance the anti-tumor activity of T cells and impede tumor growth (Hernandez-Davies et al., 2015). These pieces of evidence indicate that GM may be a potential therapeutic target in cooperation with immunotherapy for SKCM. Nevertheless, the effect of GM on the immune microenvironment in SKCM yet needs to be fully elucidated.
As such, comprehensive multi-omics investigations into GM-related genes in SKCM are essential. In this study, 682 SKCM patients were classified into two distinct molecular subtypes based on the expression level of GM-related genes, with each subtype exhibiting different molecular functions and clinical traits. Subsequently, a GM-related risk predictive model (consisting of six genes) was constructed to forecast overall survival (OS) and analyzed the differences in immune infiltration, TME, stemness, and drug sensitivity between low- and high-risk patients with SKCM.
Data collection and preprocessing
The gene expression profiles of 682 SKCM patients were obtained from The Cancer Genome Atlas (TCGA) (n = 468) and the Gene Expression Omnibus (GEO) (GSE65904, n = 214). The default value of clinical information was excluded and the relevant prognostic data of SKCM from TCGA (n = 458) and GEO (n = 210) and 344 clinical data points (containing age, gender, stage, and TNM stage) of SKCM from TCGA were acquired (Suppl. Table S1). The somatic mutation and copy number variation (CNV) data in the TCGA-SKCM cohort were downloaded from Xena website of the University of California, Santa Cruz (UCSC). A total of 41 GM-related genes (Suppl. Table S2) were curated from previous studies (Ying et al., 2021; Fu et al., 2019), in which these genes were extracted from Gene Ontology (GO) initiative. Then, gene expression profiles of TCGA and GEO datasets were integrated, and the batch effects were eliminated by employing the “Combat” algorithm (Johnson et al., 2007).
The “maftools” package (Mayakonda et al., 2018) was employed to analyze the mutation frequency of 41 GM-related genes and the base changes in SKCM samples from TCGA. The locations of CNV alterations in 41 GM-related genes on 23 chromosomes were drawn using the “RCircos” package.
Consensus clustering based on glutamine metabolism-related genes
The incorporated samples were classified into distinct subtypes according to their expression on 41 GM-related genes by the K-means method using the “Consensus Cluster Plus” package. The optimal clustering number was chosen based on the consensus index and cumulative distribution function (CDF). The distributions of different GM-related subtypes were studied by principal component analysis (PCA) using the “stats” package. For survival analysis, “survival” and “survminer” packages were applied. The single-sample gene set enrichment analysis (ssGSEA) and the gene set variation analysis (GSVA) were conducted via the “GSEABase” and “GSVA” R packages (Hanzelmann et al., 2013).
Identification of differentially expressed genes (DEGs) and functional enrichment analysis
The “limma” package (Wettenhall and Smyth, 2004) was used to identify DEGs between GM-related subtypes with p-value < 0.05 and |log2FC| > 1. The “clusterProfiler” R package (Yu et al., 2012) was utilized to perform GO and Kyoto Encyclopedia of Genes and Genomes (KEGG) analysis to study the potential functions and pathway knowledge of DEGs.
Consensus clustering based on prognostic DEGs
To detect prognostic DEGs, the “limma” and “survival” packages were utilized in univariate Cox regression analysis. Based on the expression of prognostic DEGs, SKCM samples were divided into three gene clusters by the k-means method using the “Consensus Cluster Plus” package. The survival curves of three gene subtypes were plotted using the “survival” and “survminer” packages.
The establishment and assessment of the prognostic model
We classified 668 samples into the training and test groups randomly and equally using the “caret” package. Then by employing the “glmnet” R package, the least absolute shrinkage and selection operator (LASSO) regression analysis was performed to minimize the risk of over-fitting. Multivariate Cox regression analysis was applied to construct the risk score in the training group based on prognostic DEGs. The risk score of the training group was calculated by the following formula: risk score = sum (expression of each gene × corresponding coefficient). The survival analysis was conducted by the “survival” and “survminer” R packages. The receiver operating characteristic (ROC) analysis was performed using the “timeROC” R package. We used the public database GEPIA (http://gepia.cancer-pku.cn/) (Tang et al., 2017) to validate the expression differences of signature genes between normal tissues and SKCM tissues and estimate signature genes’ effect on OS in SKCM. The nomogram was constructed by the “regplot” package based on clinical characteristics and the risk score in the TCGA SKCM cohort. Calibration plots were established to assess the accuracy of the nomogram in predicting the 1-, 3-, and 5-year OS probability by using the “rms” R package.
Evaluation of immune infiltration, tumor microenvironment, stemness, and drug sensitivity
By using the CIBERSORT algorithm (Newman et al., 2015), we obtained the scores of 22 human immune cell subsets of every SKCM sample. By utilizing the ESTIMATE algorithm, we estimated the immune, stromal, and ESTIMATE scores of each SKCM sample (Yoshihara et al., 2013). The tumor mutation burden (TMB) score of each SKCM patient was calculated based on the mutation annotation format generated by using the somatic mutation data from TCGA via the “maftools” package. The stemness index of every SKCM sample was extracted from the file, including the stemness index of pan-cancer from the UCSC Xena website. The “pRRophetic” package was applied to calculate the semi-inhibitory concentration values of multiple drugs for SKCM patients.
Data were statistically analyzed with the R software (version 4.1.3). Unless otherwise specified (p < 0.001 in drug sensitivity analysis), the statistical significance was set as p < 0.05. The differences in clinical traits and survival probability in different groups were compared using the Chi-square test. The Kruskal-Wallis test was applied in the differential comparison of immune infiltration between two GM-related clusters and of risk scores in different GM-related subtypes and gene subtypes. The differential expression of GM-related genes in three gene clusters was analyzed by the Wilcoxon test, which was also used to compare GM-related gene expression, TME score, and drug sensitivity between high- and low-risk groups. The correlation analyses were carried out by Spearman’s correlation.
A workflow of this study has been shown in Fig. 1.
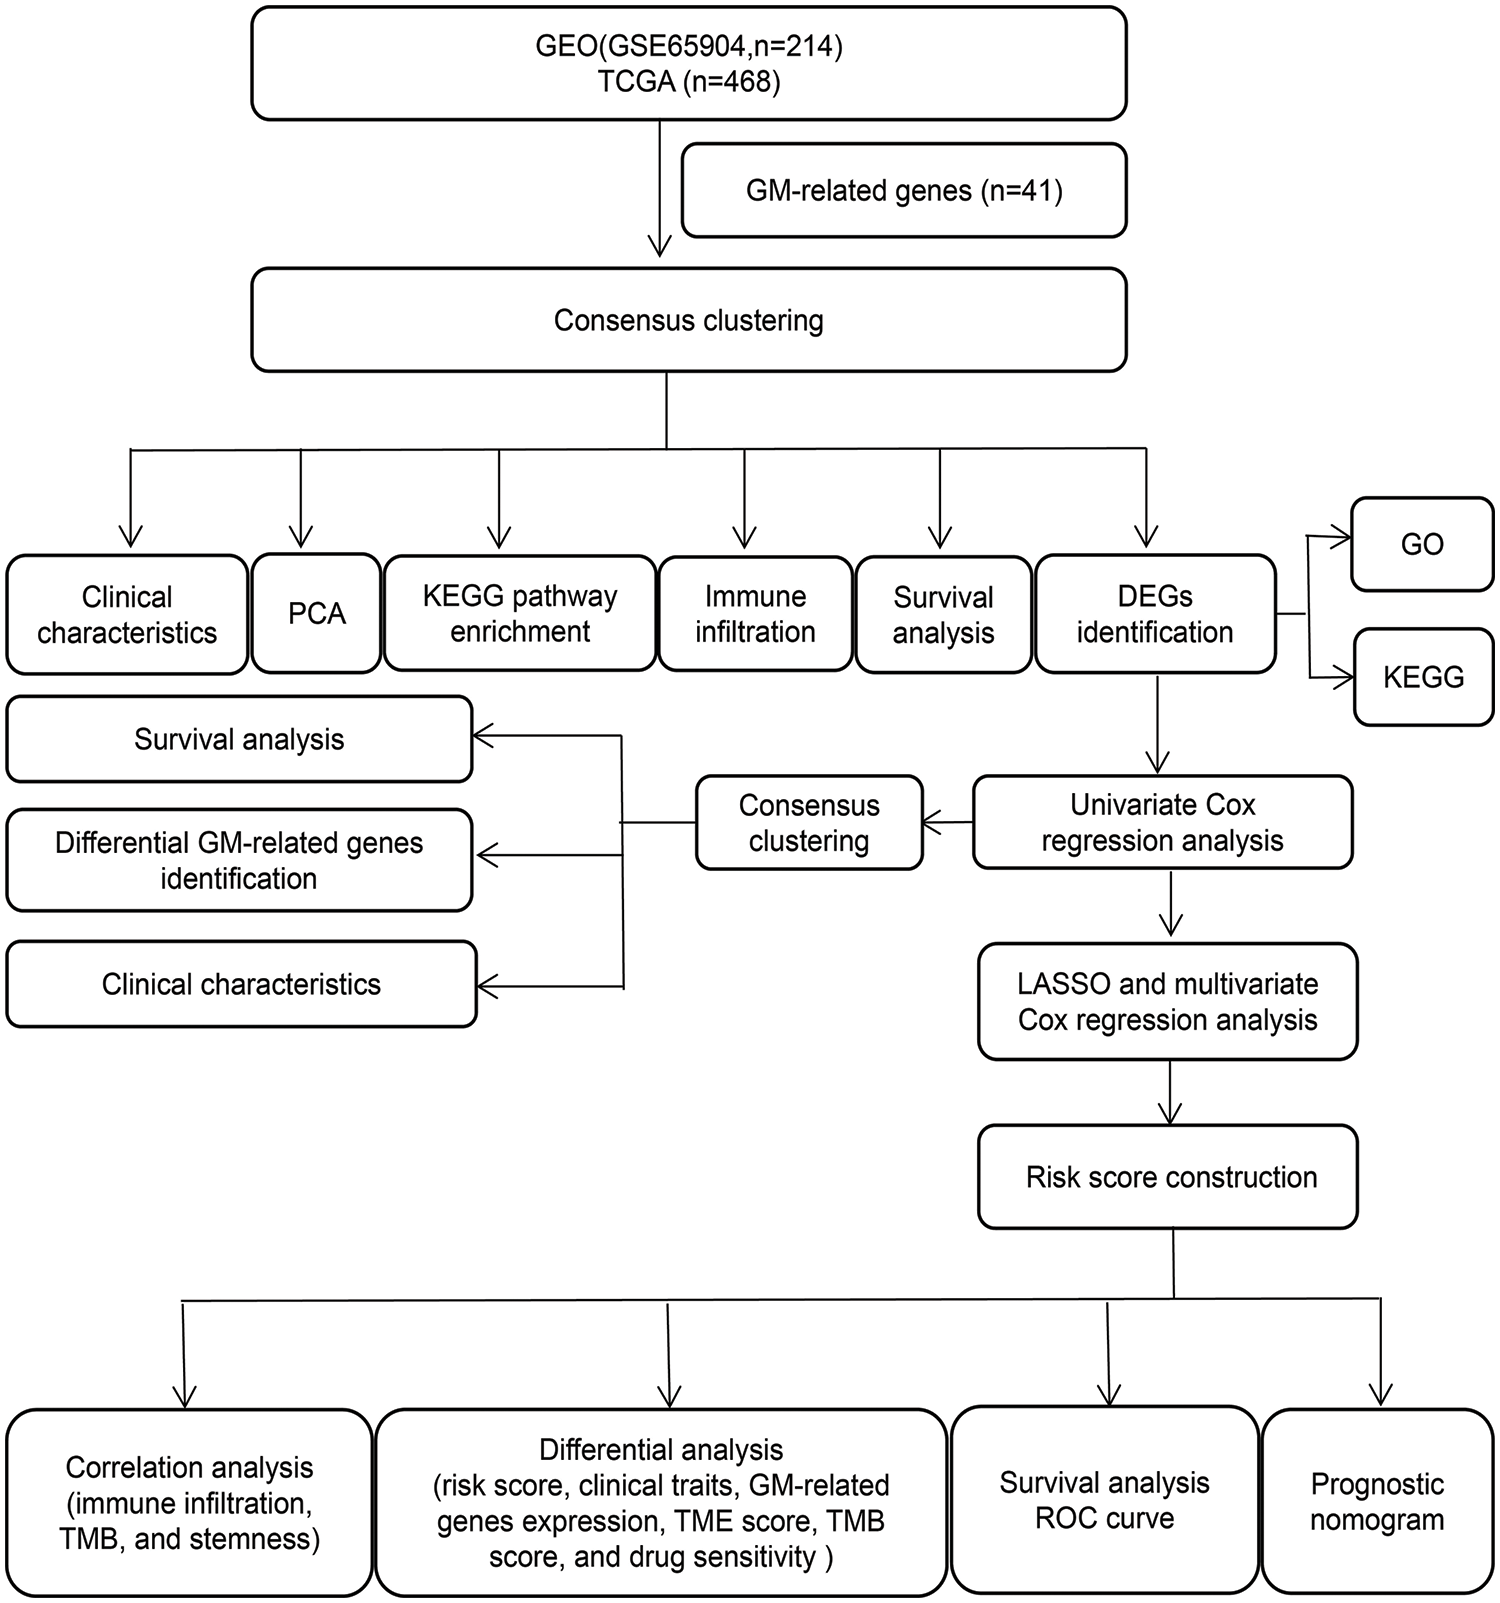
Figure 1: The workflow chart of the study.
Genetic mutation and copy number variations of glutamine metabolism-related genes in skin cutaneous melanoma
Firstly, we investigated the mutation of 41 GM-related genes in the TCGA-SKCM cohort. As depicted in Fig. 2a, 182 of 467 samples (approximately 38.97%) in the TCGA-SKCM cohort harbored mutations in GM-related regulators. Among these, SLC38A1 and SLC6A14 exhibited the highest mutation frequency (5%), followed by HAL, GAD1, TAT, and SLC6A19 (4%), while four GM-related genes (NAGS, SLC7A5, MTHFS, and PRODH) were devoid of mutations. Missense mutation and C > T constituted the most prevalent variation type and single nucleotide variation category, respectively. The CNV alteration locations in GM-related genes on chromosomes are depicted in Fig. 2b. Further analysis of the CNV alteration frequency in 41 GM-related genes revealed extensive duplications of CNV in SLC6A19, ALDH5A1, GLUL, MTHFS, SLC1A3, and PRODH, while the decrease in CNV was predominant in GCLM, ALDH4A1, and SLC7A5 (Fig. 2c).
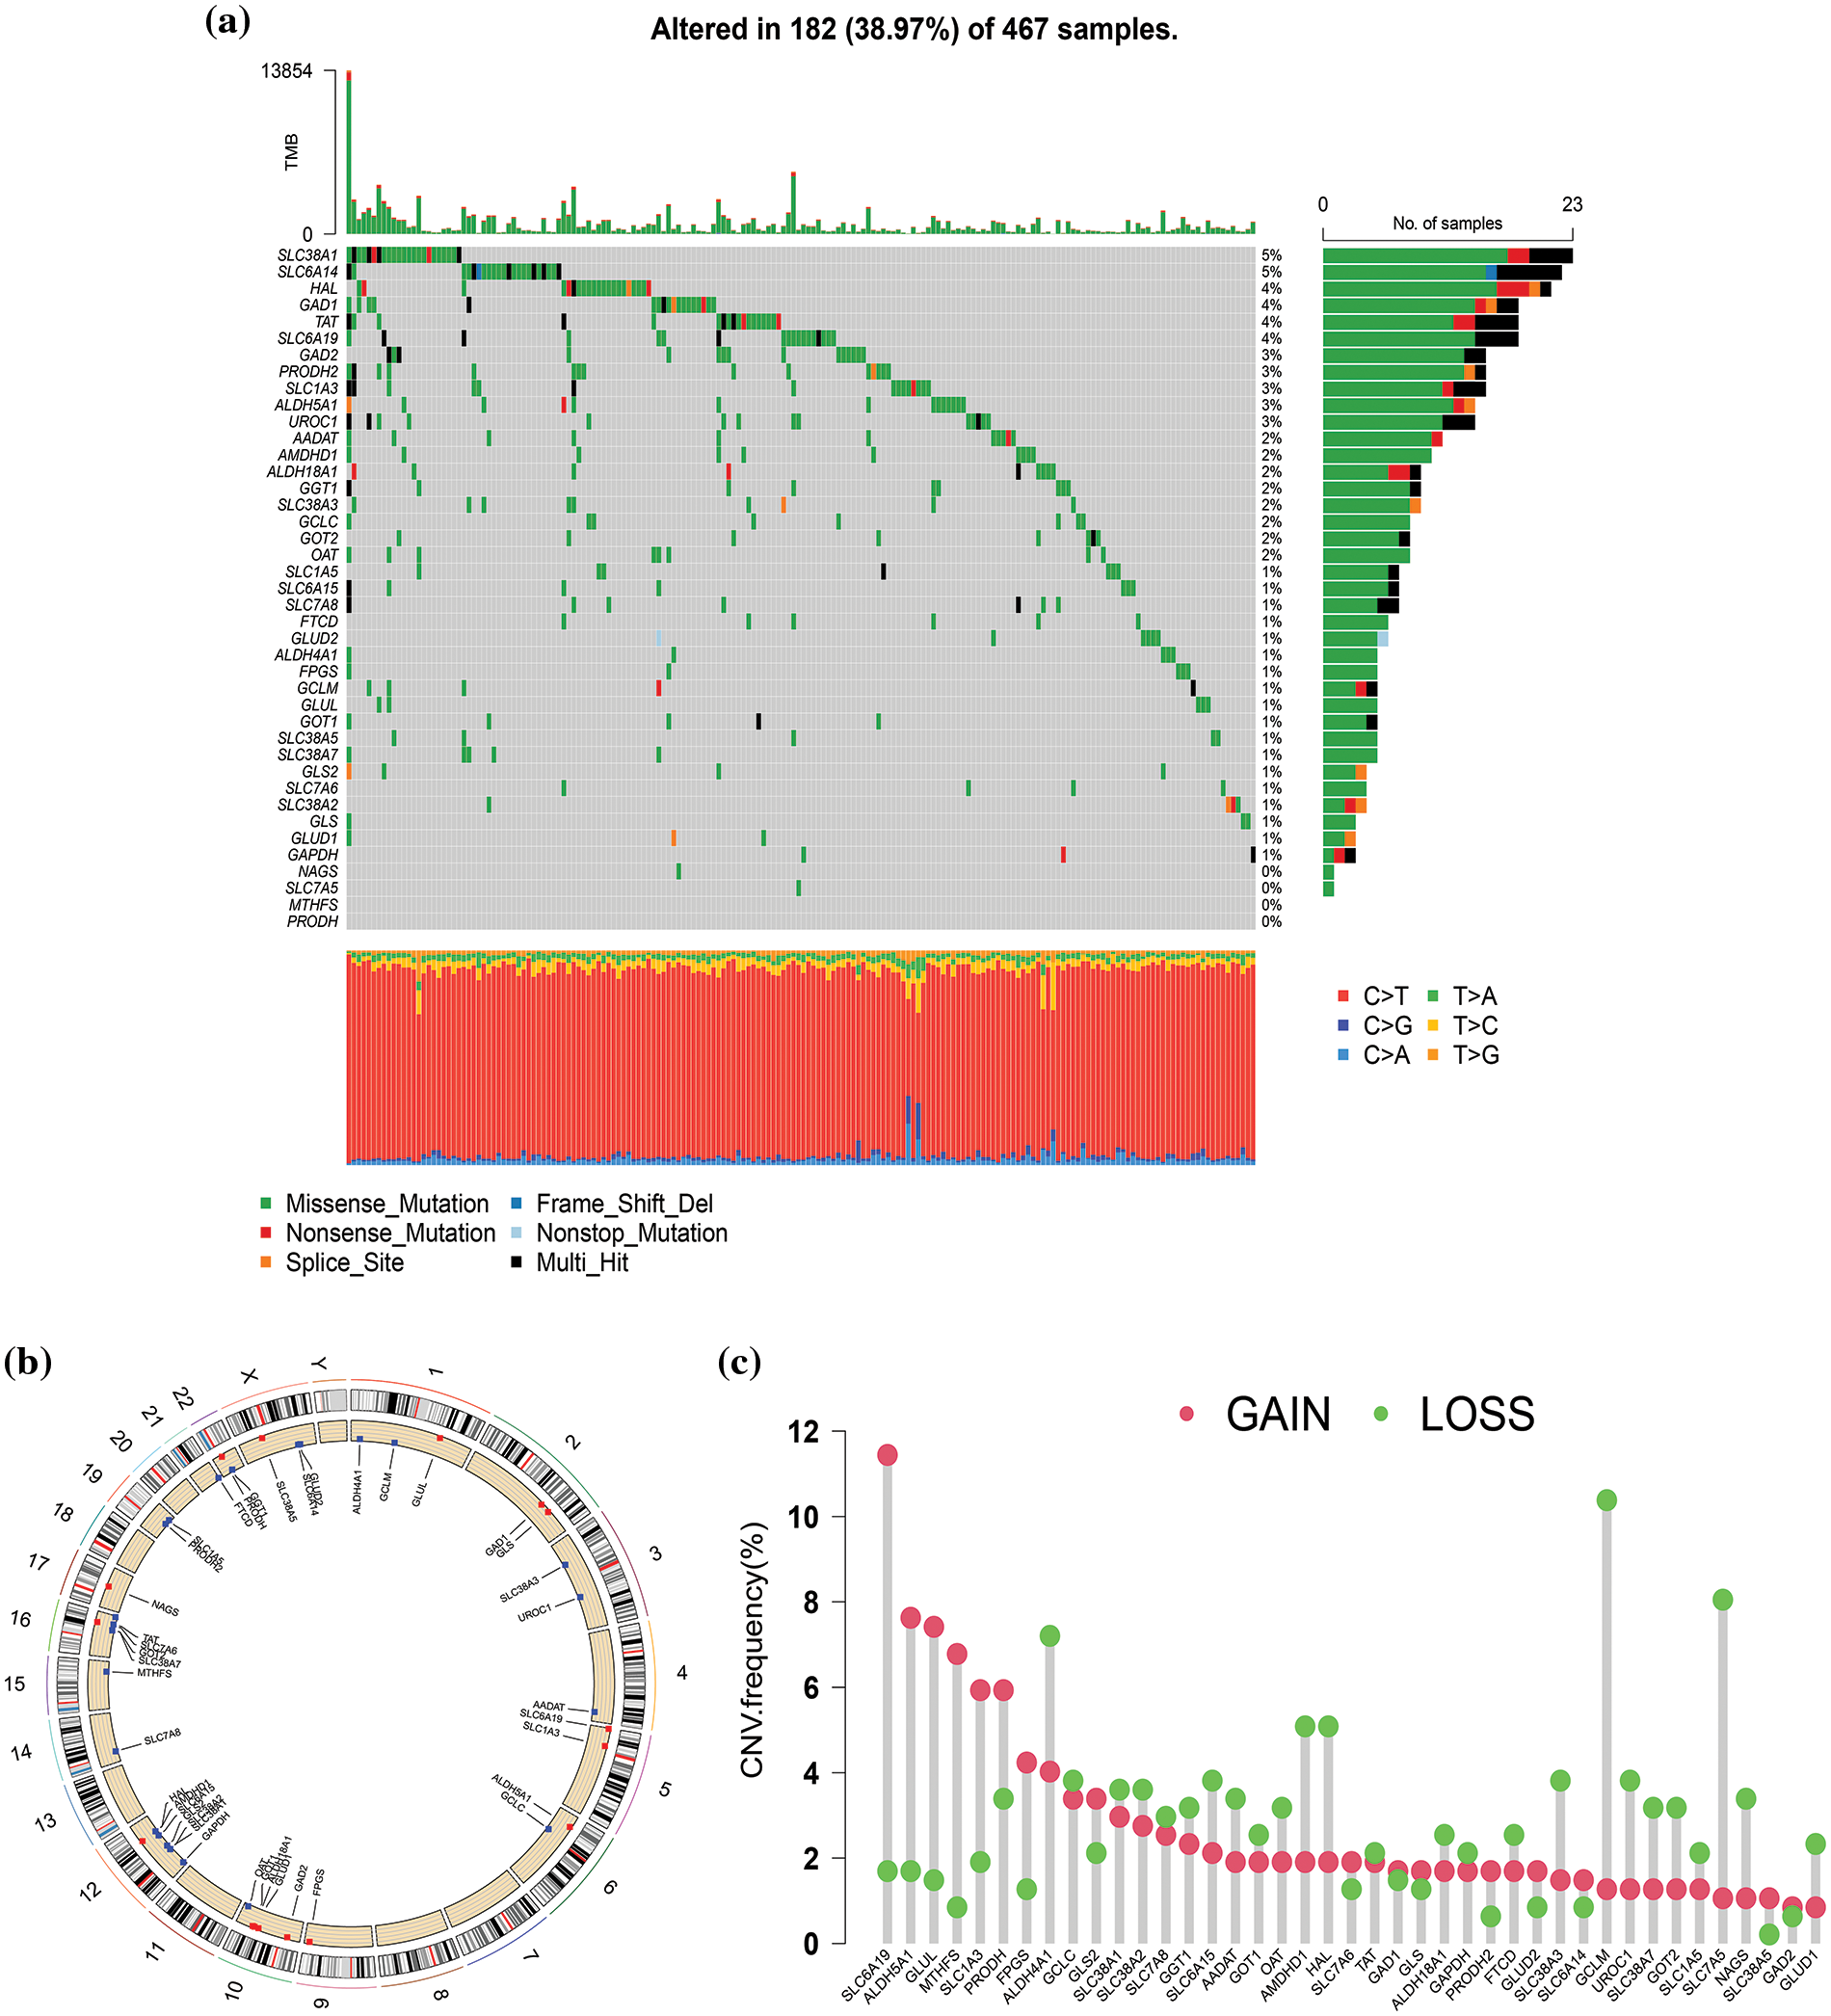
Figure 2: Genetic mutation of glutamine metabolism (GM)-related genes in skin cutaneous melanoma (SKCM). (a) The waterfall plot exhibited mutation frequency of 41 GM-related genes in 467 SKCM patients from The Cancer Genome Atlas (TCGA) cohort. (b) The location of copy number variation (CNV) alteration of GM-related genes on 23 chromosomes. (c) CNV frequency of GM-related regulators in 468 SKCM samples from TCGA database.
Determination of glutamine metabolism-related subtypes in skin cutaneous melanoma
To further investigate the expression characteristics of GM-related genes in SKCM, K-means cluster analysis was employed to stratify 682 SKCM patients in the merged cohort into distinct subtypes based on the expression of 41 GM-related genes. When the clustering variable (k) equaled 2, clustering stability was optimal (Fig. 3a, Suppl. Fig. S1). Consequently, 682 patients with SKCM were classified into subtypes A (n = 340) and B (n = 342) based on the expression of 41 GM-related genes. The classification ability of GM-related subtypes was validated by PCA (Fig. 3b). Then, the investigation into differences between the two subtypes followed. A significant difference in OS was observed between the two subtypes of patients with SKCM. Subtype B exhibited a higher survival probability compared to subtype A (p < 0.001) (Fig. 3c). The results of ssGSEA for assessing the infiltration level of immune cells in different GM-related clusters suggested that, in comparison to subtype A, infiltration levels of a majority of immune cells in subtype B were significantly higher (p < 0.01) (Fig. 3d). In the TCGA SKCM cohort, the gene expression profiles and clinical parameters between the two GM-associated clusters were analyzed. As demonstrated in Fig. 3e, the T stage (p < 0.001), tumor stage (p < 0.01), and age (p < 0.01) differed markedly between the two GM-related clusters. GSVA enrichment analysis to evaluate the enrichment of KEGG pathways in different GM-related subtypes revealed significant enrichment of subtype A in pathways of neurodegenerative diseases (Huntington’s disease, Alzheimer’s disease, and Parkinson’s disease), nucleotide metabolism (pyrimidine metabolism), transcription (aminoacyl-tRNA biosynthesis and RNA polymerase), energy metabolism (oxidative phosphorylation), carbohydrate metabolism (glyoxylate and dicarboxylate metabolism), and glycan biosynthesis (glycosylphosphatidylinositol (GPI)-anchor biosynthesis), whereas subtype B exhibited enrichment in pathways related to signal transduction (transforming growth factor-beta signaling pathway and the Janus kinase/signal transducer and activator of transcription signaling pathway), immune system (complement and coagulation cascades, nucleotide oligomerization domain-like receptor signaling pathway, hematopoietic cell lineage, leukocyte transendothelial migration, natural killer cell-mediated cytotoxicity), signaling molecules and interaction (cell adhesion molecules, and cytokine-cytokine receptor interaction), infectious diseases (leishmania infection), and immune diseases (systemic lupus erythematosus) (p < 0.05) (Fig. 3f). These findings demonstrate that GM-related genes classified SKCM patients into two distinct subtypes with differing OS, clinical features, biological functions, and immune status.
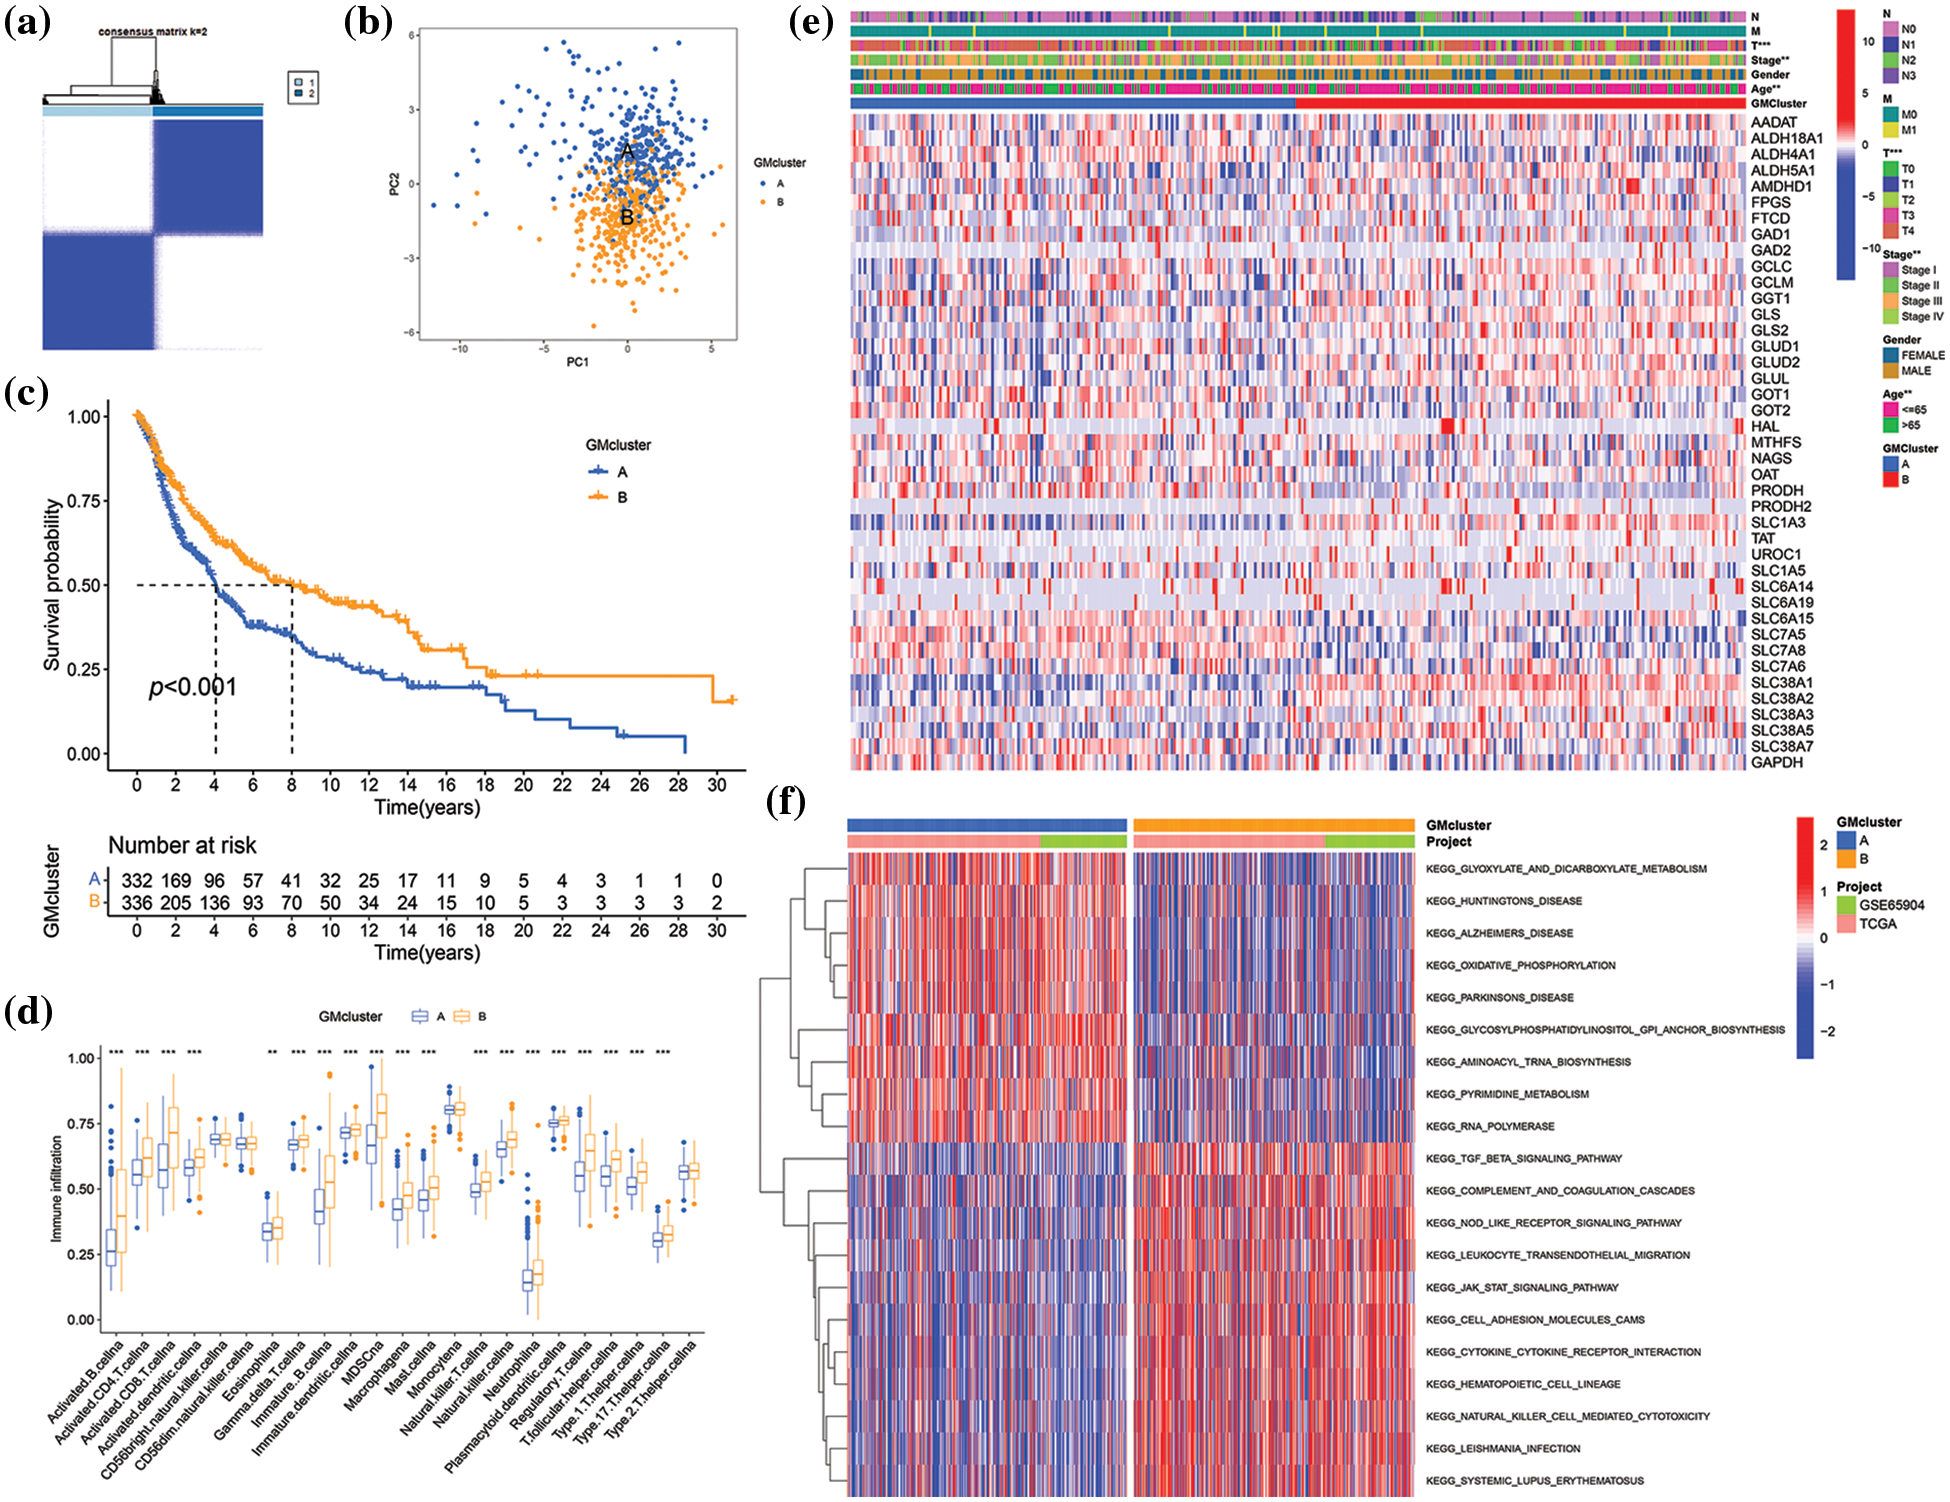
Figure 3: Skin cutaneous melanoma (SKCM) subgroups associated with glutamine-metabolism (GM)-related regulators and their clinicopathological characteristics. (a) Consensus clustering matrix when k = 2 in the integrated cohorts. (b) Principal component analysis displaying the distribution of transcriptomes between two clusters. (c) Kaplan−Meier plot showed a survival difference between subtypes A and B. (d) Comparison of immune infiltration between two subtypes. (e) The heatmap of clinical parameters and GM-related genes’ expression in two clusters in The Cancer Genome Atlas (TCGA) cohort. (f) Gene set Variation Analysis (GSVA) of Kyoto Encyclopedia of Genes and Genomes (KEGG) pathways enriched in two subtypes. Red indicates high enrichment, and blue indicates low enrichment. p < 0.05 was regarded as a significant difference. * indicated p < 0.05, ** indicated p < 0.01, *** indicated p < 0.001.
Screening of differentially expressed genes and identification of gene subtypes
To investigate the potential biological functions of different GM molecular subtypes, 368 DEGs were first identified based on the two GM-related subtypes in the combined datasets (|log2FC| > 1, p < 0.001). Subsequently, GO and KEGG pathway enrichment were analyzed to elucidate the biological behavior of DEGs. The 368 DEGs were associated with immunity (T cell activation, mononuclear cell differentiation, and regulation of T cell activation), external side of the plasma membrane, cytokine−cytokine receptor interaction, and so on (Figs. 4a and 4b). Thus, we hypothesized that GM might exert an essential role in the regulation of immunity and cytokine−cytokine receptor interaction in SKCM. To determine the prognostic value of the 368 DEGs, univariate Cox regression analysis was performed, identifying 292 genes correlated with OS (p < 0.05) for subsequent analysis. Among these, 261 genes were associated with low risk (hazard ratio (HR) < 1), while 31 genes were related to high risk (HR > 1). To validate the regulation mechanism above, a consensus clustering analysis was conducted employing these 292 genes. The unsupervised clustering method stratified 682 SKCM patients in the merged cohorts into three genomic subtypes: gene subtype A (n = 254), B (n = 166), and C (n = 262) (Fig. 4c, Suppl. Fig. S2). The three gene subtypes exhibited a significant difference in OS, with subtype B having the highest survival probability and subtype C the lowest (p < 0.001) (Fig. 4d). Additionally, the expression of 30 GM-related genes differed significantly between subtypes A, B, and C (p < 0.05), in accordance with the expected results of the GM patterns (Fig. 4e). The heatmap depicted the differences in gene expression and clinical characteristics among the three gene clusters. T stage (p < 0.001), tumor stage (p < 0.001), age (p < 0.01), and GM-related cluster (p < 0.001) were diversely distributed among the three gene subtypes (Fig. 4f). These findings demonstrated markedly distinct OS, clinical characteristics, and GM-related gene expressions of the three molecular subtypes.
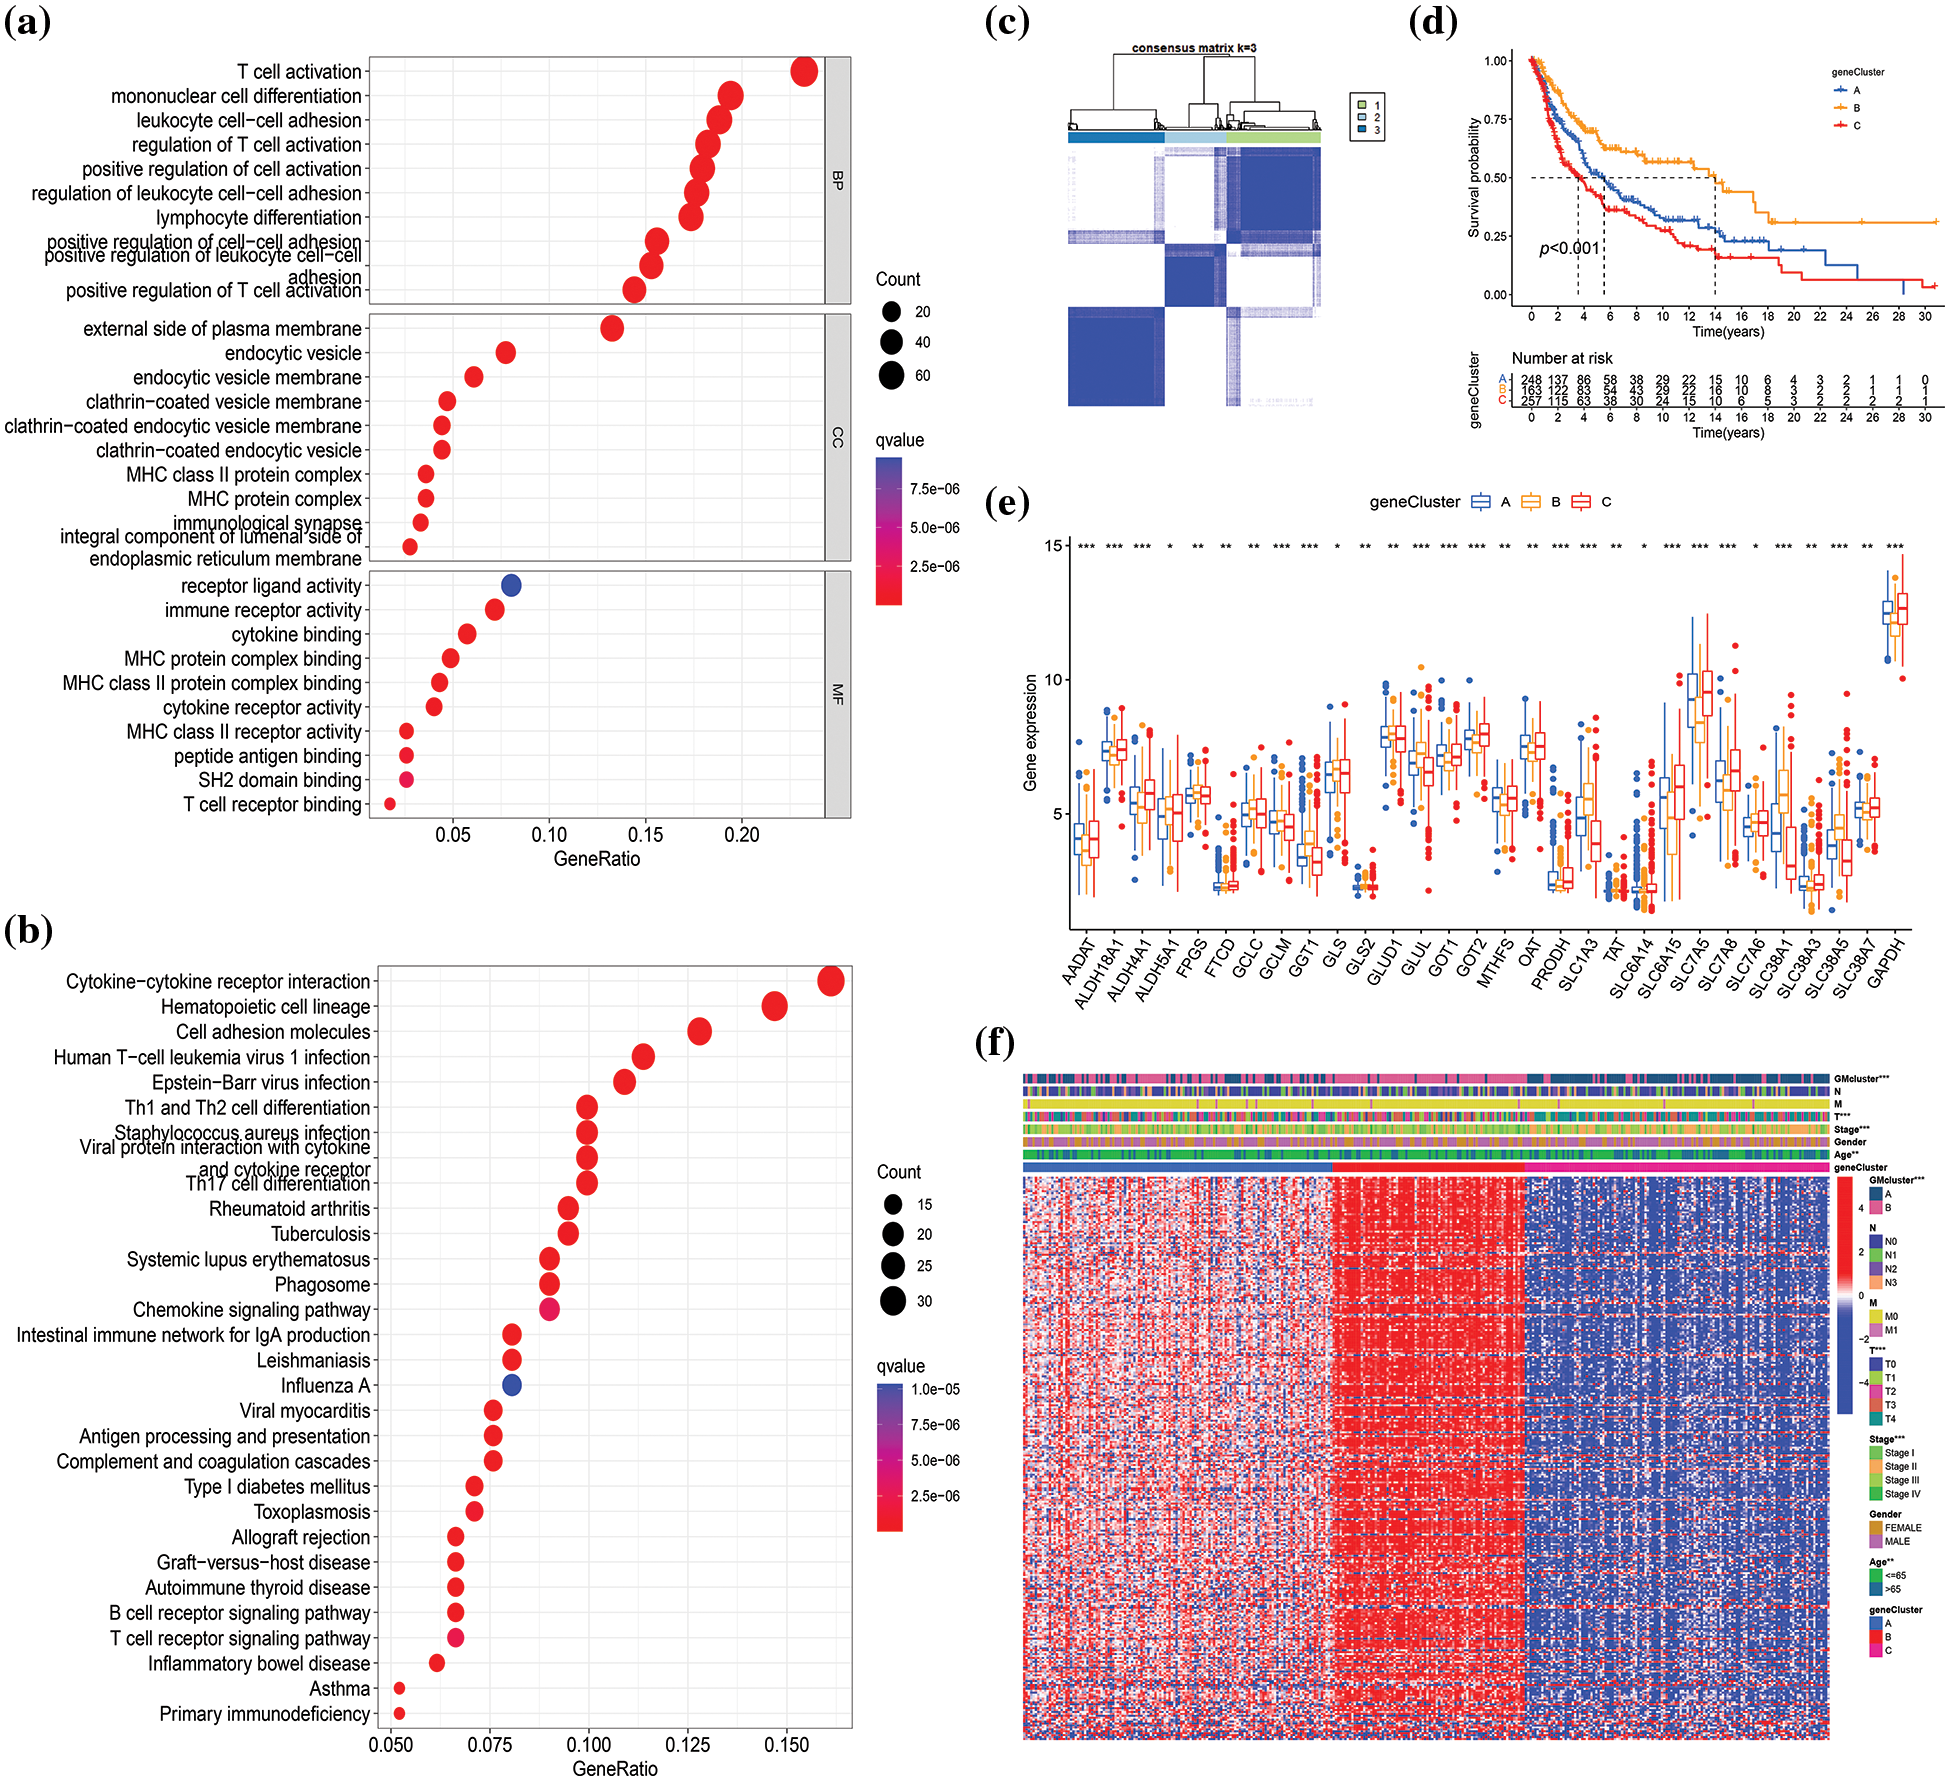
Figure 4: Identification of glutamine-metabolism (GM)-related gene subtypes based on 368 differentially expressed genes (DEGs) from different molecular subtypes. GO (a) and KEGG (b) analyses of DEGs in the merged cohorts, respectively. BP: biological process, CC: cellular component, MF: molecular function. (c) Consensus clustering matrix when k = 3 in the integrated cohorts. (d) Differences in survival probability among different gene clusters are presented by the Kaplan-Meier plot. (e) Differential analysis of GM-related genes’ expression in three gene subtypes. (f) The heatmap visualizing the gene profiles, clinical information, and GM-related clusters in three gene clusters in The Cancer Genome Atlas (TCGA) cohort. p < 0.05 indicated a statistical difference. * indicated p < 0.05, ** indicated p < 0.01, *** indicated p < 0.001.
Construction and validation of the prognostic risk score
A risk score was established to assess the prognostic prediction role of prognostic DEGs in SKCM. First, 668 SKCM patients with complete survival information were randomly and equally divided into training and testing groups. Utilizing LASSO and multivariate Cox analysis for the 292 prognostic DEGs, six OS-associated genes (IL18, TNFRSF17, SEMA6A, AIM2, CXCL10, PAEP) were identified to construct the risk score in the training group according to the following formula: risk score = (0.304 × IL18 expression) + (−0.217 × TNFRSF17 expression) + (0.139 × SEMA6A expression) + (−0.114 × AIM2 expression) + (−0.102 × CXCL10 expression) + (0.069 × PAEP expression). Subsequently, 668 SKCM cases were classified into low-risk (n = 347) and high-risk (n = 321) subgroups based on the median cutoff value calculated using the above-mentioned formula. The LASSO analysis results, including the coefficient and partial likelihood deviance on the prognostic genes, are presented in Suppl. Fig. S3. To more intuitively display the distribution of SKCM patients in different groups (two GM-related clusters, three gene clusters, and two risk-score groups), a Sankey diagram was constructed, as depicted in Fig. 5a. Based on Kaplan-Meier curves, it was determined that SKCM patients with low-risk scores had a distinct survival advantage over those with high-risk scores (p < 0.001) (Fig. 5b, Suppl. Fig. S4A, Suppl. Fig. S5A). Moreover, as the risk score increased, the rate of mortality of patients also increased, and survival time decreased (Figs. 5c and 5d, Suppl. Fig. S4B, Suppl. Fig. S5B). The area under the ROC curve was 0.677, 0.684, and 0.690 at 1-, 3-, and 5-year, respectively, indicating that this prognostic model exhibited good performance in predicting the prognosis of SKCM patients (Fig. 5e, Suppl. Fig. S4C, Suppl. Fig. S5C). To further confirm the prognostic prediction role of signature genes, we used a public database GEPIA for external validation. As illustrated in Suppl. Fig. S6, the mRNA expression levels of AIM2, CXCL10, and SEMA6A in tumors were significantly higher than those in normal tissues (p < 0.01), while the expression of IL18 was markedly decreased in tumors compared with normal tissues (p < 0.01). The impact of these genes on SKCM prognosis was confirmed by GEPIA. SKCM patients with high expression of AIM2, CXCL10, IL18, and TNFRSF17 had higher survival rates than those with low expression of these genes, while high expression of PAEP and SEMA6A predicted poor prognosis (Suppl. Fig. S7).
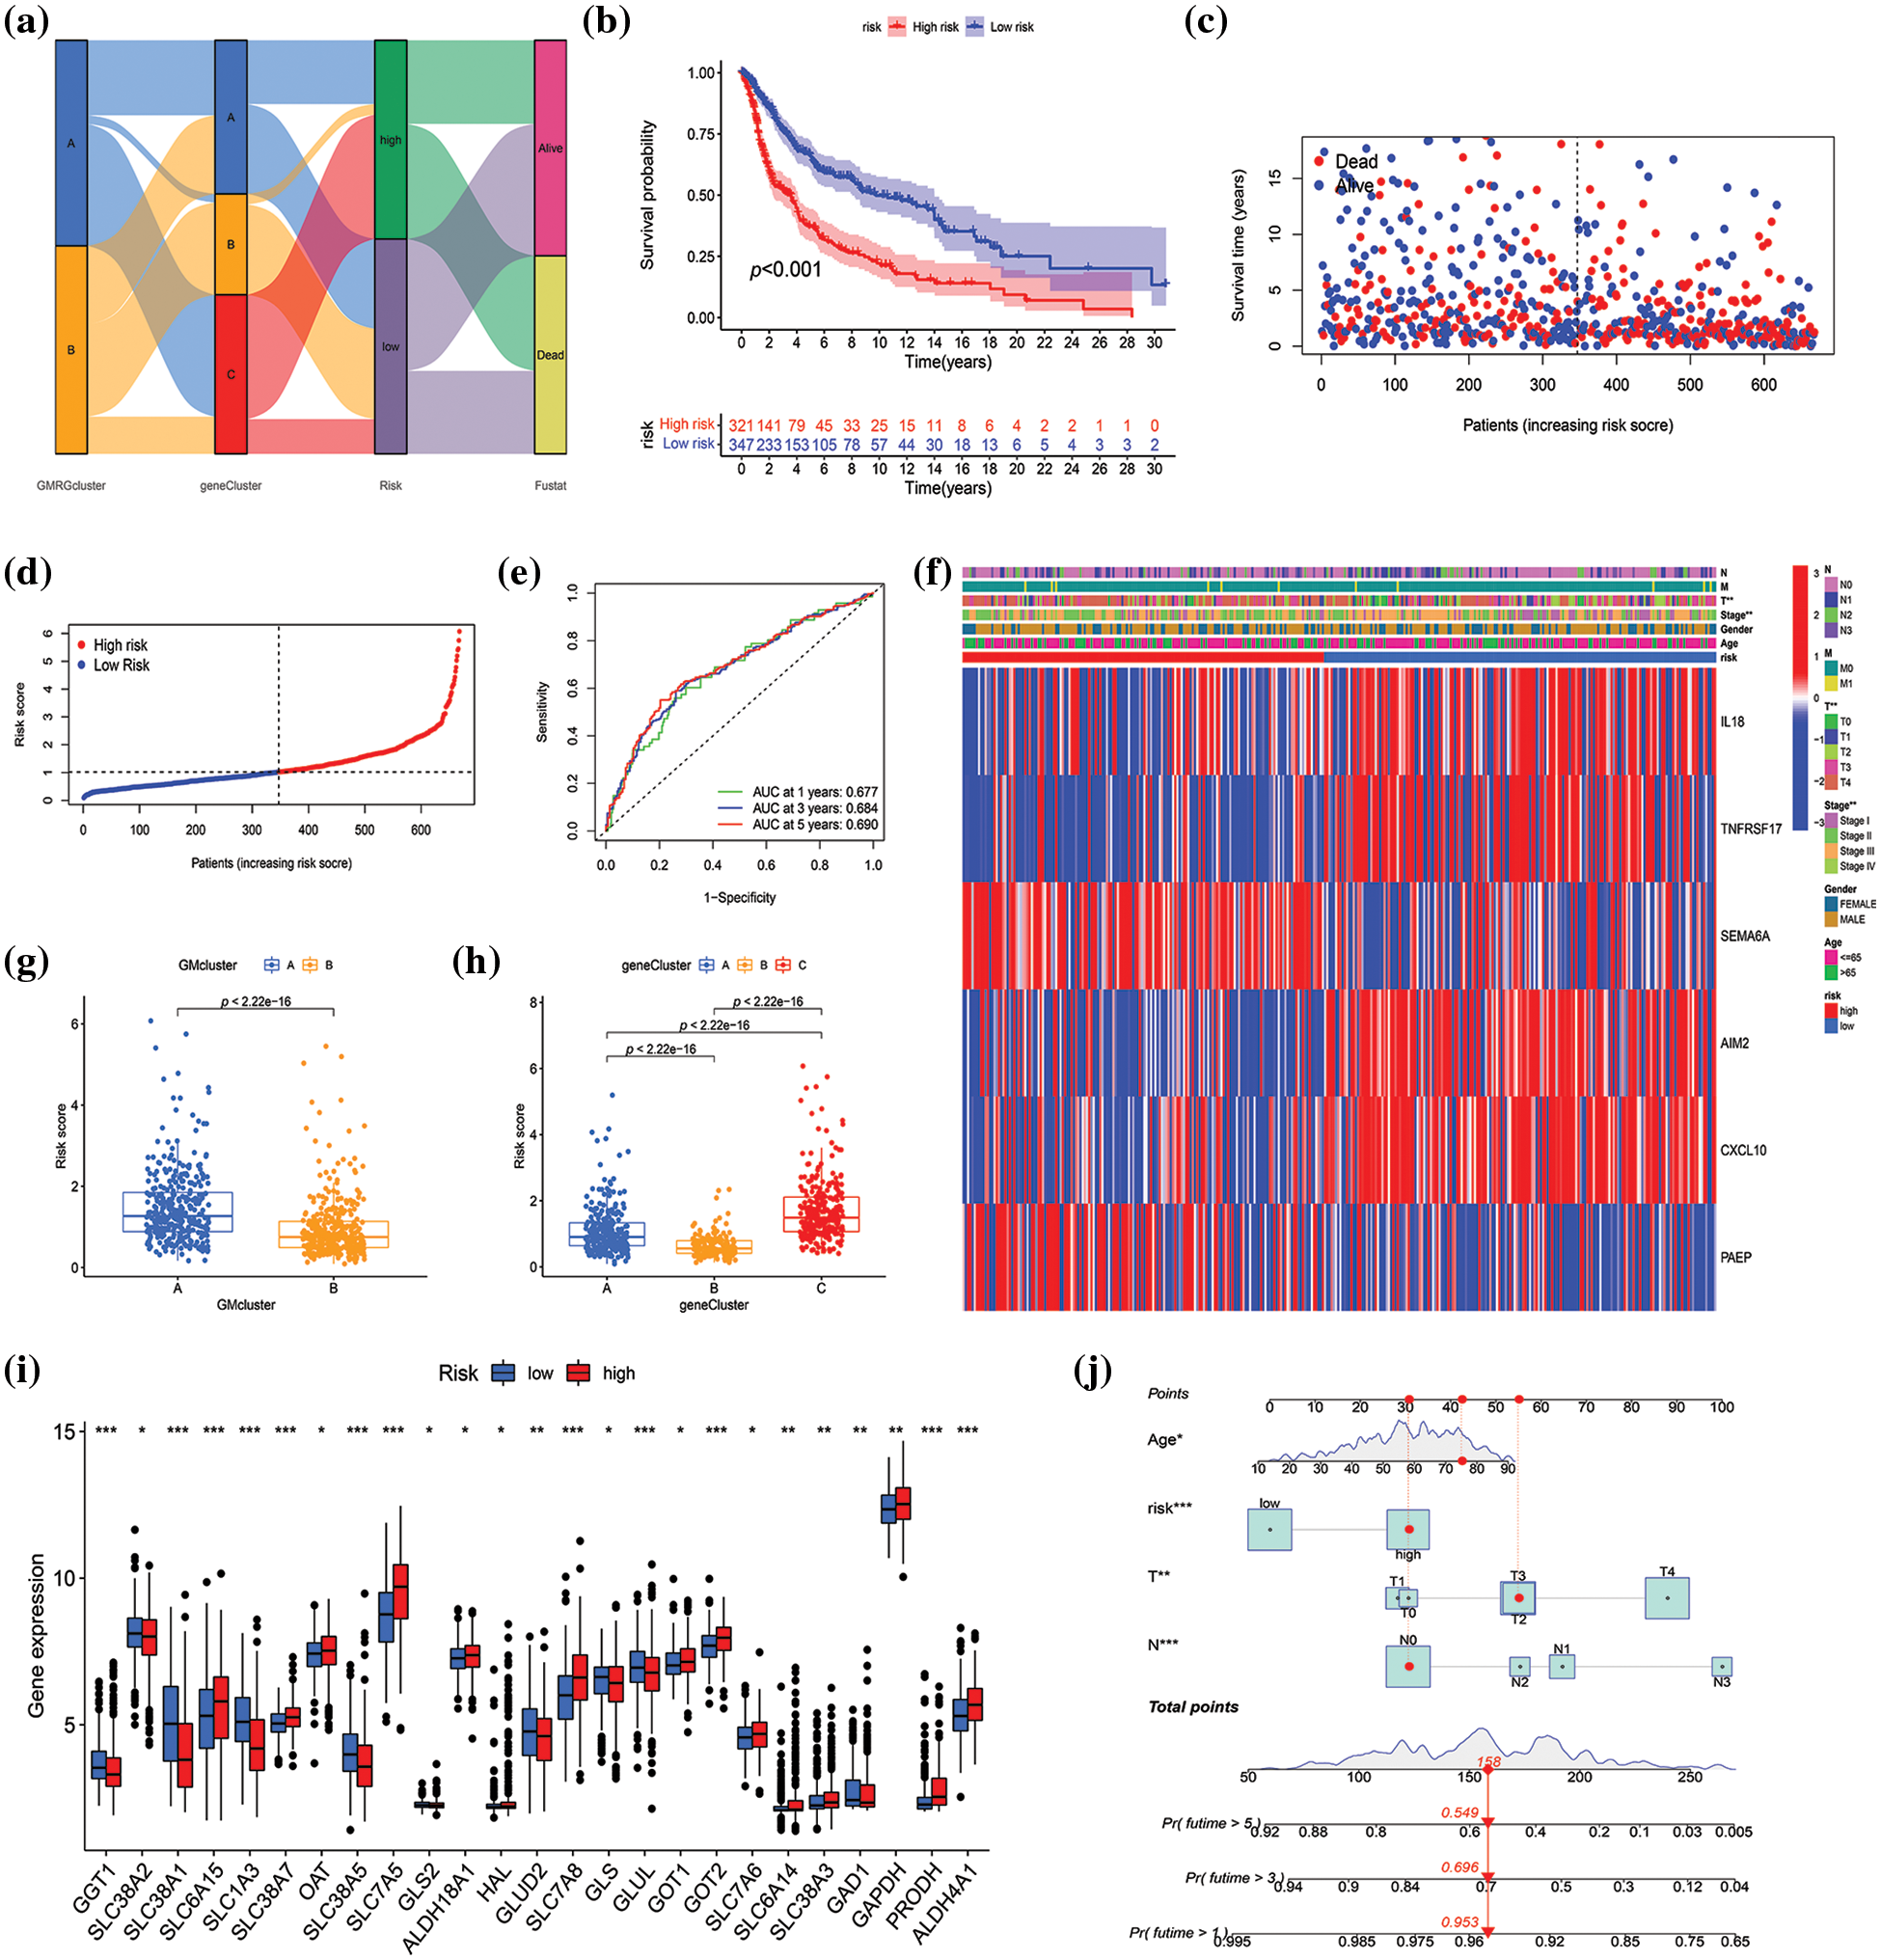
Figure 5: Construction and validation of the risk model in the merged datasets. (a) Sankey diagram of cluster distributions, distinct risk scores, and survival outcomes. (b) Survival analysis between high- and low-score groups. (c–d) The risk score distribution and survival status in the merged datasets displayed by ranked dot and scatter plots, respectively. (e) Receiver operating characteristic curves showed the predictive efficiency of the risk score in the prediction of 1-, 3-, and 5-year survival. (f) Heatmap exhibited six prognostic gene expression profiles and clinical features’ differences between high- and low-risk groups. (g and h) Differences in risk scores between two glutamine metabolism (GM)-related subtypes and three gene subtypes, respectively. (i) Differential analysis of GM-related gene expression level between high- and low-score groups. (j) The nomogram constructed according to age, risk score, T and N stage for predicting the 1-, 3-, and 5-year overall survival (OS) of patients with SKCM. p < 0.05 was regarded as a significant difference. * indicated p < 0.05, ** indicated p < 0.01, *** indicated p < 0.001.
The heatmap revealed the differential expression of six prognosis-associated genes between high- and low-risk groups (Fig. 5f, Suppl. Fig. S4D, Suppl. Fig. S5D). T stage and stage were verified significantly different between high- and low-risk groups (p < 0.01) (Fig. 5f). Additionally, significant differences were also observed in risk scores between both GM-related subtypes (p < 0.001) and the three gene subtypes (p < 0.001) (Figs. 5g and 5h). For GM-related subtypes, the risk score of subtype A was higher than that of subtype B. Regarding gene subtypes, the risk score of subtype B was the lowest, while that of subtype C was the highest. Ultimately, there were 25 GM-related DEGs between the high- and low-risk groups (p < 0.05) (Fig. 5i). The results above indicated that the risk score had the potential to predict SKCM patients’ prognosis and was significantly related to GM-related gene expression in SKCM. Furthermore, to apply the risk score in the clinical prediction of OS of SKCM patients more conveniently, a nomogram for the quantitative estimation of survival outcomes in SKCM patients within the TCGA cohort, considering risk score, age, T stage, and N stage (Fig. 5j). The calibration curve for survival prediction substantiated the predictive accuracy of the nomogram (Suppl. Fig. S8).
Evaluation of immune infiltrating, tumor microenvironment, and tumor mutation burden
The connection between risk score and immune cell infiltration was explored using the CIBERSORT algorithm, and Spearman correlation analysis was conducted. The findings revealed that the risk score was inversely correlated with the scores of γ δ T cells (p < 0.001), CD8+ T cells (p < 0.001), activated CD4+ memory T cells (p < 0.001), plasma cells (p < 0.001), M1 macrophages (p < 0.001), and memory B cells (p < 0.001), while positively correlated with the scores of activated dendritic cells (p < 0.05), M0 and M2 macrophages (p < 0.001), monocytes (p < 0.05), and resting NK cells (p < 0.05) (Fig. 6a). The relationships between the six genes in the constructed model and immune cells were evaluated, as depicted in Fig. 6b, demonstrating the association of these six genes with most immune cells (p < 0.05). TME differential analysis indicated that, compared with the low-risk group, the high-risk group exhibited lower stromal, immune, and ESTIMATscores (p < 0.001) (Fig. 6c). Next, the distribution alterations of the somatic mutations between high- and low-risk groups in the TCGA-SKCM cohort were explored. As shown in Figs. 7a and 7b, 86.7% and 95.34% of TCGA SKCM samples exhibited gene mutations in the high- and low-risk groups, respectively. The top ten genes with the highest mutation rates were TTN, MUC16, BRAF, DNAH5, PCLO, LRP1B, ADGRV1, RP1, CSMD1, and DNAH7. Accumulating evidence suggests that TMB may predict the efficacy of immunotherapy in multiple solid tumors as a biomarker (Strickler et al., 2021). Consequently, the correlation analysis of risk score with TMB and differential analysis of TMB between high- and low-risk groups were conducted. However, Spearman correlation analysis revealed no evident correlation between the risk score and TMB score through (p = 0.077) (Fig. 7c). Additionally, the TMB scores between the two risk groups did not exhibit a notable difference (p = 0.059) (Fig. 7d).
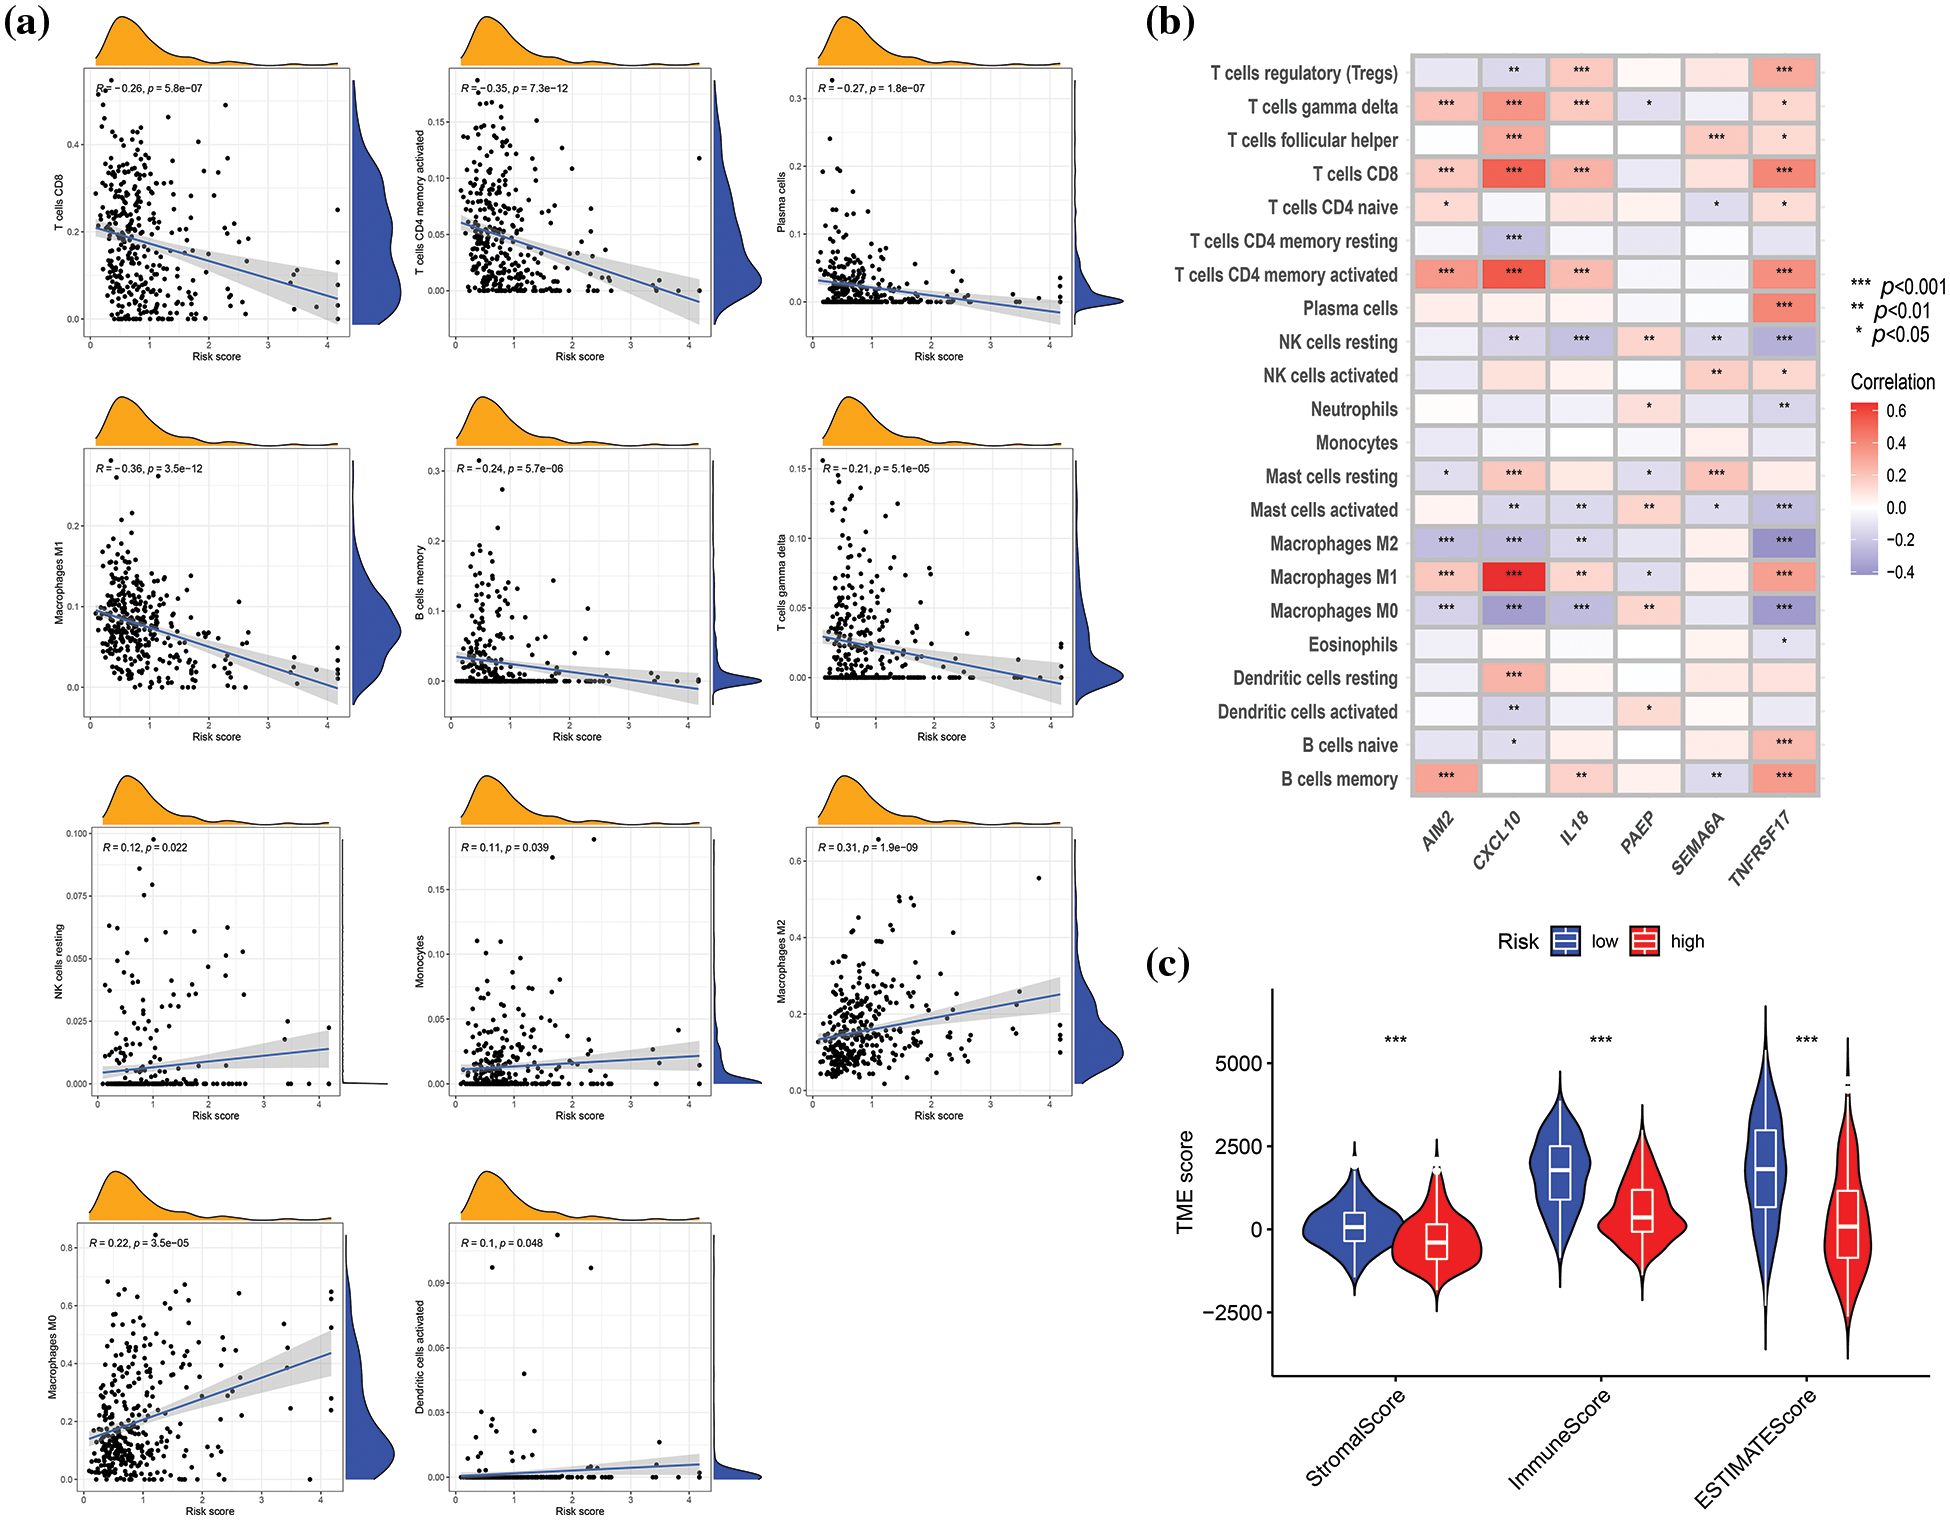
Figure 6: Correlation evaluation of tumor microenvironment (TME) with a risk score. (a) Relationships between risk score and immune infiltration by correlation analyses. (b) Correlation analysis revealed the association between the abundance of immune cells and six genes involved in the risk score. (c) Differences in TME characteristics (stromal, immune, and ESTIMATE score) between two risk groups. p < 0.05 was regarded as a significant difference. * indicated p < 0.05, ** indicated p < 0.01, *** indicated p < 0.001.
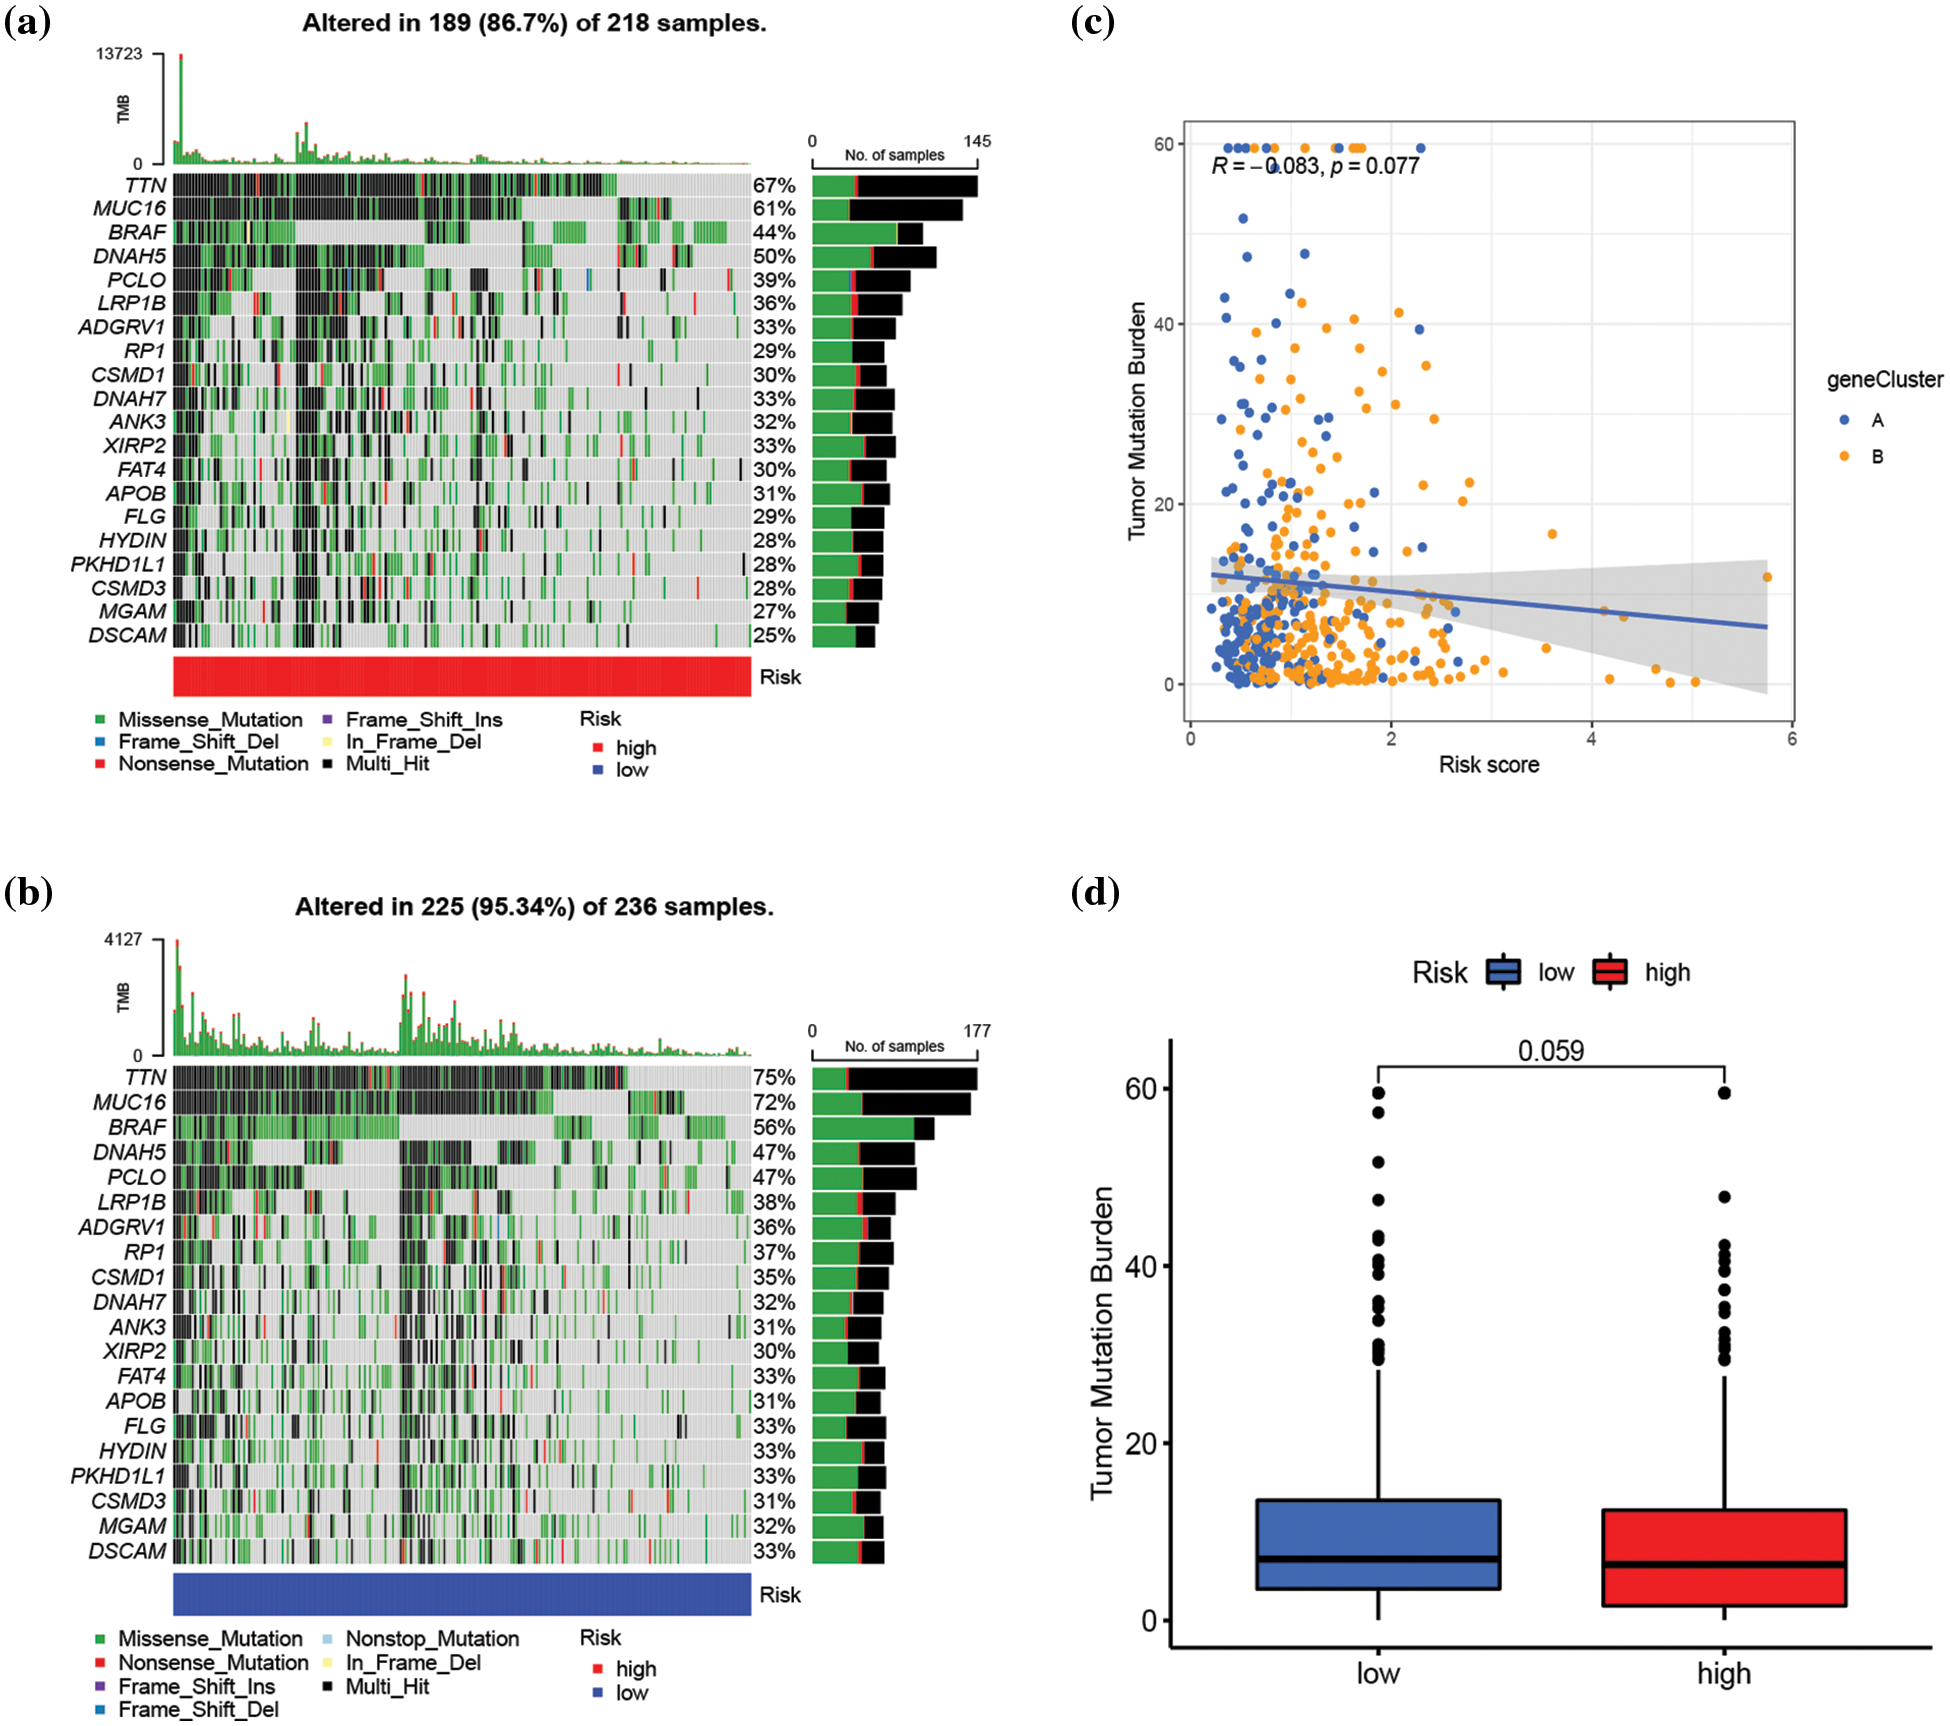
Figure 7: Assessment of the correlation between tumor mutation burden (TMB) and risk score. (a and b) The waterfall plot of somatic mutation characteristics in high- and low-risk groups, respectively. (c) Correlation analysis between risk score and TMB score. (d) The difference in TMB score between high- and low-risk groups. p < 0.05 was regarded as a significant difference.
Assessment of stemness and drug sensitivity
Genes associated with stemness play a crucial role in tumor proliferation and cancer recurrence (Ouyang et al., 2021). As a result, the correlation between risk score and stemness index was evaluated. The risk score exhibited a positive correlation with the stemness index (R = 0.24, p < 0.001) (Fig. 8a). The impact of risk score on predicting the sensitivity of SKCM to various drugs was investigated by conducting a drug sensitivity analysis to compare differences in the sensitivity of specific drugs between high- and low-risk groups. As illustrated in Fig. 8b–8l and Suppl. Fig. S9, the low-risk group demonstrated heightened sensitivity to 50 drugs (ABT.263, ABT.888, AICAR, AP.24534, ATRA, AZD.2281, AZD6482, AZD7762, AZD8055, BAY.61.3606, BI.D1870, Bleomycin, Bortezomib, Bosutinib, BX.795, Camptothecin, CGP.60474, CI.1040, Cisplatin, Cyclopamine, DMOG, GDC.0449, GDC0941, Gefitinib, Gemcitabine, IPA.3, JNK.Inhibitor.VIII, Lenalidomide, Metformin, Methotrexate, Mitomycin.C, MK.2206, Nilotinib, NVP.BEZ235, PAC.1, PF.02341066, Rapamycin, Roscovitine, SB.216763, SL.0101.1, Sunitinib, Temsirolimus, Vinblastine, Vorinostat, VX.702, X681640, XMD8.85, Z.LLNle. CHO, PD.173074, and ZM.447439) while the high-risk group exhibited increased sensitivity to 25 drugs (Bexarotene, BI.2536, Bicalutamide, BMS.754807, Bryostatin.1, CHIR.99021, Elesclomol, FH535, GNF.2, GSK.650394, GW.441756, Imatinib, KIN001.135, LFM.A13, MG.132, NSC.87877, OSI.906, PD.0325901, PF.562271, PF.4708671, PHA.665752, QS11, RDEA119, Thapsigargin, FTI.277) (p < 0.001).
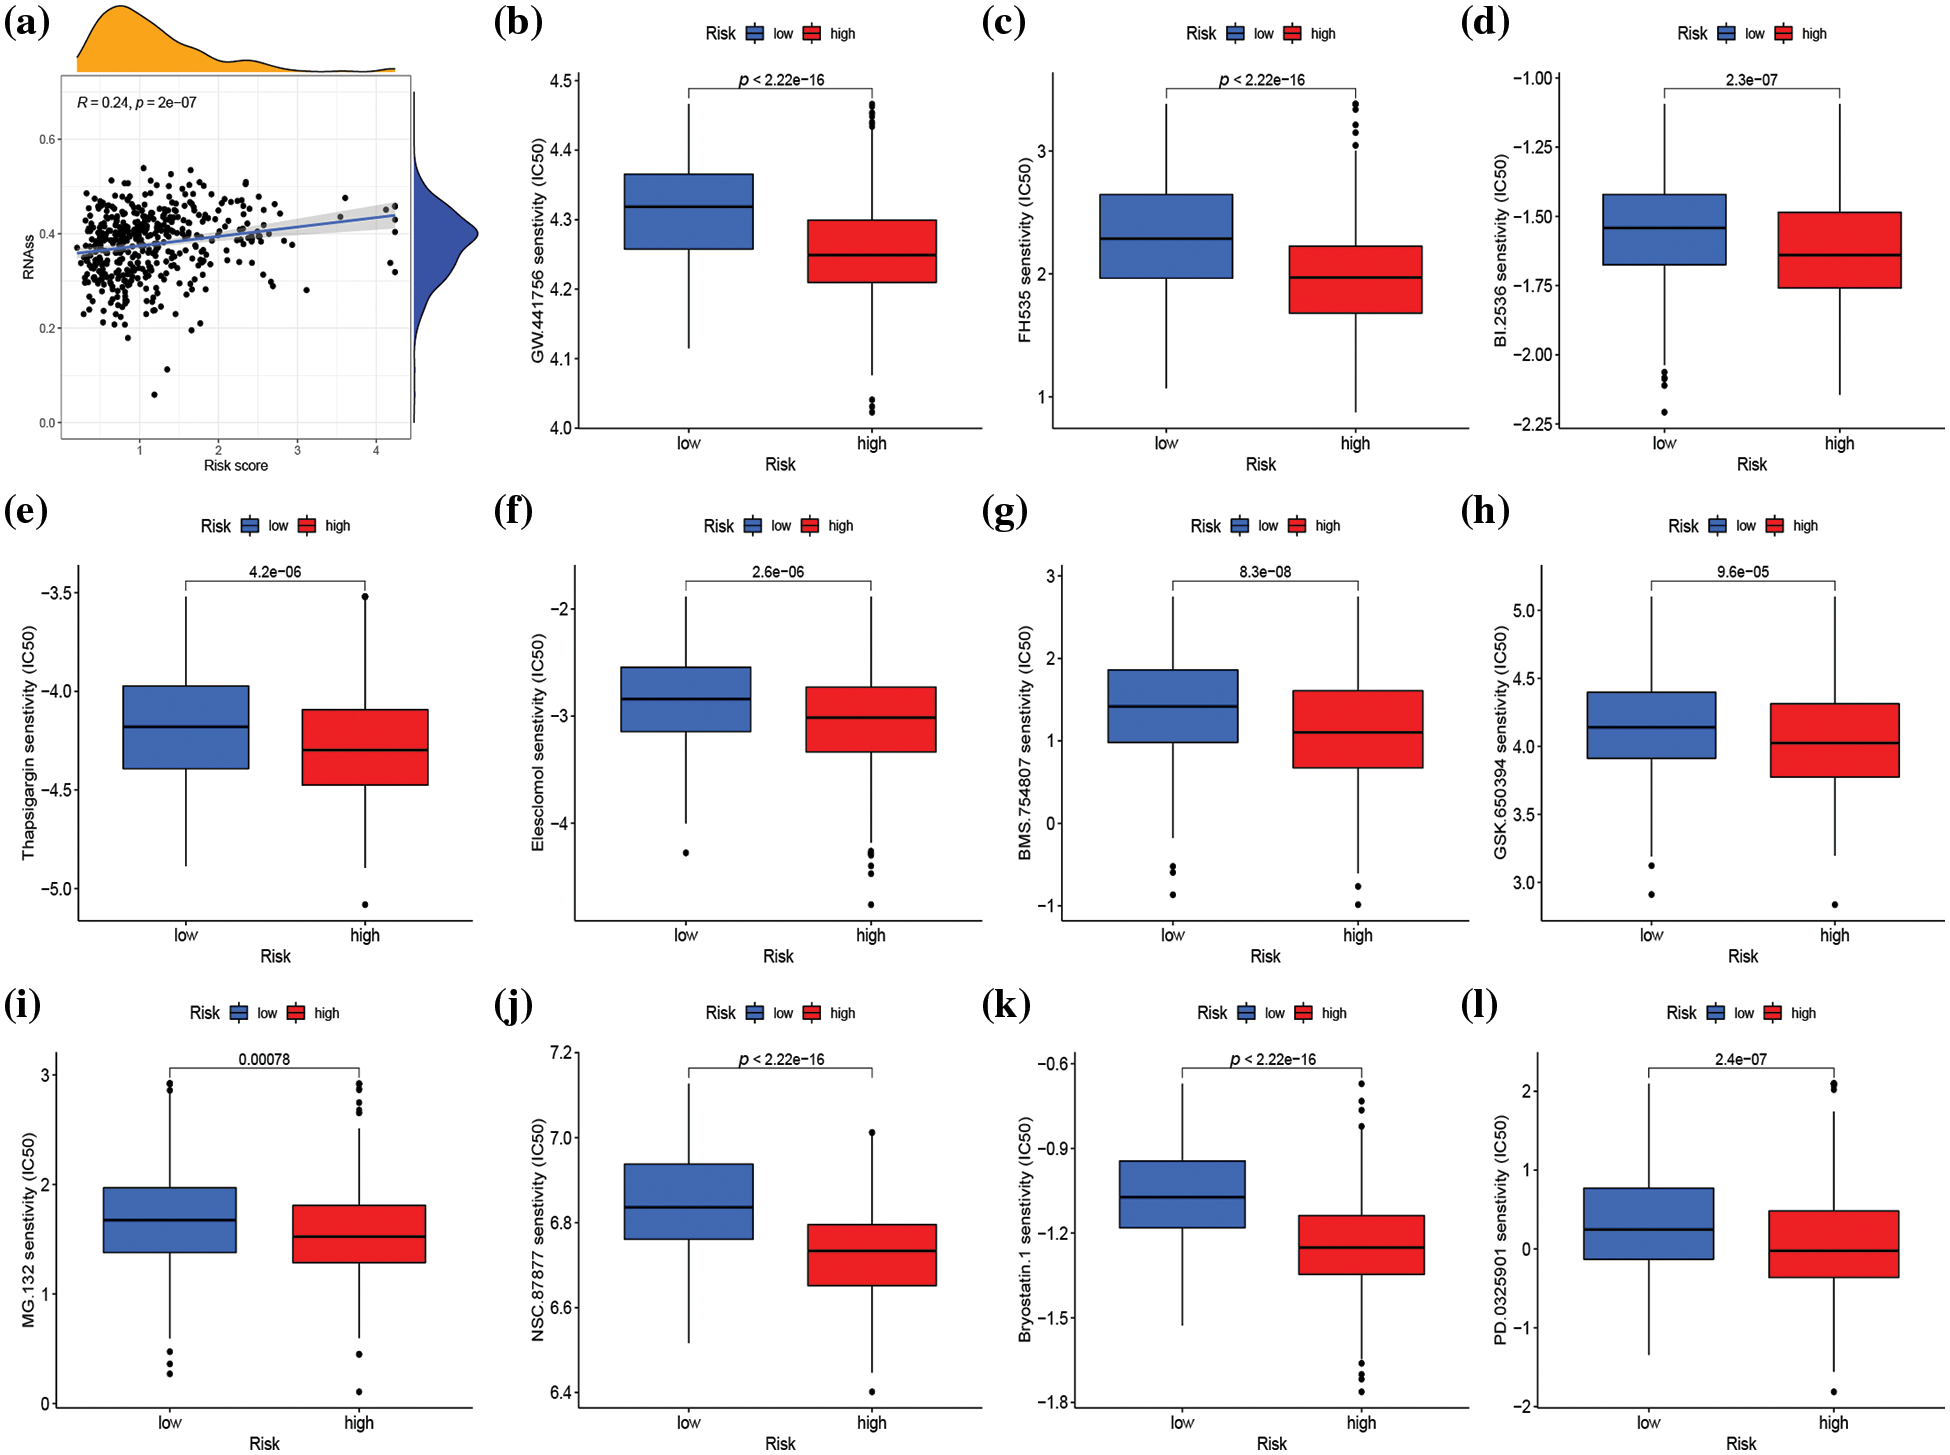
Figure 8: Stemness analysis and drug sensitivity analysis in distinct risk groups. (a) Spearman correlation analysis of the risk score and stemness index. (b–l) Sensitivity analysis of 11 different drugs in high- and low-risk groups. p < 0.05 was regarded as statistically significant.
In this study, 682 SKCM patients were categorized into two distinct molecular subtypes based on 41 GM-associated genes. There were differences in survival, gene expression characteristics, clinical features, immune infiltration, and biological function between the two subtypes. In addition, we screened out 368 DEGs between the two subtypes, based on which a prognostic model consisting of six genes was constructed by LASSO and multivariate Cox analysis. This prognostic model possessed a good predictive ability for the prognosis of SKCM patients. Moreover, we found that clinical features, GM-related gene expression, immune infiltration, TME score, stemness index, and drug sensitivity were significantly different between high- and low-risk groups. This research contributes to enhancing the understanding of SKCM progression driven by GM, assists in guiding clinical therapeutic regimens, and facilitates the development of original therapeutic methods.
In the Warburg effect, tumor cells undergo glycolysis to generate lactic acid, even in the presence of sufficient oxygen (Samec et al., 2023). Therefore, to maintain normal mitochondrial oxidative phosphorylation function, some tumor cells, including melanoma cells, rely more heavily on glutamine to fuel the TCA cycle (Filipp et al., 2012). The process involves the entry of glutamine into the cytoplasm via amino acid transporters and then its converted to glutamate by glutaminase (GLS), which is then transformed by glutamate dehydrogenase to α-ketoglutarate, a fuel for TCA cycle metabolites (Ratnikov et al., 2017). Additionally, glutamine serves as the nitrogen source for the synthesis of purines, pyrimidines, and non-essential amino acids (Yoo et al., 2020). We carried out GSVA enrichment analysis to study the differences in biological behavior between two molecular subtypes. GSVA result indicated that subtype A was enriched in metabolism-related pathways, including nucleotide metabolism (pyrimidine metabolism), energy metabolism (oxidative phosphorylation), and carbohydrate metabolism (glyoxylate and dicarboxylate metabolism), which may be associated with a higher level of GM in subtype A in contrast with that in subtype B. GO and KEGG enrichment analyses of 368 DEGs revealed their involvement in immune regulation, specifically T cell activation and lymphocyte differentiation. GM plays a crucial role in the differentiation and function of T cells (Ma et al., 2022). For instance, GLS1 deficiency can increase the expression of the transcription factor T-bet, thereby promoting differentiation and effector capacity of CD4+ Th1 and CD8+ T cells while also suppressing Th17 differentiation by suppressing mammalian target of rapamycin complex 1 and interleukin (IL)-2 signal transduction pathways (Ma et al., 2022). Moreover, the activation of Teff cells, which is dependent on c-MYC, is affected by glutamine uptake through SLC7A5 (Loftus et al., 2018).
Compared to a single gene, a multi-gene signature predicts prognosis in tumor patients more convincingly and accurately (Huang et al., 2021; Zhan et al., 2021). Moreover, the expression level of a single gene may be affected by multiple factors, which may lead to unreliable prognostic prediction results of a single gene as an independent prognostic factor (Huang et al., 2021). Furthermore, previous studies have demonstrated the ability of multiple genes to effectively predict outcomes in melanoma patients (Xu et al., 2022; Liu et al., 2023). Consequently, our study then screened six OS-associated genes (IL-18, SEMA6A, PAEP, TNFRSF17, AIM2, and CXCL10) to establish risk score. IL-18, as a member of the IL-1 superfamily cytokine, is capable of regulating both innate and adaptive immune responses (Lebel-Binay et al., 2000). Studies have confirmed that expression of IL-18 mRNA is significantly higher in normal tissues compared to melanoma tissues. In addition, high expression of IL-18 has been associated with better prognosis in melanoma patients, which might be due to the infiltration of CD8+ T and NK cells (Gil and Kim, 2019). SEMA6A is a protein involved in multiple cellular processes, such as vascular development and angiogenesis, and plays a crucial role in cell proliferation and cancer development (Ji et al., 2023). A recent study showed a correlation of SEMA6A expression with BRAF mutation, and its high expression was associated with shorter progression-free survival in BRAF-mut melanoma patients treated with BRAF/MEK inhibition (Loria et al., 2022). Another study demonstrated a negative correlation between SEMA6A expression, and survival prognosis in SKCM (Lv et al., 2022). PAEP, a secreted glycoprotein of the lipocalin superfamily with a molecular weight of 28 kDa, was found highly expressed in thick primary and metastatic melanoma samples. Overexpression of PAEP was shown to promote melanoma proliferation and migration (Ren et al., 2010). Furthermore, the PAEP protein secreted from melanoma cells can inhibit the proliferation and function of T lymphocytes, which might contribute to immune tolerance in melanoma (Ren et al., 2015). TNFRSF17, a plasma membrane antigen expressed universally, plays a role in regulating cell survival, proliferation, and apoptosis (Song et al., 2022b). Zhang et al. (2021) reported a significant upregulation of TNFRSF17 in metastatic melanoma, with high levels of TNFRSF17 being associated with poor prognosis in this patient population. The findings in this study were inconsistent with the previously reported relationship between TNFRSF17 and melanoma, suggesting the need for further investigation. The AIM2 gene was first identified as being lost in melanoma. Its ability to recognize double-stranded DNA released by cells under stress and induce pyroptosis via inflammasome formation has been established (Man et al., 2016). In agreement with our findings, AIM2 has been shown to act as a protective factor in melanoma (Niu et al., 2022). However, Keitaro Fukuda et al. suggested that AIM2 expression in dendritic cells within melanoma is associated with poor prognosis as it played an immunosuppressive role on melanoma microenvironment. In melanoma, vaccination with AIM2-deficient DCs enhanced the efficacy of immunotherapy by type I interferon signaling, producing CXCL10 to recruit CD8+ T cells and restricting IL-18 and IL-1β to inhibit regulatory T cells (Fukuda et al., 2021). Therefore, the role of AIM2 in melanoma is controversial and may be related to complex expression regulation. CXCL10 plays a dual role in promoting the occurrence and development of melanoma, and is dependent on the paracrine and autocrine patterns of the CXCL10/CXCR3 axis. The paracrine and autocrine modes of action are associated with anti-tumorigenic and pro-tumorigenic activities, respectively (Bagheri et al., 2020).
In comparison with the high-risk group, the low-risk group exhibited a higher degree of immune activation and immune scores. This study indicated a negative correlation between the risk score and the scores of γ δ T cells, CD8+ T cells, and M1 macrophages (p < 0.001). The γ δ T cells possess the ability to elicit both innate and adaptive immunity and are integral to present antigens and implement cytotoxic effects on tumor cells in a major histocompatibility complex-I-unrestricted manner (Wang et al., 2021a; Lafont et al., 2014). Studies by Girard et al. (2019) have established a strong correlation between the infiltration of high proportions of γ δ T cells in circulating and tumor cells with better clinical outcomes in melanoma patients. CD8+ T cells, on the other hand, are well-known for their role in anti-tumor immunity. M1 macrophages aid in promoting anti-tumor immunity by secreting IL-12, tumor necrosis factor (TNF)-α, and inducible nitric oxide synthase (iNOS), triggering and attracting Th1 and effector cells, and promoting the normalization of tumor blood vessels (Jarosz-Biej et al., 2018). Notably, the high-risk group exhibited a significantly higher stemness index than the low-risk group, which is a well-established indicator of poor prognosis in cancer patients (Malta et al., 2018). In conclusion, the favorable prognosis observed in the low-risk group may be attributed to a higher degree of immune infiltration and lower stemness index.
The drug sensitivity analysis revealed that SKCM patients with a high-risk score demonstrated greater sensitivity to a range of signal pathway inhibitors, including serine/threonine-protein kinase (PLK1) inhibitor (BI.2536), insulin-like growth factor1 receptor (IGF1R)/IR inhibitor (BMS.754807), Wnt/β-catenin signaling inhibitor (FH535), serum and glucocorticoid-induced protein kinase (SGK) inhibitor (GSK.650394), growth factor receptor inhibitor (GW.441756), proteasome inhibitor (MG.132), SRC homology region 2–containing protein tyrosine phosphatase 2 (SHP2) inhibitor (NSC.87877), MEK inhibitor (PD.0325901), cell-cycle inhibitor (Bryostatin.1), endoplasmic reticulum (ER) stress inducer (Thapsigargin), and oxidative stress inducer (Elesclomol), compared to patients in the low-risk score group. Notably, combination therapy with BMS.754807 and dabrafenib and trametinib was particularly effective in inhibiting the proliferation of BRAF-mutant melanoma (Patel et al., 2021). Additionally, regardless of BRAF mutation, MEK inhibitor PD.0325901 effectively suppressed melanoma growth (Ciuffreda et al., 2009). Elesclomol, as an oxidative stress inducer, inhibited oxidative phosphorylation (OXPHOS) and mitochondrial respiration, thus producing a cytotoxic effect on melanoma. This finding suggested that targeting OXPHOS could be an effective therapeutic strategy for advanced melanoma (Barbi de Moura et al., 2012). The drug sensitivity analysis provides new insights into the clinical treatment of melanoma. Moreover, the risk score could be an effective gene signature for predicting the therapeutic response of SKCM patients to targeted treatment.
In conclusion, this study identified that GM-related subtypes in SKCM that are associated with survival, clinical characteristics, and immune infiltration. In this study, a risk model was also developed to predict the prognosis of SKCM patients and estimate immune infiltration, which could benefit clinical treatment. These findings have contributed to a better understanding of the role of GM in assessing the prognosis and immune status in SKCM. However, this study is not without certain limitations. First, this was a retrospective study, reliant on public databases for data collection. Further prospective cohort studies and in vivo or in vitro studies are necessitated to verify the results presented in this paper. In addition, although six OS-associated genes alone have been shown to affect melanoma survival, the interactions, and relationships of six genes on the biological behavior of melanoma remain to be further investigated. Finally, considering the genetic heterogeneity among different ethnicities and regions, more data should be added, especially from the Chinese population, to analyze the difference in prognosis prediction of GM in melanoma patients from different regions.
Acknowledgement: None.
Funding Statement: This work was supported by the National Natural Science Foundation of China (Grant Number [No. 82071956]); and the Clinical Research Plan of Shanghai Hospital Development Center (Grant Number [No. 2020CR4065]).
Author Contributions: The authors confirm contribution to the paper as follows: study conception and design: Meng-qin Zhu, Tian-yi Xu, and Fei Yu; data collection: Xin Fan and Yu-lan Wang; analysis and interpretation of results: Meng-qin Zhu and Jia-jia Zhang; draft manuscript preparation: Meng-qin Zhu and Han Zhang. All authors reviewed the results and approved the final version of the manuscript.
Availability of Data and Materials: The datasets used and/or analyzed during the current study are available from the corresponding author upon reasonable request.
Ethics Approval: Not applicable.
Conflicts of Interest: The authors declare that they have no conflicts of interest to report regarding the present study.
Supplementary Materials: The supplementary material is available online at https://doi.org/10.32604/biocell.2023.028968.
References
Baenke F, Chaneton B, Smith M, Van Den Broek N, Hogan K et al. (2016). Resistance to BRAF inhibitors induces glutamine dependency in melanoma cells. Molecular Oncology 10: 73–84. https://doi.org/10.1016/j.molonc.2015.08.003 [Google Scholar] [PubMed] [CrossRef]
Bagheri H, Pourhanifeh MH, Derakhshan M, Mahjoubin-Tehran M, Ghasemi F, Mousavi S, Rafiei R, Abbaszadeh-Goudarzi K, Mirzaei HR, Mirzaei H (2020). CXCL-10: A new candidate for melanoma therapy? Cellular Oncology 43: 353–365. https://doi.org/10.1007/s13402-020-00501-z [Google Scholar] [PubMed] [CrossRef]
Barbi de Moura M, Vincent G, Fayewicz SL, Bateman NW, Hood BL et al. (2012). Mitochondrial respiration--an important therapeutic target in melanoma. PLoS One 7: e40690. https://doi.org/10.1371/journal.pone.0040690 [Google Scholar] [PubMed] [CrossRef]
Bott AJ, Maimouni S, Zong WX (2019). The pleiotropic effects of glutamine metabolism in cancer. Cancers 11: 770. https://doi.org/10.3390/cancers11060770 [Google Scholar] [PubMed] [CrossRef]
Byun JK, Park M, Lee S, Yun JW, Lee J et al. (2020). Inhibition of glutamine utilization synergizes with immune checkpoint inhibitor to promote antitumor immunity. Molecular Cell 80: 592–606. https://doi.org/10.1016/j.molcel.2020.10.015 [Google Scholar] [PubMed] [CrossRef]
Chen K, Liu H, Liu Z, Bloomer W, Amos CI, Lee JE, Li X, Nan H, Wei Q (2019). Genetic variants in glutamine metabolic pathway genes predict cutaneous melanoma-specific survival. Molecular Carcinogenesis 58: 2091–2103. https://doi.org/10.1002/mc.23100 [Google Scholar] [PubMed] [CrossRef]
Ciuffreda L, Del Bufalo D, Desideri M, di Sanza C, Stoppacciaro A et al. (2009). Growth-inhibitory and antiangiogenic activity of the MEK inhibitor PD0325901 in malignant melanoma with or without BRAF mutations. Neoplasia 11: 720–731. https://doi.org/10.1593/neo.09398 [Google Scholar] [PubMed] [CrossRef]
Fasoulakis Z, Koutras A, Ntounis T, Prokopakis I, Perros P et al. (2023). Ovarian cancer and glutamine metabolism. International Journal of Molecular Sciences 24: 5041. https://doi.org/10.3390/ijms24055041 [Google Scholar] [PubMed] [CrossRef]
Feng Y, Pathria G, Heynen-Genel S, Jackson M, James B, Yin J, Scott DA, Ronai ZA (2021). Identification and characterization of IMD-0354 as a glutamine carrier protein inhibitor in melanoma. Molecular Cancer Therapeutics 20: 816–832. https://doi.org/10.1158/1535-7163.MCT-20-0354 [Google Scholar] [PubMed] [CrossRef]
Filipp FV, Ratnikov B, de Ingeniis J, Smith JW, Osterman AL, Scott DA (2012). Glutamine-fueled mitochondrial metabolism is decoupled from glycolysis in melanoma. Pigment Cell & Melanoma Research 25: 732–739. https://doi.org/10.1111/pcmr.12000 [Google Scholar] [PubMed] [CrossRef]
Fu Q, Xu L, Wang Y, Jiang Q, Liu Z et al. (2019). Tumor-associated macrophage-derived interleukin-23 interlinks kidney cancer glutamine addiction with immune evasion. European Urology 75: 752–763. https://doi.org/10.1016/j.eururo.2018.09.030 [Google Scholar] [PubMed] [CrossRef]
Fukuda K, Okamura K, Riding RL, Fan X, Afshari K et al. (2021). AIM2 regulates anti-tumor immunity and is a viable therapeutic target for melanoma. Journal of Experimental Medicine 218: e20200962. https://doi.org/10.1084/jem.20200962 [Google Scholar] [PubMed] [CrossRef]
Gil M, Kim KE (2019). Interleukin-18 is a prognostic biomarker correlated with CD8+ T cell and natural killer cell infiltration in skin cutaneous melanoma. Journal of Clinical Medicine 8: 1993. https://doi.org/10.3390/jcm8111993 [Google Scholar] [PubMed] [CrossRef]
Girard P, Charles J, Cluzel C, Degeorges E, Manches O et al. (2019). The features of circulating and tumor-infiltrating gammadelta T cells in melanoma patients display critical perturbations with prognostic impact on clinical outcome. Oncoimmunology 8: 1601483. https://doi.org/10.1080/2162402X.2019.1601483 [Google Scholar] [PubMed] [CrossRef]
Hanzelmann S, Castelo R, Guinney J (2013). GSVA: Gene set variation analysis for microarray and RNA-seq data. BMC Bioinformatics 14: 7. https://doi.org/10.1186/1471-2105-14-7 [Google Scholar] [PubMed] [CrossRef]
Hernandez-Davies JE, Tran TQ, Reid MA, Rosales KR, Lowman XH et al. (2015). Vemurafenib resistance reprograms melanoma cells towards glutamine dependence. Journal of Translational Medicine 13: 210. https://doi.org/10.1186/s12967-015-0581-2 [Google Scholar] [PubMed] [CrossRef]
Huang G, Zhang J, Gong L, Huang Y, Liu D (2021). A glycolysis-based three-gene signature predicts survival in patients with lung squamous cell carcinoma. BMC Cancer 21: 626. https://doi.org/10.1186/s12885-021-08360-z [Google Scholar] [PubMed] [CrossRef]
Jarosz-Biej M, Kaminska N, Matuszczak S, Cichon T, Pamula-Pilat J, Czapla J, Smolarczyk R, Skwarzynska D, Kulik K, Szala S (2018). M1-like macrophages change tumor blood vessels and microenvironment in murine melanoma. PLoS One 13: e0191012. https://doi.org/10.1371/journal.pone.0191012 [Google Scholar] [PubMed] [CrossRef]
Jenkins RW, Fisher DE (2021). Treatment of advanced melanoma in 2020 and beyond. Journal of Investigative Dermatology 141: 23–31. https://doi.org/10.1016/j.jid.2020.03.943 [Google Scholar] [PubMed] [CrossRef]
Ji J, Xu Y, Xie M, He X, Ren D et al. (2023). VHL-HIF-2α axis-induced SEMA6A upregulation stabilized beta-catenin to drive clear cell renal cell carcinoma progression. Cell Death & Disease 14: 83. https://doi.org/10.1038/s41419-023-05588-4 [Google Scholar] [PubMed] [CrossRef]
Jin S, Cao J, Kong LB (2022). Identification and validation in a novel quantification system of the glutamine metabolism patterns for the prediction of prognosis and therapy response in hepatocellular carcinoma. Journal of Gastrointestinal Oncology 13: 2505–2521. https://doi.org/10.21037/jgo-22-895 [Google Scholar] [PubMed] [CrossRef]
Johnson WE, Li C, Rabinovic A (2007). Adjusting batch effects in microarray expression data using empirical Bayes methods. Biostatistics 8: 118–127. https://doi.org/10.1093/biostatistics/kxj037 [Google Scholar] [PubMed] [CrossRef]
Lafont V, Sanchez F, Laprevotte E, Michaud HA, Gros L, Eliaou JF, Bonnefoy N (2014). Plasticity of gammadelta T cells: Impact on the anti-tumor response. Frontiers in Immunology 5: 622. [Google Scholar] [PubMed]
Lebel-Binay S, Berger A, Zinzindohoue F, Cugnenc P, Thiounn N, Fridman WH, Pages F (2000). Interleukin-18: Biological properties and clinical implications. European Cytokine Network 11: 15–26. [Google Scholar] [PubMed]
Li Q, Zhong X, Yao W, Yu J, Wang C et al. (2022). Inhibitor of glutamine metabolism V9302 promotes ROS-induced autophagic degradation of B7H3 to enhance antitumor immunity. Journal of Biological Chemistry 298: 101753. https://doi.org/10.1016/j.jbc.2022.101753 [Google Scholar] [PubMed] [CrossRef]
Liu J, Shen H, Gu W, Zheng H, Wang Y, Ma G, Du J (2022). Prediction of prognosis, immunogenicity and efficacy of immunotherapy based on glutamine metabolism in lung adenocarcinoma. Frontiers in Immunology 13: 960738. https://doi.org/10.3389/fimmu.2022.960738 [Google Scholar] [PubMed] [CrossRef]
Liu D, Yang F, Zhang T, Mao R (2023). Leveraging a cuproptosis-based signature to predict the prognosis and drug sensitivity of cutaneous melanoma. Journal of Translational Medicine 21: 57. https://doi.org/10.1186/s12967-023-03891-4 [Google Scholar] [PubMed] [CrossRef]
Loftus RM, Assmann N, Kedia-Mehta N, O’Brien KL, Garcia A et al. (2018). Amino acid-dependent cMyc expression is essential for NK cell metabolic and functional responses in mice. Nature Communication 9: 2341. https://doi.org/10.1038/s41467-018-04719-2 [Google Scholar] [PubMed] [CrossRef]
Loria R, Laquintana V, Scalera S, Fraioli R, Caprara V et al. (2022). SEMA6A/RhoA/YAP axis mediates tumor-stroma interactions and prevents response to dual BRAF/MEK inhibition in BRAF-mutant melanoma. Journal of Experimental and Clinical Cancer Research 41: 148. https://doi.org/10.1186/s13046-022-02354-w [Google Scholar] [PubMed] [CrossRef]
Lv W, Zhan Y, Tan Y, Wu Y, Chen H (2022). A combined aging and immune prognostic signature predict prognosis and responsiveness to immunotherapy in melanoma. Frontiers in Pharmacology 13: 943944. https://doi.org/10.3389/fphar.2022.943944 [Google Scholar] [PubMed] [CrossRef]
Ma G, Zhang Z, Li P, Zhang Z, Zeng M et al. (2022). Reprogramming of glutamine metabolism and its impact on immune response in the tumor microenvironment. Cell Communication and Signaling 20: 114. https://doi.org/10.1186/s12964-022-00909-0 [Google Scholar] [PubMed] [CrossRef]
Malta TM, Sokolov A, Gentles AJ, Burzykowski T, Poisson L et al. (2018). Machine learning identifies stemness features associated with oncogenic dedifferentiation. Cell 173: 338–354. https://doi.org/10.1016/j.cell.2018.03.034 [Google Scholar] [PubMed] [CrossRef]
Man SM, Karki R, Kanneganti TD (2016). AIM2 inflammasome in infection, cancer, and autoimmunity: Role in DNA sensing, inflammation, and innate immunity. European Journal of Immunology 46: 269–280. https://doi.org/10.1002/eji.201545839 [Google Scholar] [PubMed] [CrossRef]
Mayakonda A, Lin DC, Assenov Y, Plass C, Koeffler HP (2018). Maftools: Efficient and comprehensive analysis of somatic variants in cancer. Genome Research 28: 1747–1756. https://doi.org/10.1101/gr.239244.118 [Google Scholar] [PubMed] [CrossRef]
Mukunda N, Vallabhaneni S, Lefebvre B, Fradley MG (2022). Cardiotoxicity of systemic melanoma treatments. Current Treatment Options in Oncology 23: 240–253. https://doi.org/10.1007/s11864-021-00924-2 [Google Scholar] [PubMed] [CrossRef]
Newman AM, Liu CL, Green MR, Gentles AJ, Feng W, Xu Y, Hoang CD, Diehn M, Alizadeh AA (2015). Robust enumeration of cell subsets from tissue expression profiles. Nature Methods 12: 453–457. https://doi.org/10.1038/nmeth.3337 [Google Scholar] [PubMed] [CrossRef]
Niu Z, Xu Y, Li Y, Chen Y, Han Y (2022). Construction and validation of a novel pyroptosis-related signature to predict prognosis in patients with cutaneous melanoma. Mathematical Biosciences and Engineering 19: 688–706. https://doi.org/10.3934/mbe.2022031 [Google Scholar] [PubMed] [CrossRef]
Ouyang W, Jiang Y, Bu S, Tang T, Huang L et al. (2021). A prognostic risk score based on hypoxia-, immunity-, and epithelialto-mesenchymal transition-related genes for the prognosis and immunotherapy response of lung adenocarcinoma. Frontiers in Cell and Developmental Biology 9: 758777. https://doi.org/10.3389/fcell.2021.758777 [Google Scholar] [PubMed] [CrossRef]
Patel H, Mishra R, Yacoub N, Alanazi S, Kilroy MK, Garrett JT (2021). IGF1R/IR mediates resistance to BRAF and MEK inhibitors in BRAF-mutant melanoma. Cancers 13: 5863. https://doi.org/10.3390/cancers13225863 [Google Scholar] [PubMed] [CrossRef]
Rais R, Lemberg KM, Tenora L, Arwood ML, Pal A et al. (2022). Discovery of DRP-104, a tumor-targeted metabolic inhibitor prodrug. Science Advances 8: eabq5925. https://doi.org/10.1126/sciadv.abq5925 [Google Scholar] [PubMed] [CrossRef]
Ratnikov BI, Scott DA, Osterman AL, Smith JW, Ronai ZA (2017). Metabolic rewiring in melanoma. Oncogene 36: 147–157. https://doi.org/10.1038/onc.2016.198 [Google Scholar] [PubMed] [CrossRef]
Ren S, Chai L, Wang C, Li C, Ren Q et al. (2015). Human malignant melanoma-derived progestagen-associated endometrial protein immunosuppresses T lymphocytes in vitro. PLoS One 10: e0119038. https://doi.org/10.1371/journal.pone.0119038 [Google Scholar] [PubMed] [CrossRef]
Ren S, Liu S, Howell PMJr, Zhang G, Pannell L, Samant R, Shevde-Samant L, Tucker JA, Fodstad O, Riker AI (2010). Functional characterization of the progestagen-associated endometrial protein gene in human melanoma. Journal of Cellular and Molecular Medicine 14: 1432–1442. https://doi.org/10.1111/j.1582-4934.2009.00922.x [Google Scholar] [PubMed] [CrossRef]
Rubanov A, Berico P, Hernando E (2022). Epigenetic mechanisms underlying melanoma resistance to immune and targeted therapies. Cancers 14: 5858. https://doi.org/10.3390/cancers14235858 [Google Scholar] [PubMed] [CrossRef]
Samec M, Mazurakova A, Lucansky V, Koklesova L, Pecova R et al. (2023). Flavonoids attenuate cancer metabolism by modulating Lipid metabolism, amino acids, ketone bodies and redox state mediated by Nrf2. European Journal of Pharmacology 949: 175655. https://doi.org/10.1016/j.ejphar.2023.175655 [Google Scholar] [PubMed] [CrossRef]
Song B, Wu P, Liang Z, Wang J, Zheng Y et al. (2022a). A novel necroptosis-related gene signature in skin cutaneous melanoma prognosis and tumor microenvironment. Frontiers in Genetics 13: 917007. https://doi.org/10.3389/fgene.2022.917007 [Google Scholar] [PubMed] [CrossRef]
Song Y, Zhang Z, Zhang B, Zhang W (2022b). CD8+ T cell-associated genes MS4A1 and TNFRSF17 are prognostic markers and inhibit the progression of colon cancer. Frontiers in Oncology 12: 941208. https://doi.org/10.3389/fonc.2022.941208 [Google Scholar] [PubMed] [CrossRef]
Strickler JH, Hanks BA, Khasraw M (2021). Tumor mutational burden as a predictor of immunotherapy response: Is more always better? Clinical Cancer Research 27: 1236–1241. https://doi.org/10.1158/1078-0432.CCR-20-3054 [Google Scholar] [PubMed] [CrossRef]
Tang Z, Li C, Kang B, Gao G, Li C, Zhang Z (2017). GEPIA: A web server for cancer and normal gene expression profiling and interactive analyses. Nucleic Acids Research 45: W98–W102. https://doi.org/10.1093/nar/gkx247 [Google Scholar] [PubMed] [CrossRef]
Vara-Perez M, Maes H, Van Dingenen S, Agostinis P (2019). BNIP3 contributes to the glutamine-driven aggressive behavior of melanoma cells. Biological Chemistry 400: 187–193. https://doi.org/10.1515/hsz-2018-0208 [Google Scholar] [PubMed] [CrossRef]
Wang H, Chen H, Liu S, Zhang J, Lu H et al. (2021a). Costimulation of γδTCR and TLR7/8 promotes Vδ2 T-cell antitumor activity by modulating mTOR pathway and APC function. Journal for ImmunoTherapy of Cancer 9: e003339. https://doi.org/10.1136/jitc-2021-003339 [Google Scholar] [PubMed] [CrossRef]
Wang JJ, Siu MK, Jiang YX, Leung TH, Chan DW, Wang HG, Ngan HY, Chan KK (2021b). A combination of glutaminase inhibitor 968 and PD-L1 blockade boosts the immune response against ovarian cancer. Biomolecules 11: 1749. https://doi.org/10.3390/biom11121749 [Google Scholar] [PubMed] [CrossRef]
Wettenhall JM, Smyth GK (2004). limmaGUI: A graphical user interface for linear modeling of microarray data. Bioinformatics 20: 3705–3706. https://doi.org/10.1093/bioinformatics/bth449 [Google Scholar] [PubMed] [CrossRef]
Wise DR, Thompson CB (2010). Glutamine addiction: A new therapeutic target in cancer. Trends in Biochemical Sciences 35: 427–433. https://doi.org/10.1016/j.tibs.2010.05.003 [Google Scholar] [PubMed] [CrossRef]
Xu Y, Chen Y, Jiang W, Yin X, Chen D, Chi Y, Wang Y, Zhang J, Zhang Q, Han Y (2022). Identification of fatty acid metabolism-related molecular subtype biomarkers and their correlation with immune checkpoints in cutaneous melanoma. Frontiers in Immunology 13: 967277. https://doi.org/10.3389/fimmu.2022.967277 [Google Scholar] [PubMed] [CrossRef]
Yang WH, Qiu Y, Stamatatos O, Janowitz T, Lukey MJ (2021). Enhancing the efficacy of glutamine metabolism inhibitors in cancer therapy. Trends in Cancer 7: 790–804. https://doi.org/10.1016/j.trecan.2021.04.003 [Google Scholar] [PubMed] [CrossRef]
Ying L, Cheng M, Lu Y, Tao Q, Chen X, Shen B, Xiong F, Hu Z, Wang D, Li X (2021). Glutamine metabolism scoring predicts prognosis and therapeutic resistance in hepatocellular carcinoma. Pathology Oncology Research 27: 1610075. https://doi.org/10.3389/pore.2021.1610075 [Google Scholar] [PubMed] [CrossRef]
Yoo HC, Park SJ, Nam M, Kang J, Kim K et al. (2020). A variant of SLC1A5 is a mitochondrial glutamine transporter for metabolic reprogramming in cancer cells. Cell Metabolism 31: 267–283.e212. https://doi.org/10.1016/j.cmet.2019.11.020 [Google Scholar] [PubMed] [CrossRef]
Yoshihara K, Shahmoradgoli M, Martinez E, Vegesna R, Kim H et al. (2013). Inferring tumour purity and stromal and immune cell admixture from expression data. Nature Communication 4: 2612. https://doi.org/10.1038/ncomms3612 [Google Scholar] [PubMed] [CrossRef]
Yu G, Wang LG, Han Y, He QY (2012). clusterProfiler: An R package for comparing biological themes among gene clusters. OMICS: A Journal of Integrative Biology 16: 284–287. https://doi.org/10.1089/omi.2011.0118 [Google Scholar] [PubMed] [CrossRef]
Zhan J, Wu S, Zhao X, Jing J (2021). A novel DNA damage repair-related gene signature for predicting glioma prognosis. International Journal of General Medicine 14: 10083–10101. https://doi.org/10.2147/IJGM.S343839 [Google Scholar] [PubMed] [CrossRef]
Zhang C, Dang D, Cong L, Sun H, Cong X (2021). Pivotal factors associated with the immunosuppressive tumor microenvironment and melanoma metastasis. Cancer Medicine 10: 4710–4720. https://doi.org/10.1002/cam4.3963 [Google Scholar] [PubMed] [CrossRef]
Zhang W, Shao W, Dong Z, Zhang S, Liu C, Chen S (2019). Cloxiquine, a traditional antituberculosis agent, suppresses the growth and metastasis of melanoma cells through activation of PPARγ. Cell Death & Disease 10: 404. [Google Scholar]
Cite This Article
 Copyright © 2023 The Author(s). Published by Tech Science Press.
This work is licensed under a Creative Commons Attribution 4.0 International License , which permits unrestricted use, distribution, and reproduction in any medium, provided the original work is properly cited.
 Downloads
 Citation Tools