
 Submit a Paper
 Propose a Special lssue
 Open Access
ARTICLE

Novel defined N7-methylguanosine modification-related lncRNAs for predicting the prognosis of laryngeal squamous cell carcinoma
Department of Otolaryngology, Handan Central Hospital, Handan, 056001, China
* Corresponding Author: ZHAOXU YAO. Email:
BIOCELL 2023, 47(9), 1965-1975. https://doi.org/10.32604/biocell.2023.030796
Received 24 April 2023; Accepted 03 July 2023; Issue published 28 September 2023
 View Full Text
 Download PDF
Abstract
Objective: Through integrated bioinformatics analysis, the goal of this work was to find new, characterised N7-methylguanosine modification-related long non-coding RNAs (m7G-lncRNAs) that might be used to predict the prognosis of laryngeal squamous cell carcinoma (LSCC). Methods: The clinical data and LSCC gene expression data for the current investigation were initially retrieved from the TCGA database & sanitised. Then, using co-expression analysis of m7G-associated mRNAs & lncRNAs & differential expression analysis (DEA) among LSCC & normal sample categories, we discovered lncRNAs that were connected to m7G. The prognosis prediction model was built for the training category using univariate & multivariate COX regression & LASSO regression analyses, & the model’s efficacy was checked against the test category data. In addition, we conducted DEA of prognostic m7G-lncRNAs among LSCC & normal sample categories & compiled a list of co-expression networks & the structure of prognosis m7G-lncRNAs. To compare the prognoses for individuals with LSCC in the high- & low-risk categories in the prognosis prediction model, survival and risk assessments were also carried out. Finally, we created a nomogram to accurately forecast the outcomes of LSCC patients & created receiver operating characteristic (ROC) curves to assess the prognosis prediction model’s predictive capability. Results: Using co-expression network analysis & differential expression analysis, we discovered 774 m7G-lncRNAs and 551 DEm7G-lncRNAs, respectively. We then constructed a prognosis prediction model for six m7G-lncRNAs (FLG−AS1, RHOA−IT1, AC020913.3, AC027307.2, AC010973.2 and AC010789.1), identified 32 DEPm7G-lncRNAs, analyzed the correlation between 32 DEPm7G-lncRNAs and 13 DEPm7G-mRNAs, and performed survival analyses and risk analyses of the prognosis prediction model to assess the prognostic performance of LSCC patients. By displaying ROC curves and a nomogram, we finally checked the prognosis prediction model's accuracy. Conclusion: By creating novel predictive lncRNA signatures for clinical diagnosis & therapy, our findings will contribute to understanding the pathogenetic process of LSCC.Keywords
Supplementary Material
Supplementary Material FileAbbreviations
| m7G | N7-methylguanosine modification |
| lncRNAs | Long non-coding RNAs |
| m7G-lncRNAs | m7G modification-related lncRNAs |
| DEm7G-lncRNAs | Differentially expressed m7G-related lncRNAs |
| DEPm7G-lncRNAs | Differentially expressed prognostic m7G-lncRNAs |
| LSCC | Laryngeal squamous cell carcinoma |
| DEA | Differential expression analysis |
| FC | Fold change |
| HR | Hazard ratio |
| PCC | Pearson correlation coefficient |
| ROC | Receiver operating characteristic |
| AUC | The area under the ROC curve |
| COAD | Colon adenocarcinoma |
One of the most prevalent forms of cancers of the head and neck is laryngeal cancer, and more than 95% of cases are laryngeal squamous cell carcinomas (LSCC) (Dong et al., 2020). One to five percent of all tumors are laryngeal cancers, & their mortality and morbidity are rising (Li et al., 2016; Yang et al., 2020). Hoarseness is a possible early symptom of LSCC, but it is not specific and is often ignored (Chen et al., 2019; Groome et al., 2003). In addition, due to poor compliance with laryngoscopy and imaging examinations, many patients are found to have advanced LSCC, which greatly affects the survival prognosis and quality of life of patients (Allegra et al., 2012; Chen et al., 2014). As a result, it is critical to find precise and sensitive biomarkers for LSCC diagnosis and prognosis.
Long non-coding RNAs (lncRNAs) are RNAs longer than 200 nucleotides that affect gene expression in many stages, including post-transcriptional control (Zhang et al., 2019), epigenetic regulation, and derivative regulation. One of the most typical base modifications in post-transcriptional regulation (m7G) is N7-methylguanosine (Boccaletto et al., 2022; Zhang et al., 2019). It is commonly present in the 5'-cap region of tRNA, rRNA, and eukaryotic mRNA and is crucial for sustaining RNA metabolism, stability, nucleation, & protein translation (Seo et al., 2019; Zhang et al., 2020c). Several studies have demonstrated a strong correlation between the emergence and development of tumours and m7G modification-related lncRNAs (m7G-lncRNAs) (Balzeau et al., 2017; Liu et al., 2019; Liu et al., 2020b; Pandolfini et al., 2019; Teng et al., 2021).
We are aware of no research on m7G-lncRNAs’ function in LSCC at this time. We discovered unique m7G-lncRNAs in our work that can predict how LSCC will progress. The objective of this study was to find early sensitive LSCC biomarkers that might be used to diagnose, treat, and enhance the patient’s quality of life and survival prospects.
Data obtaining and cleaning from the TCGA database
The R package TCGAbiolinks (Ferrer-Bonsoms et al., 2021) was used to obtain the LSCC gene expression data and clinical data from the TCGA database (http://tcga-data.nci.nih.gov) (Lee, 2016). 123 samples in total were gathered, including 12 normal paracancerous tissues and 111 LSCC. All data cleansing and transformation operations were then carried out utilising Perl languages (Liu et al., 2014).
Co-expression analysis is used to identify lncRNAs linked to m7G
To detect mRNAs or lncRNAs, a full-sample transcriptome expression matrix was first genotyped using customised Perl scripts and configuration files. The list of m7G-related genes was taken from the MSigDB database (http://www.gsea-msigdb.org/gsea/login.jsp) (Pan et al., 2021), and the relative expression of each m7G-related gene from the LSCC gene matrix was calculated using the R package limma (Chen et al., 2021). Ultimately, we used Pearson’s correlation test to identify m7G-related lncRNAs by co-expression analysis of mRNAs and lncRNAs. The thresholds for statistical importance were p < 0.001 and a cut-off correlation coefficient >0.4.
Comparative investigation of the expression of m7G-related lncRNAs
Using limma and pheatmap (Hu, 2021), we conducted differential expression analysis (DEA) among LSCC and normal sample categories based on the expression matrices of m7G-related lncRNAs. The heatmap and volcano plot were used to display the findings of the DEA investigation. Statistical differences were defined as |logFC (fold change)| >1 and an adjusted p-value < 0.05.
The prognosis prediction model’s construction
We discovered differentially expressed m7G-related lncRNAs (DEm7G-lncRNAs) by DEA analysis. First, the clinical data for various survival periods and statuses as well as the expression matrix of the DEm7G-lncRNAs were sorted and combined. After that, we split up all of the samples evenly into training and test groups. LASSO regression analysis and univariate and multivariate COX regression analysis (Zhao et al., 2022; Zhao et al., 2021b) were used to construct the prognosis prediction model for the training group, While the correctness of the model was checked using the test category. Then, using the R packages glment, survival, and survminer (Groeneveld et al., 2019; Zhao et al., 2021a) to calculate a risk score for each sample, we multiplied the relative expression of each DEm7G-lncRNA in each sample by the risk factor and added it. The median risk score was used to classify every individual into high- and low-risk categories.
Prognostic m7G-lncRNAs’ differential expression study in different groups
Then, based on the expression matrices of m7G-lncRNAs and a list of hazard ratio (HR) values for prognosis m7G-lncRNAs, we conducted differential expression analysis of prognostic m7G-lncRNAs among LSCC and normal groups of samples using the software limma and pheatmap22. Statistically *p < 0.05, **p < 0.01, or ***p < 0.001.
Correlation analysis between prognostic m7G-lncRNAs and mRNAs
Using LASSO regression analysis, univariate COX regression, and co-expression analysis of m7G-related mRNAs and lncRNAs, we obtained a list of co-expression networks and forms of prognostic m7G-lncRNAs. Then, the m7G-lncRNAs co-expression relationships among the m7G-mRNAs were extracted using the packages ggalluvial, ggplot2 and dplyr (Awan et al., 2021; Liu et al., 2021) and the results were displayed using a Sankey diagram (Glover et al., 2021).
Survival analyses and risk analyses among high- and low-risk groups
Using the R packages survival and survminer (Groeneveld et al., 2019; Zhao et al., 2021a), survival studies were conducted to assess the prognosis of individuals with LSCC in high- and low-risk categories in the prognosis prediction model. Applying the Kaplan-Meier survival curve (Awan et al., 2021; Liu et al., 2021), outcomes are displayed. To determine the risk score, survival status, and expression of prognostic m7G-lncRNAs in the prognosis prediction model, prognostic risk analysis was carried out.
Prognosis prediction model receiver operating characteristic (ROC) curve analyses
The prognosis prediction model was then put to the test using ROC curves (Lu et al., 2021) created using the R packages survival, survminer, and time ROC (Fang et al., 2021; Groeneveld et al., 2019; Zhao et al., 2021a). The ROC curves of 1-year, 3-year, & 5-year survival rates and clinical features were plotted after reading and combining the survival time, risk score, survival status, and clinical characteristics.
Construction and validation of the prognostic nomogram
We created a nomogram (Wu et al., 2022) that included all clinical features, such as age, sex, TNM stage, and risk score, in order to predict LSCC patient outcomes quantitatively using the R packages survival, regplot, and rms (Zhang et al., 2020b; Zhang et al., 2018). The next step was to assess each clinical trait variable separately. To represent the 1 year, 3 year, and 5 year overall survival, the scores were finally included.
Detection of lncRNAs associated with m7G
First, 56,461 transcriptome gene expression matrices were downloaded and sorted from the TCGA database. Then, based on the MSigDB database and LSCC gene matrix, mRNAs associated with m7G were retrieved using the R programming language. Finally, utilising co-expression network analysis, 774 coexpressed m7G-related lncRNAs were discovered. lncRNAs were chosen if the Pearson correlation coefficient (PCC) was >0.4 or 0.4 and the p-value was <0.001. A positive correlation was defined as a PCC > 0.4 and a negative correlation as a PCC < −0.4. In Suppl. Table S1 (m7GLncExp.txt & net.network.txt), the expression matrix and co-expression relationships of lncRNAs associated to m7G are described in detail. The results are represented by a co-expression network diagram (Fig. 1).
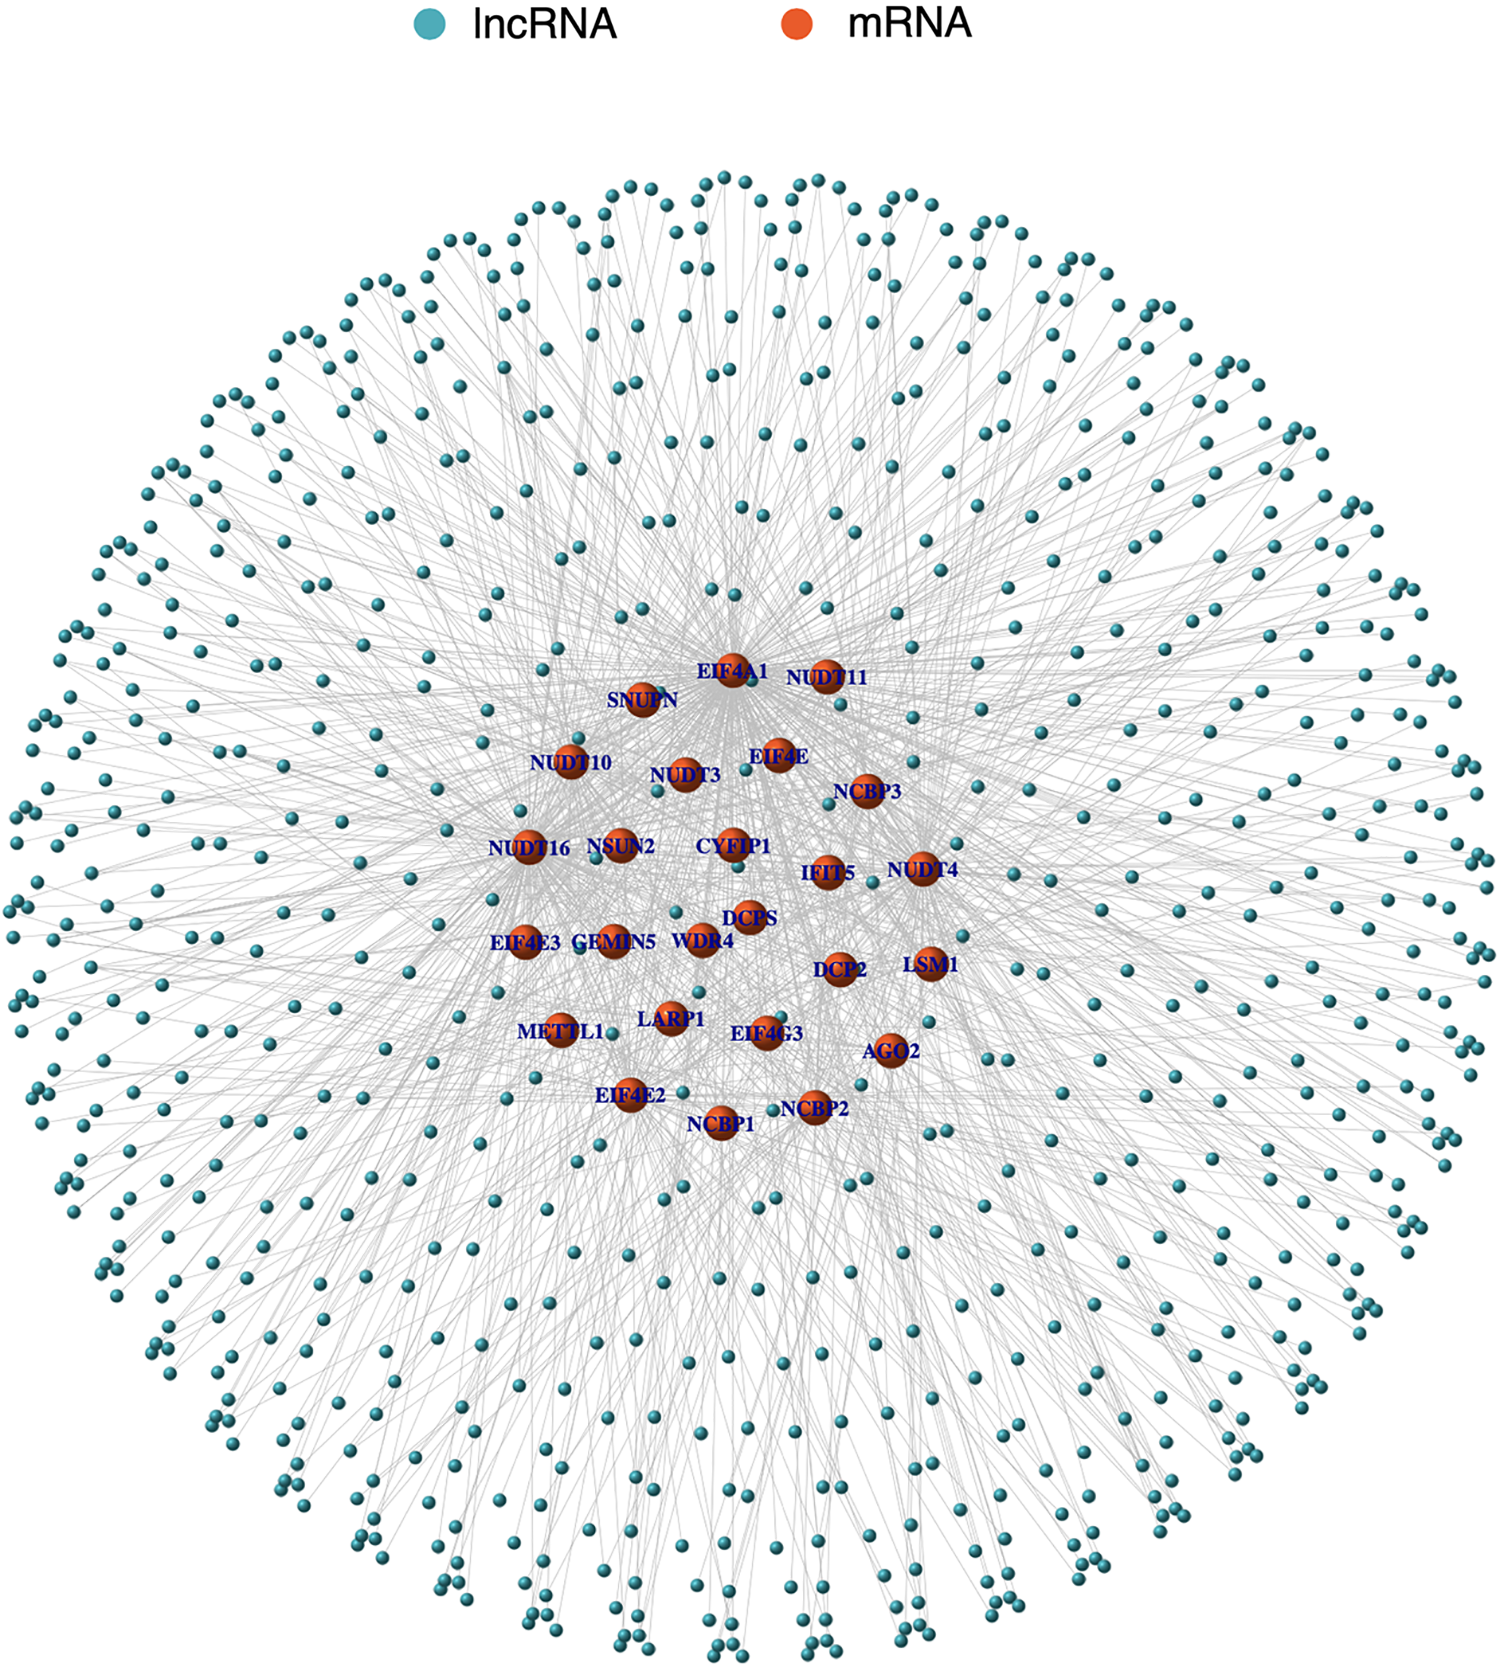
Figure 1: The co-expression network diagram of m7G-related lncRNAs and mRNA. Orange nodes represent m7G-related mRNAs and blue nodes represent m7G-related lncRNAs. Solid lines represent the co-expression relationships between the mRNAs and lncRNAs.
Detection of m7G-related lncRNAs with varied expression in several groups
774 m7G-related lncRNAs were discovered using co-expression network analysis. Then, to identify 551 DEm7G-lncRNAs, we conducted a differential expression study of these m7G-lncRNAs among the LSCC and normal categories. In Suppl. Table S2 (diffLncExp.txt), the matrix of the DEm7G-lncRNAs is shown. A heatmap (Fig. 2A) and a volcano plot (Fig. 2B) were used to display the results.

Figure 2: The heatmap (A) and volcano plot (B) of the DEm7G-lncRNAs. Red, up-regulated lncRNAs; blue or green, down-regulated lncRNAs. Cut-off criteria: |logFC| ≥ 1.0 and adj. p < 0.05 (−log10(FDR) < 1.30).
The m7G-lncRNA prognosis prediction model
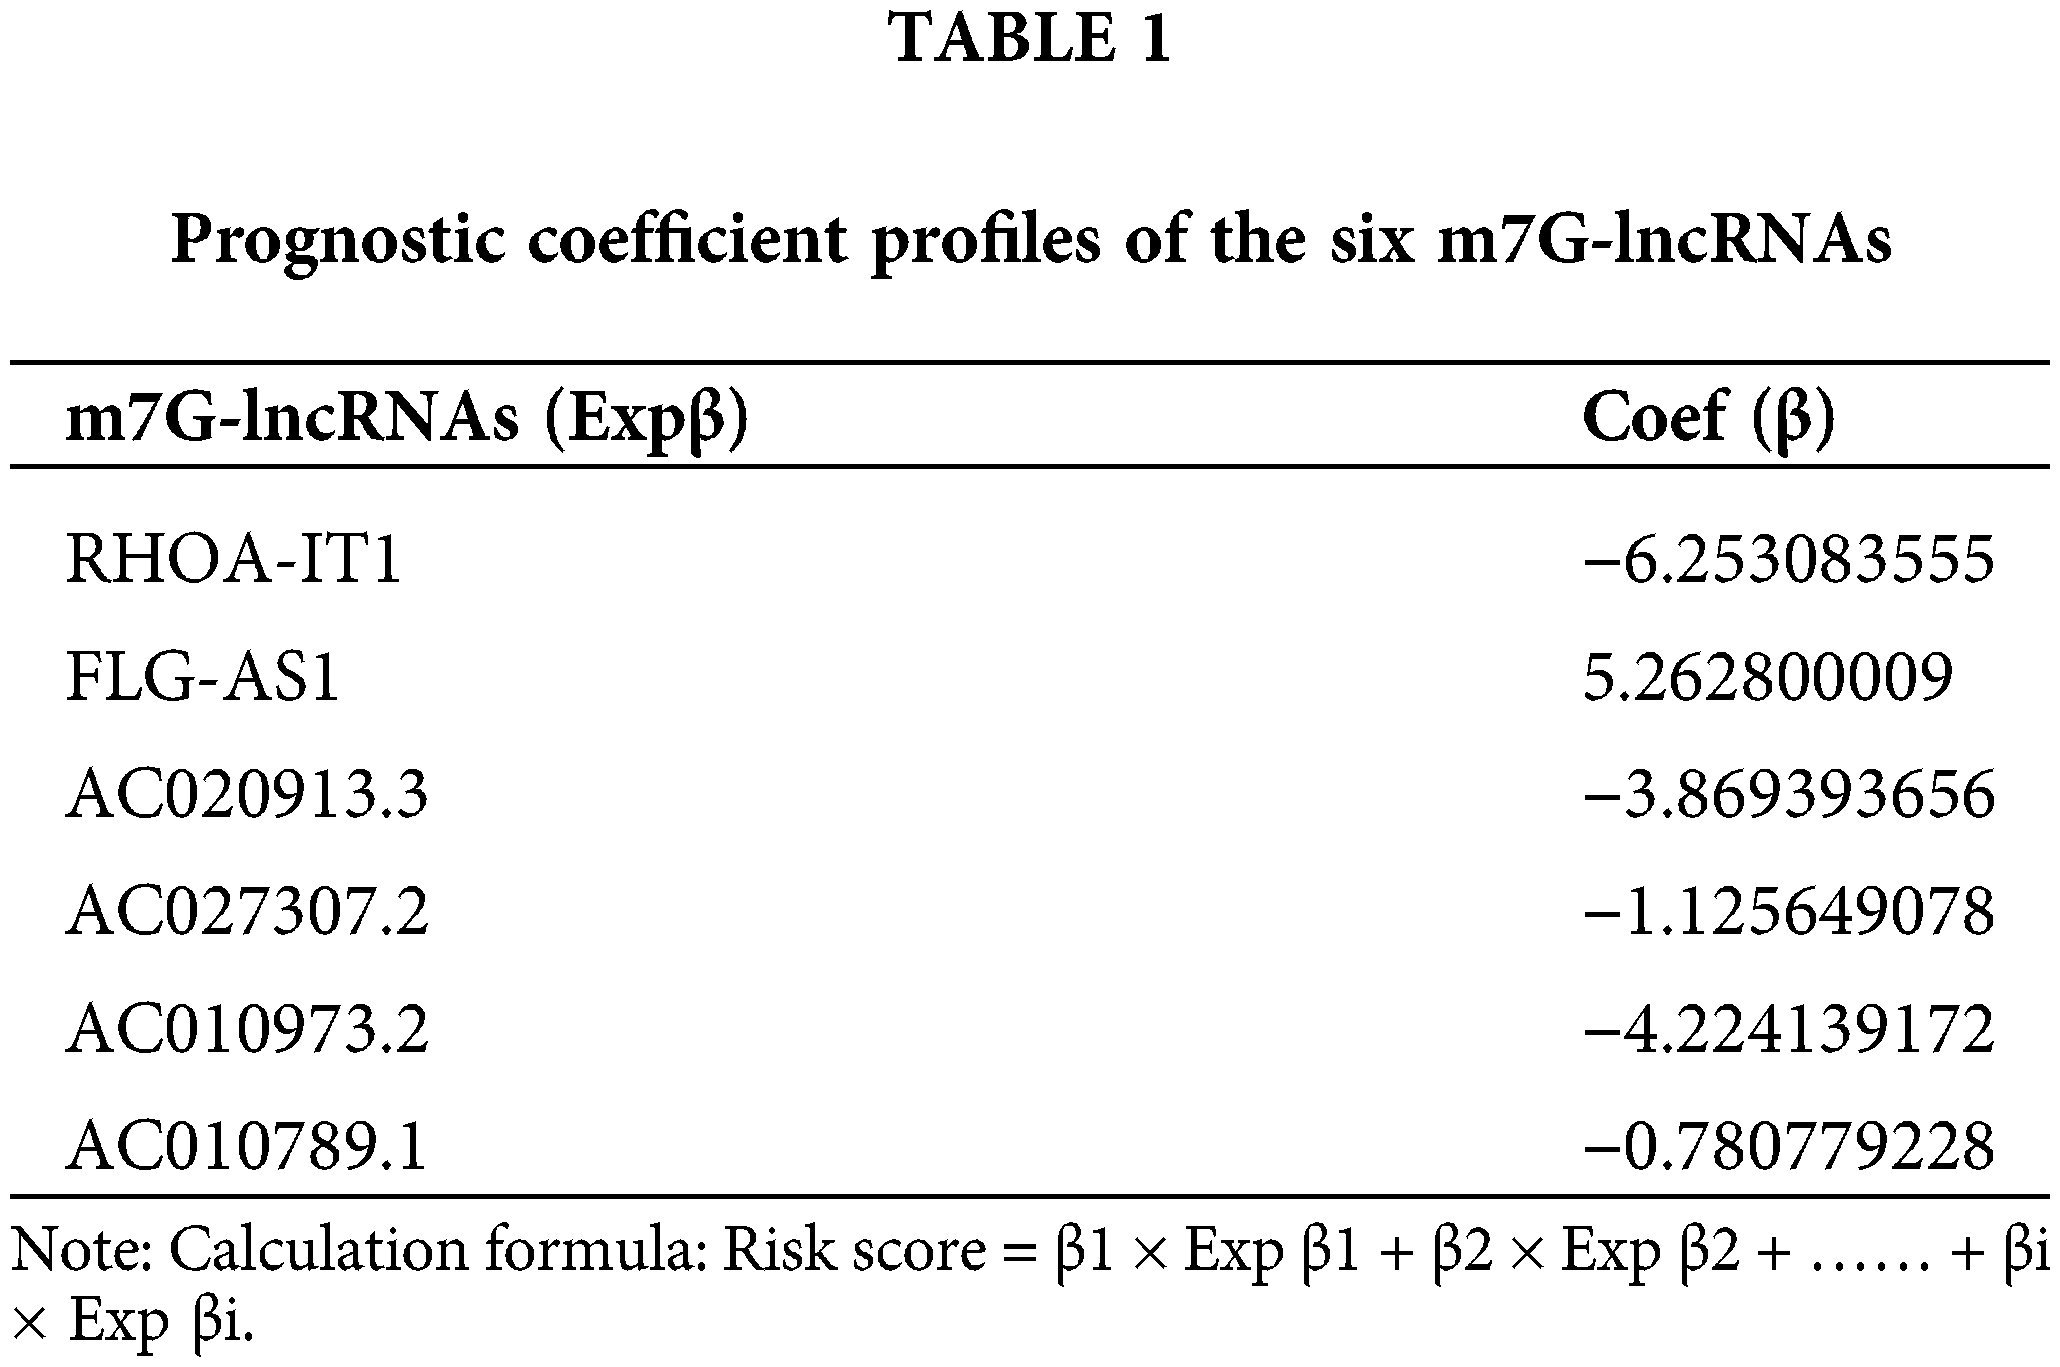
32 m7G-lncRNAs that affected the prognosis of LSCC individuals were identified by univariate Cox regression analysis of the train category (Fig. 3A). 13 m7G-lncRNAs with significantly different expression were chosen using cross-validation and LASSO regression for the Cox model development. (Figs. 3B and 3C). Additionally, a final prognostic model formula for the six m7G-lncRNAs was obtained using the optimization procedure (see Table 1). The results of the risk score in all/Train/Test groups are shown in Suppl. Table S3 (risk.all.txt, risk.test.txt, and risk.train.txt).
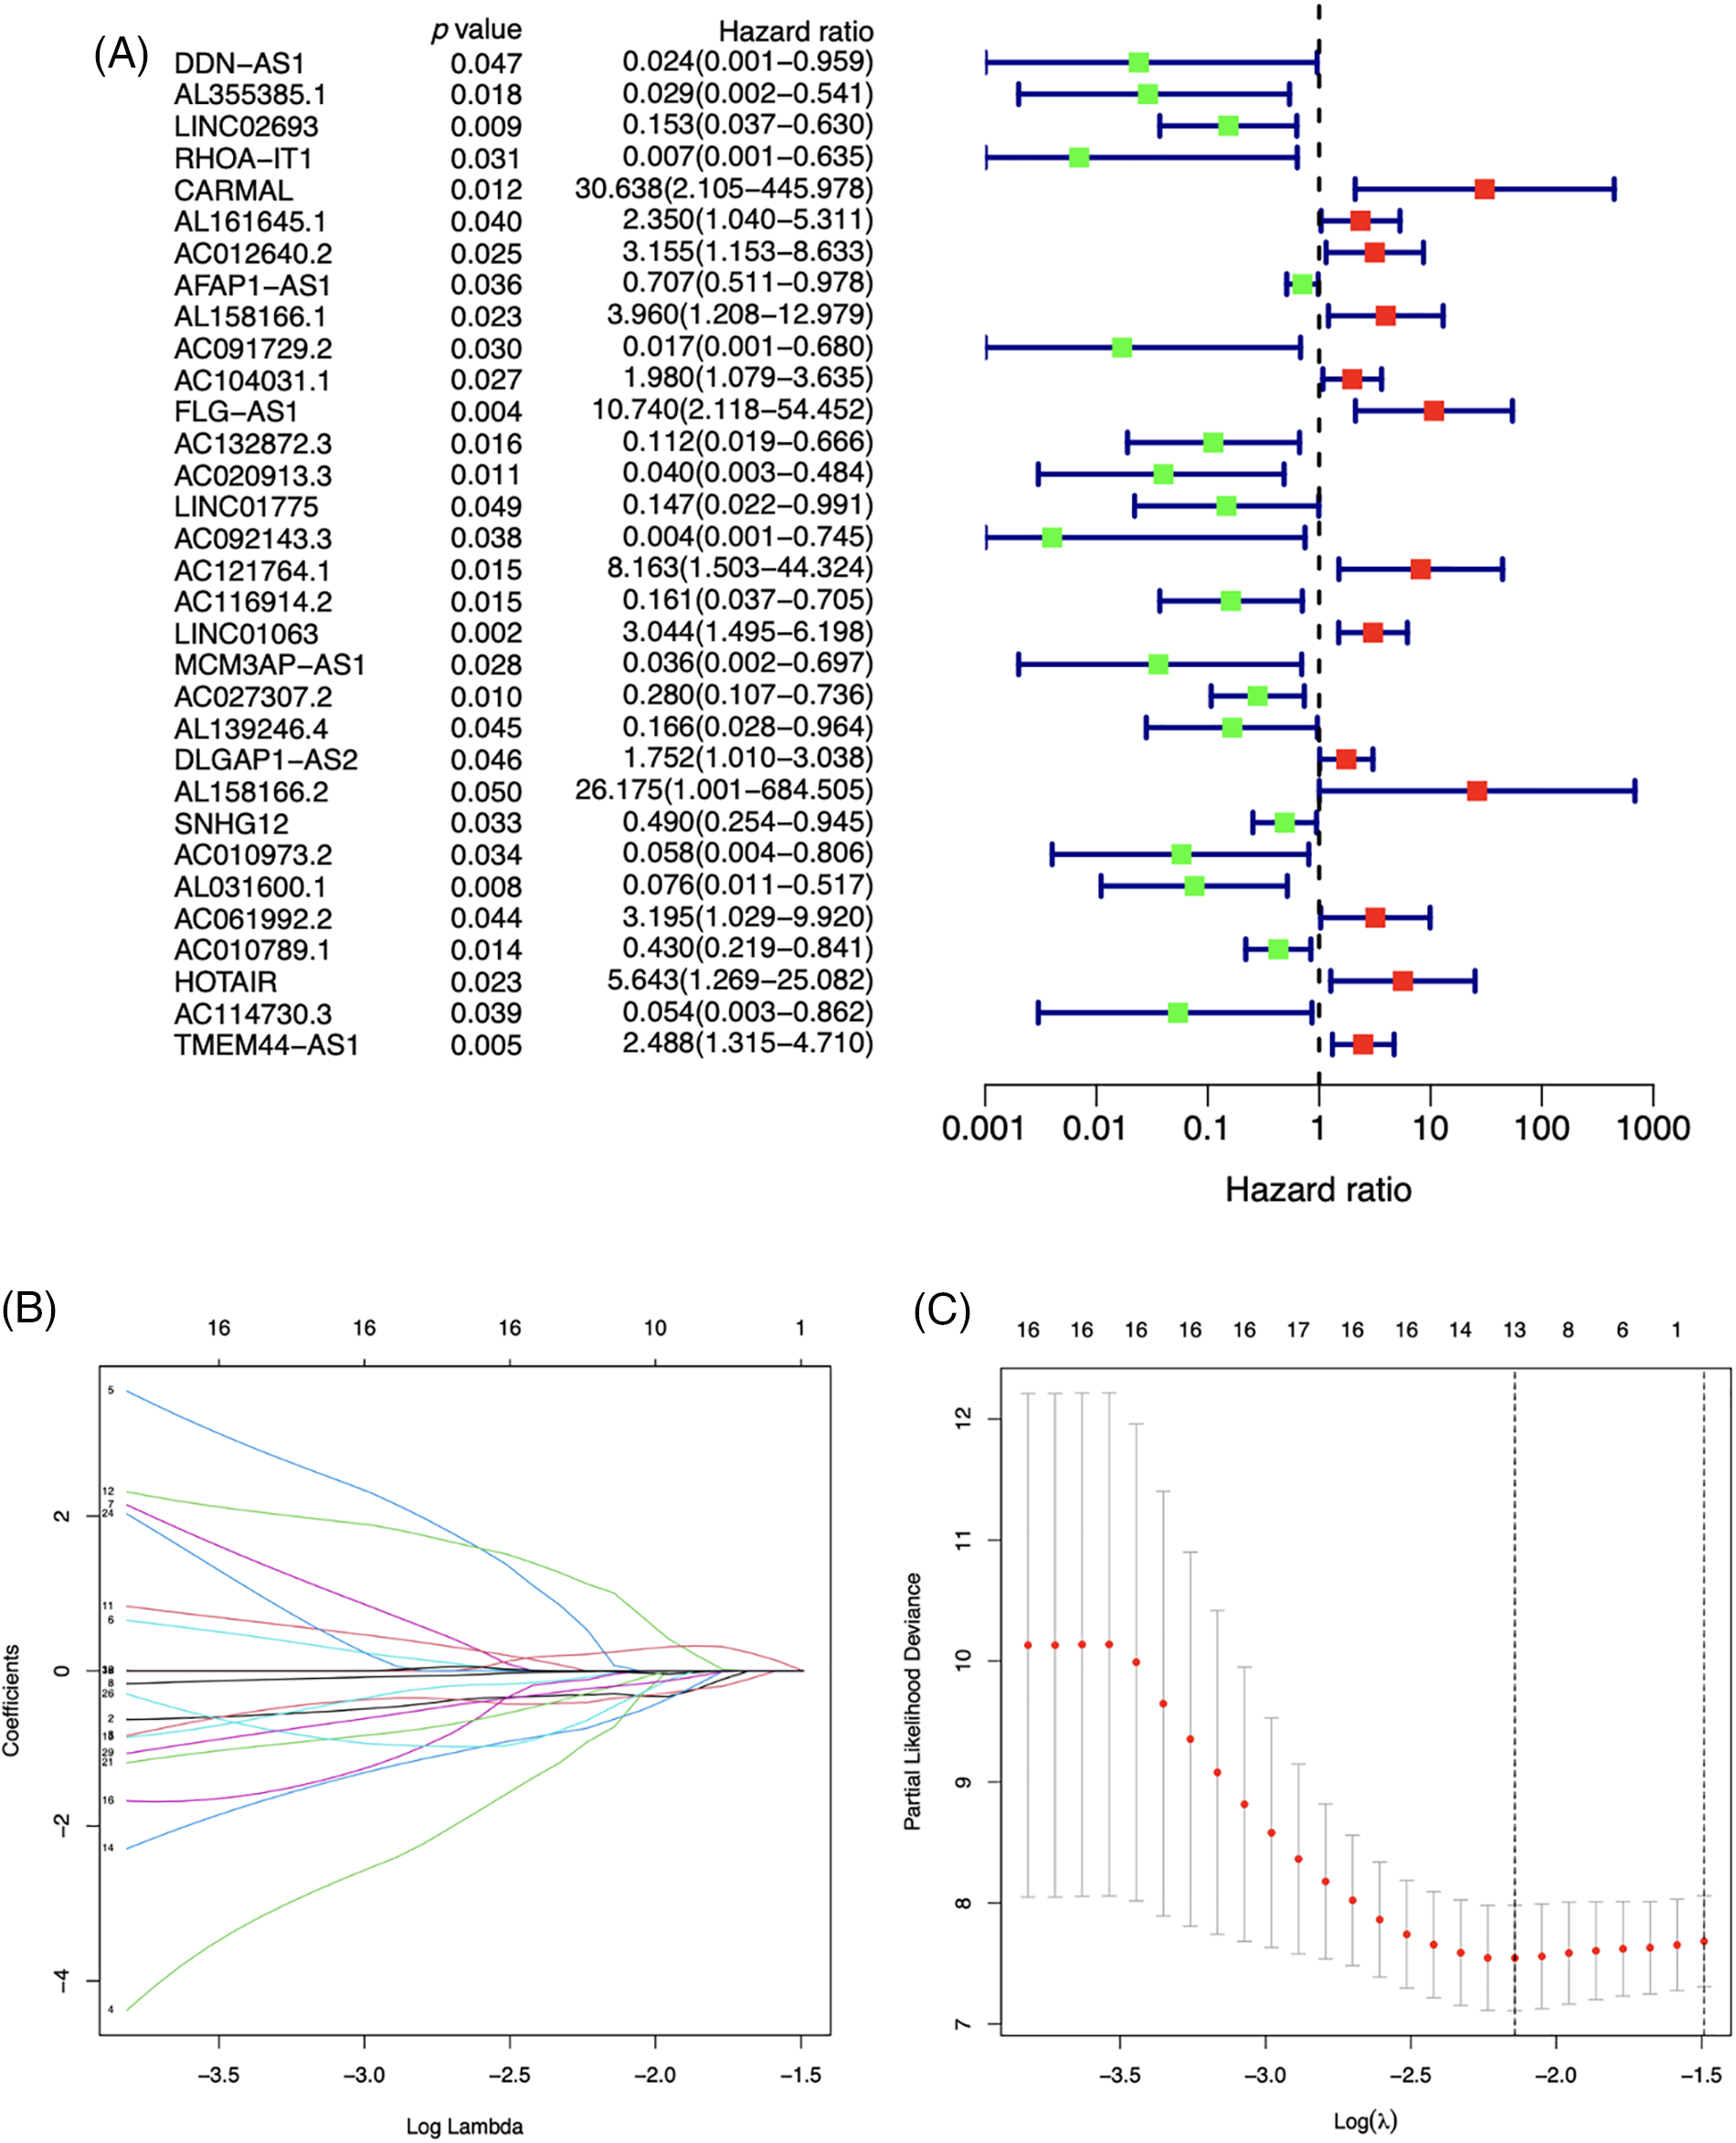
Figure 3: A forest plot of univariate (A) Cox regression analysis of 32 prognosis-related m7G-lncRNAs of LSCC patients in the Train group. Green or red square represents low or high hazard ratio (HR) value, blue solid lines represent 95% confidence intervals. Selecting the optimal adjustment parameter by the LASSO screening process (B) and cross validation (C).
Identification of differential expression prognostic m7G-lncRNAs between groups
By comparing and analyzing the m7G-lncRNAs expression profile of the two groups (LSCC group vs. normal group), we identified 32 differentially expressed prognostic m7G-lncRNAs (DEPm7G-lncRNAs). The results were visualized using a heat map (Fig. 4).
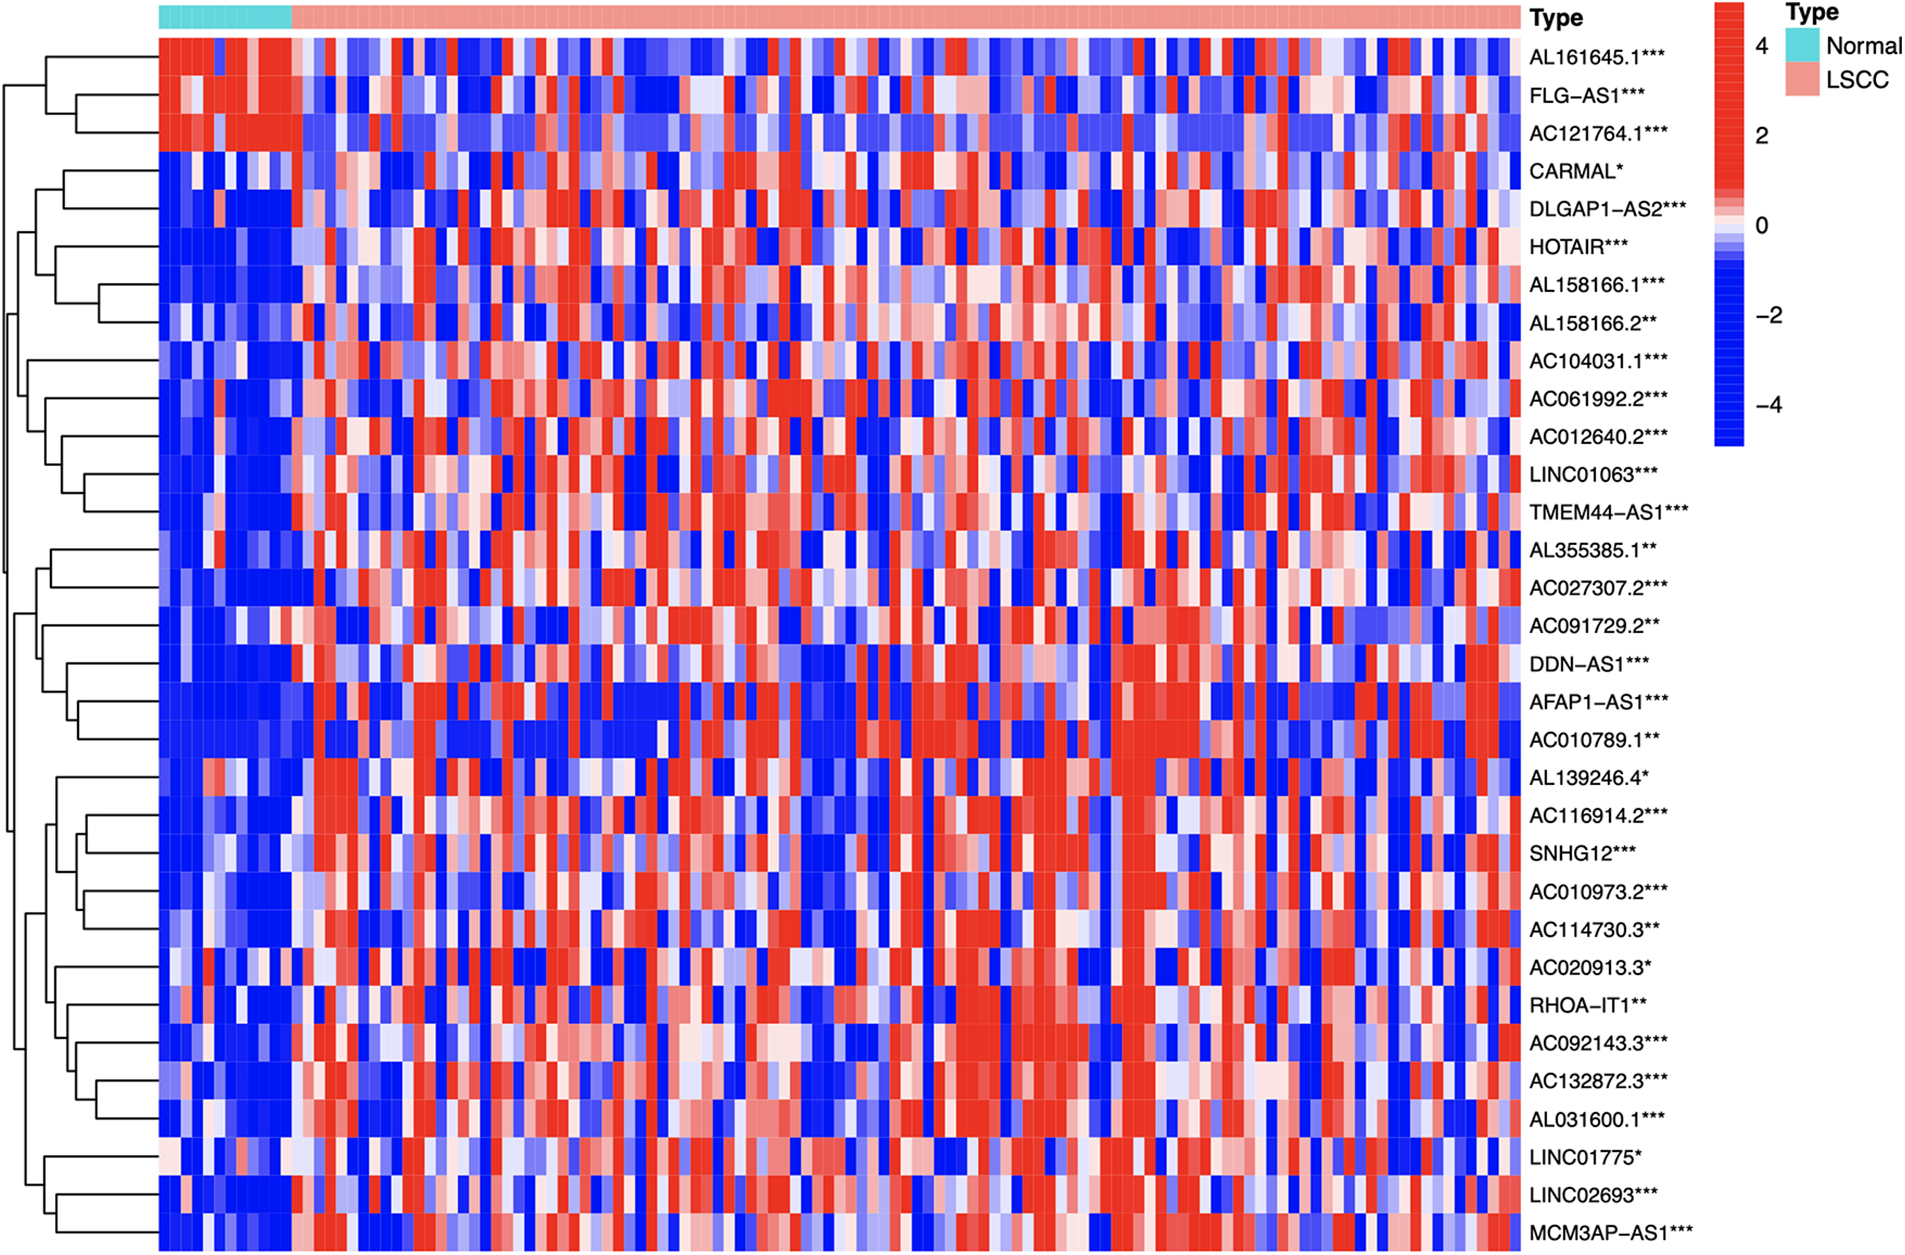
Figure 4: The heatmap of the DEPm7G-lncRNAs. Red, up-regulated lncRNAs; blue, down-regulated lncRNAs. Cut-off criteria: |logFC| ≥ 1.0 and *p-value < 0.05, **p-value < 0.01 or ***p-value < 0.001.
The correlation between DEPm7G-mRNAs and DEPm7G-lncRNAs
Correlation analysis between the mRNAs and lncRNAs revealed that 32 DEPm7G-lncRNAs had positive co-expression relationships with 13 DEPm7G-mRNAs. All association findings are shown in the Sankey diagram (Fig. 5).
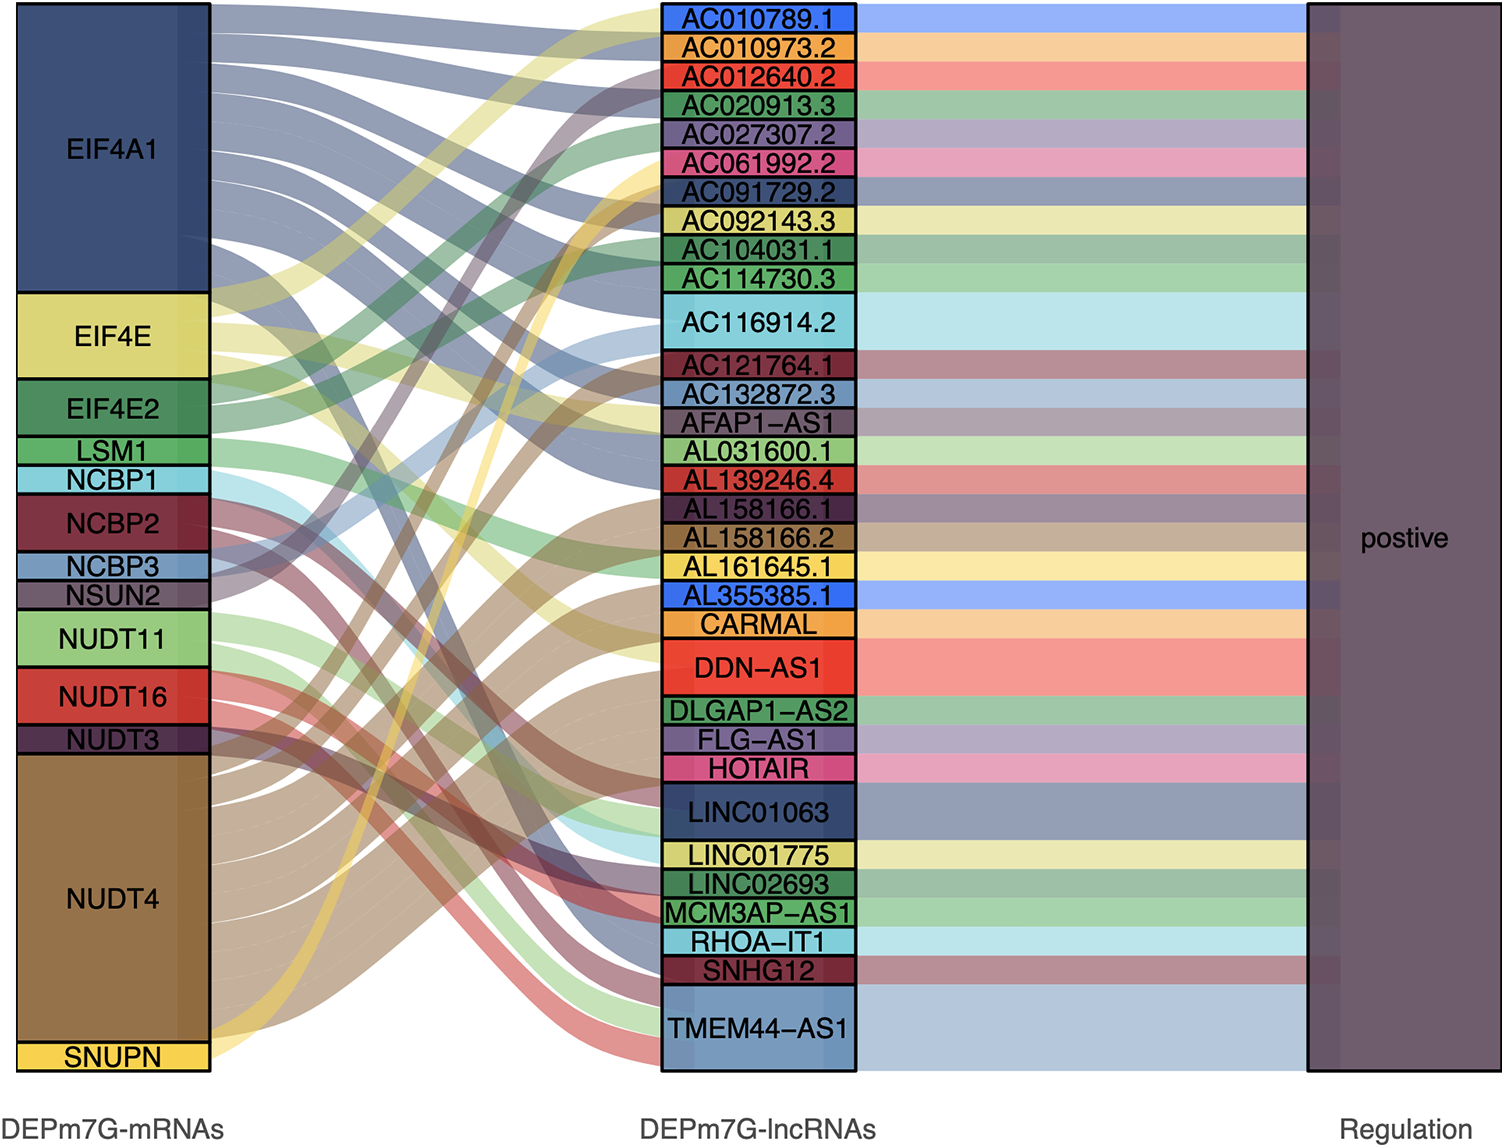
Figure 5: Sankey diagram direct shown the relationship between DEPm7G-mRNAs and DEPm7G-lncRNAs. The blocks on the left represent the DEPm7G-mRNAs, the middle blocks indicate DEPm7G-lncRNAs, and the blocks on the right represent the significant correlations.
Survival analyses and risk analyses of the prognosis prediction model
We created survival curves by comparing the disparity in survival prognosis among the high-risk and low-risk categories in the Train or Test category of the prognosis prediction model. Patients with LSCC in the high-risk group had substantially lower survival than those in the low-risk category, as shown in Figs. 6A and 6B (p-value < 0.05). To evaluate the prognosis performance of those with LSCC in both categories, we also conducted prognostic risk assessments. The risk score of the high-risk category was considerably greater than that of the low-risk category in both the training and test categories (p-value < 0.05) (Figs. 6C and 6D). patients’ average survival time reduced and the number of fatalities rose as the risk score rose (Figs. 6E and 6F). From Figs. 6G and 6H, it is clear that RHOA−IT1, AC020913.3, AC027307.2, AC010973.2 and AC010789.1 were low-risk m7G-mRNAs, while FLG−AS1 was a high-risk m7G-mRNA. The aforementioned findings show that the prognosis prediction model was able to distinguish between both prognostic categories’ survival rates with accuracy.
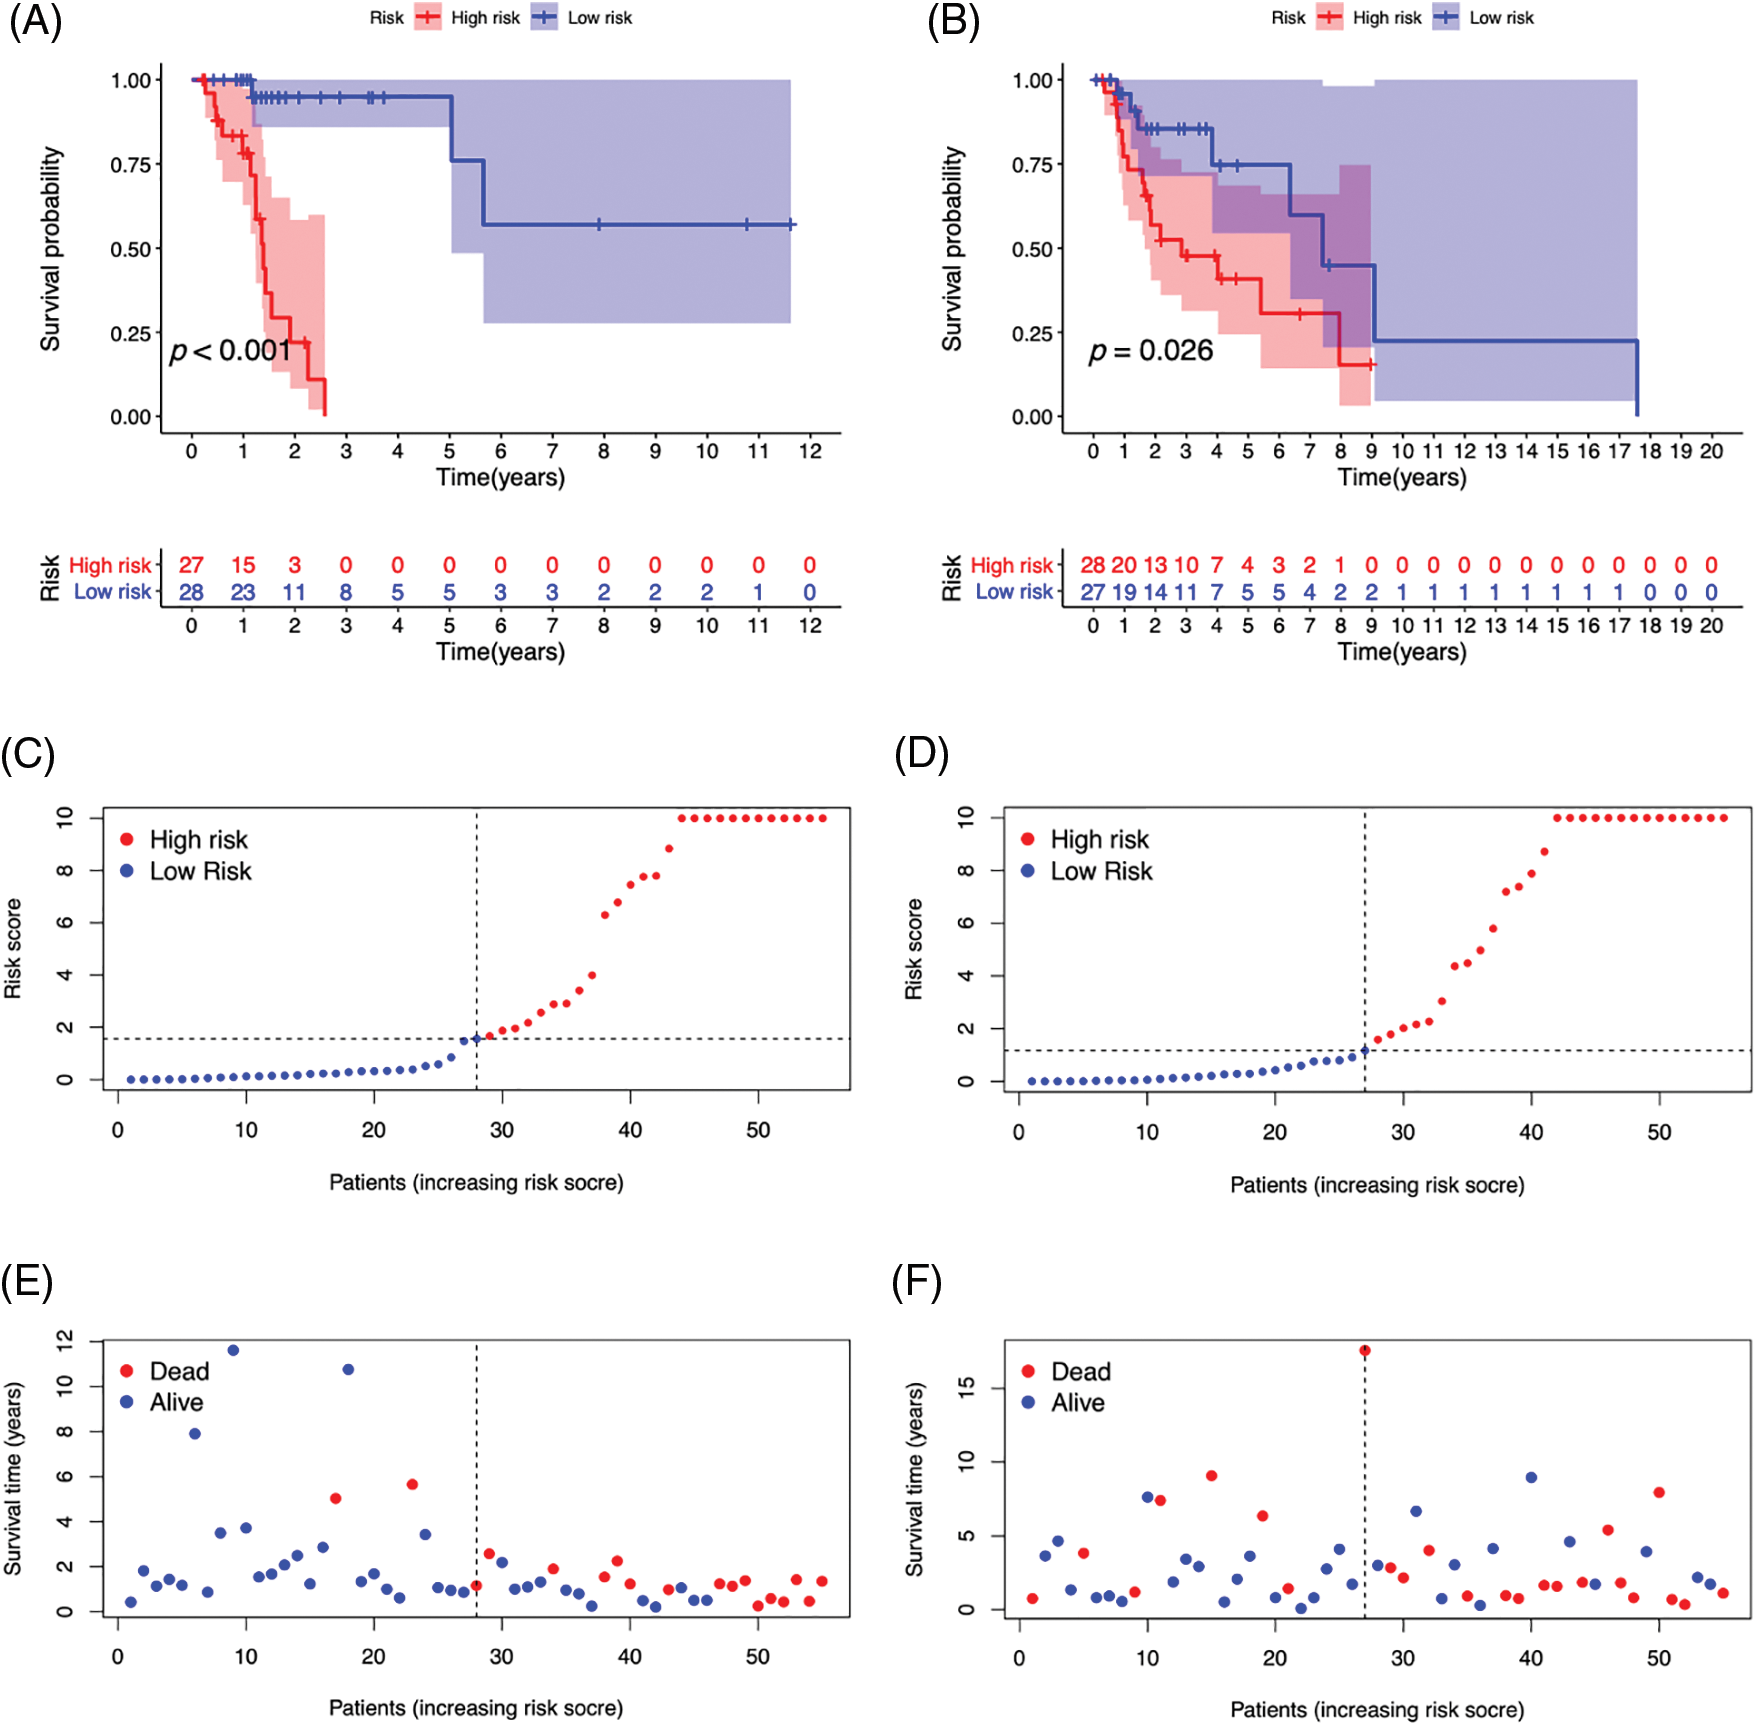
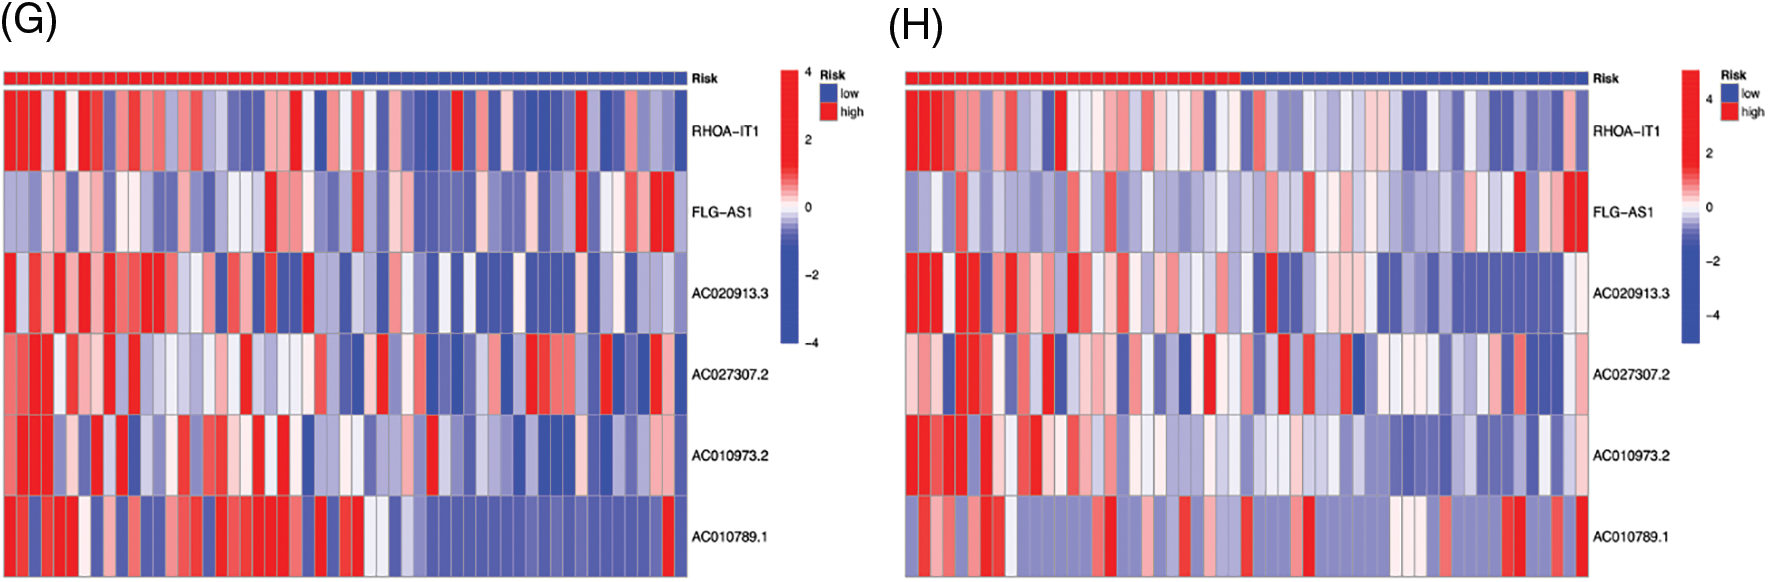
Figure 6: The survival curve of high- (red) and low-risk (blue) patients in Train (A) and Test (B) groups. Abscissa, survival time; Ordinate, survival probability. The tables below the curves showed the number of LSCC patients survived over time in the high- and low-risk patients. The risk curve plots in Train (C) and Test (D) groups. Abscissa: Patients risk scores ranked from low to high (The abscissa was the same in Figs. 3C–3H); Ordinate: risk score. Red dots: high-risk patients, blue dots: low-risk patients. The risk scatter plots in Train (E) and Test (F) groups. Ordinate: survival time. Red dots: patients dead, blue dots: patients alive. The risk heatmaps of DEPm7G-lncRNAs in Train (G) and Test (H) groups. Red squares: up-regulated lncRNAs; blue squares: down-regulated lncRNAs.
Evaluating the prognosis prediction model’s accuracy
To assess the prognostic prediction model’s accuracy, ROC curves and nomograms were created. Fig. 7A demonstrates that the 1-year, 3-year, and 5-year survival rates had corresponding areas under the ROC curves (AUC) of 0.780, 0.792, and 0.747. In the prognostic model, risk, an independent prognosis predictor, had a higher AUC value (AUC = 0.747) than the other clinical prognostic indicators, as seen in Fig. 7B. Based on these seven clinical characteristics, a nomogram was also created. The 1-, 3-, and 5-year survival rates were 93.4%, 46.4%, and 36.0%, correspondingly, after evaluating each prognostic factor for an individual who was chosen at random (Fig. 7C). The aforementioned findings demonstrate that our model has a high level of predictive accuracy for forecasting the prognosis of LSCC individuals.
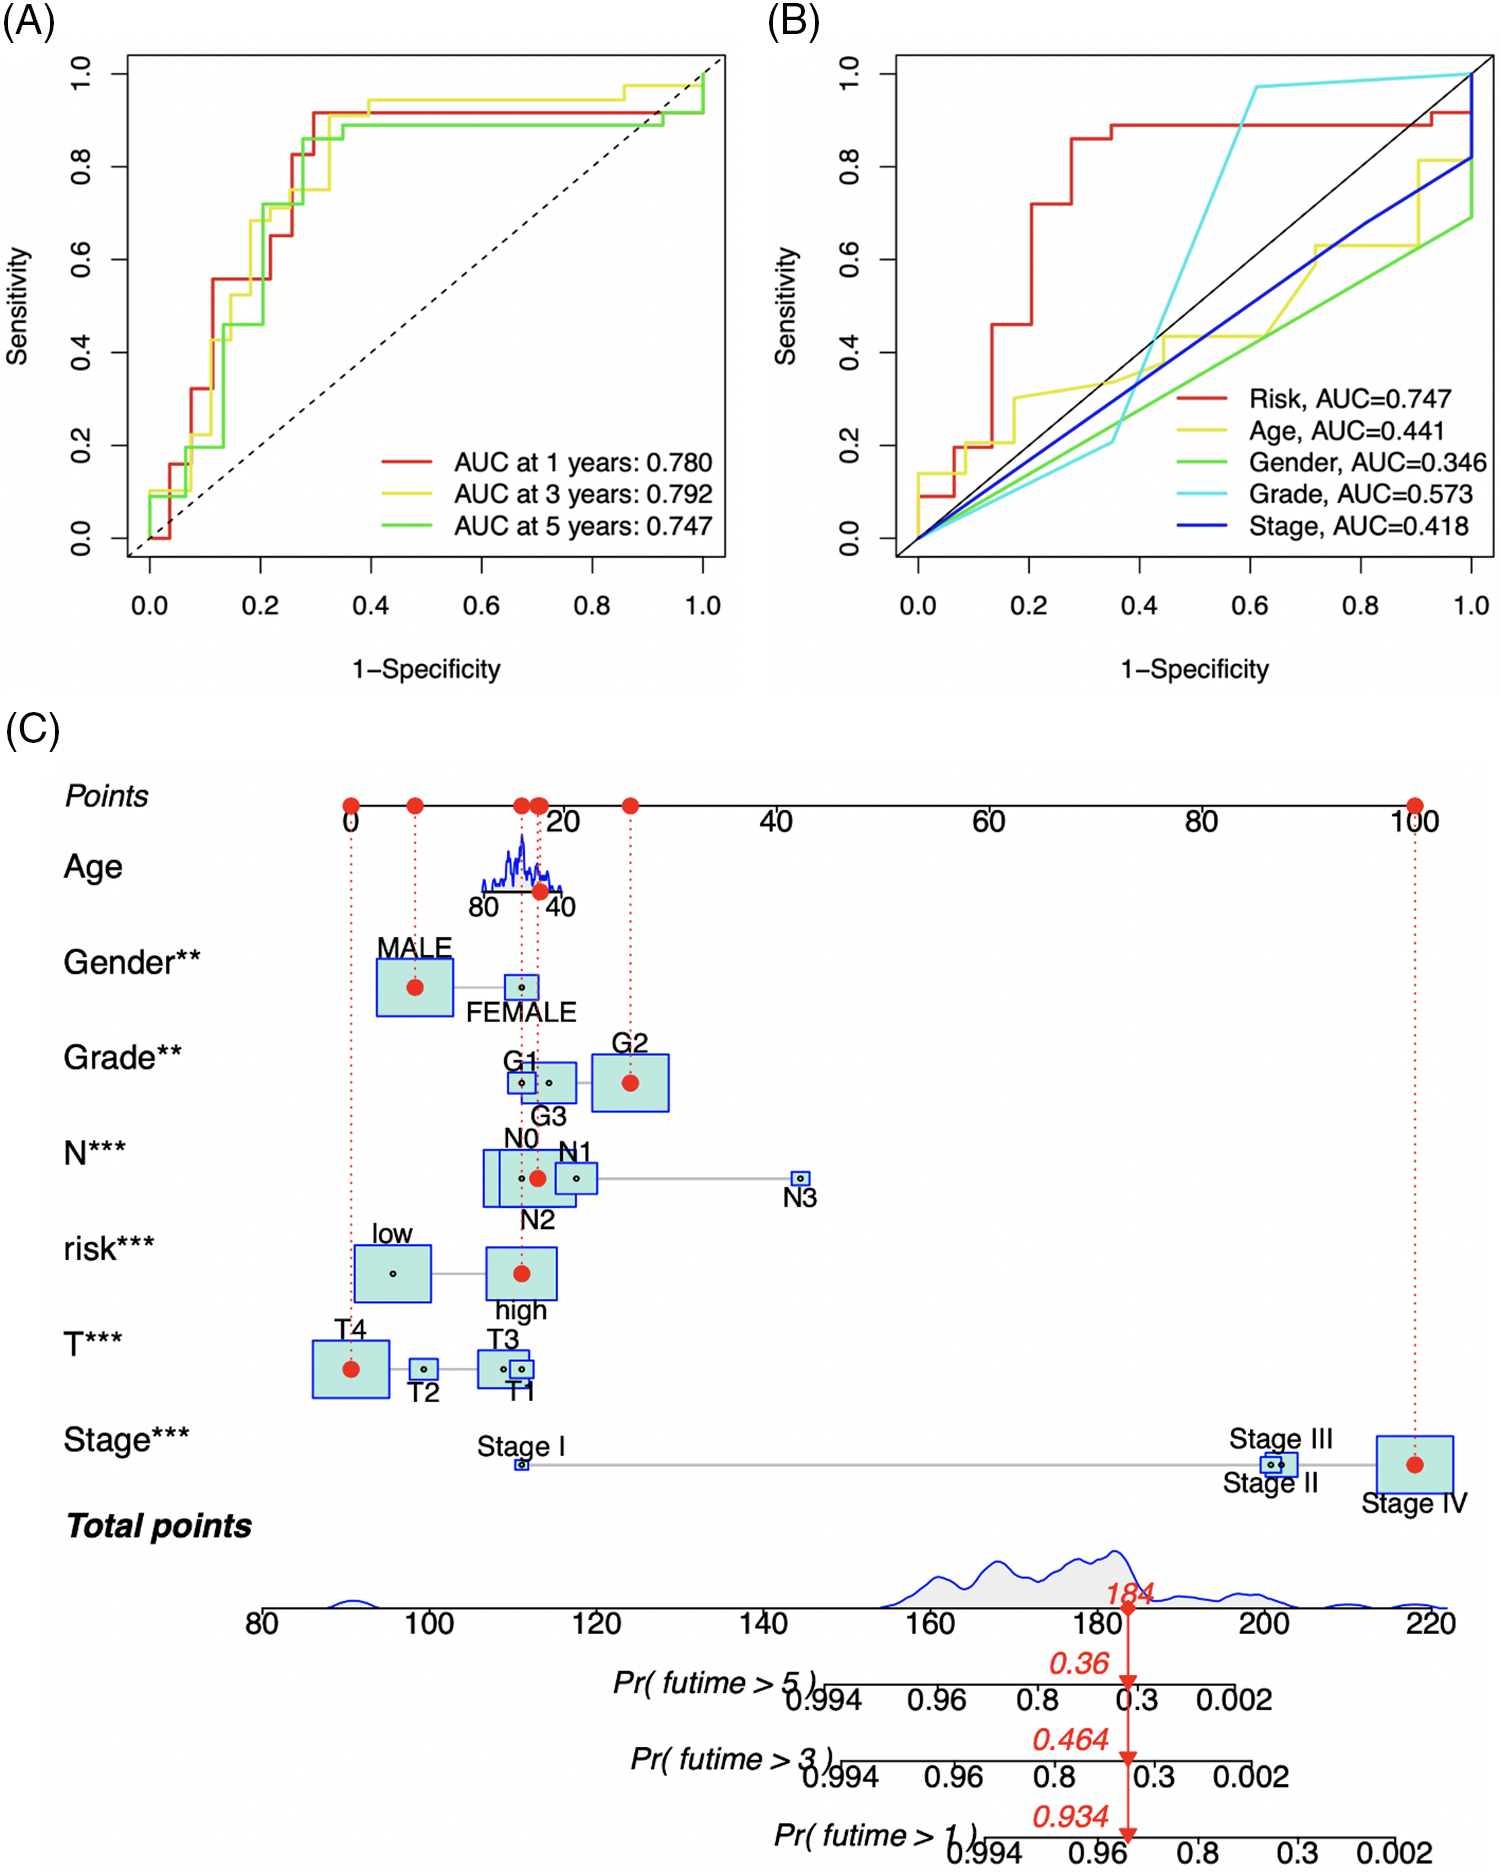
Figure 7: ROC curves (A and B) of the prognosis prediction model. The different colored curves indicate different survival rates (-year) or clinical parameters, AUC: area under curve. Abscissa: 1-Specificity (false positive rate), ordinate: Sensitivity (true positive rate). A nomogram (C) based on 7 clinical variables (Risk, Age, Gender, Grade, T, N, and Stage). **p-value < 0.01, ***p-value < 0.001.
The majority of laryngeal carcinomas, which are malignant tumours of the neck and head area, are LSCCs. Because there are few effective therapeutic targets and prognostic indicators, treating LSCC is still difficult, and patient survival is low. Using co-expression network analysis, we found 774 m7G- lncRNAs in the current study. Next, we identified 551 DEm7G-lncRNAs using a differential expression analysis. We then constructed a prognosis prediction model for six m7G-lncRNAs (FLG−AS1, RHOA−IT1, AC020913.3, AC027307.2, AC010973.2 and AC010789.1), identified 32 DEPm7G-lncRNAs, analyzed the correlation between 32 DEPm7G-lncRNAs and 13 DEPm7G-mRNAs, and performed survival analyses and risk analyses of the prognosis prediction model to assess the prognostic performance of LSCC patients. By displaying ROC curves and a nomogram, we finally checked the prognosis prediction model’s accuracy.
It has been noted recently that there are strong links between the prognosis of cancer individuals and the differential expression of m7G-lncRNAs. A multicenter investigation of 58 instances of esophageal squamous cell carcinoma was carried out in China (Zhang et al., 2020a). A prognostic prediction model based on three lncRNAs (SCAT1, PRKAG2-AS1, and FLG-AS1) was created through thorough bioinformatic research, and the model’s accuracy was confirmed utilising internal and external cohorts. Li et al. (2020) performed Cox and LASSO regression analysis established seven lncRNA (including AC027307.2) signatures to calculate the risk score of colon adenocarcinoma (COAD) and carried out clinical sample verification, It showed the clinical prognostic value of the risk scoring methodology. Zhou et al. (2020) identified that AC027307.2 was prognostic autophagy-related lncRNAs, which may be molecular biomarkers and therapeutic targets for COAD patients. Liu et al. (2020a) identified the characteristics of lncRNAs using a multivariate Cox analysis model and found that AC010973.2 was meaningfully correlated with the rate of survival of COAD individuals. Nucleic acid sequence alignment and literature searches revealed that the AC010973.2 homologous host gene has a high association with COAD. These findings offer fresh information that will help clarify COAD's pathophysiology going forward. On 197 differentially expressed genomic instability-associated lncRNAs in the TCGA-STAD dataset, Sun et al. (2021) conducted hierarchical clustering and Cox regression analysis. In order to establish lncRNAs linked with genomic instability, six lncRNAs (AC010789.1 et al.) with distinct prognostic significance were discovered. This offers a potentially novel way to look for tumour markers connected to genomic instability.
We discovered m7G-lncRNAs that were closely associated with the prognosis for individuals with LSCC using thorough bioinformatics studies. To evaluate the prognostic performance of individuals suffering from LSCC, we built a prognosis prediction model for six m7G-lncRNAs, performed co-expression network analysis and correlation analysis, survival analysis, and risk analysis of the model, and further confirmed the precision of the model by plotting ROC curves and a nomogram. By creating novel predictive lncRNA signatures for clinical evaluation and treatment, our findings will contribute to understanding the pathogenetic process of LSCC. However, there were also some limitations in the present investigation, including the paucity of additional studies on various clinical subtypes of laryngeal cancer and the fact that the precise molecular pathways have not been fully clarified. For this study’s findings to be considered legitimate, experimental verification is preferred.
Acknowledgement: The TCGA database provided useful transcriptome expression matrices and clinical details on LSCC, for which the authors are grateful.
Funding Statement: The study was supported by a grant Hebei Provincial Health Commission project from the Foundation of Basic Research (No. 20191843).
Author Contributions: The authors confirm contribution to the paper as follows: study conception and design: ZXY; data collection: XYR, CJW and KLS; analysis and interpretation of results: HBM, LL, QZ and LCQ; draft manuscript preparation: ZXY. All authors reviewed the results and approved the final version of the manuscript.
Availability of Data and Materials: The datasets generated during and/or analyzed during the current study are available from the corresponding author on reasonable request.
Ethics Approval: Not applicable.
Conflicts of Interest: The authors declare that they have no conflicts of interest to report regarding the present study.
Supplementary Materials: The supplementary materials are available online at https://doi.org/10.32604/biocell.2023.030796.
References
Allegra E, Puzzo L, Zuccalà V, Trapasso S, Vasquez E, Garozzo A, Caltabiano R (2012). Nuclear BMI-1 expression in laryngeal carcinoma correlates with lymph node pathological status. World Journal of Surgical Oncology 10: 206. https://doi.org/10.1186/1477-7819-10-206 [Google Scholar] [CrossRef]
Awan F, Ali M, Hamid M, Awan M, Mushtaq M, Kalsoom S, Ijaz M, Mehmood K, Liu Y (2021). Epi-gene: An R-package for easy pan-genome analysis. BioMed Research International 2021: 5585586. https://doi.org/10.1155/2021/5585586 [Google Scholar] [CrossRef]
Balzeau J, Menezes MR, Cao S, Hagan JP (2017). The LIN28/let-7 pathway in cancer. Frontiers in Genetics 8: 31. https://doi.org/10.3389/fgene.2017.00031 [Google Scholar] [CrossRef]
Boccaletto P, Stefaniak F, Ray A, Cappannini A, Mukherjee S et al. (2022). MODOMICS: A database of RNA modification pathways. 2021 update. Nucleic Acids Research 50: D231–D235. https://doi.org/10.1093/nar/gkab1083 [Google Scholar] [CrossRef]
Chen X, Lan H, He D, Wang Z, Xu R et al. (2021). Analysis of Autophagy-related signatures identified two distinct subtypes for evaluating the tumor immune microenvironment and predicting prognosis in ovarian cancer. Frontiers in Oncology 11: 616133. https://doi.org/10.3389/fonc.2021.616133 [Google Scholar] [CrossRef]
Chen X, Liu DI, Wang J, Su Q, Zhou P, Liu J, Luan M, Xu X (2014). Suppression effect of recombinant adenovirus vector containing hIL-24 on Hep-2 laryngeal carcinoma cells. Oncology Letters 7: 771–777. https://doi.org/10.3892/ol.2014.1789 [Google Scholar] [CrossRef]
Chen X, Su X, Zhu C, Zhou J (2019). Knockdown of hsa_circ_0023028 inhibits cell proliferation, migration, and invasion in laryngeal cancer by sponging miR-194-5p. Bioscience Reports 39: 1545. https://doi.org/10.1042/BSR20190177 [Google Scholar] [CrossRef]
Dong K, Huo M, Sun H, Li T, Li D (2020). Mechanism of Astragalus membranaceus in the treatment of laryngeal cancer based on gene co-expression network and molecular docking. Scientific Reports 10: 11184. https://doi.org/10.1038/s41598-020-68093-0 [Google Scholar] [CrossRef]
Fang Y, Huang S, Han L, Wang S, Xiong B (2021). Comprehensive analysis of peritoneal metastasis sequencing data to identify LINC00924 as a prognostic biomarker in gastric cancer. Cancer Management and Research 13: 5599–5611. https://doi.org/10.2147/CMAR.S318704 [Google Scholar] [CrossRef]
Ferrer-Bonsoms J, Jareno L, Rubio A (2021). Rediscover: An R package to identify mutually exclusive mutations. Bioinformatics 38: 844–845. https://doi.org/10.1093/bioinformatics/btab709 [Google Scholar] [CrossRef]
Glover R, Al-Haboubi M, Petticrew M, Eastmure E, Peacock S, Mays N (2021). Sankey diagrams can clarify ‘evidence attrition’: A systematic review and meta-analysis of the effectiveness of rapid diagnostic tests for antimicrobial resistance. Journal of Clinical Epidemiology 144: 173–184. https://doi.org/10.1016/j.jclinepi.2021.11.032 [Google Scholar] [CrossRef]
Groeneveld C, Chagas V, Jones S, Robertson A, Ponder B, Meyer K, Castro M (2019). RTNsurvival: An R/Bioconductor package for regulatory network survival analysis. Bioinformatics 35: 4488–4489. https://doi.org/10.1093/bioinformatics/btz229 [Google Scholar] [CrossRef]
Groome P, O’Sullivan B, Irish J, Rothwell D, Schulze K et al. (2003). Management and outcome differences in supraglottic cancer between Ontario, Canada, and the surveillance, epidemiology, and end results areas of the United States. Journal of Clinical Oncology 21: 496–505. https://doi.org/10.1200/JCO.2003.10.106 [Google Scholar] [CrossRef]
Hu K (2021). Become competent in generating RNA-Seq heat maps in one day for novices without prior R experience. Methods in Molecular Biology 2239: 269–303. https://doi.org/10.1007/978-1-0716-1084-8_17 [Google Scholar] [CrossRef]
Lee J-S (2016). Exploring cancer genomic data from the cancer genome atlas project. BMB Reports 49: 607–611. https://doi.org/10.5483/BMBRep.2016.49.11.145 [Google Scholar] [CrossRef]
Li P, Liu H, Wang Z, He F, Wang H, Shi Z, Yang A, Ye J (2016). MicroRNAs in laryngeal cancer: Implications for diagnosis, prognosis and therapy. American Journal of Translational Research 8: 1935–1944. [Google Scholar]
Li Z, Wang D, Yin H (2020). A seven immune-related lncRNA signature predicts the survival of patients with colon adenocarcinoma. American Journal of Translational Research 12: 7060–7078. [Google Scholar]
Liu W, Islamaj Doğan R, Kwon D, Marques H, Rinaldi F, Wilbur W, Comeau D (2014). BioC implementations in Go, Perl, Python and Ruby. Database 2014: bau059. https://doi.org/10.1093/database/bau059 [Google Scholar] [CrossRef]
Liu X, Xiao C, Tan F, Yi R, Zhao X (2020a). Discovered differentially expressed lncRNA AC010973.2 can act as a diagnostic and prognostic biomarker for colon adenocarcinoma. Translational Cancer Research 9: 6275–6286. https://doi.org/10.21037/tcr-20-2011 [Google Scholar] [CrossRef]
Liu Y, Yang C, Zhao Y, Chi Q, Wang Z, Sun B (2019). Overexpressed methyltransferase-like 1 (METTL1) increased chemosensitivity of colon cancer cells to cisplatin by regulating miR-149-3p/S100A4/p53 axis. Aging 11: 12328–12344. https://doi.org/10.18632/aging.102575 [Google Scholar] [CrossRef]
Liu Y, Yin S, Zeng S, Hu Y, Wang M, Huang P, Li J (2021). (LHFPL6) Prognostic value of LHFPL Tetraspan subfamily member 6 in gastric cancer: A study based on bioinformatics analysis and experimental validation. Pharmacogenomics and Personalized Medicine 14: 1483–1504. https://doi.org/10.2147/PGPM.S332345 [Google Scholar] [CrossRef]
Liu Y, Zhang Y, Chi Q, Wang Z, Sun B (2020b). Methyltransferase-like 1 (METTL1) served as a tumor suppressor in colon cancer by activating 7-methyguanosine (m7G) regulated let-7e miRNA/HMGA2 axis. Life Science Part 1 Physiology & Pharmacology 249: 117480. https://doi.org/10.1016/j.lfs.2020.117480 [Google Scholar] [CrossRef]
Lu L, Liu L, Zhao Q, Gui R, Zhao Q (2021). Identification of a ferroptosis-related LncRNA signature as a novel prognosis model for lung adenocarcinoma. Frontiers in Oncology 11: 675545. https://doi.org/10.3389/fonc.2021.675545 [Google Scholar] [CrossRef]
Pan Y, Wu L, He S, Wu J, Wang T, Zang H (2021). Identification of hub genes in thyroid carcinoma to predict prognosis by integrated bioinformatics analysis. Bioengineered 12: 2928–2940. https://doi.org/10.1080/21655979.2021.1940615 [Google Scholar] [CrossRef]
Pandolfini L, Barbieri I, Bannister AJ, Hendrick A, Andrews B et al. (2019). METTL1 promotes let-7 MicroRNA processing via m7G methylation. Molecular Cell 74: 1278–1290.e9. https://doi.org/10.1016/j.molcel.2019.03.040 [Google Scholar] [CrossRef]
Seo JY, Jung Y, Kim DY, Ryu HG, Lee J, Kim SW, Kim KT (2019). DAP5 increases axonal outgrowth of hippocampal neurons by enhancing the cap-independent translation of DSCR1.4 mRNA. Cell Death & Disease 10: 49. https://doi.org/10.1038/s41419-018-1299-x [Google Scholar] [CrossRef]
Sun J, Jiang Q, Chen H, Zhang Q, Zhao J, Li H, Wang X, Fang Y, Ruan Y, Sun Y (2021). Genomic instability-associated lncRNA signature predicts prognosis and distinct immune landscape in gastric cancer. Annals of Translational Medicine 9: 1326. https://doi.org/10.21037/atm-21-3569 [Google Scholar] [CrossRef]
Teng P, Liang Y, Yarmishyn A, Hsiao Y, Lin T et al. (2021). RNA modifications and epigenetics in modulation of lung cancer and pulmonary diseases. International Journal of Molecular Sciences 22: 10592. https://doi.org/10.3390/ijms221910592 [Google Scholar] [CrossRef]
Wu S, Zhang X, Rui W, Sheng Y, Yu Y, Zhang Y, Yao Z, Qiu T, Ren Y (2022). A nomogram strategy for identifying the subclassification of IDH mutation and ATRX expression loss in lower-grade gliomas. European Radiology 32: 3187–3198. https://doi.org/10.1007/s00330-021-08444-1 [Google Scholar] [CrossRef]
Yang Y, Li L, Zheng Y, Liu Q, Wei X, Gong X, Wang W, Lin P (2020). A prospective, single-arm, phase II clinical trial of intraoperative radiotherapy using a low-energy X-ray source for local advanced laryngocarcinoma (ILALA study protocol. BMC Cancer 20: 734. https://doi.org/10.1186/s12885-020-07233-1 [Google Scholar] [CrossRef]
Zhang Z, Cortese G, Combescure C, Marshall R, Lee M, Lim H, Haller B (2018). Overview of model validation for survival regression model with competing risks using melanoma study data. Annals of Translational Medicine 6: 325. https://doi.org/10.21037/atm.2018.07.38 [Google Scholar] [CrossRef]
Zhang Y, Kuster D, Schmidt T, Kirrmaier D, Nübel G, Ibberson D, Benes V, Hombauer H, Knop M, Jäschke A (2020c). Extensive 5'-surveillance guards against non-canonical NAD-caps of nuclear mRNAs in yeast. Nature Communications 11: 5508. https://doi.org/10.1038/s41467-020-19326-3 [Google Scholar] [CrossRef]
Zhang Y, Miao Y, Shang M, Liu M, Liu R, Pan E, Pu Y, Yin L (2019). leads to G1 arrest by p53 pathway in esophageal squamous cell carcinoma. Cancer Management and Research 11: 6201–6214. https://doi.org/10.2147/CMAR [Google Scholar] [CrossRef]
Zhang M, Sun L, Ru Y, Zhang S, Miao J, Guo P, Lv J, Guo F, Liu B (2020b). A risk score system based on DNA methylation levels and a nomogram survival model for lung squamous cell carcinoma. International Journal of Molecular Medicine 46: 252–264. https://doi.org/10.3892/ijmm.2020.4590 [Google Scholar] [CrossRef]
Zhang C, Zhang Z, Zhang G, Xue L, Yang H et al. (2020a). A three-lncRNA signature of pretreatment biopsies predicts pathological response and outcome in esophageal squamous cell carcinoma with neoadjuvant chemoradiotherapy. Clinical and Translational Medicine 10: e156. https://doi.org/10.1002/ctm2.156 [Google Scholar] [CrossRef]
Zhao Y, Hu S, Zhang J, Cai Z, Wang S, Liu M, Dai J, Gao Y (2021b). Glucoside xylosyltransferase 2 as a diagnostic and prognostic marker in gastric cancer via comprehensive analysis. Bioengineered 12: 5641–5654. https://doi.org/10.1080/21655979.2021.1967067 [Google Scholar] [CrossRef]
Zhao W, Liu M, Zhang M, Wang Y, Zhang Y, Wang S, Zhang N (2021a). Effects of inflammation on the immune microenvironment in gastric cancer. Frontiers in Oncology 11: 690298. https://doi.org/10.3389/fonc.2021.690298 [Google Scholar] [CrossRef]
Zhao R, Xiong C, Zhang C, Wang L, Liang H, Luo X (2022). Construction of a prognosis-related gene signature by weighted gene coexpression network analysis in Ewing sarcoma. Computational and Mathematical Methods in Medicine 2022: 8798624. https://doi.org/10.1155/2022/8798624 [Google Scholar] [CrossRef]
Zhou W, Zhang S, Li H, Cai Z, Tang S, Chen L, Lang J, Chen Z, Chen X (2020). Development of prognostic indicator based on autophagy-related lncRNA analysis in colon adenocarcinoma. BioMed Research International 2020: 9807918. https://doi.org/10.1155/2020/9807918 [Google Scholar] [CrossRef]
Cite This Article
 Copyright © 2023 The Author(s). Published by Tech Science Press.
This work is licensed under a Creative Commons Attribution 4.0 International License , which permits unrestricted use, distribution, and reproduction in any medium, provided the original work is properly cited.
 Downloads
 Citation Tools