
 Submit a Paper
 Propose a Special lssue
 Open Access
ARTICLE

Systematic analysis of DNA polymerases as therapeutic targets in pan-cancers
1 Department of Thoracic Surgery, Fourth Hospital of Hebei Medical University, Shijiazhuang, 050011, China
2 Department of Thoracic Surgery, The First Hospital of Xingtai, Xingtai, 054001, China
3 Department of Thoracic Surgery, Affiliated Hospital of Hebei University, Baoding, 050017, China
4 Shanghai OrigiMed Co., Ltd., Shanghai, 200000, China
5 Department of Thoracic Surgery, The Seventh Affiliated Hospital of Sun Yat-sen University, Shenzhen, 518107, China
* Corresponding Authors: YUN LI. Email: ; ZIQIANG TIAN. Email:
(This article belongs to the Special Issue: Bioinformatics Study of Diseases)
BIOCELL 2024, 48(1), 123-138. https://doi.org/10.32604/biocell.2023.031568
Received 13 July 2023; Accepted 20 November 2023; Issue published 30 January 2024
 View Full Text
 Download PDF
Abstract
Introduction: DNA polymerases are crucial for maintaining genome stability and influencing tumorigenesis. However, the clinical implications of DNA polymerases in tumorigenesis and their potential as anti-cancer therapy targets are not well understood. Methods: We conducted a systematic analysis using TCGA Pan-Cancer Atlas data and Gene Set Cancer Analysis results to examine the expression profiles of 15 DNA polymerases (POLYs) and their clinical correlations. We also evaluated the prognostic value of POLYs by analyzing their expression levels in relation to overall survival time (OS) using Kaplan-Meier survival curves. Additionally, we investigated the correlations between POLY expression and immune cells, DNA damage repair (DDR) pathways, and ubiquitination. Drug sensitivity analysis was performed to assess the relationship between POLY expression and drug response. Results: Our analysis revealed that 14 out of 15 POLYs exhibited significantly distinct expression patterns between tumor and normal samples across most cancer types, except for DNA nucleotidylexotransferase (DNTT). Specifically, POLD1 and POLE showed elevated expression in almost all cancers, while POLQ exhibited high expression levels in all cancer types. Some POLYs showed heightened expression in specific cancer subtypes, while others exhibited low expression. Kaplan-Meier survival curves demonstrated significant prognostic value of POLYs in multiple cancers, including PAAD, KIRC, and ACC. Cox analysis further validated these findings. Alteration patterns of POLYs varied significantly among different cancer types and were associated with poorer survival outcomes. Significant correlations were observed between the expression of POLY members and immune cells, DDR pathways, and ubiquitination. Drug sensitivity analysis indicated an inverse relationship between POLY expression and drug response. Conclusion: Our comprehensive study highlights the significant role of POLYs in cancer development and identifies them as promising prognostic and immunological biomarkers for various cancer types. Additionally, targeting POLYs therapeutically holds promise for tumor immunotherapy.Keywords
Supplementary Material
Supplementary Material FileDNA polymerases play a crucial role in maintaining genome integrity by ensuring accurate DNA replication and repair [1]. Fifteen DNA polymerases have been identified in humans, with POLα (encoded by POLA1), POLε (encoded by POLE) and POLδ (encoded by POLD1) primarily involved in DNA replication processes, whereas POLη (POLH), POLι (POLI), POLκ (POLK), REV1, POLη (REV3L), POLθ (POLQ), and POLν (POLN) participate in repairing DNA breaks/lesions through translesion DNA synthesis (TLS). Dysregulations in DNA replication or TLS pathways, stemming from mutations, modifications, or expression changes can drive tumorigenesis and influence treatment responses, as demonstrated in numerous studies [2–5].
Alterations in DNA polymerases can promote carcinogenesis through various mechanisms, such as DNA damage accumulation, genomic instability, and immune abnormalities. DNA Damage Response (DDR) pathways contain BER (Base Excision Repair), TLS (Translesion DNA Synthesis), NHEJ (Nonhomologous End-joining), NER (Nucleotide Excision Repair), MMR (Mismatch Repair), HR (Homologous Recombination), FA (Fanconi Anemia Pathway), and CPF (Check Point Factors). Specifically, POLE and PLOD1 contribute to DNA replication, NER, and MMR. POLB, POLI, and POLL undertake BER functions, while POLM is potentially involved in end-joining processes [1]. Notably, the impacts of deleterious variants in POLE and POLD1 on MMR-related mutations or pathways appear to differ. POLE is responsible for synthesizing the leading strand, while POLD1 is tasked with the lagging strand synthesis during DNA replication, despite the high homology of their exonuclease regions [6].
Ubiquitination is a highly conserved post-synthesis process in mammals, categorized into three main types: monoubiquitination, multiubiquitination, and polyubiquitination. These modifications can result in protein degradation and signal transduction. Conversely, deubiquitinases (DUBs) reverse ubiquitination by removing ubiquitin chains, thereby halting the process and preserving substrate protein expression [7,8]. The interplay between ubiquitination and deubiquitination is indispensable for various biological activities [9,10]. However, the ubiquitination and deubiquitination patterns of these DNA polymerases across pan-cancer scenarios remain uncharted.
Pathogenic variants in DNA polymerases frequently lead to abnormal protein expression. For instance, Darwiche et al. observed elevated POLA1 levels in colorectal cancer tumors compared to normal tissues and suggested that POLA1 mutations may be linked to drug resistance [11]. Low POLB expression was correlated with poor survival in oral squamous cell cancer, exerting its influence by silencing cell cycles and enhancing cell proliferation, as validated in vitro [12]. Frequent POLB overexpression was also noted in colorectal cancer, esophageal carcinoma, and lung carcinoma, underscoring its association with tumorigenesis [13–15]. Low expression of POLG was reported to correlate with worse overall survival (OS) and progression-free survival (PFS) in gastric cancer [16], while POLD1 mutations and expression status have been implicated in carcinogenesis and treatment response [17]. Additionally, the expression of TLS-related polymerases, including POLH, POLQ, POLK, and REV1, were found to decrease in myelodysplastic syndrome [18]. Furthermore, theoretical evidence suggests that the deletion or mutation of DNA polymerases can induce genomic instability and the accumulation of neoantigens, ultimately contributing to a high tumor mutational load. Recent studies have demonstrated that DNA polymerases play a crucial role in the tumor immune microenvironment, with implications for the development of cancer immunotherapies, including POLE, POLD1, and POLH [19–21]. Nevertheless, further research is essential to comprehensively grasp the potential clinical impact of DNA polymerases in tumorigenesis and their role in the development of anti-cancer treatments.
This study aimed to assess the prognostic significance of fifteen DNA polymerases (POLYs) across 32 cancer types using The Cancer Genome Atlas (TCGA). Additionally, we summarized their variation frequency and subtypes in each cancer type. We examined the association between POLY expression and the tumor microenvironment (TME) through the Gene Set Cancer Analysis (GSCA) database and explored the links between POLY expression levels, drug sensitivity, and DDR pathways in a pan-cancer context. To gain deeper insights into the role of POLYs, we constructed a ubiquitination network based on the UbiBrowser database. Our comprehensive analysis of DNA polymerases in pan-cancer aims to facilitate the identification of POLYs as potential therapeutic targets.
The expression profiles of POLYs were scrutinized using the TIMER web server (https://cistrome.shinyapps.io/timer/), a comprehensive resource for exploring expression and immune cell distributions across more than 30 cancer types [22]. The “DiffExp” module within TIMER was deployed to scrutinize the differential expression of the 15 DNA polymerases (POLYs) in tumor tissues compared to their corresponding normal counterparts across all TCGA tumors. Gene expression level distributions were represented using box plots, and the statistical significance of differential expression was assessed using the Wilcoxon test.
Prognostic analysis of POLYs and their pan-cancer clinical correlations
To elucidate the intricate relationships among gene expression, genetic alternations, and prognostic implications in various cancers, we harnessed the TCGA PanCancer dataset and acquired TPM values from the GDC Data Portal (https://gdc.cancer.gov/access-data/gdc-data-portal) and genetic alternations from published resources (https://gdc.cancer.gov/about-data/publications/panimmune). Simultaneously, we collected corresponding clinical data (https://gdc.cancer.gov/about-data/publications/pancanatlas). The prognostic analysis of POLYs was conducted concerning overall survival (OS) and expression/alteration groups using the Kaplan-Meier method. The correlations between expression and clinical information including age, gender, and stage were also assessed using the Wilcoxon test.
Somatic variants of POLYs were explored using the cBio Cancer Genomics Portal (cBioPortal) (http://www.cbioportal.org), which provides a web resource for exploring, visualizing, and analyzing multi-dimensional cancer genomic data [23,24]. The alteration frequency and types of POLYs were investigated using the TCGA PanCancer Atlas Studies, encompassing 10,967 samples across 32 cancer types. A comprehensive summary for each POLY type was visually represented through a heatmap generated with the ggplot2 package [25].
Correlation analysis of POLYs with the tumor microenvironment and drug sensitivity
We embarked on an exploration of the connections between POLY expression and tumor environment infiltrations by leveraging the Gene Set Cancer Analysis (GSCA, http://bioinfo.life.hust.edu.cn/GSCA/#/). GSCA integrates over 10,000 multi-dimensional genomic data from TCGA and over 750 small molecule drugs from the Genomics of Drug Sensitivity in Cancer (GDSC) and Cancer Therapeutics Response Portal (CTRP) [26]. Additionally, we scrutinized the drug sensitivity of the 15 POLYs by assessing the association between expression levels and drug response.
Ubiquitin/deubiquitylation and POLYs interaction network
UbiBrowser is a comprehensive database for predicting known and novel ubiquitin ligase (E3)/deubiquitinase (DUB)-substrate interactions in eukaryotic species [27]. Version 2.0 were employed to analyze E3/DUB-POLYs interactions [28]. Networks were constructed using Cytoscape v3.9.1, integrating both known and predicted interactions with a confidence score exceeding 20 as a cutoff [29].
The normal human bronchial epithelial cell line BEAS-2B, two individual LUAD cell lines (A549 and HCC827), the normal human esophageal epithelial cell line HEEC, two ESCA cell lines (EC109 and HYSE-30), the normal human gastric epithelial cell line GES-1, and two human STAD cell lines (HGC-27 and AGS) were purchased from Procell (Wuhan Procell Life Science and Technology Co., Ltd., Wuhan, Hubei, China). All cell lines were cultured in complete medium (containing 10% fetal bovine serum) at 37°C in a 5% CO2 incubator. To passage the cells, they were detached with 0.25% trypsin digestion every 2–3 days.
Semi-quantitative reverse transcription polymerase chain reaction (RT-PCR)
Total RNA was extracted from the cultured cells using TRIzol® reagent (Invitrogen; Thermo Fisher Scientific, Inc., Waltham, MA, USA). Then, 1 μg of total RNA was reverse transcribed into cDNA using M-MLV reverse transcriptase (Invitrogen, Thermo Fisher Scientific, Inc., Waltham, MA, USA). SYBR Premix Ex Taq (TaKaRa Biotechnology, Tokyo, Japan) was used to quantify the mRNA expression of POLD1, POLE and POLQ. Glyceraldehyde-3-phosphate dehydrogenase (GAPDH) was used as an internal reference. The primer sequences were as follows: POLD1(NM_001256849) forward: 5′-CAGTGCCAAGGTGGTGTATGG-3′, reverse: 5′-CTTGCTGATAAGCAGGTATGGG-3′; POLE(NM_006231) forward: 5′-TTGCGACCAGAAAGGGTTGT-3′, reverse: 5′-TGATTTGGCAAGTCCAGATCCT-3′; POLQ(NM_199420) forward: 5′-CTGCGTCGGAGTGGGAAAC-3′, reverse: 5′-CTGTAGGCTTGCATTCTCCTG-3′; GAPDH forward: 5′-GCACCGTCAAGCTGAGAAC-3′, reverse: 5′-TGGTGAAGACGCCAGTGGA-3′. The 2−ΔΔCt method was used to calculate the relative expression levels of the detected genes.
A prognostic analysis of POLYs and their relevance to clinical characteristics in pan-cancer was executed. The prognostic analysis of POLYs relies on the Kaplan-Meier method, considering overall survival (OS) and expression/alteration groups. The expression group was divided into ‘high’ and ‘low’ groups based on the median TPM value from tumor samples. The alteration groups were categorized as ‘altered’ and ‘wild’ based on the alteration status of POLYs. The correlations between expression and clinical parameters such as age, gender, and stage, were investigated using the Wilcoxon test by comparing the expression values between different groups (e.g., male vs. female). Survival analysis was carried out using the Kaplan-Meier method, and comparisons were made using the unstratified log-rank test. The Wilcoxon test was used for inter-group data comparisons. All statistical analyses and data visualization were performed using R software version v4.0.3, with the following R packages utilized: ggplot2 v3.4.1, survival v3.4, and survminer v0.4.9. Statistical significance was considered at a p-value < 0.05.
Expressions of POLYs in pan-cancer
To unveil the potential contributions of POLYs in cancer, we analyzed the expression levels of 15 different POLYs using gene expression data from TIMER across 17 cancer types (abbreviations listed in Suppl. Table S1). Our results, shown in Fig. 1, demonstrated that 14 POLYs exhibited significantly different expression levels between tumor and normal samples in most cancer types, with the exception of DNTT (with a median TPM of 0 in most cancers, as depicted in Suppl. Fig. S1). For instance, higher expression levels of POLA1 were observed in BRCA (Breast invasive carcinoma), CHOL (Cholangiocarcinoma), COAD (Colon adenocarcinoma), ESCA (Esophageal carcinoma), HNSC (Head and Neck squamous cell carcinoma), LIHC (Liver hepatocellular carcinoma), LUAD (Lung adenocarcinoma), LUSC (Lung squamous cell carcinoma), READ (Rectum adenocarcinoma), and STAD (Stomach adenocarcinoma) tumor samples, whereas lower expression levels were observed in those of KIRP (Kidney renal papillary cell carcinoma), PRAD (Prostate adenocarcinoma), THCA (Thyroid carcinoma) and UCEC (Uterine Corpus Endometrial Carcinoma) (Fig. 1A). POLD1 and POLE showed higher expression in almost all cancers except for KICH (Kidney Chromophobe) without significance (Figs. 1B, 1C). POLG showcased greater expression in CHOL, ESCA, HNSC, KICH, KIRC (Kidney renal clear cell carcinoma), LIHC, LUSC, PRAD, and STAD, while its expression was comparatively lower in THCA and UCEC (Fig. 1D). Similarly, POLB exhibited higher expressions in BLCA (Bladder Urothelial Carcinoma), BRCA, CHOL, COAD, ESCA, LIHC, LUAD, LUSC, PRAD, READ, STAD and UCEC, but lower expressions were observed in KIRC, THCA, and KICH (Fig. 1E). POLL showed heightened expression in CHOL, COAD, HNSC, KIRC, KIRP, LIHC, LUAD, PRAD, and READ (Fig. 1F), while POLM displayed elevated expression in most cancer types except for KICH and THCA (Fig. 1G). Lower expressions of both REV3L and REV1 were detected in BLCA, BRCA, KICH, THCA, and UCEC (Figs. 1H, 1I), whereas POLH exhibited higher expression in BRCA, CHOL, COAD, ESCA, KIRC, KIRP, LIHC, and STAD, with lower expression in KICH and PRAD (Fig. 1J). Furthermore, POLI and POLK displayed heightened expressions in CHOL, HNSC, LIHC, STAD, and CHOL, HNSC, LIHC, and STAD, respectively (Figs. 1K, 1L). Most notably, POLQ was found to be highly expressed in all cancers (Fig. 1M). We also observed higher expression of POLN in CHOL, COAD, LIHC, LUAD, PRAD, READ, and STAD, whereas lower expression was detected in BRCA, HNSC, KICH, KIRC, and KIRP (Fig. 1N). Overall, these findings suggest that POLYs may play different roles in cancer development.
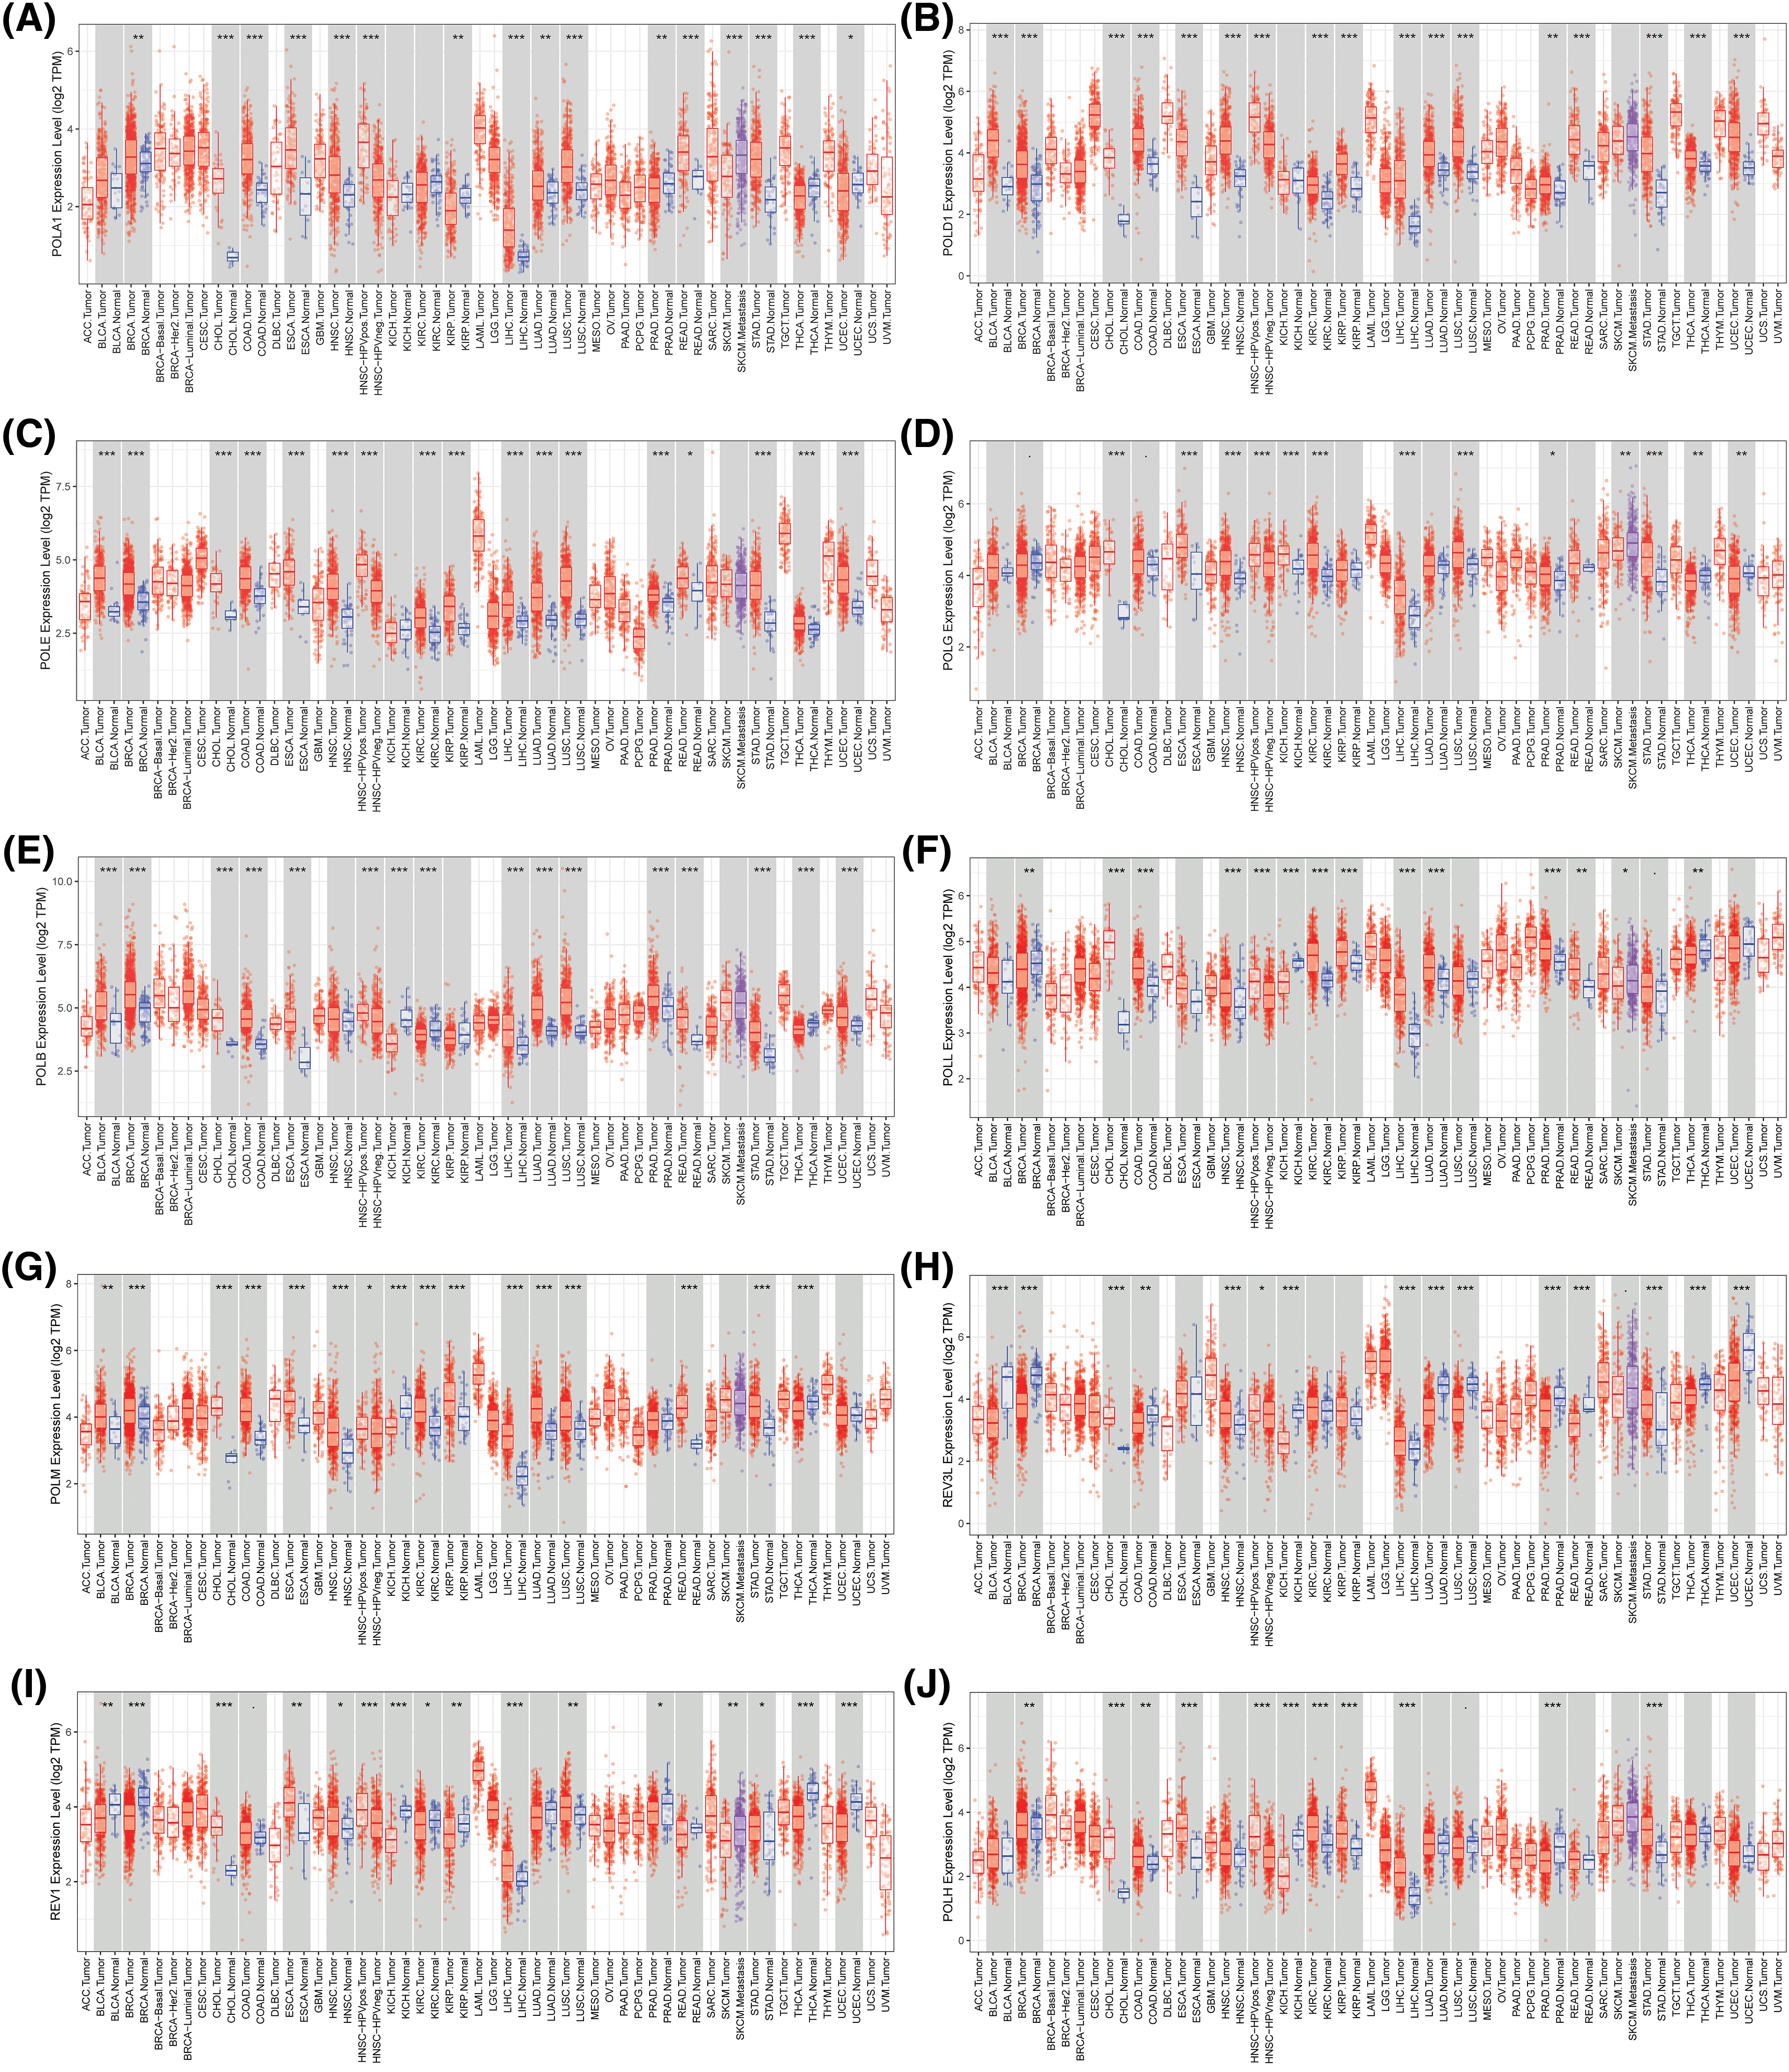

Figure 1: Differential gene profiles of 15 POLYs except DNTT between tumor and normal samples (A–N). Blue boxplots indicate the expression level in normal tissues. The red boxplots indicate the expression level in cancer tissues (*p-value < 0.05; **p-value < 0.01; ***p-value < 0.001).
The association between clinical characteristics, tumor subtypes, and POLY expression
To explore the clinical relevance of POLYs, we assessed their gene expression levels in relation to age, gender, and cancer stage. We categorized all of the cancer types into two groups based on staging, with one group representing early tumor stages (I–II) and the other encompassing later tumor stages (III–IV). Our analysis revealed varying levels of DNA polymerase expression across different cancer stages. Notably, 15 genes exhibited significantly higher expressions in later tumor stages (III–IV) across most cancer types (as detailed in Suppl. Table S2). Conversely, some genes displayed higher expressions in early stages (I–II) in specific cancers. For example, POLB, REV1, REV3L, POLK, and POLI in THCA (Fig. 2A). Additionally, POLQ and POLD1 showed higher expressions in later tumor stages (III–IV) of LUAD (Fig. 2B), while POLL also showed higher expressions in later tumor stages (III–IV) of HNSC (Fig. 2C). Furthermore, our analysis found that 15 genes displayed higher expression in females compared to males in most cancers (Suppl. Table S2), with the exception of POLL and POLM in THCA, POLB in COAD, and POLE in BRCA (Fig. 2D).
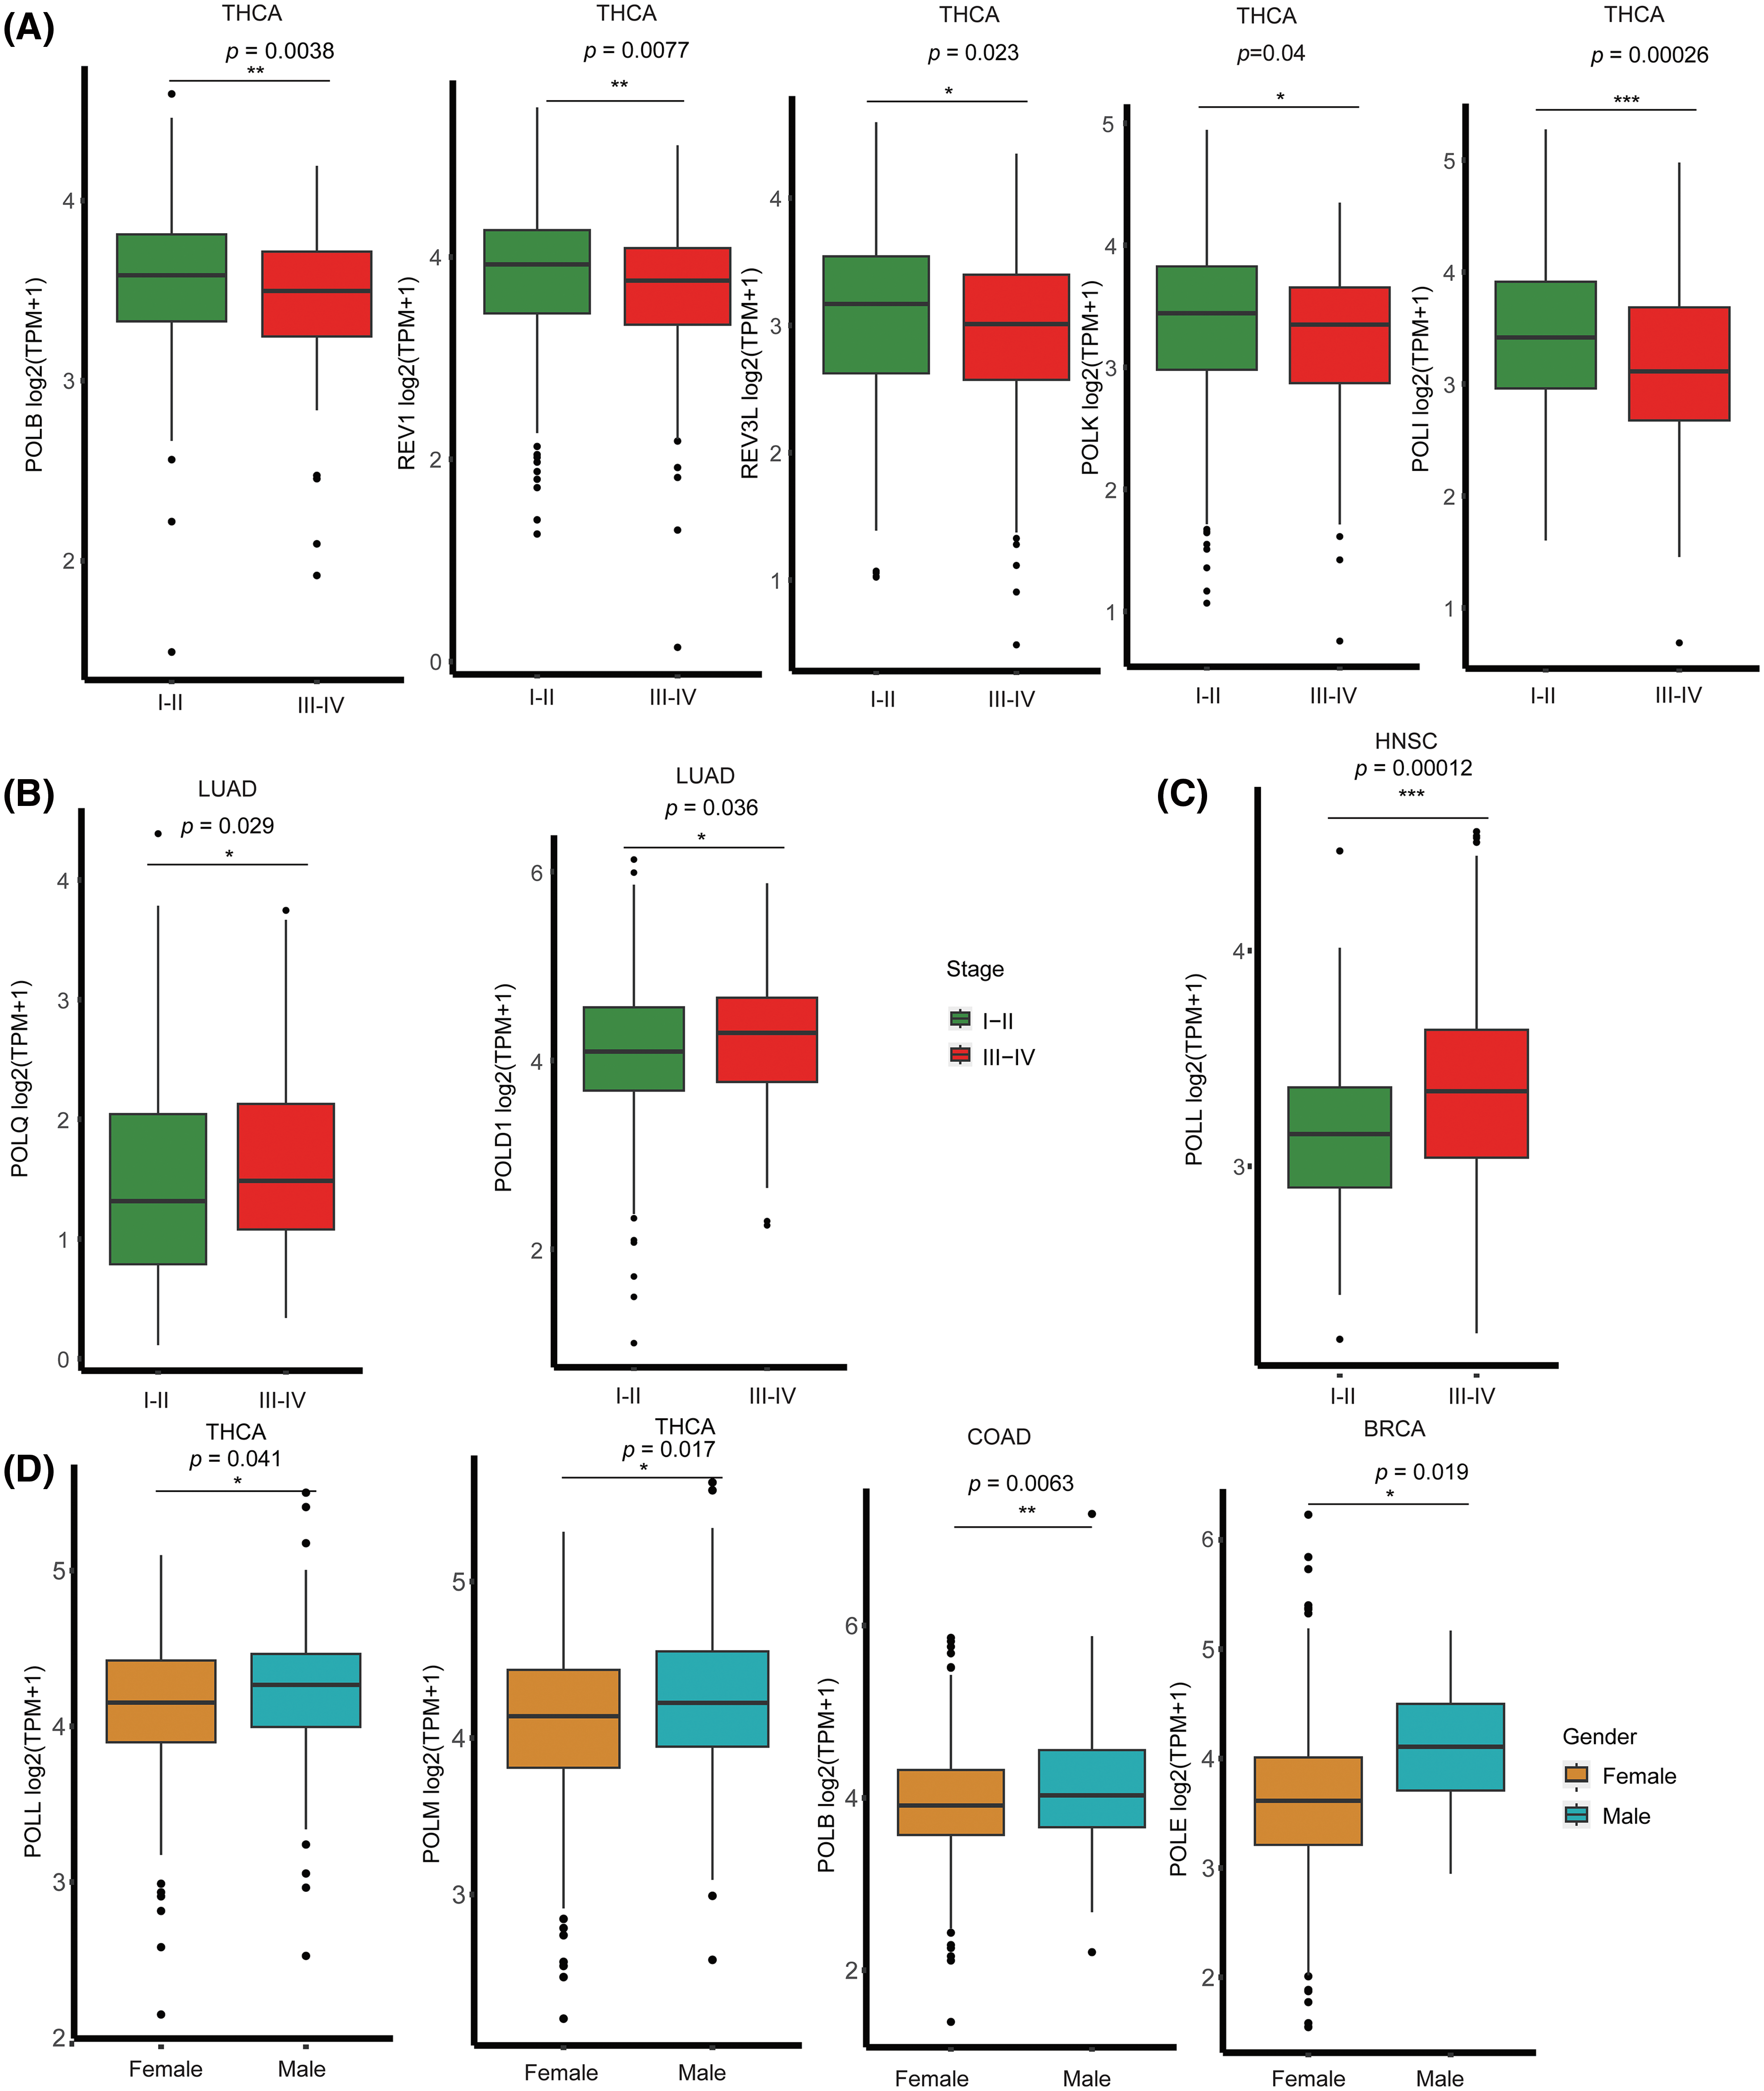
Figure 2: The associations between expression levels of DNA Polymerases and clinical characteristics. (A) Higher expression of POLB, REV1, REV3L, POLK, and POLI was observed in the early stages (I and II) of THCA. (B) Higher expression of POLQ and POLD1 was noted in the later stages (III and IV) of LUAD. (C) Higher expression of POLL was detected in the later stages (III and IV) of HNSC. (D) Higher expressions were found in males, specifically, POLL and POLM in THCA, POLB in COAD, and POLE in BRCA. Statistical significance was indicated using red asterisks. ***p-value < 0.001; **p-value < 0.01; *p-value < 0.05.
Prognostic value of POLYs expression in pan-cancer
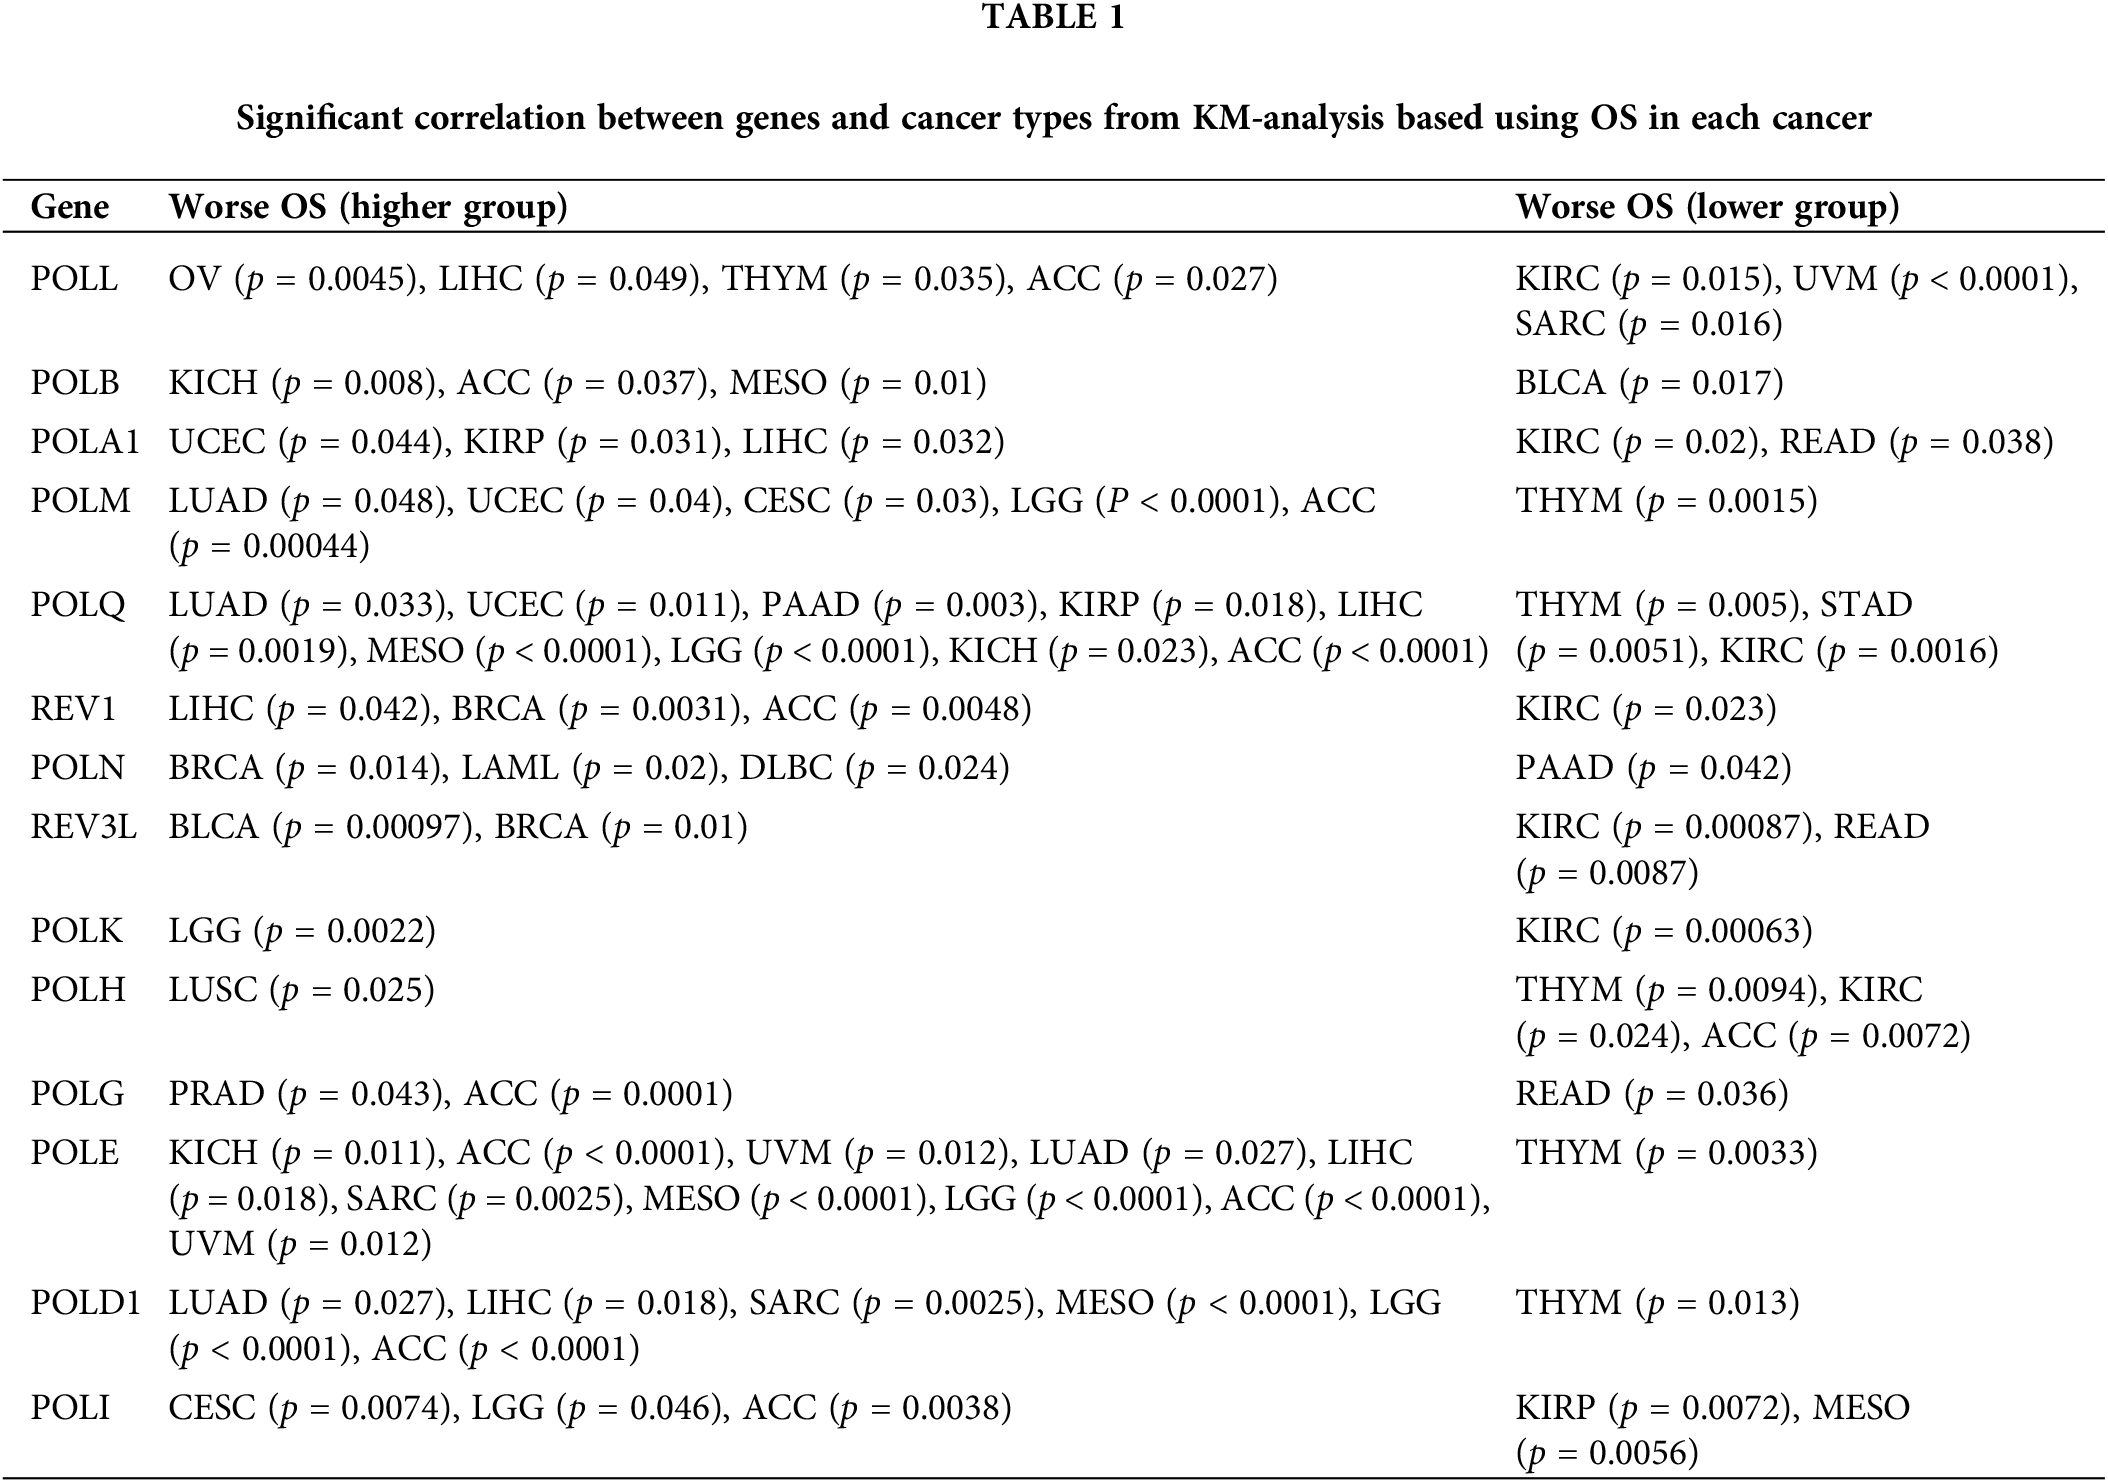
To explore the prognostic value of POLYs, we evaluated the relationship between POLYs expression and overall survival time (OS) using Kaplan-Meier survival curves. Our analysis encompassed 14 genes (excluding DNTT, with a median TPM of 0) and their respective levels of significance across various cancer types (as detailed in Table 1). Notably, POLQ and POLG exhibited significant prognostic value in over ten cancer types. In KIRC, Low expression of POLL, POLA1, POLQ, REV1, REV3L, POLK, and POLH correlated with improved survival. Conversely, in ACC (Adrenocortical carcinoma), higher expression of POLL, POLB, POLM, POLQ, REV1, POLG, POLE, POLD1, and POLI was linked to extended survival. However, high POLH expression was associated with worse survival in ACC. Furthermore, high POLN expression was associated with improved survival in BRCA, LAML, and DLBC but with worse survival in PAAD.
We further investigated the prognostic risk of these 14 genes using Cox analysis. As depicted in Fig. 3, these genes acted as a protective factor in most cancers. For instance, lower REV3L expressions were found to be a protective factor in BLCA and BRCA. High POLD1 expression was associated with worse survival in LUAD, LIHC, SARC, MESO (Mesothelioma), LGG (Brain Lower Grade Glioma), and ACC. Furthermore, POLE functioned as a low-risk factor in KIRP, LIHC, SARC, MESO, SKCM (Skin Cutaneous Melanoma), LGG, ACC, and UVM (Uveal Melanoma), while POLL represented a high-risk factor in SARC, KIRC, LGG, and UVM. Finally, high POLA1 expression was linked to improved prognosis in KIRC and READ, whereas low expression levels of POLQ, POLE, and POLH were associated with high risks in THYM (Thymoma) with HR > 8. Overall, our findings suggest that POLYs have significant prognostic value across diverse cancer types.
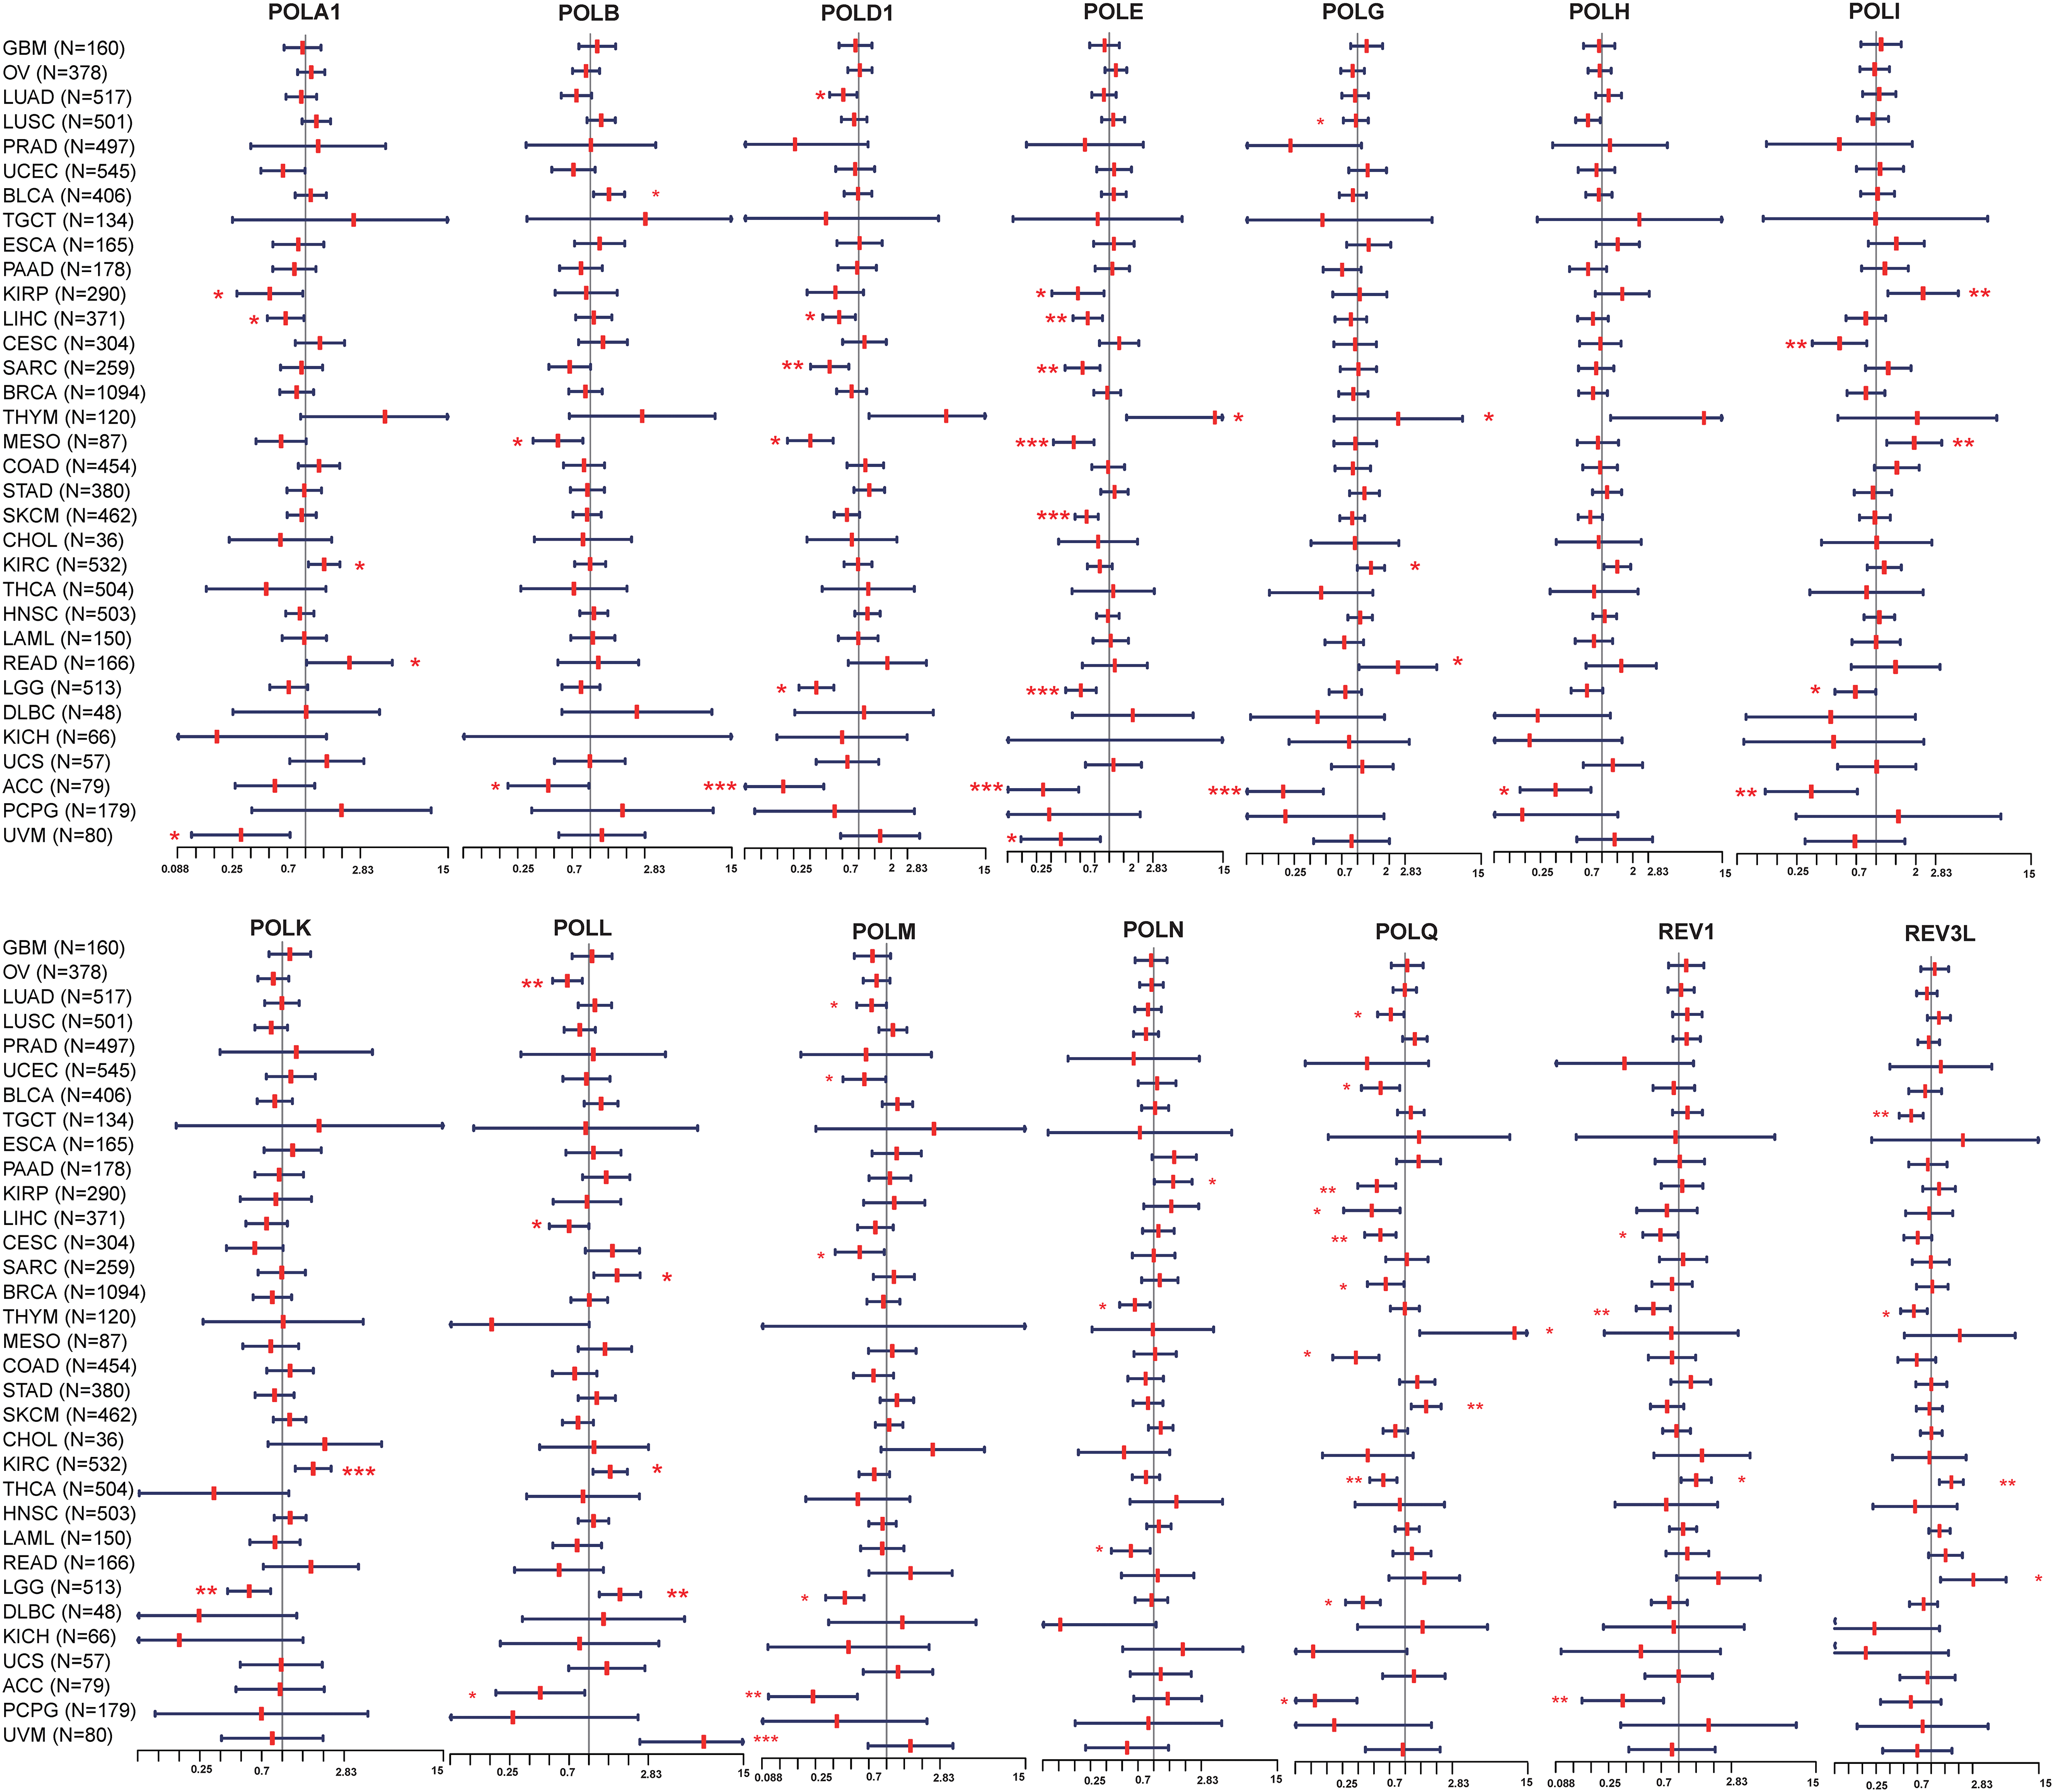
Figure 3: Forest plot for 14 genes in each cancer. Statistical significance is indicated using red asterisks. ***p-value < 0.001; **p-value < 0.01; *p-value < 0.05.
Genetic alterations of POLYs, prognostic value and association with expression in pan-cancer
To investigate the variation of POLYs across different cancer types, we leveraged the TCGA PanCancer Atlas cohort, encompassing 10,953 patients, through cBioPortal. Among the POLYs, REV3L, POLQ, POLB, and POLE were the most frequently mutated genes, with a frequency exceeding 4%. In contrast, POLL, POLM, and DNTT showed the lowest variation frequency, below 1.5% (Fig. 4A). Subsequent analysis revealed that mutations in these 15 genes were predominantly observed in SKCM, STAD, and UCEC, with POLQ, REV3L, and POLE being the top three (Fig. 4B). Notably, REV3L showed the highest deep deletion frequency in DLBC, PRAD, and UVM (Fig. 4C), whereas POLB and POLH demonstrated the highest amplification frequency in most cancers, particularly in ESCA and OV (Fig. 4D). Furthermore, we explored the correlation between gene alternation and OS, and found that patients carrying alternations in any POLYs exhibited poorer survival outcomes in all cancers (Fig. 4E), particularly in BLCA, KIRC, ACC, and PCPG (Suppl. Fig. S2A). Moreover, we found that POLM alternations made a significant contribution to OS (Fig. 4F). Furthermore, we assessed the expression levels of the 15 genes in correlation with their respective variation status. Significant differences were observed in ten genes, including POLD1, POLE, POLG, POLB, POLM, DNTT, POLH, POLI, POLK, and POLQ (Suppl. Fig. S2B) when comparing the expressions between their altered subgroup and wildtype group. In summary, the findings highlight the significant variability of POLY alterations across different cancer types, with alterations in specific POLYs influencing their respective gene expressions.
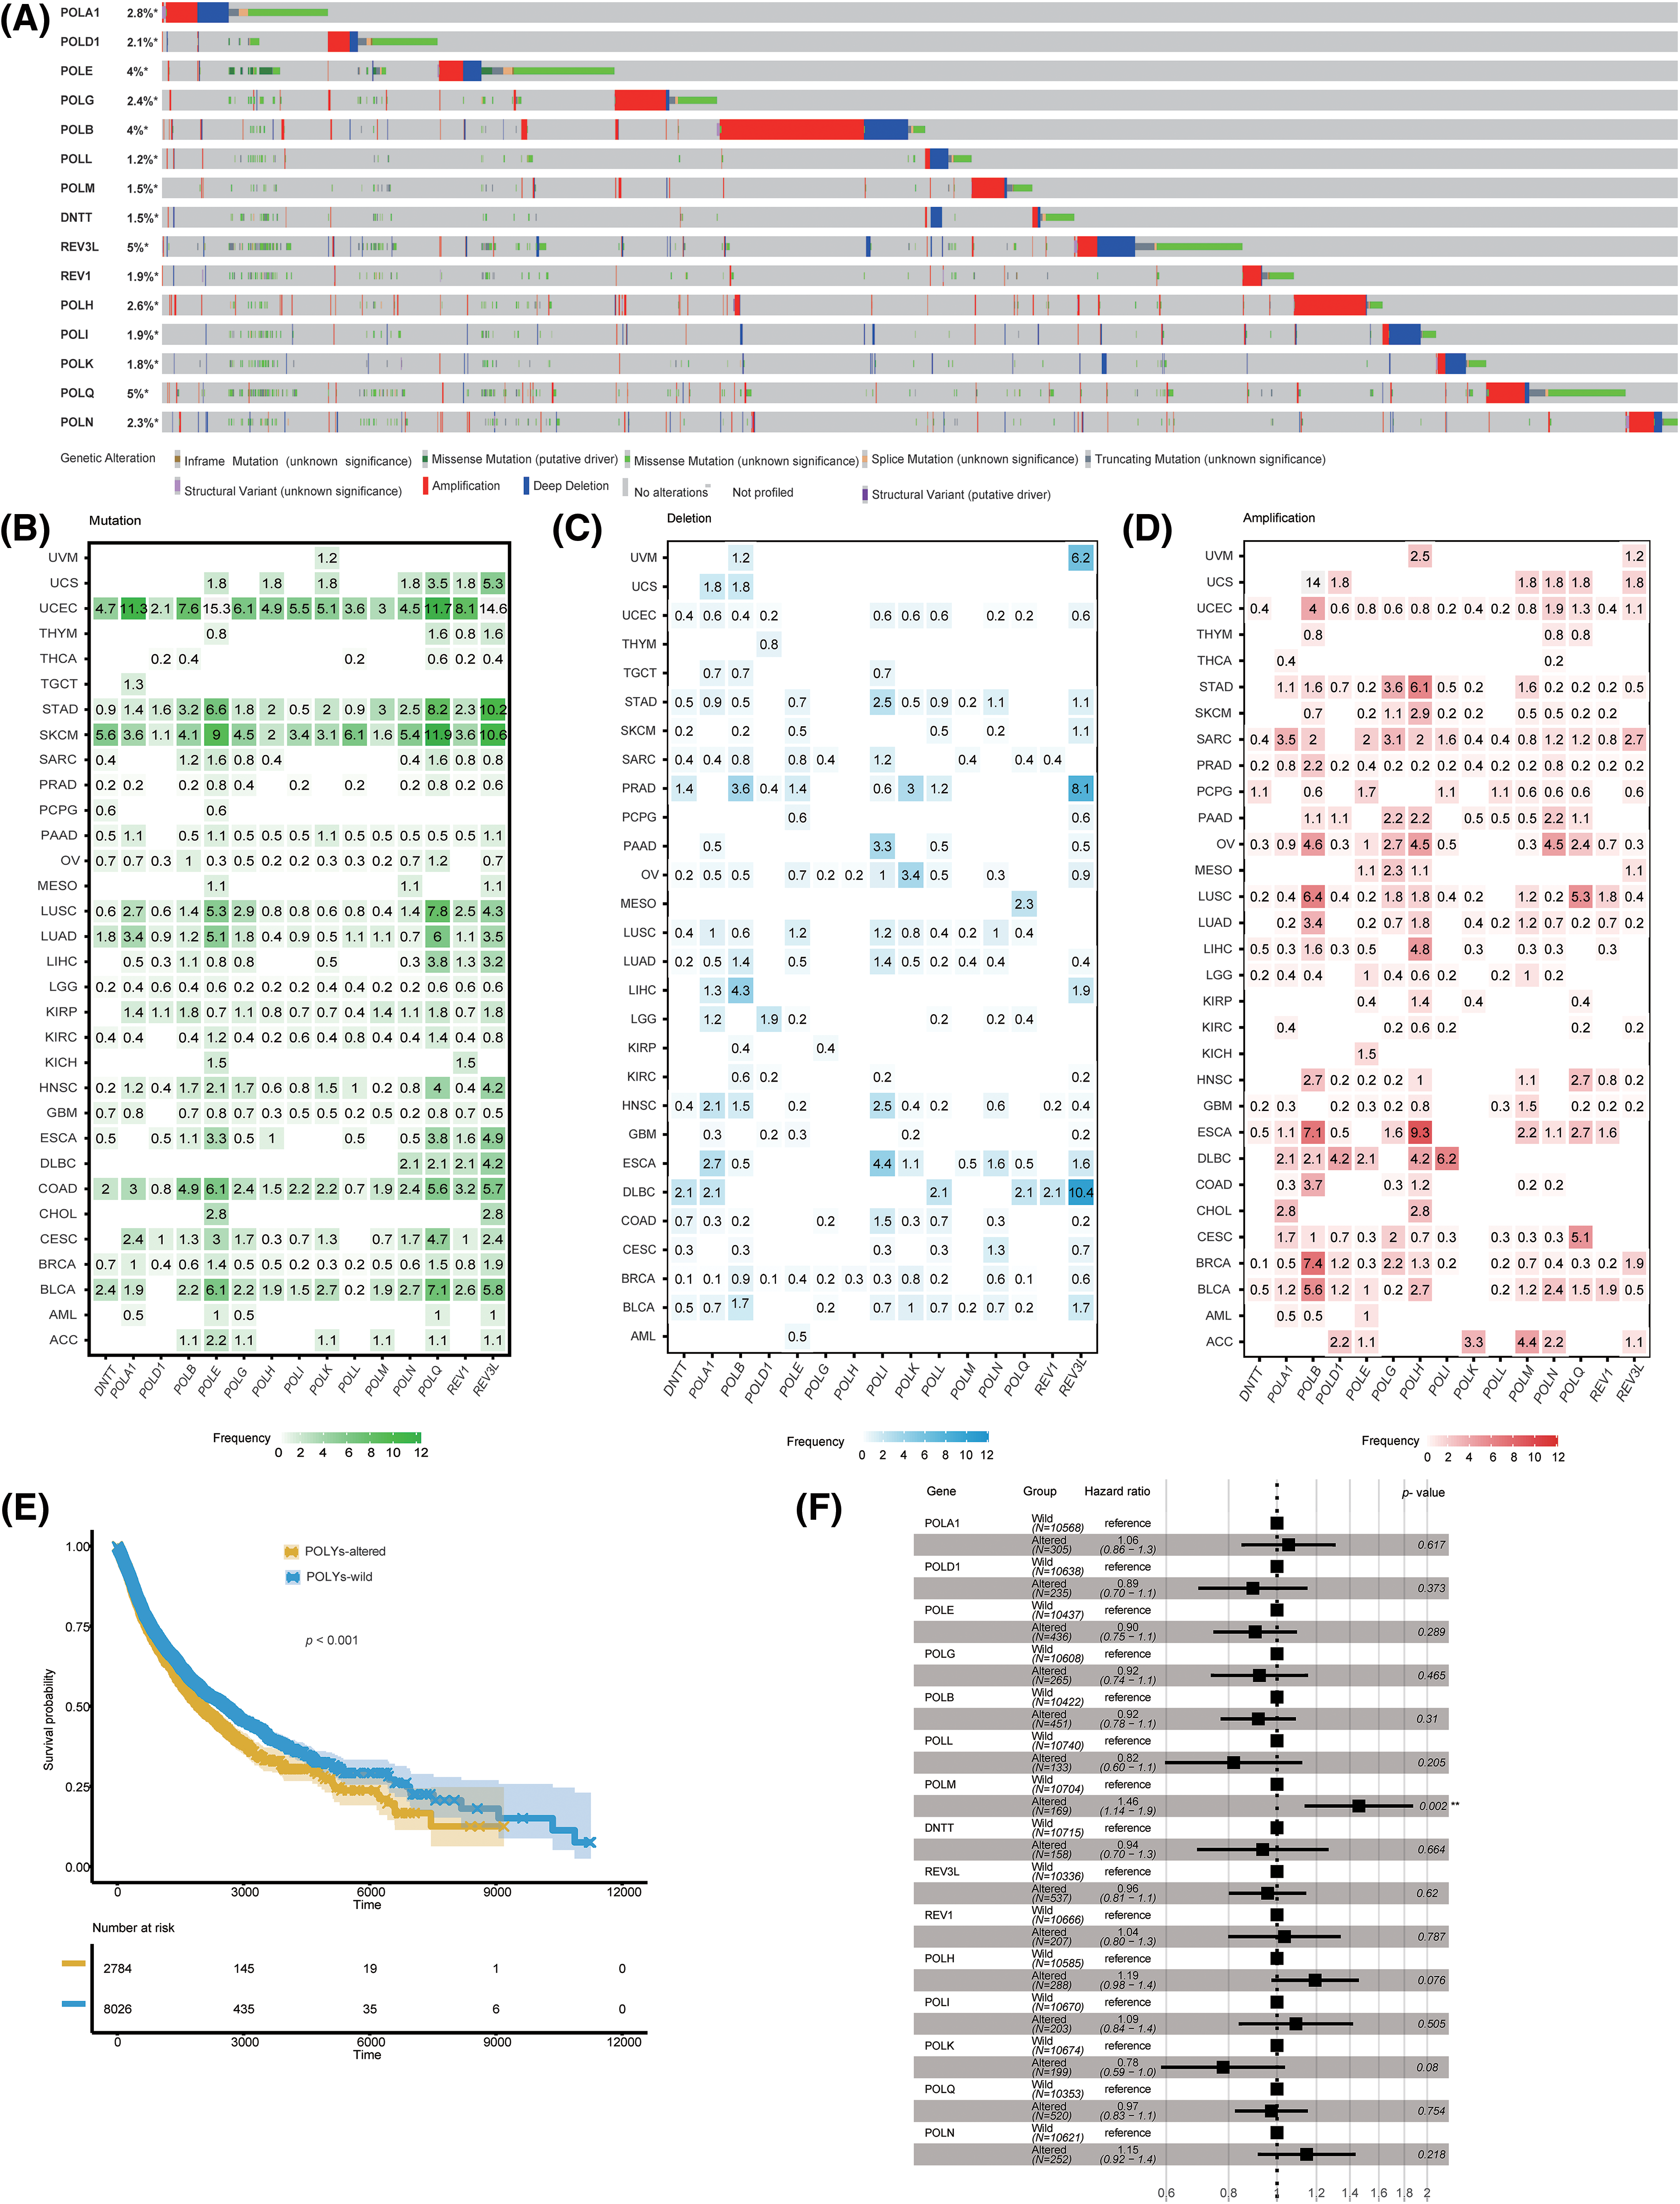
Figure 4: Variation summary of POLYs in pan-cancer. (A) Oncoprint representing the occurrence of each gene. (B) Mutation frequency for genes in each cancer type. (C) Deep deletion frequency for genes in each cancer type. (D) Amplification frequency for genes in each cancer type. (E) Kaplan-Meier survival curves illustrating the association between gene alterations in POLYs and OS across all cancer types. (F) Univariate analyses of the association between POLYs and progression-free survival. OS, overall survival.
Association between POLYs expression and the tumor microenvironment in pan-cancer
The pivotal of the TME in cancer progression, prognosis, and treatment is widely acknowledged [30,31]. In this study, we explored the relationship between POLY expression and immune infiltration, encompassing 18 T-cell subtypes and six other immune cells, including B cells, NK cells, monocytes, macrophages, neutrophils, and DC cells (Suppl. Table S3). Our analysis revealed significant correlations between 15 POLY members and immune cells across 30 cancer types (Suppl. Fig. S3). Specifically, we checked the correlations between POLYs and immune factors in ACC, KIRC, and THYM, which most genes have more prognostic prediction value. As shown in Fig. 5A, DNTT, POLA1, POLB, POLD1, POLE, POLG, POLM, and POLQ demonstrated a robust positive association with B cells (B cells), CD4_naive (CD4 naïve T cells), CD4_T (CD4 T cells), CD8_T (CD8 T cells), and Central_memory (Central memory cells) in THYM, while they exhibited a negative relationship with Gamma_delta (Gamma delta T cells), Neutrophils, NK cells, and macrophages. In contrast, POLL, REV1, and REV3L had strong negative relationships with CD8 T cells and B cells In THYM but a positive relationship with nTreg (Natural Tregs), NKT (Natural killer T cells), and monocytes. In the context of KIRC, the polymerases POLD1, POLE, POLG, POLH, POLL, POLM, and POLQ showed a positive correlation with CD8 T, Cytotoxic (cytotoxic T cell), Exhausted (exhausted T cell), iTreg (Induced regulatory T cell), infiltration score (Overall infiltration score of 24 immune cells), Th1 (T helper type 1), Tfh (T follicular helper cells), nTreg, and negative correlation with CD4_naïve, neutrophil, and Th17 (T helper type 17) (Fig. 5B). Notably, ACC displayed different correlations (Fig. 5C). These results collectively suggest that POLYs may play diverse roles in regulating the immune microenvironment in various cancers.
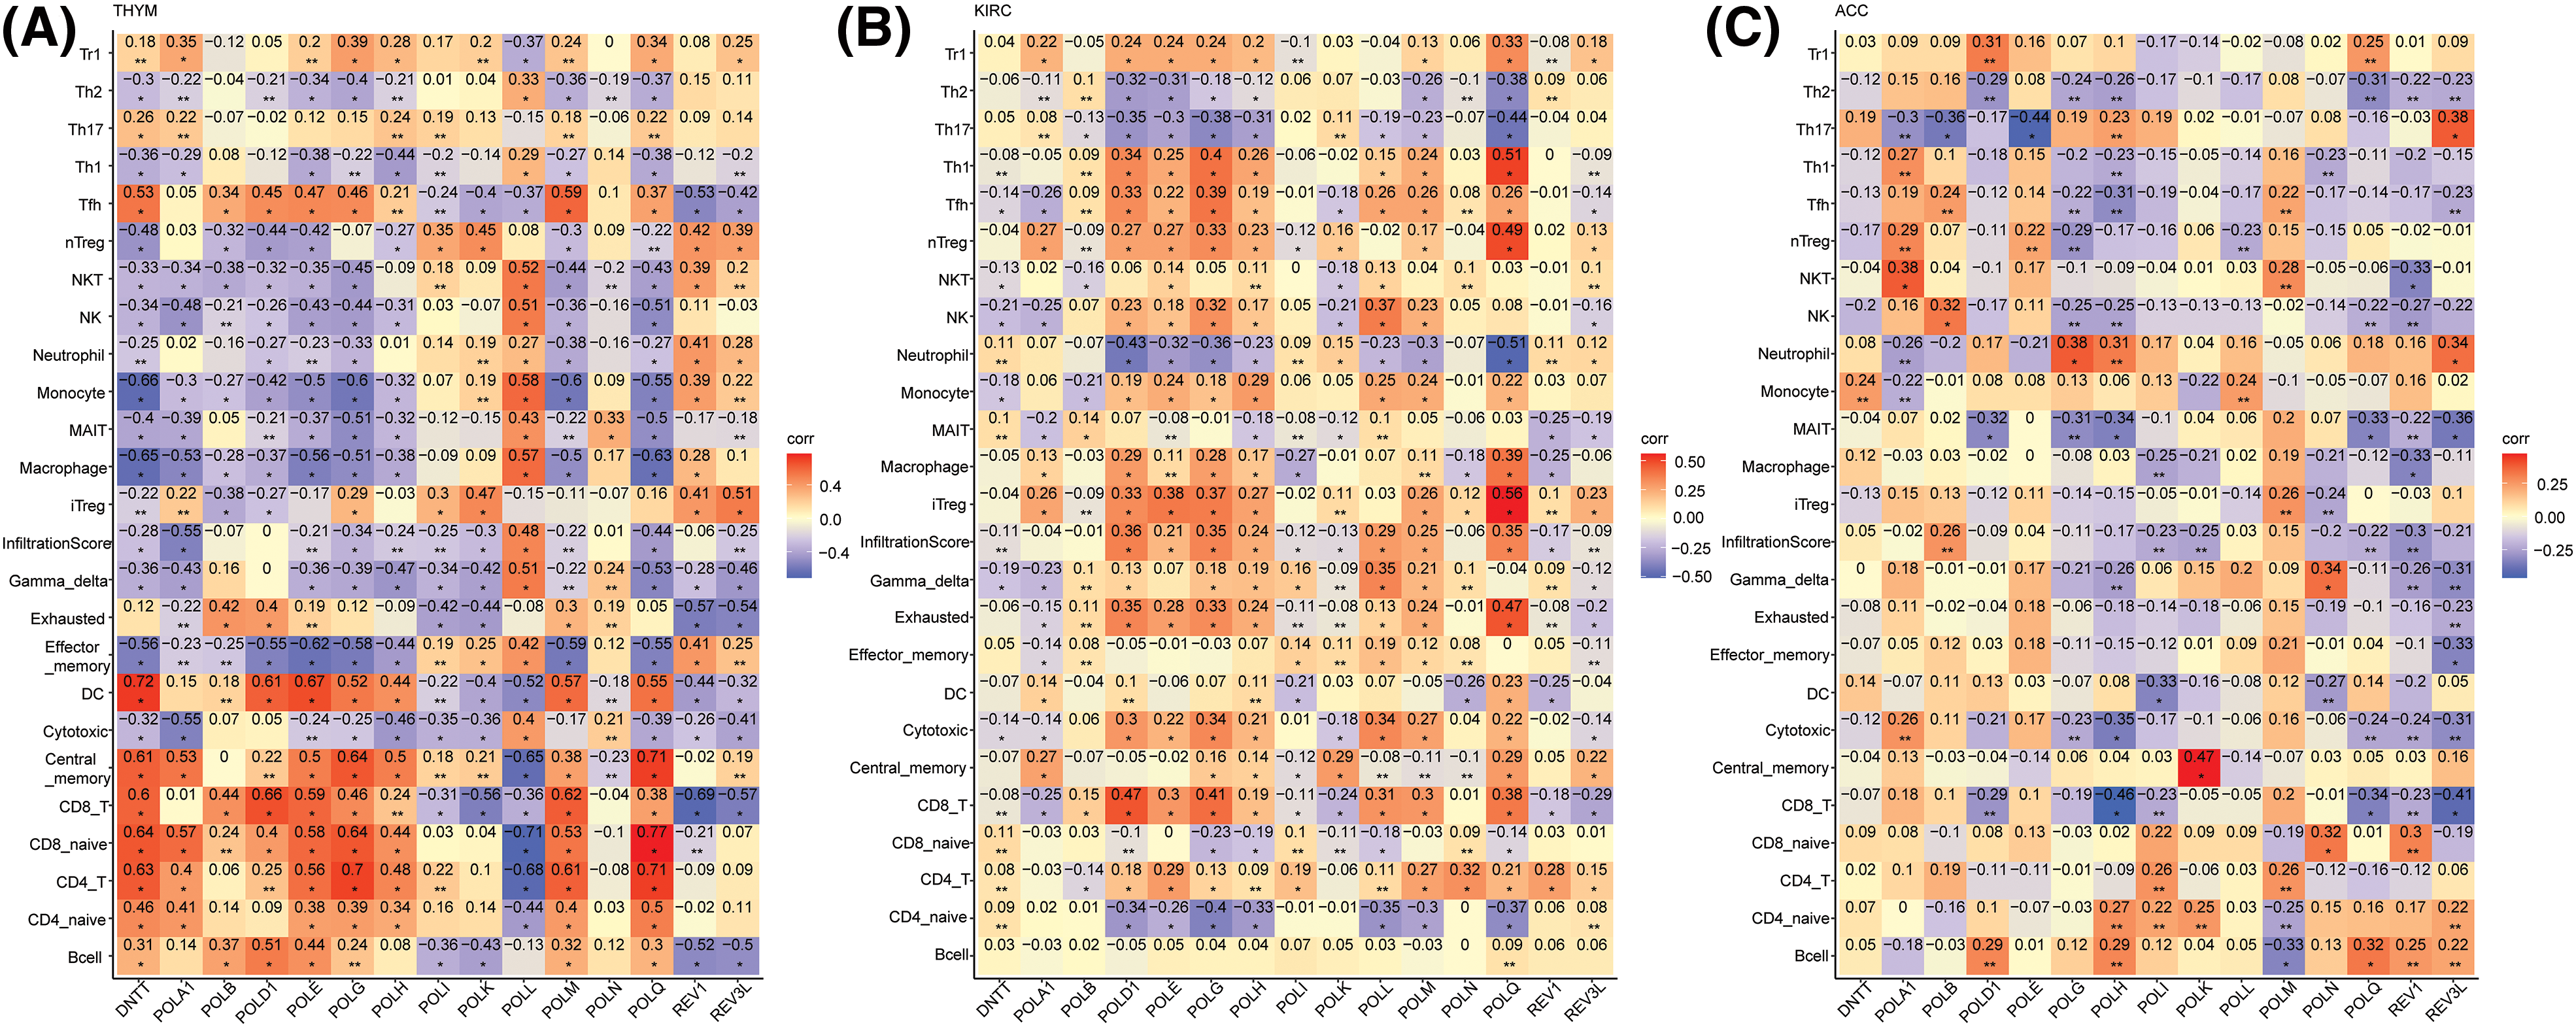
Figure 5: Association between 15 gene expression and tumor micro-environment in (A) THYM (B) KIRC and (C) ACC (Orange: positive correlation; Blue: negative correlation).
In addition, we examined the relationship between POLYs and immune subtypes as identified by Thorsson et al. [32]. As depicted in Fig. 6, the expression of POLYs exhibited a robust correlation with immune subtypes (C1-C6) across all cancer types. Our analysis revealed that POLA1, POLB, POLD1, POLE, POLG, and POLQ were significantly associated with immune subtype C1 (wound healing) and C2 (IFN-gamma dominant), while POLH, POLI, and POLK showed correlations with C3 (inflammatory). REV1 and REV3L were found to be closely related to C5 (immunological quiet) in pan-cancer. We also investigated the subtype differences based on 15 genes in each cancer type (Suppl. Fig. S4) and observed varying distributions in specific cancer types.
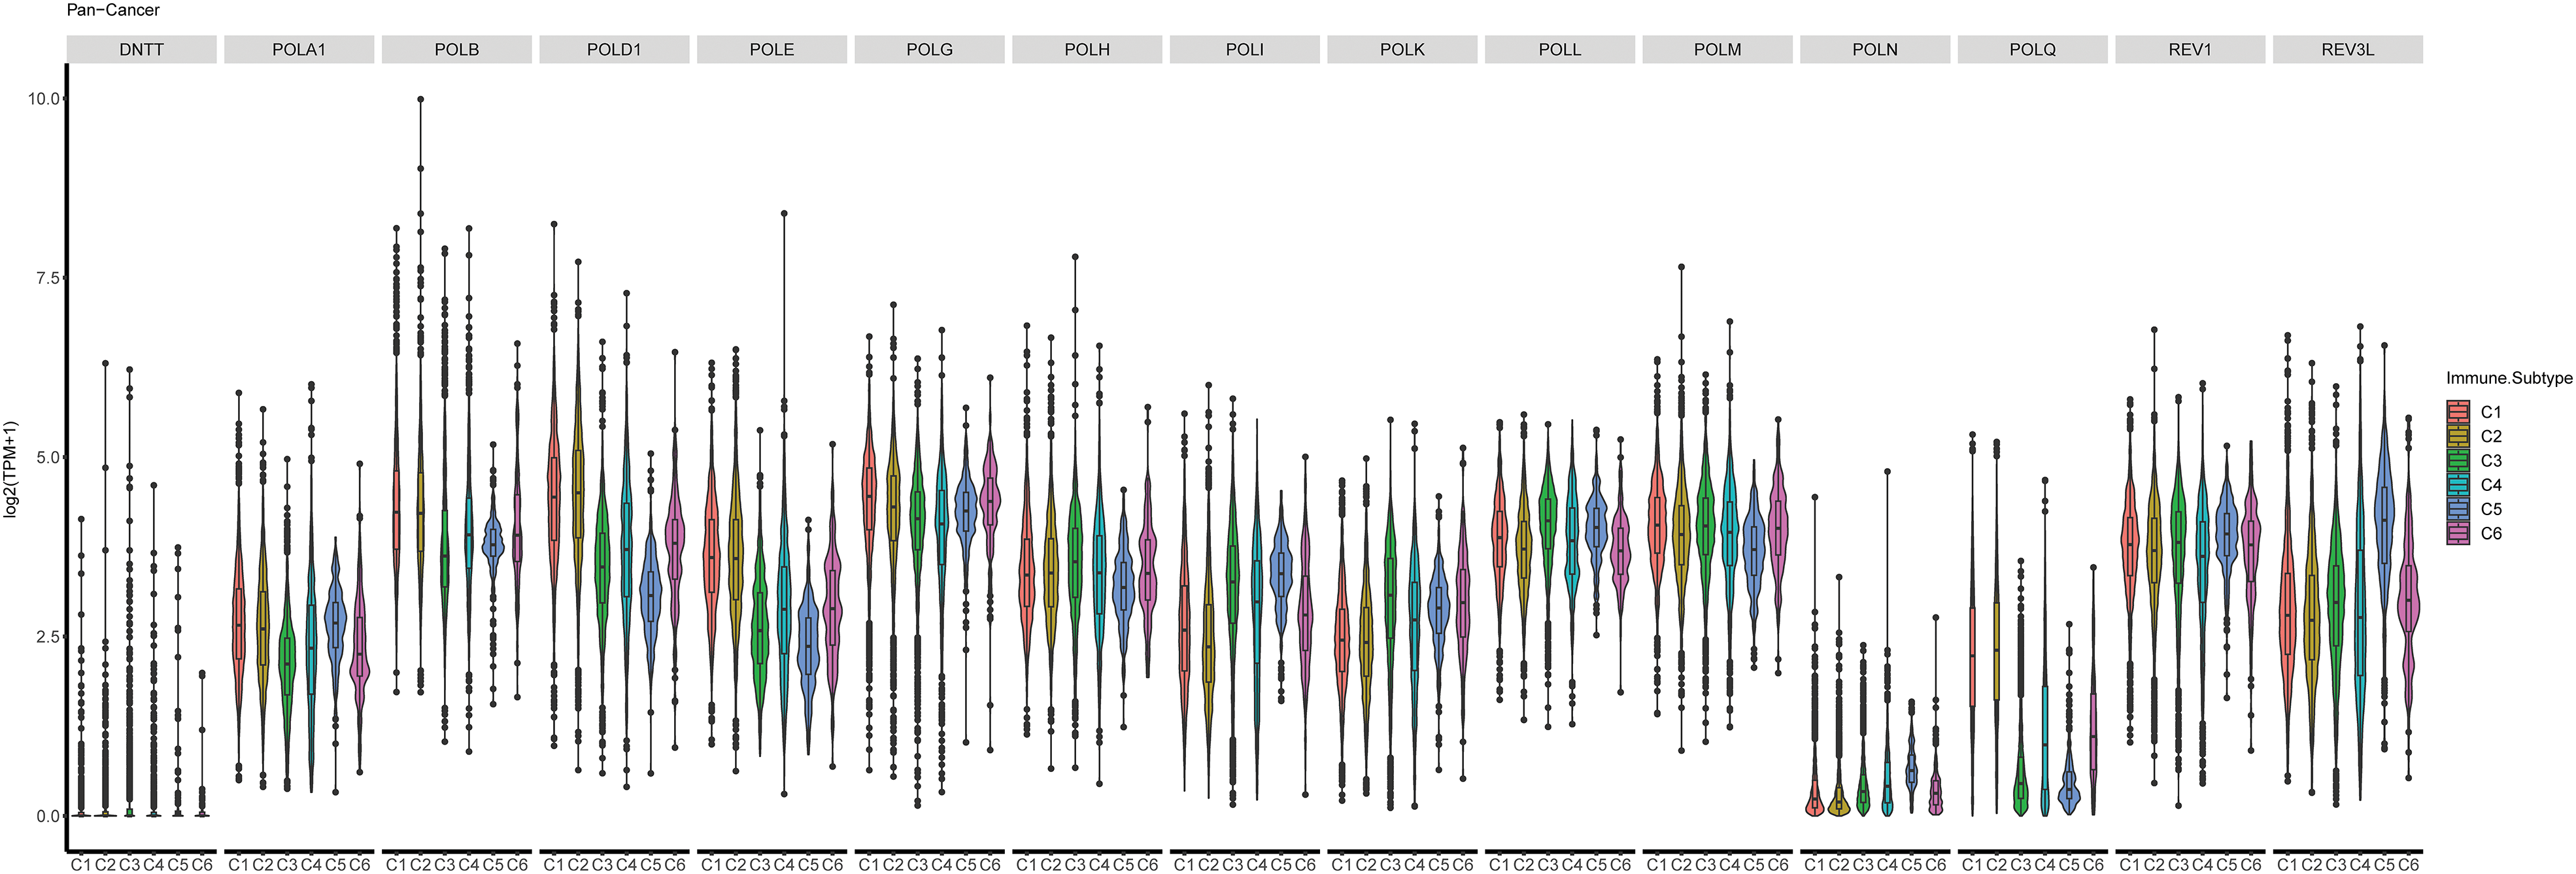
Figure 6: Correlation of 15 POLYs gene expression level and immune subtypes in pan-cancer. X axis represents the immune subtype. Y axis is the log2 (TPM+1) expression of each gene. C1: wound healing; C2: IFN-gamma dominant; C3: inflammatory; C4: lymphocyte depleted; C5: immunological quiet; C6: TGF-beta dominant.
Associating the expression of POLYs with DDR pathways
DDR pathways have a significant impact on cancer therapy [33,34]. To further comprehend the role of POLYs, we examined their relationship with DDR pathways. The genes associated with DDR pathways were sourced from Scarbrough et al. [35], obtained from MSigDB [36]. As shown in Suppl. Fig. S5, we observed that the expression of POLA1, POLB, POLD1, POLE, and POLG exhibited positive correlation with mutations in eight pathways, including BER (Base Excision Repair), TLS (Translesion DNA Synthesis), NHEJ (Nonhomologous End-joining), NER (Nucleotide Excision Repair), MMR (Mismatch Repair), HR (Homologous Recombination), FA (Fanconi Anemia Pathway), and CPF (Check Point Factors). Conversely, the expression of POLI, POLK, and POLL displayed a negative correlation with mutations in these six pathways. The expressions of POLM and REV3L did not exhibit significant differences in most pathways. Collectively, these findings suggest that not only well-known genes such as POLD1 and POLE but also other genes in DNA polymerases may play critical roles in cancers.
Ubiquitination network of POLYs and E3 ligases/deubiquitinates (ubiquitin ligase/deubiquitinate-substrate interactions)
Ubiquitination is a post-translational modification process involving the attachment of ubiquitin molecules to specific target proteins. Dysregulation of this modification can lead to systemic disorders, with the potential to suppress or activate tumor pathways [37–39]. As shown in Fig. 7A, the ubiquitination patterns of POLYs differ in known and predicted ligase. Eleven genes were predicted to interact with E3 ligase, including REV1, DNTT, POLL, POLM, POLI, POLB, POLE, POLG, POLQ, POLH, and REV3L. Ten genes showed multi-ubiquitination shared ligase in different numbers except REV1 (mono-ubiquitination). POLE, DNTT, and POLB demonstrated the highest number of ligases. As for deubiquitinates, only seven genes were predicted to interact with DUBs and can be divided into three groups (Fig. 7B). The first group, represented by DNTT, had the greatest number of DUBs and did not share DUBs with other genes. In contrast, POLE, POLH, POLQ, and REV3L constituted as second group, sharing USP7, while POLL and POLB formed the third group, sharing USP47. These results demonstrate that POLYs may function in different groups, each associated with distinct modifications and interactions.
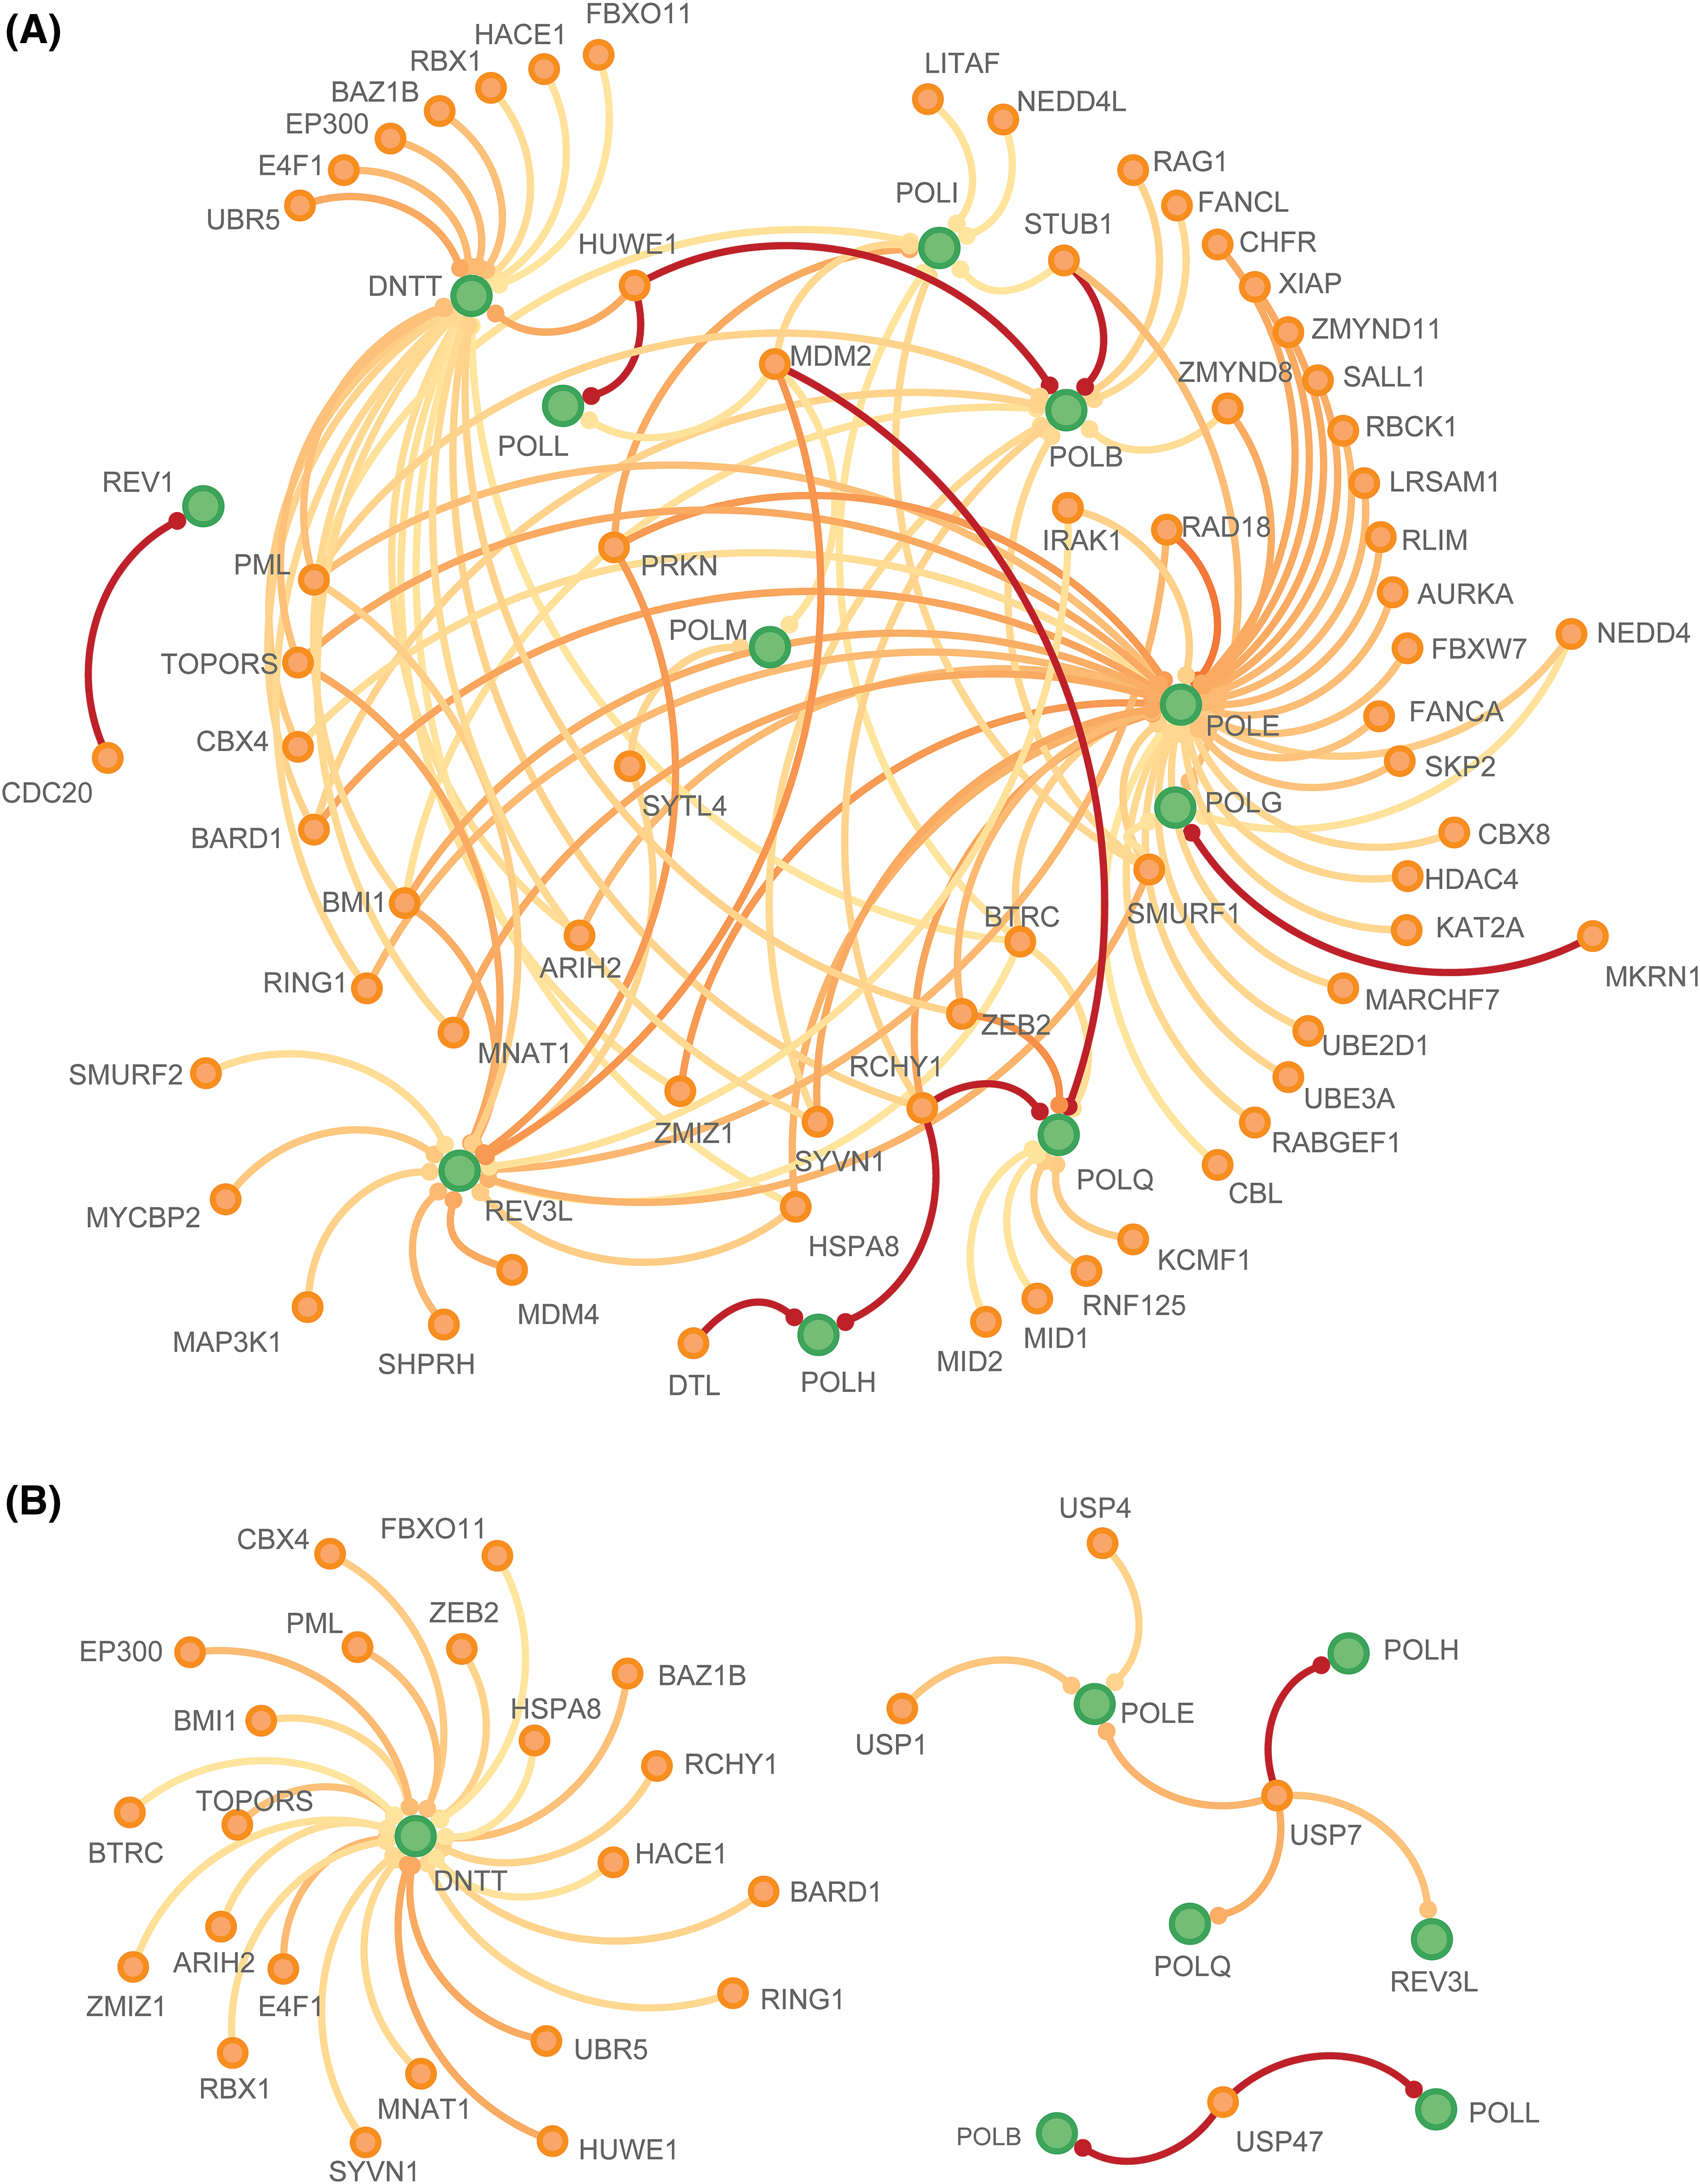
Figure 7: Ubiquitination network of POLYs and their interactions with E3 ligases and deubiquitinates. (A) E3-POLYs interactions (B) DUBs-POLYs interactions. POLYs are shown in green color. E3/DUBs are shown in orange. The red line indicates known interactions from literature and the orange line indicates predicted interactions. The darker the line color is, the stronger the interaction is.
Drug sensitivity analysis of POLYs
To gain a deeper understanding of how expression POLYs can be applied in a clinical setting, we predicted the expressions of 15 genes and their associations with drug sensitivity using the GSCA database. As shown in Fig. 8, 12 genes exhibited significant correlations with most drugs, with the exception being POLL and POLK. These genes were negatively correlated with most drugs in both databases except 17-AAG, which was positively correlated in the GDSC database. POLE, POLD1, and POLQ negative relationships were greatly consistent in both datasets. These findings offer insights into potential mechanisms of drug resistance mechanisms and clinical medication. Detailed results of gene-drug correlation in drug sensitivity analysis are provided in Suppl. Table S4.
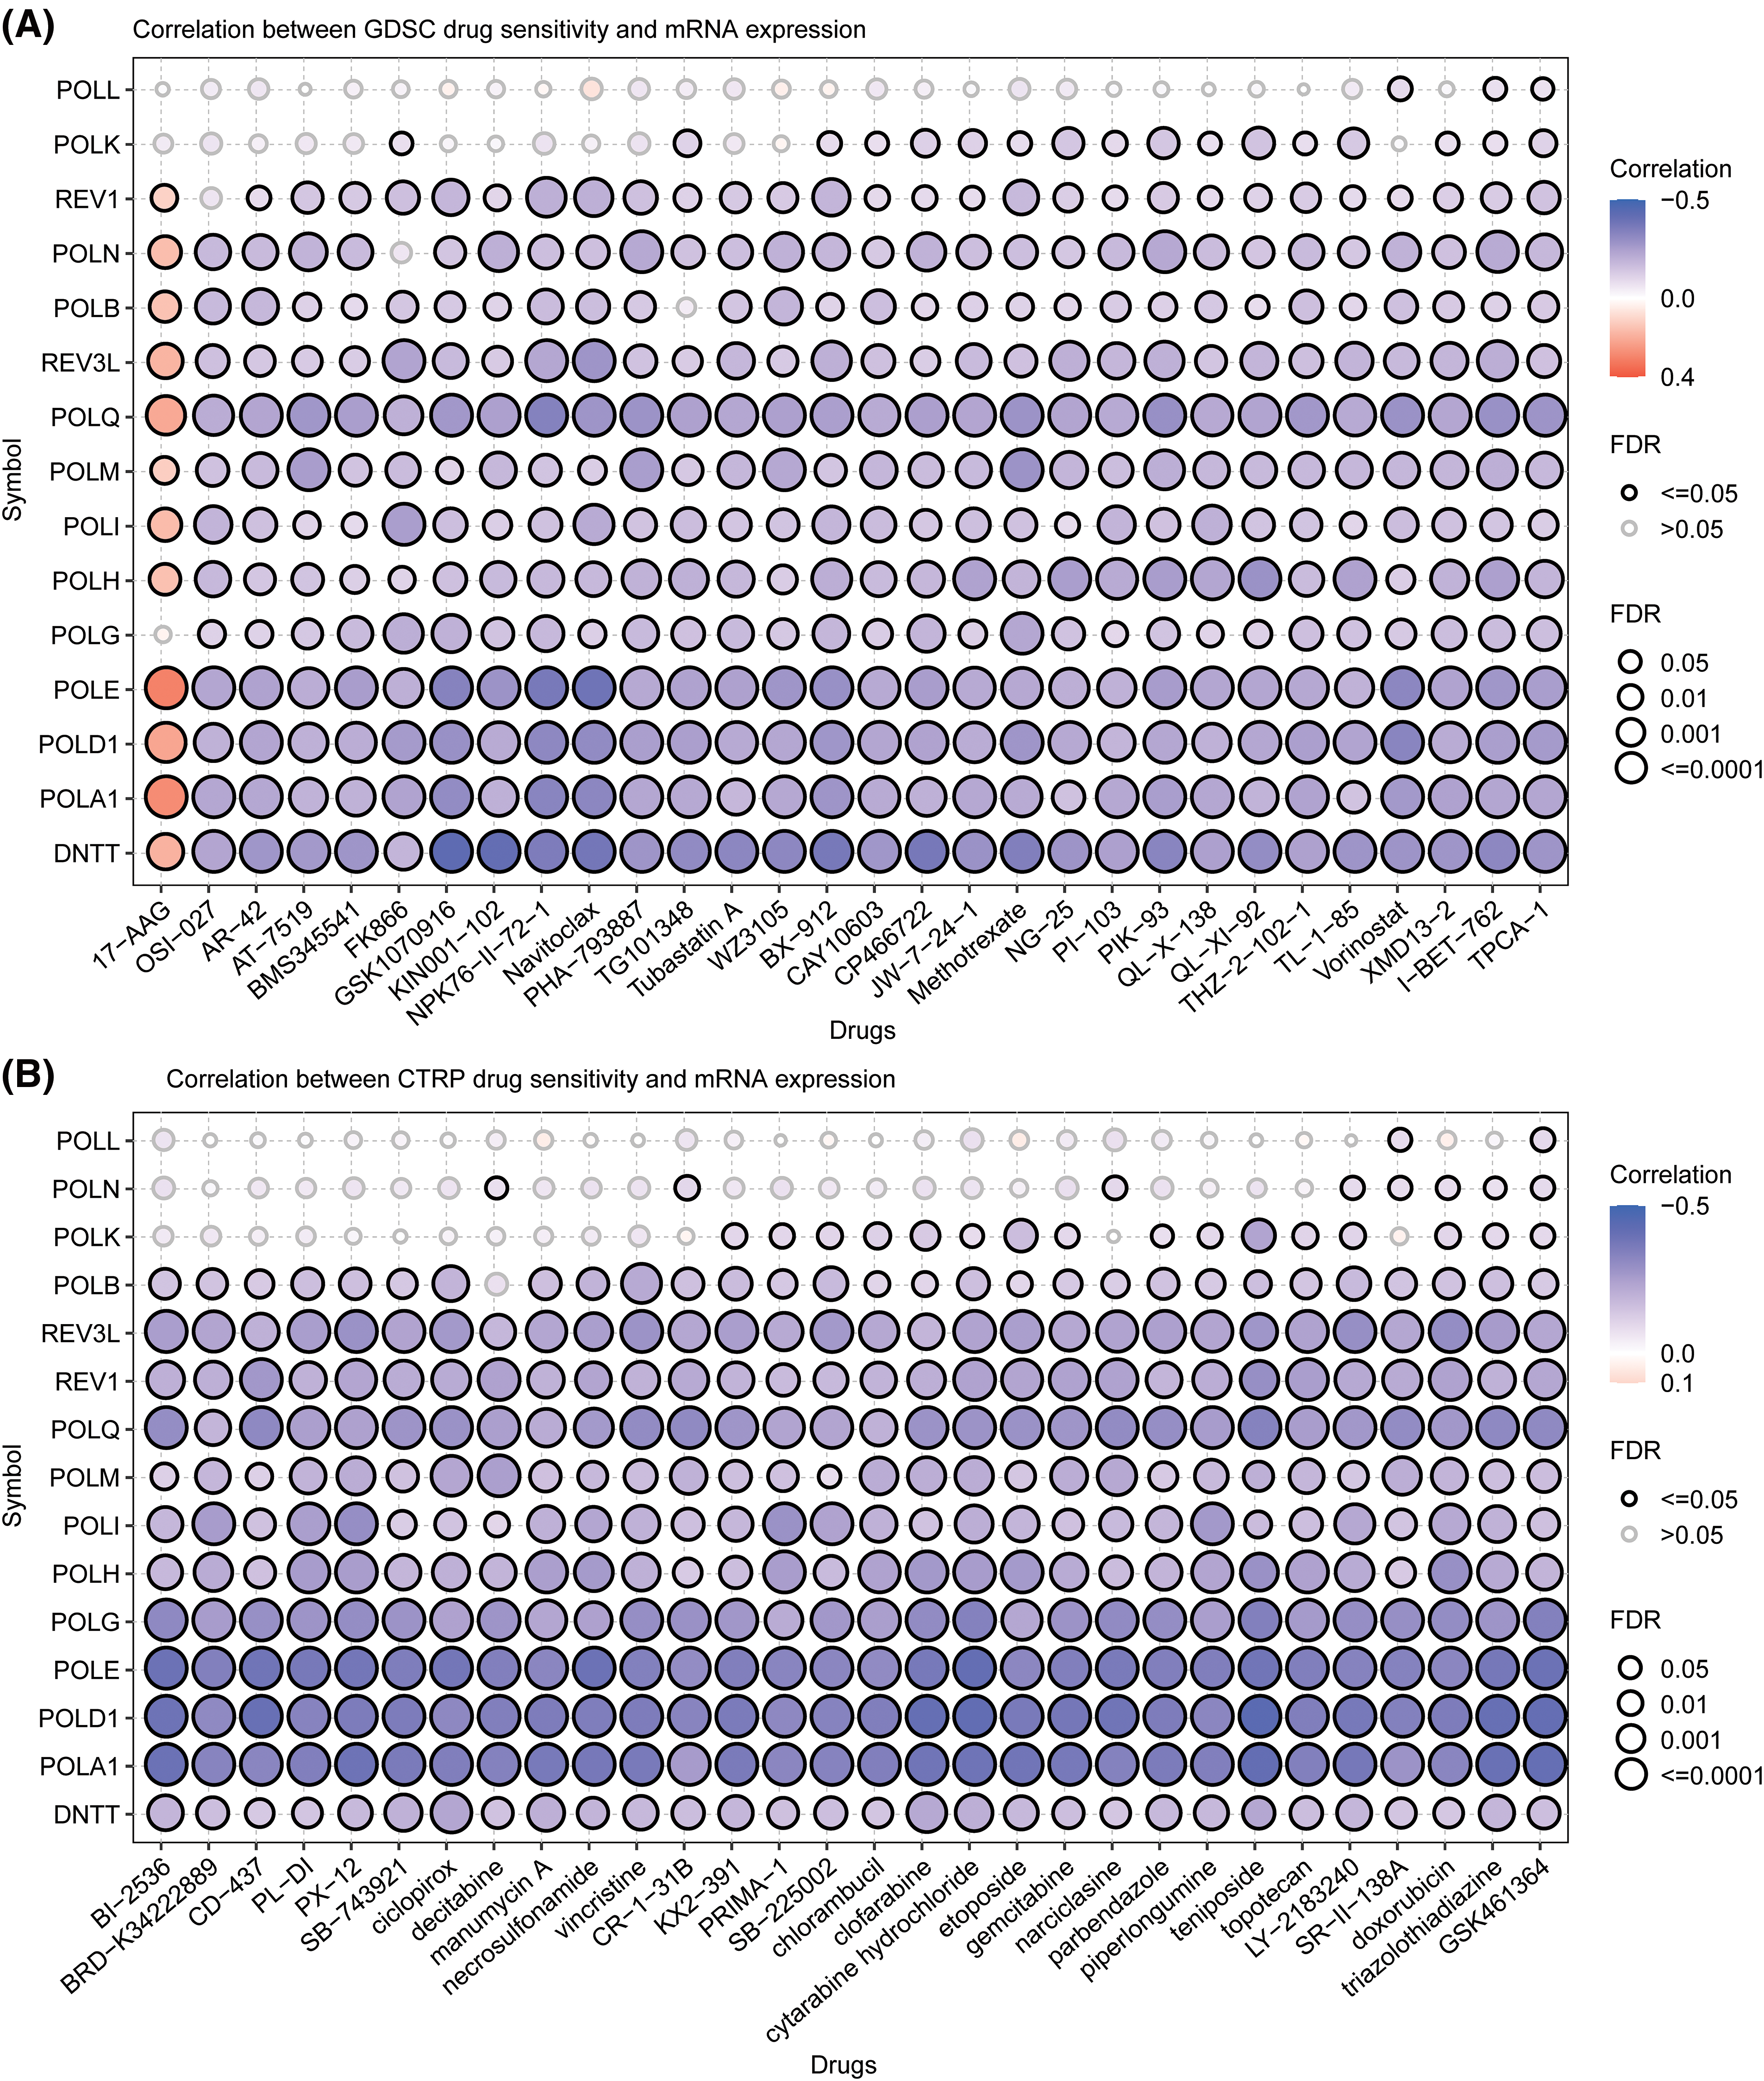
Figure 8: Correlation analysis between POLYs expression and drug sensitivity from (A) GDSC and (B) CTRP database (Orange: positive correlation; Blue: negative correlation; the size of the shape stands for the different FDR scale).
Elevated expression of POLD1, POLE and POLQ in various cancer cell lines
To validate the expression of POLYs in tumor cell lines, we used RT-PCR to detect the expression levels of POLD1, POLE, and POLQ in LUAD cell lines A549 and HCC827, STAD cell lines AGS and HGC-27, ESCA cell lines EC109 and HYSE-30, as well as their corresponding normal cell lines BEAS-2B, GES-1, and HEEC. The results showed that compared to their corresponding normal cells, POLD1, POLE, and POLQ were significantly highly expressed in the LUAD, STAD and ESCA cell lines (Fig. 9).
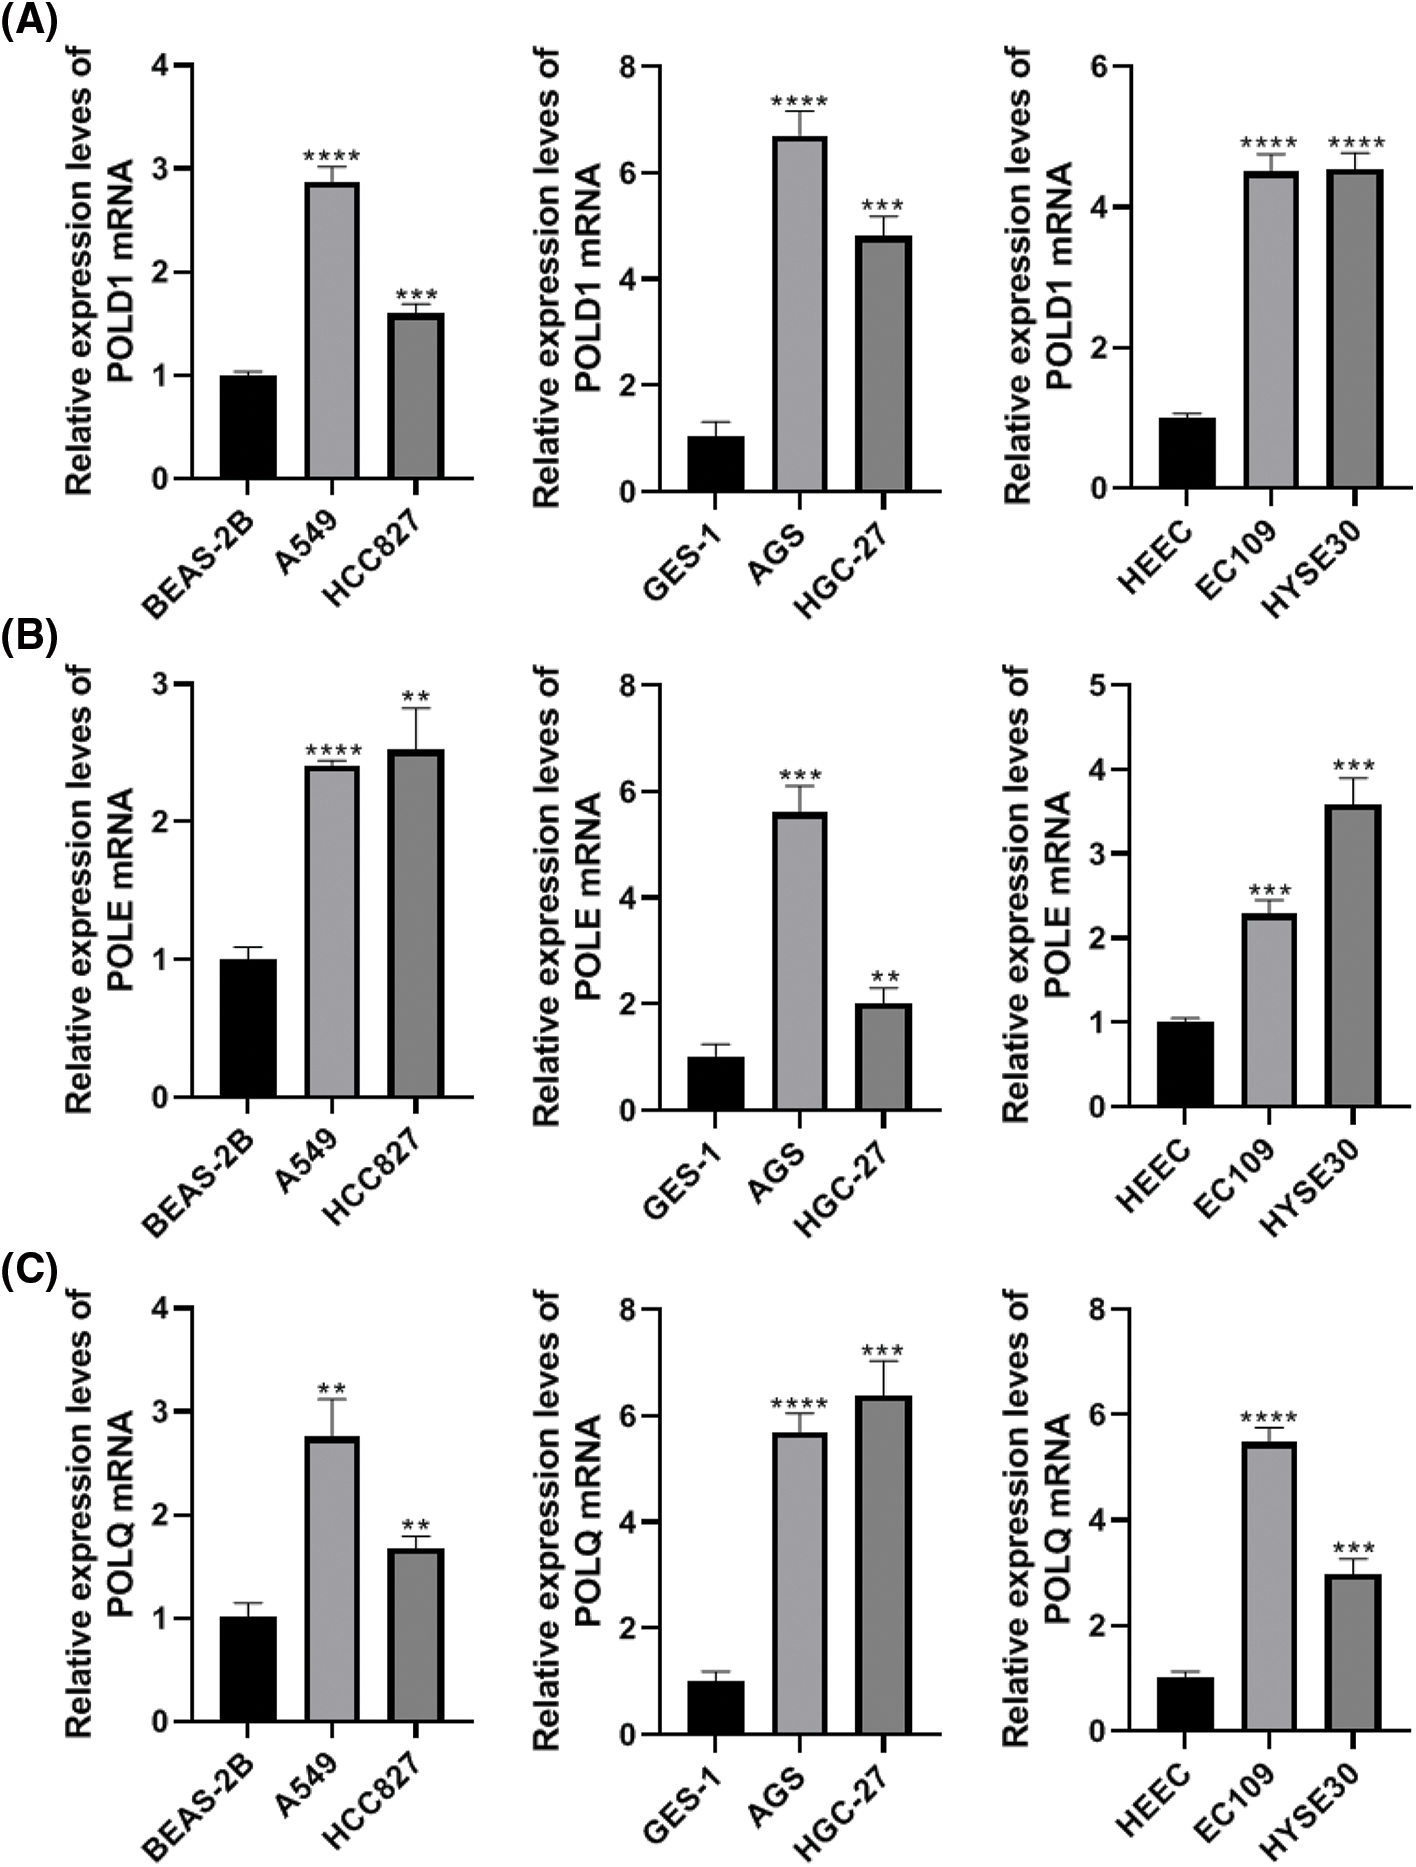
Figure 9: Semi-quantitative reverse transcription polymerase chain reaction (RT-PCR) detect the expression levels of POLD1 (A), POLE (B), and POLQ (C) in LUAD, STAD and ESCA cell lines. Each sample was tested with three replicates. **p < 0.01, ***p < 0.001, ****p < 0.0001.
DNA polymerases play vital roles in maintaining genome integrity and influencing cancer development. They contribute to preventing the accumulation of mutations, which can lead to an increased tumor mutation burden and ultimately result in cancer development [20,40–42]. Additionally, changes in their expression can disrupt normal replication processes, leading to mutagenesis and tumorigenesis [2]. However, the exact role of DNA polymerases in pan-cancer remains uncertain.
In this study, we investigated the expressions of 15 DNA polymerases (POLYs) in pan-cancer and identified variations in their prognostic implications through survival analysis. The expressions of 14 POLYs, except DNTT, demonstrated significant differences between normal and tumor samples in 17 cancers. Most genes, including POLA1, POLG, and POLM exhibited higher expression in most cancer types. POLD1 and POLE showed higher expression in all cancers except KICH. Notably, POLQ exhibited higher expression in tumor samples across all cancers. POLQ and POLG consistently displayed significant prognostic value across multiple cancers. In contrast, other genes acted as either protective or risk factors, depending on the type of cancer. For instance, low expression of POLD1 was associated with worse survival in ACC but better survival in LUAD and LUSC, consistent with findings by Quail et al. [43]. Furthermore, higher expression of POLN was linked to improved prognosis in BRCA, LAML, and DLBC, but worse survival in PAAD. Reduced expression of REV3L was found to improve prognosis in BLCA and BRCA. Conversely, higher expression of POLA1 and POLL was shown to be a high-risk factor for death in KIRC. Notably, increased expression of POLQ, POLE, and POLH was associated with a higher risk of death in THYM. Overall, these results indicate that POLYs’ expression may serve as effective prognostic indicators across different types of cancers.
Numerous studies have highlighted the crucial role of TME in various aspects of tumors, such as proliferation, metastasis, and immune evasion [43–45]. However, the exact contribution of DNA polymerases in TME remains largely unexplored. Although there is evidence suggesting that some polymerases, including POLD1, may promote B cell maturation [46], their potential impact on TME has not been fully elucidated. To address this gap, the correlations between POLY expression and immune cells in each cancer were investigated in three cancer types, namely THYM, KIRC, and ACC. Our findings reveal that different types of POLYs exhibit distinct associations with immune cell subtypes in each cancer type. For instance, expressions of eight genes, namely DNTT, POLA1, POLB, POLD1, POLE, POLG, POLM, and POLQ, positively correlated with B cell, CD4 naïve, CD8 T, and Central memory cells in THYM, but negatively correlated with Neutrophils, NK cells and macrophages. In contrast, different relationships were observed in KIRC. POLD1, POLE, POLG, POLH, POLL, POLM, and POLQ showed a positive correlation with CD8 T, cytotoxic, exhausted, iTreg, infiltration score, Th1, Tfh, nTreg, but negative correlation with CD4 naïve, neutrophils and Th17.
The importance of DNA polymerases in DDR pathways and ubiquitination has been increasingly recognized in recent years [47–50]. We further analyzed the relationship between six DDR-related pathways and POLY expression. We found that the expression of five genes positively correlated with DDR pathways, including POLA1, POLB, POLD1, POLE, and POLG, while that of three genes, namely POLI, POLK, and POLL, negatively correlated with DDR pathways. Moreover, prior research has demonstrated the association of ubiquitination with several DNA polymerases, such as POLB, POLI, and POLH [51–53]. To gain a comprehensive understanding of the Ubiquitination-POLYs landscape, we analyzed both known and predicted E3-substrate and DUBs-substrate interactions using UbiBrowser. Subsequently, we constructed a ubiquitination network, revealing various subgroups. While the relationship between DNA polymerases and ubiquitination is intricate, we believe that this network can serve as a valuable resource for future research. However, additional investigations are warranted to further advance our understanding of this relationship.
Regarding cancer therapy, drug resistance poses a significant challenge to successful clinical treatment. TLS-related DNA polymerases have been identified as contributing factors to the inefficacy of chemotherapy drugs and the survival and progression of tumor cells. These polymerases include Polη, Polι, Polκ, and REV1 [2,54]. In our analysis, we examined the correlation between POLY expression and the IC50 of over 750 anti-cancer drugs. Most drugs exhibited a negative relationship with POLYs expression, while an increased IC50 for 17-AAg was associated with upregulated POLYs expression. These findings underscore the impact of POLY expression on drug sensitivity and provide insights into drug-POLY interactions that can inform more effective treatment selection for patients facing multidrug resistance.
However, it is essential to acknowledge the limitations of our study. First, our analysis relied upon publicly available gene expression data, which may inherently contain biases and limitations. Second, this study did not directly investigate the functional roles of specific DNA polymerases in cancer development and progression. Further experimental studies are required to validate our findings and elucidate the underlying mechanisms. Additionally, the correlations observed between DNA polymerase expression and immune cell infiltration, DDR pathways, and ubiquitination processes need to be further validated and explored in functional studies. Lastly, while we analyzed the correlation between DNA polymerase expression and drug sensitivity, further research is needed to establish causality and explore the potential therapeutic implications of these associations.
In conclusion, our study provides valuable insights into the expression patterns and prognostic significance of DNA polymerases in pan-cancer. We also shed light on the potential associations between DNA polymerase expression and immune cell infiltration, DDR pathways, ubiquitination processes, and drug sensitivity. These findings contribute to our understanding of the role of DNA polymerases in cancer and may have implications for the development of novel therapeutic strategies. Nevertheless, further research is imperative to validate and expand upon these findings.
Our research offers a comprehensive understanding of the roles played by DNA polymerases, encompassing the expression of POLYs and their prognostic significance across various cancers. These findings suggest that POLYs have the potential to serve as valuable prognostic biomarkers in numerous cancer types. Additionally, we delved into the intricate relationship between immune cells and each POLY gene, revealing significant correlations between the TME and gene expression. Notably, we established associations between DDR pathways and ubiquitination with POLYs and constructed a comprehensive ubiquitination network. Furthermore, we conducted an analysis of drug sensitivity, providing valuable insights into the applications of POLY expressions in diverse cancer contexts.
Acknowledgement: None.
Funding Statement: This study is supported by the project of funds by the Consultation of Provincial Department and University for S&T Innovation granted by Hebei Provincial Department of Science and Technology and Hebei Medical University (2020TXZH04).
Author Contributions: Data curation, Qiang Guo, Mingbo Wang and Chao Huang; Formal analysis, Zhenhua Li and Lijuan Chen; Investigation, Huilai Lv; Methodology, Zhenhua Li, Fan Zhang and Yun Li; Project administration, Chao Huang; Resources, Zhenhua Li, Huilai Lv and Ziming Zhu; Supervision, Ziqiang Tian; Writing–original draft, Wenpan Zhang and Zhenhua Li; Writing–review & editing, Huilai Lv and Ziqiang Tian.
Availability of Data and Materials: The original data used in this study were public available and showed in the method section. The data used to support the study are available from the corresponding author upon request.
Ethics Approval: Not applicable.
Conflicts of Interest: The authors declare that they have no competing interests.
Supplementary Materials: The supplementary material is available online at https://doi.org/10.32604/biocell.2023.031568.
References
1. Lange SS, Takata K, Wood RD. DNA polymerases and cancer. Nat Rev Cancer. 2011;11:96–110. doi:https://doi.org/10.1038/nrc2998 [Google Scholar] [PubMed] [CrossRef]
2. Anand J, Chiou L, Sciandra C, Zhang X, Hong J, Wu D, et al. Roles of trans-lesion synthesis (TLS) DNA polymerases in tumorigenesis and cancer therapy. NAR Cancer. 2023;5:zcad005. doi:https://doi.org/10.1093/narcan/zcad005 [Google Scholar] [PubMed] [CrossRef]
3. Boyer AS, Walter D, Sorensen CS. DNA replication and cancer: from dysfunctional replication origin activities to therapeutic opportunities. Semin Cancer Biol. 2016;37–38:16–25. doi:https://doi.org/10.1016/j.semcancer.2016.01.001 [Google Scholar] [PubMed] [CrossRef]
4. Srivastava AK, Han C, Zhao R, Cui T, Dai Y, Mao C, et al. Enhanced expression of DNA polymerase eta contributes to cisplatin resistance of ovarian cancer stem cells. Proc Natl Acad Sci USA. 2015;112(14):4411–6. doi:https://doi.org/10.1073/pnas.1421365112 [Google Scholar] [PubMed] [CrossRef]
5. Xie K, Doles J, Hemann MT, Walker GC. Error-prone translesion synthesis mediates acquired chemoresistance. Proc Natl Acad Sci USA. 2010;107(48):20792–7. doi:https://doi.org/10.1073/pnas.1011412107 [Google Scholar] [PubMed] [CrossRef]
6. Yao J, Gong Y, Zhao W, Han ZF, Guo SH, Liu HY, et al. Comprehensive analysis of POLE and POLD1 gene variations identifies cancer patients potentially benefit from immunotherapy in Chinese population. Sci Rep. 2019;9(1):15767. doi:https://doi.org/10.1038/s41598-019-52414-z [Google Scholar] [PubMed] [CrossRef]
7. Fujita Y, Tinoco R, Li Y, Senft D, Ronai ZA. Ubiquitin ligases in cancer immunotherapy-balancing antitumor and autoimmunity. Trends Mol Med. 2019;25:428–43. doi:https://doi.org/10.1016/j.molmed.2019.02.002 [Google Scholar] [PubMed] [CrossRef]
8. Mevissen TET, Komander D. Mechanisms of deubiquitinase specificity and regulation. Annu Rev Biochem. 2017;86:159–92. doi:https://doi.org/10.1146/annurev-biochem-061516-044916 [Google Scholar] [PubMed] [CrossRef]
9. Foot N, Henshall T, Kumar S. Ubiquitination and the regulation of membrane proteins. Physiol Rev. 2017;97(1):253–81. doi:https://doi.org/10.1152/physrev.00012.2016 [Google Scholar] [PubMed] [CrossRef]
10. Liu J, Cheng Y, Zheng M, Yuan B, Wang Z, Li X, et al. Targeting the ubiquitination/deubiquitination process to regulate immune checkpoint pathways. Signal Transduct Target Ther. 2021;6(1):28. [Google Scholar] [PubMed]
11. Abdel-Samad R, Aouad P, Gali-Muhtasib H, Sweidan Z, Hmadi R, Kadara H, et al. Mechanism of action of the atypical retinoid ST1926 in colorectal cancer: DNA damage and DNA polymerase α. Am J Cancer Res. 2018;8(1):39–55. [Google Scholar] [PubMed]
12. Wang HC, Chan LP, Wu CC, Chang SJ, Moi SH, Luo CW, et al. Silencing DNA polymerase β induces aneuploidy as a biomarker of poor prognosis in oral squamous cell cancer. Int J Mol Sci. 2021;22(5):2402. doi:https://doi.org/10.3390/ijms22052402 [Google Scholar] [PubMed] [CrossRef]
13. Bhattacharyya N, Chen HC, Comhair S, Erzurum SC, Banerjee S. Variant forms of DNA polymerase beta in primary lung carcinomas. DNA Cell Biol. 1999;18:549–54. doi:https://doi.org/10.1089/104454999315097 [Google Scholar] [PubMed] [CrossRef]
14. Iwatsuki M, Mimori K, Yokobori T, Tanaka F, Tahara K, Inoue H, et al. A platinum agent resistance gene, POLB, is a prognostic indicator in colorectal cancer. J Surg Oncol. 2009;100:261–6. doi:https://doi.org/10.1002/jso.21275 [Google Scholar] [PubMed] [CrossRef]
15. Zhao GQ, Wang T, Zhao Q, Yang HY, Tan XH, Dong ZM. Mutation of DNA polymerase β in esophageal carcinoma of different regions. World J Gastroenterol. 2005;11(30):4618–22. doi:https://doi.org/10.3748/wjg.v11.i30.4618 [Google Scholar] [PubMed] [CrossRef]
16. Lv M, Zhang S, Dong Y, Cao L, Guo S. PolG inhibits gastric cancer glycolysis and viability by suppressing PKM2 phosphorylation. Cancer Manag Res. 2021;13:1559–70. doi:https://doi.org/10.2147/CMAR.S292306 [Google Scholar] [PubMed] [CrossRef]
17. Gola M, Stefaniak P, Godlewski J, Jereczek-Fossa BA, Starzynska A. Prospects of POLD1 in human cancers: a review. Cancers. 1905;15(6):1905. doi:https://doi.org/10.3390/cancers15061905 [Google Scholar] [PubMed] [CrossRef]
18. Cavalcante GM, Borges DP, de Oliveira RTG, Furtado CLM, Alves A, Sousa AM, et al. Tissue methylation and demethylation influence translesion synthesis DNA polymerases (TLS) contributing to the genesis of chromosomal abnormalities in myelodysplastic syndrome. J Clin Pathol. 2022;75(1):85–93. doi:https://doi.org/10.1136/jclinpath-2020-207131 [Google Scholar] [PubMed] [CrossRef]
19. Mo S, Ma X, Li Y, Zhang L, Hou T, Han-Zhang H, et al. Somatic POLE exonuclease domain mutations elicit enhanced intratumoral immune responses in stage II colorectal cancer. J Immunother Cancer. 2020;8:e000881. doi:https://doi.org/10.1136/jitc-2020-000881 [Google Scholar] [PubMed] [CrossRef]
20. Wang F, Zhao Q, Wang YN, Jin Y, He MM, Liu ZX, et al. Evaluation of POLE and POLD1 mutations as biomarkers for immunotherapy outcomes across multiple cancer types. JAMA Oncol. 2019;5(10):1504–6. doi:https://doi.org/10.1001/jamaoncol.2019.2963 [Google Scholar] [PubMed] [CrossRef]
21. Ying J, Yang L, Yin JC, Xia G, Xing M, Chen X, et al. Additive effects of variants of unknown significance in replication repair-associated DNA polymerase genes on mutational burden and prognosis across diverse cancers. J Immunother Cancer. 2021;9(4):e002336. doi:https://doi.org/10.1136/jitc-2021-002336 [Google Scholar] [PubMed] [CrossRef]
22. Li T, Fan J, Wang B, Traugh N, Chen Q, Liu JS, et al. TIMER: a web server for comprehensive analysis of tumor-infiltrating immune cells. Cancer Res. 2017;77(21):e108–10. doi:https://doi.org/10.1158/0008-5472.CAN-17-0307 [Google Scholar] [PubMed] [CrossRef]
23. Cerami E, Gao J, Dogrusoz U, Gross BE, Sumer SO, Aksoy BA, et al. The cBio cancer genomics portal: an open platform for exploring multidimensional cancer genomics data. Cancer Discov. 2012;2(5):401–4. doi:https://doi.org/10.1158/2159-8290.CD-12-0095 [Google Scholar] [PubMed] [CrossRef]
24. Gao J, Aksoy BA, Dogrusoz U, Dresdner G, Gross B, Sumer SO, et al. Integrative analysis of complex cancer genomics and clinical profiles using the cBioPortal. Sci Signal. 2013;6(269):pl1. doi:https://doi.org/10.1126/scisignal.2004088 [Google Scholar] [PubMed] [CrossRef]
25. Wickham H. Elegant graphics for data analysis. New York: Springer-Verlag. Available from: https://ggplot2.tidyverse.org. [Accessed 2016]. [Google Scholar]
26. Liu CJ, Hu FF, Xia MX, Han L, Zhang Q, Guo AY. GSCALite: a web server for gene set cancer analysis. Bioinform. 2018;34(21):3771–2. doi:https://doi.org/10.1093/bioinformatics/bty411 [Google Scholar] [PubMed] [CrossRef]
27. Li Y, Xie P, Lu L, Wang J, Diao L, Liu Z, et al. An integrated bioinformatics platform for investigating the human E3 ubiquitin ligase-substrate interaction network. Nat Commun. 2017;8:347. doi:https://doi.org/10.1038/s41467-017-00299-9 [Google Scholar] [PubMed] [CrossRef]
28. Wang X, Li Y, He M, Kong X, Jiang P, Liu X, et al. UbiBrowser 2.0: a comprehensive resource for proteome-wide known and predicted ubiquitin ligase/deubiquitinase-substrate interactions in eukaryotic species. Nucleic Acids Res. 2022;50(D1):D719–28. doi:https://doi.org/10.1093/nar/gkab962 [Google Scholar] [PubMed] [CrossRef]
29. Shannon P, Markiel A, Ozier O, Baliga NS, Wang JT, Ramage D, et al. Cytoscape: a software environment for integrated models of biomolecular interaction networks. Genome Res. 2003;13(11):2498–504. doi:https://doi.org/10.1101/gr.1239303 [Google Scholar] [PubMed] [CrossRef]
30. Hinshaw DC, Shevde LA. The tumor microenvironment innately modulates cancer progression. Cancer Res. 2019;79(18):4557–66. doi:https://doi.org/10.1158/0008-5472.CAN-18-3962 [Google Scholar] [PubMed] [CrossRef]
31. Lei X, Lei Y, Li JK, Du WX, Li RG, Yang J, et al. Immune cells within the tumor microenvironment: biological functions and roles in cancer immunotherapy. Cancer Lett. 2020;470:126–33. doi:https://doi.org/10.1016/j.canlet.2019.11.009 [Google Scholar] [PubMed] [CrossRef]
32. Thorsson V, Gibbs DL, Brown SD, Wolf D, Bortone DS, Ou Yang TH, et al. The immune landscape of cancer. Immunity. 2018;48(4):812–30.E14. doi:https://doi.org/10.1016/j.immuni.2018.03.023 [Google Scholar] [PubMed] [CrossRef]
33. Cheng B, Pan W, Xing Y, Xiao Y, Chen J, Xu Z. Recent advances in DDR (DNA damage response) inhibitors for cancer therapy. Eur J Med Chem. 2022;230:114109. doi:https://doi.org/10.1016/j.ejmech.2022.114109 [Google Scholar] [PubMed] [CrossRef]
34. Jiang X, Li X, Li W, Bai H, Zhang Z. The role of DDR pathways in cancer therapy. Cancer Med. 2021;10(5):1578–93. doi:https://doi.org/10.1002/cam4.3756 [Google Scholar] [CrossRef]
35. Scarbrough PM, Weber RP, Iversen ES, Brhane Y, Amos CI, Kraft P, et al. A cross-cancer genetic association analysis of the DNA repair and DNA damage signaling pathways for lung, ovary, prostate, breast, and colorectal cancer. Cancer Epidemiol Biomarkers Prev. 2016;25(1):193–200. doi:https://doi.org/10.1158/1055-9965.EPI-15-0649 [Google Scholar] [PubMed] [CrossRef]
36. Subramanian A, Tamayo P, Mootha VK, Mukherjee S, Ebert BL, Gillette MA, Paulovich A, Pomeroy SL, Golub TR, Lander ES, Mesirov JP. Gene set enrichment analysis: a knowledge-based approach for interpreting genome-wide expression profiles. Proc Natl Acad Sci USA. 2005;102:15545–50. [Google Scholar] [PubMed]
37. Cockram PE, Kist M, Prakash S, Chen SH, Wertz IE, Vucic D. Ubiquitination in the regulation of inflammatory cell death and cancer. Cell Death Differ. 2021;28(2):591–605. doi:https://doi.org/10.1038/s41418-020-00708-5 [Google Scholar] [PubMed] [CrossRef]
38. Faktor J, Pjechova M, Hernychova L, Vojtesek B. Protein ubiquitination research in oncology. Klin Onkol. 2019;32(2S):56–64. doi:https://doi.org/10.14735/amko20193S [Google Scholar] [CrossRef]
39. Mansour MA. Ubiquitination: friend and foe in cancer. Int J Biochem Cell Biol. 2018;101:80–93. doi:https://doi.org/10.1016/j.biocel.2018.06.001 [Google Scholar] [PubMed] [CrossRef]
40. Dai ZJ, Liu XH, Ma YF, Kang HF, Jin TB, Dai ZM, et al. Association between single nucleotide polymorphisms in DNA polymerase kappa gene and breast cancer risk in Chinese Han population: a STROBE-compliant observational study. Med. 2016;95(51):e2466. doi:https://doi.org/10.1097/MD.0000000000002466 [Google Scholar] [PubMed] [CrossRef]
41. Ma X, Dong L, Liu X, Ou K, Yang L. POLE/POLD1 mutation and tumor immunotherapy. J Exp Clin Cancer Res. 2022;41(1):216. doi:https://doi.org/10.1186/s13046-022-02422-1 [Google Scholar] [PubMed] [CrossRef]
42. Xu HL, Gao XR, Zhang W, Cheng JR, Tan YT, Zheng W, et al. Effects of polymorphisms in translesion DNA synthesis genes on lung cancer risk and prognosis in Chinese men. Cancer Epidemiol. 2013;37(6):917–22. doi:https://doi.org/10.1016/j.canep.2013.08.003 [Google Scholar] [PubMed] [CrossRef]
43. Quail DF, Joyce JA. Microenvironmental regulation of tumor progression and metastasis. Nat Med. 2013;19(11):1423–37. doi:https://doi.org/10.1038/nm.3394 [Google Scholar] [PubMed] [CrossRef]
44. Wang JJ, Lei KF, Han F. Tumor microenvironment: recent advances in various cancer treatments. Eur Rev Med Pharmacol Sci. 2018;22(12):3855–64. doi:https://doi.org/10.26355/eurrev_201806_15270 [Google Scholar] [PubMed] [CrossRef]
45. Xiao Y, Yu D. Tumor microenvironment as a therapeutic target in cancer. Pharmacol Ther. 2021;221:107753. doi:https://doi.org/10.1016/j.pharmthera.2020.107753 [Google Scholar] [PubMed] [CrossRef]
46. Nichols-Vinueza DX, Delmonte OM, Bundy V, Bosticardo M, Zimmermann MT, Dsouza NR, et al. POLD1 deficiency reveals a role for POLD1 in DNA repair and T and B cell development. J Clin Immunol. 2021;41(2):270–3. doi:https://doi.org/10.1007/s10875-020-00903-6 [Google Scholar] [PubMed] [CrossRef]
47. Jurkovicova D, Neophytou CM, Gasparovic AC, Goncalves AC. DNA damage response in cancer therapy and resistance: challenges and opportunities. Int J Mol Sci. 2022;23(23):14672. doi:https://doi.org/10.3390/ijms232314672 [Google Scholar] [PubMed] [CrossRef]
48. Pilie PG, Tang C, Mills GB, Yap TA. State-of-the-art strategies for targeting the DNA damage response in cancer. Nat Rev Clin Oncol. 2019;16(2):81–104. doi:https://doi.org/10.1038/s41571-018-0114-z [Google Scholar] [PubMed] [CrossRef]
49. Yates M, Marechal A. Ubiquitylation at the fork: making and breaking chains to complete DNA replication. Int J Mol Sci. 2018;19(10):2909. doi:https://doi.org/10.3390/ijms19102909 [Google Scholar] [PubMed] [CrossRef]
50. Zhang W, Qin Z, Zhang X, Xiao W. Roles of sequential ubiquitination of PCNA in DNA-damage tolerance. FEBS Lett. 2011;585(17):2786–94. doi:https://doi.org/10.1016/j.febslet.2011.04.044 [Google Scholar] [PubMed] [CrossRef]
51. Cipolla L, Maffia A, Bertoletti F, Sabbioneda S. The regulation of DNA damage tolerance by ubiquitin and ubiquitin-like modifiers. Front Genet. 2016;7:105. doi:https://doi.org/10.3389/fgene.2016.00105 [Google Scholar] [PubMed] [CrossRef]
52. Ihle M, Biber S, Schroeder IS, Blattner C, Deniz M, Damia G, et al. Impact of the interplay between stemness features, p53 and pol iota on replication pathway choices. Nucleic Acids Res. 2021;49(13):7457–75. doi:https://doi.org/10.1093/nar/gkab526 [Google Scholar] [PubMed] [CrossRef]
53. Jung YS, Liu G, Chen X. Pirh2 E3 ubiquitin ligase targets DNA polymerase eta for 20S proteasomal degradation. Mol Cell Biol. 2010;30(4):1041–8. doi:https://doi.org/10.1128/MCB.01198-09 [Google Scholar] [PubMed] [CrossRef]
54. Shilkin ES, Boldinova EO, Stolyarenko AD, Goncharova RI, Chuprov-Netochin RN, Smal MP, et al. Translesion DNA synthesis and reinitiation of DNA synthesis in chemotherapy resistance. Biochem (Mosc). 2020;85(8):869–82. doi:https://doi.org/10.1134/S0006297920080039 [Google Scholar] [PubMed] [CrossRef]
Cite This Article
 Copyright © 2024 The Author(s). Published by Tech Science Press.
This work is licensed under a Creative Commons Attribution 4.0 International License , which permits unrestricted use, distribution, and reproduction in any medium, provided the original work is properly cited.
 Downloads
 Citation Tools