
 Submit a Paper
 Propose a Special lssue
 Open Access
ARTICLE

Machine learning and bioinformatics to identify biomarkers in response to Burkholderia pseudomallei infection in mice
1 Department of Respiratory and Critical Care Medicine, General Hospital of Center Theater of PLA, Wuhan, 430070, China
2 School of Medicine, Wuhan University of Science and Technology, Wuhan, 430065, China
3 School of Life Science and Engineering, Southwest Jiaotong University, Chengdu, 611756, China
* Corresponding Authors: ZHENHONG HU. Email: ; HAICHAO LIU. Email:
# Co-first authors: Yao Fang and Fei Xia contributed equally to this study
(This article belongs to the Special Issue: Bioinformatics Study of Diseases)
BIOCELL 2024, 48(4), 613-621. https://doi.org/10.32604/biocell.2024.031539
Received 30 June 2023; Accepted 17 November 2023; Issue published 09 April 2024
 View Full Text
 Download PDF
Abstract
Objective: In the realm of Class I pathogens, Burkholderia pseudomallei (BP) stands out for its propensity to induce severe pathogenicity. Investigating the intricate interactions between BP and host cells is imperative for comprehending the dynamics of BP infection and discerning biomarkers indicative of the host cell response process. Methods: mRNA extraction from BP-infected mouse macrophages constituted the initial step of our study. Employing gene expression arrays, the extracted RNA underwent conversion into digital signals. The percentile shift method facilitated data processing, with the identification of genes manifesting significant differences accomplished through the application of the t-test. Subsequently, a comprehensive analysis involving Gene Ontology enrichment and Kyoto Encyclopedia of Genes and Genomes pathway was conducted on the differentially expressed genes (DEGs). Leveraging the ESTIMATE algorithm, gene signatures were utilized to compute risk scores for gene expression data. Support vector machine analysis and gene enrichment scores were instrumental in establishing correlations between biomarkers and macrophages, followed by an evaluation of the predictive power of the identified biomarkers. Results: The functional and pathway associations of the DEGs predominantly centered around G protein-coupled receptors. A noteworthy positive correlation emerged between the blue module, consisting of 416 genes, and the StromaScore. FZD4, identified through support vector machine analysis among intersecting genes, indicated a robust interaction with macrophages, suggesting its potential as a robust biomarker. FZD4 exhibited commendable predictive efficacy, with BP infection inducing its expression in both macrophages and mouse lung tissue. Western blotting in macrophages confirmed a significant upregulation of FZD4 expression from 0.5 to 24 h post-infection. In mouse lung tissue, FZD4 manifested higher expression in the cytoplasm of pulmonary epithelial cells in BP-infected lungs than in the control group. Conclusion: These findings underscore the upregulation of FZD4 expression by BP in both macrophages and lung tissue, pointing to its prospective role as a biomarker in the pathogenesis of BP infection.Keywords
Melioidosis is a notorious tropical infectious disease caused by Burkholderia pseudomallei (BP), characterized by initially inconspicuous symptoms, such as subcutaneous abscesses, which can progress rapidly to acute pulmonary and fulminant sepsis [1]. This disease could be transmitted from a contaminated environment or animal to a human being and poses a significant threat to public health in certain tropical regions, causing substantial morbidity and mortality [2]. Melioidosis has a relatively low incidence, but the proportion of refractory pneumonia and sepsis is up to 40% of cases. Clinical outcomes can vary among acute infections, chronic infections, and lethal sepsis [3]. The disease poses diagnostic challenges due to its elusive nature, wide geographical distribution, and latent characteristics [4]. BP is found mainly in soil and surface water in melioidosis-epidemic regions and can be transmitted through aerosols [5]. Consequently, even minor abrasions or wounds make individuals susceptible to melioidosis [6,7].
BP, a gram-negative, intracellular bacterium, secretes various factors that aid in evading host immune responses, including modulation of the immune response and escaping immune clearance mechanisms [8]. The host’s immune status directly influences the pathogen’s ability to infect. The bacterium employs multiple strategies to evade immune responses, such as forming multinucleated macrophages [9]. Furthermore, it can colonize neutrophils, monocytes, and macrophages without activating bactericidal responses [10,11]. Natural immune cells such as macrophages in immunocompromised patients are converted into nutrient providers, which promotes BP reproduction and colonization [12]. Additionally, the progression of BP infection leads to immune deficiency, further facilitating the growth and dissemination of BP.
Macrophages play a vital role in combating infections by producing reactive oxygen intermediates, which contribute to eliminating pathogens, especially intracellular pathogens [13]. The lack of specific diagnostic targets challenged the clinical diagnosis, leading to delays in the treatment of melioidosis. Bacterial culture remains the primary method for diagnosing melioidosis, but it is time-wasting and susceptible to external influences. Gene sequencing analysis is relatively time-saving and can provide reliable genetic information for identifying potential targets [14]. Current studies on melioidosis have uncovered numerous potential therapeutic targets. For instance, the groEL gene was a promising target for identifying BP [15]. Identifying specific targets is crucial for the subsequent screening of diagnostic targets for BP infections.
To identify potential target genes comprehensively, we analyzed gene microarrays to examine the gene expression patterns in BP-infected and control mouse macrophages at different time points (30 min, 8, and 24 h). Furthermore, differentially expressed mRNAs were identified using bioinformatics analysis. The differentially expressed mRNAs from both groups were subjected to Pearson correlation coefficient analysis to identify associated gene pairs and genes. Subsequently, functional and pathway analyses were performed based on gene enrichment analysis to uncover gene functions and signaling pathways relevant to the experimental design. We constructed a weighted co-expression network to identify genes associated with immune responses, specifically M1-type and M2-type macrophages.
Further analysis involved least absolute shrinkage and selection operator (LASSO) logistic regression to identify factors significantly influencing the macrophages. Support vector machine (SVM) analysis was then performed on genes differentiating the high-risk and low-risk groups, and the control and experimental groups. The final biomarkers obtained were assessed for correlations and predictive performance.
Sample preparation and microarray selection
RAW264.7 cells (ATCC® TIB-71, purchased from American Type Culture Collection, Maryland, USA) infected with BP and control RAW264.7 cells were collected at 3 time points (0.5, 8, and 16 h) after infection. The cells were grown in 6-well plates (1.5 × 10⁶ cells per well). A total of 12 samples were collected, including 9 from the infection time points and 3 from the control time points. The cells were washed with phosphate buffered saline (PBS), lysed using TRIzol (15596026, ThermoFisher Scientific, USA), and transferred to RNase-free EP tubes. The samples were frozen in liquid nitrogen and sent for microarray assay (CapitalBio Technology Corporation, Beijing, China). Expression profiling of the mRNA was performed using the Mouse 8*60K expression profile chip from Agilent (Agilent Technology Corporation, USA). The detection protocol followed the specifications for each chip. DNA contaminants in host cells are usually removed during sequencing and analysis.
A t-test was employed to analyze the significant differences between the two groups of samples to identify genes with significant differential expression. Genes with a higher absolute value of the fold change (Absolute Fold change) exhibited more significant differences between the two samples. The criteria for differential gene screening were absolute fold change ≥ 2 and p < 0.05.
Gene ontology and kyoto encyclopedia of genes and genome enrichment analysis
GO enrichment and KEGG pathway analyses of the differential genes were performed using DAVID 6.8. The study focused on cellular components (CC), biological processes, and molecular functions (MF), which provided insights into the cellular functions and components associated with the key genes. The KEGG pathway analysis identified the key signaling pathways involved in the activity of the differential genes, with a significance threshold of p < 0.05.
Weighted gene co-expression network analysis
Macrophages contain both M1 and M2 subtypes. Subsequently, the “WGCNA” R package was utilized to analyze gene modules associated with M1 and M2 macrophages. Hierarchical clustering constructed a clustering tree based on dissimilarity coefficients. Genes with similar expression patterns were assigned to the same modules, while genes with low similarity were assigned to different modules. The module containing macrophage-associated genes was identified and visualized.
Least absolute shrinkage and selection operator logistic analysis
LASSO logistic analysis is a method for reducing linear regression and performing variable selection and parameter estimation. This study used the “glmnet” and “mice” R packages to model and evaluate macrophage-related genes. A random seed (seed) number of 500 was set to ensure reproducible results. The relationship between the genes and the matrix was analyzed as the dependent variable. A risk score was calculated based on the obtained gene signature.
Support vector machine analysis
SVM is a non-linear binary classification model that constructs a hyperplane in a high-dimensional space for classification and regression tasks. This study utilized the “e1071” R package to analyze samples from different subgroups, including gene selection between high-risk and low-risk groups and between experimental and control groups.
Biomarkers and macrophage correlation
Gene expression values were used to calculate gene enrichment scores in the samples. The correlation between genes and macrophages was analyzed using the “ggpmisc” and “MASS” R packages, employing the Pearson correlation coefficient method. Correlation coefficients with absolute values < 0.4 were considered relevant.
Western blotting for frizzled receptor 4 (FZD4)
The protein levels of FZD4 were measured by western blotting, following an earlier protocol [16]. RAW264.7 cells were pretreated with PBS for 24 h, then infected with BP (MOI = 10) for 8 h. Cells were washed with PBS, lysed in protein lysis buffer containing Triton X-100 (T8787, Thermo Scientific, USA), and protease inhibitors (P7626, Thermo Scientific, USA), incubated on ice, and heated. After centrifugation, the protein concentration was determined using the BCA Protein Assay (23227, Pierce, USA). Lysates were subjected to standard sodium dodecyl sulfate-polyacrylamide gel electrophoresis, and the proteins were transferred to a polyvinylidene difluoride membrane (Millipore, Massachusetts, USA). The membranes were blocked and incubated with primary antibodies (β-actin and FZD4 were purchased from Thermo Scientific, cat Nos. A5441 and SAB1402984). Subsequently, horseradish peroxidase (HRP)-conjugated anti-mouse antibodies were used (AP160P, Thermo Scientific, USA). Protein was visualized using the Supersignal West Dura Duration substrate reagent (34080, Thermo Scientific, USA). A commercial protein marker was used to determine protein sizes. The R v3.6.1 was used for all bioinformatics analyses. Receiver operating characteristic (ROC) curves were plotted, and the area under the curve (AUC) was calculated to assess the predictive power of the biomarkers. A significance level of p < 0.05 was considered statistically significant.
Immunohistochemistry for frizzled receptor 4 in mice lungs
Eight Balb/C mice (aged 4–6 weeks old), age- and sex-matched, were selected and used in all experiments. The mice were exposed to inhalation of 3 × 10⁵ colony forming units (CFU) of BP or an equivalent volume of PBS (control). The mice were monitored daily for 10 days during the experiment, and the number of deaths was recorded. After 10 days of observation, the surviving mice were sacrificed, and lung tissues were harvested for immunohistochemistry analysis. All BP infection experiments were performed in biosafety level 2+ laboratory spaces. All animal care and use protocols in this study were performed following the Regulations for the Administration of Affairs Concerning Experimental Animals approved by the State Council of People’s Republic of China. All animal experiments in this study were approved by the Animal Ethical and Experimental Committee of the General Hospital of Center Theater of PLA (Wuhan, Hubei Province. Permit No. 2011-04) under their rules and regulations. All surgery was performed under sodium pentobarbital anesthesia, and all efforts were made to minimize suffering.
The lung tissues were subjected to fixation, embedding, sectioning, antigen retrieval, blocking, primary antibody incubation (rabbit anti-mouse FZD4 antibody, SAB1402984, Thermo Scientific, USA), secondary antibody incubation (HRP-conjugated anti-rabbit antibodies, A0208, Beyotime Biotechnology, Shanghai, China), enzyme-substrate reaction, and mounting for observation. Reference immunohistochemical staining procedure: mouse lung tissue paraffin sections were routinely dewaxed to water, washed for 5 min x three times in PBS, repaired by autoclaving in 10 mmol/L (pH 6.0) citrate buffer for 3 min, and cooled naturally for 30 min. This was washed thrice for 5 min in PBST, incubated for 10 min in 30 mL/L H 20 2/PBS solution, washed thrice for 5 min in PBS, and incubated overnight at 4°C in a wet box. This tissue was washed with PBS for 5 min thrice, and 50 mL of Immunohistochemistry Kit A was added and incubated at 20°C for 10 min and washed thrice with PBS for 5 min. To this, 50 mL of Immunohistochemistry Kit B reagent was added, incubated at 20°C for 10 min, and washed thrice with PBS for 5 min. Finally, 50 mL of Immunohistochemistry Kit B was added, incubated at 20°C for 10 min, and washed thrice with PBS for 5 min, and 3,3-diaminobenzidine (1:50) was used to develop the color at room temperature.
Statistical analysis of the obtained data from GEO was performed using the R software. The t-test was employed throughout the research process to compare the two independent samples, and a significance level of p < 0.05 was used to determine statistical significance.
Gene expression in mouse tissues
The gene expressions were comprehensively analyzed using Agilent DNA microarrays, and 33,623 annotated and unannotated genes were identified. The experimental groups were primarily compared to their respective control groups using a single-channel hybridization approach. Specifically, the following comparisons were made: 30-min infection vs. 30-min negative control, 8-h infection vs. 8-h negative control, 24-h infection vs. 24-h negative control, 8-h infection vs. 30-min infection, and 24-h infection vs. 30-min infection. Scanning pseudo-color plots of the microarrays were generated to ensure the reliability of the data. The samples satisfied the quality control criteria for each assay parameter (Fig. 1). These results validated the suitability of the data for subsequent analyses, ensuring the robustness and accuracy of the findings.
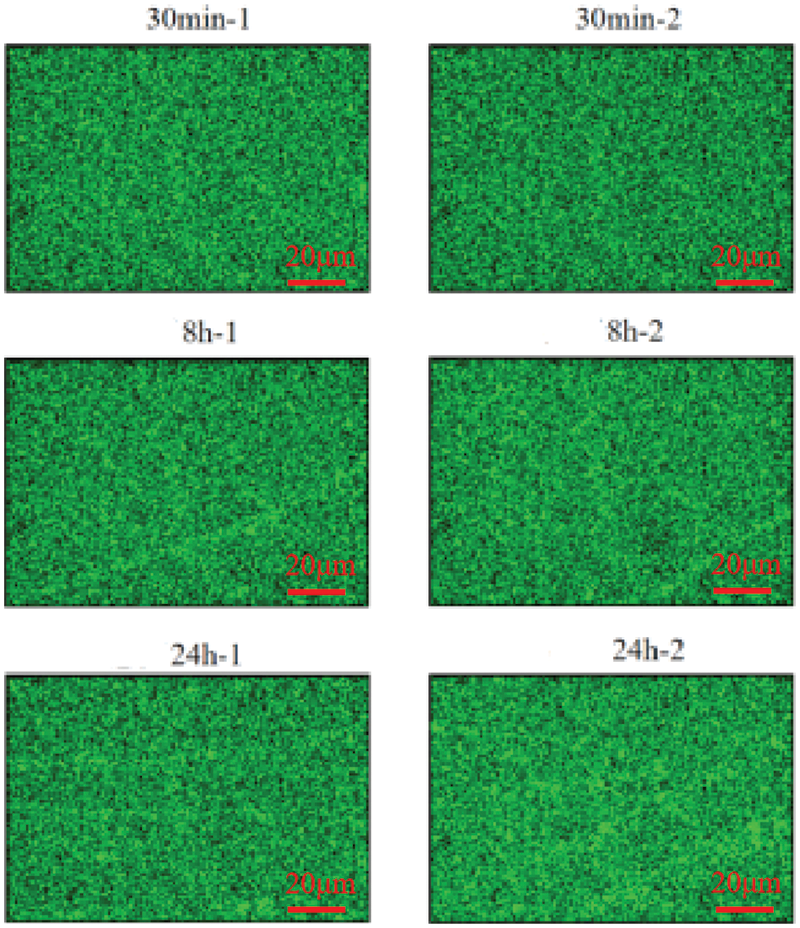
Figure 1: Pseudo-colour map of microchip scans of mouse cells (scale bar = 20 μm).
Function and pathway of differentially expressed genes
In this study, we integrated DEGs by filtering the raw data using a significance threshold of p < 0.05 and a fold change of ≥2.0. We obtained 12,813 DEGs. To assess the relationship between these genes, we calculated the Pearson coefficient (r) between pairs of DEGs. Gene pairs with an absolute value of r > 0.9999 were considered related gene pairs. This analysis resulted in 5,520 corresponding gene pairs involving 898 unique genes. Further analysis was conducted on these 898 genes to explore their functional enrichment. These 898 genes were further analyzed by GO to explore the relationship between the structure and biological function of the genome, the possible regulatory mechanisms in the genome, and its functional enrichment. These genes were primarily associated with biological processes such as the G protein-coupled receptor signaling pathway, signal transduction, and the development of multicellular organisms (Fig. 2A). Considering CC, the analysis indicated that these genes predominantly participated in membrane components, including plasma membranes, plasma membrane components, synaptic and posterior membranes, as well as extracellular regions and cell surfaces. Regarding MF, the identified genes were mainly involved in G protein-coupled receptor activity, transmembrane signaling receptor activity, ion channel activity, and signaling sensor activity. KEGG enrichment analysis of DEGs in the infection group and the control group were compared (Fig. 2B). The top six significant pathways were selected for visualization; the size of the dots in the graph represents the number of genes, and the color represents p.adjust. The infection group was enriched in cytokine-cytokine receptor interactions, nucleotide oligomerization domain-like receptor signaling pathway, tumor necrosis signaling pathway, interleukin (IL)-17 signaling pathway, etc. The clustering heatmap showing differential genes and clustering between samples is presented in Fig. 2C. Horizontal coordinates show sample information and hierarchical clustering results. In contrast, vertical coordinates show differential genes and hierarchical clustering results.
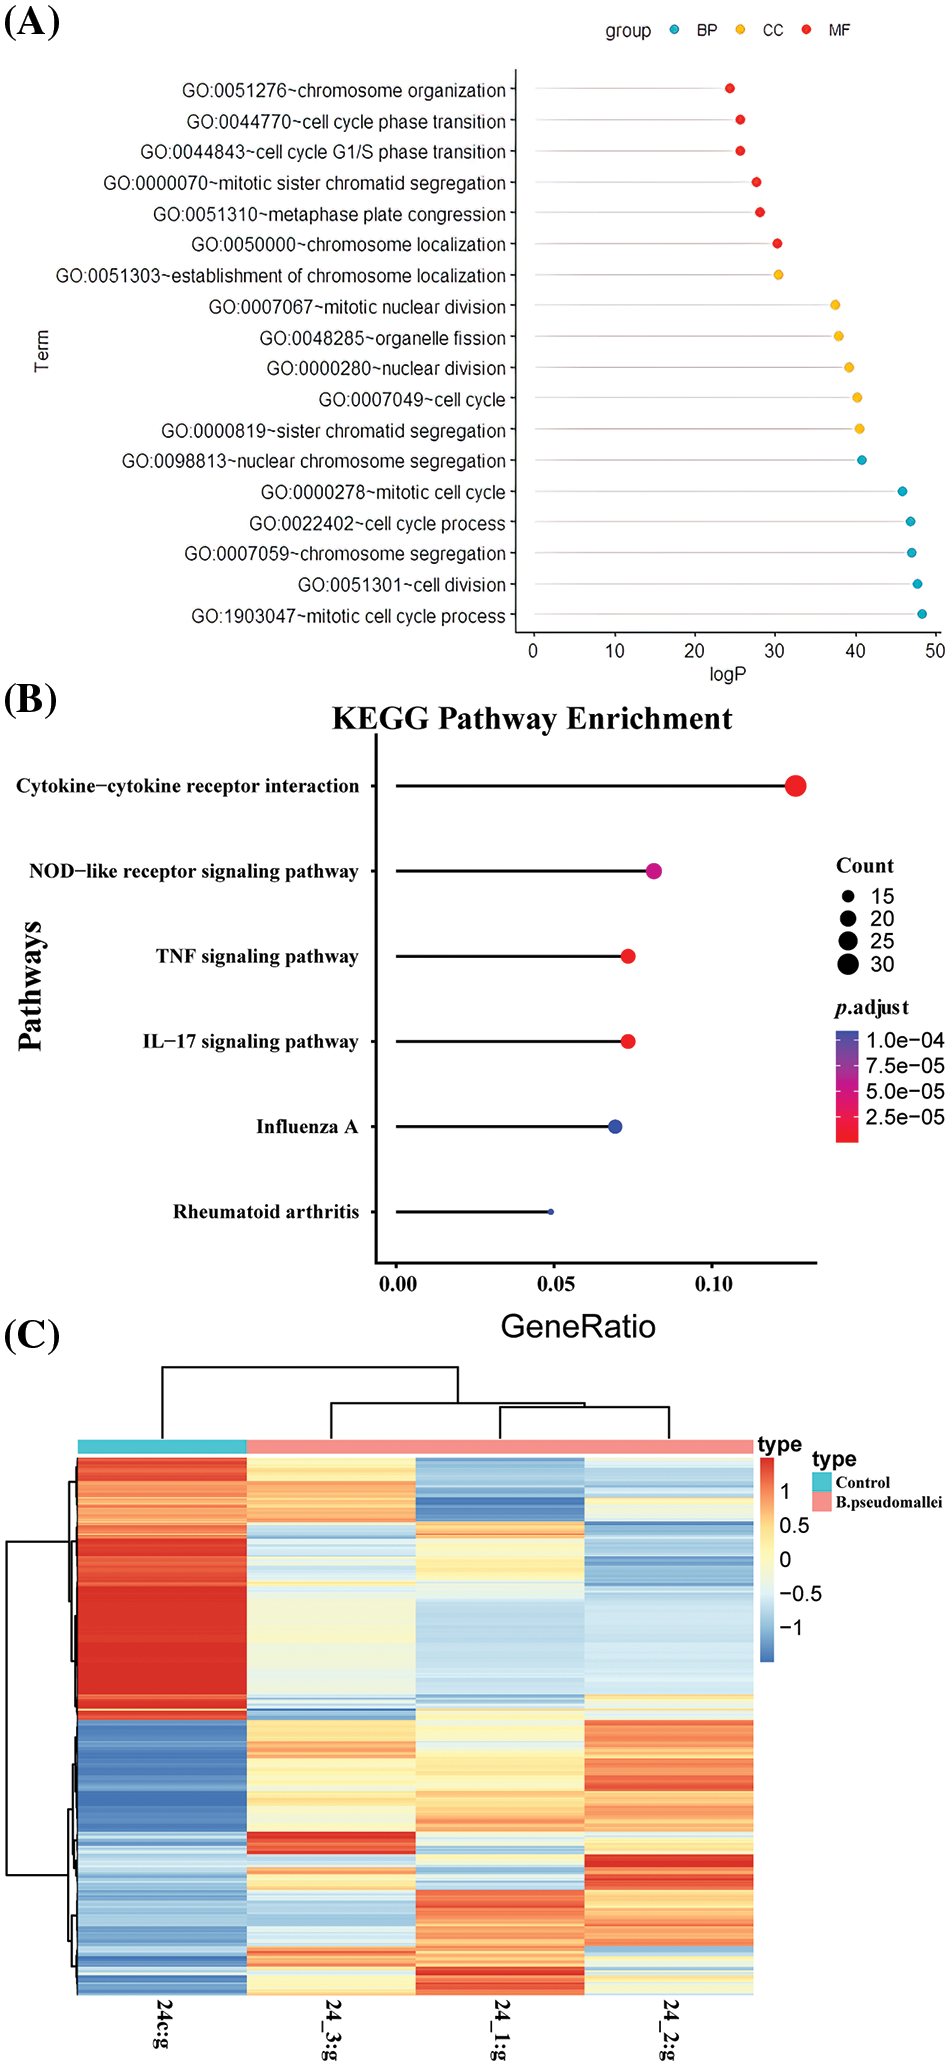
Figure 2: Biological enrichment and Kyoto Encyclopedia of Genes and Genomes (KEGG) pathway enrichment analysis. (A). Biological processes, cellular components, and molecular functions (B) KEGG pathway (C) clustering of differentially expressed genes (DEGs).
The immune module of macrophages
This study was based on mRNA expression data of 898 differential genes in 12 samples for co-expression weighted network construction. The clustering distribution showed no abnormal samples (Fig. 3A). Two gene modules were identified under the parameter settings of minModuleSize = 30 and mergeCutHeight = 0.25 (Figs. 3B and 3C). The two gene modules are represented as the blue and turquoise modules. Subsequently, the correlation between the two modules and the immunological profile was calculated, and the results are shown in Fig. 3D. The blue module shows a significant correlation with macrophages and a total of 416 genes within the module.
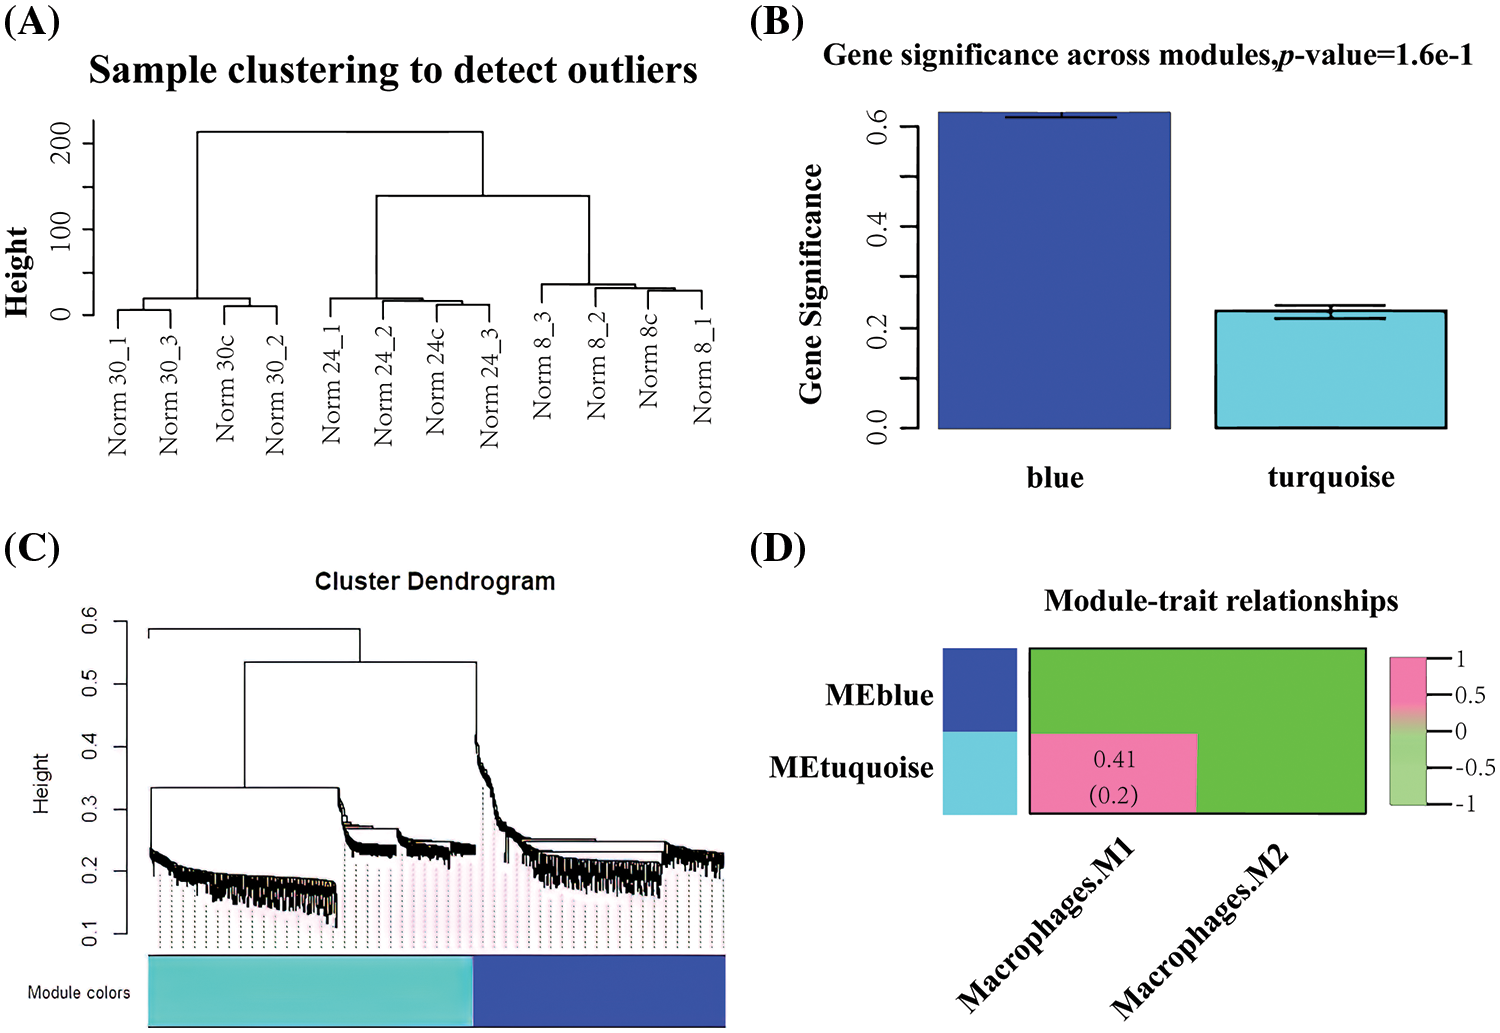
Figure 3: Co-expression weighting network to construct macrophage-related modules (A) Clustering plot of samples (B) Statistical results of the mean importance distribution of gene modules (C) Hierarchical clustering tree of gene expression patterns of infected samples (D) Heat map of correlations between modules and immune features.
Risk scores based on macrophage-related genes
This study used tenfold cross-validation to further analyze the effector genes among 416 immune genes that effectively affect macrophages. Using LASSO logistic analysis, the number of seeds was set to 500 and 416 immune gene features and their correlation coefficients were obtained (Fig. 4A). Ten gene features with independent predictive ability were finally selected based on the appropriate lambda (Fig. 4B). The seed number (seed) was set equal to 500; as a result, 10 gene signatures and correlation coefficients with independent predictive power were obtained (PDE5A, TRIM67, TRP73, RAP2C, FZD4, LST1, SLC15A1, FOXD3, ALPI, ACSM2) (Figs. 4A and 4B). Subsequently, the samples’ risk score was calculated. The risk score was calculated as: risk score = (−8.93626) * PDE5A + (6.29332) * TRIM67 + (−5.86773) * TRP73 + (−1.72814) * RAP2C + (−0.38555) * FZD4 + (−0.17740) * LST1 + (0.00206) * SLC15A1 + 0.51196 * FOXD3 + 0.92781 * ALPI + 5.9582 * ACSM2. Samples can be categorised into high and low-risk groups by immunogenetically related risk scoring models.
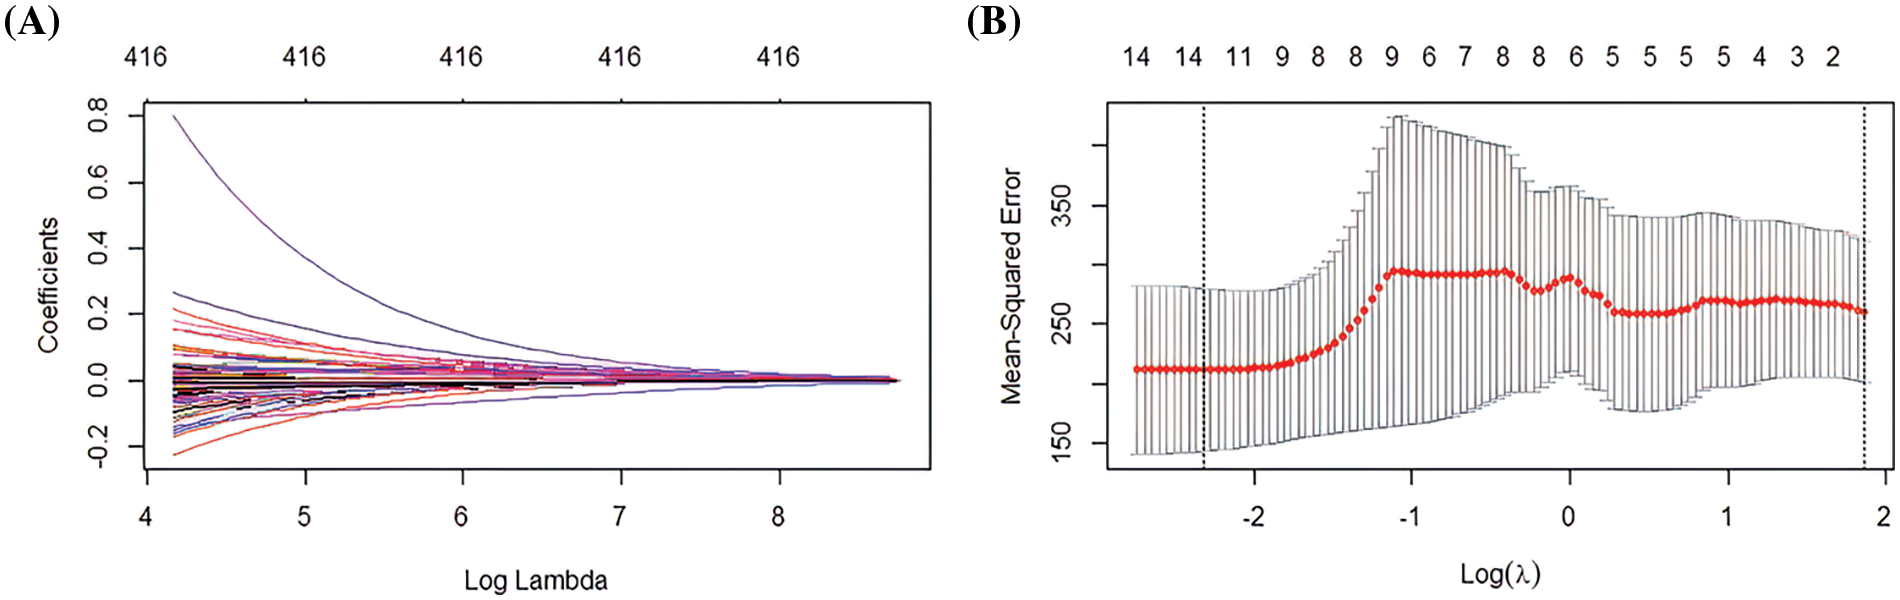
Figure 4: Least absolute shrinkage and selection operator (LASSO) logistic analysis (A) Distribution of LASSO coefficients for 416 genes (B) Penalty plot for 416 genes in the LASSO model, error bars indicate standard errors.
Support vector machine results
SVM analysis was performed on each of the 10 gene signatures in this study. The results were obtained based on the gene expression analysis by selecting four genes (FZD4, TRIM67, TRP73, SLC15A1) in the high and low score groups (Fig. 5A). Minimal error rate can be obtained when the above four immunity genes were selected for prediction. Five genes (RAP2C, PDE5A, FZD4, ALPI, ACSM2) were selected in the experimental and control groups (Fig. 5B). Thus, the error rate of the curve change after 10-fold cross-validation was minimal when the features were the five genes mentioned above. The intersecting gene, FZD4, was identified based on the intersection of the different classification results from the two groups.
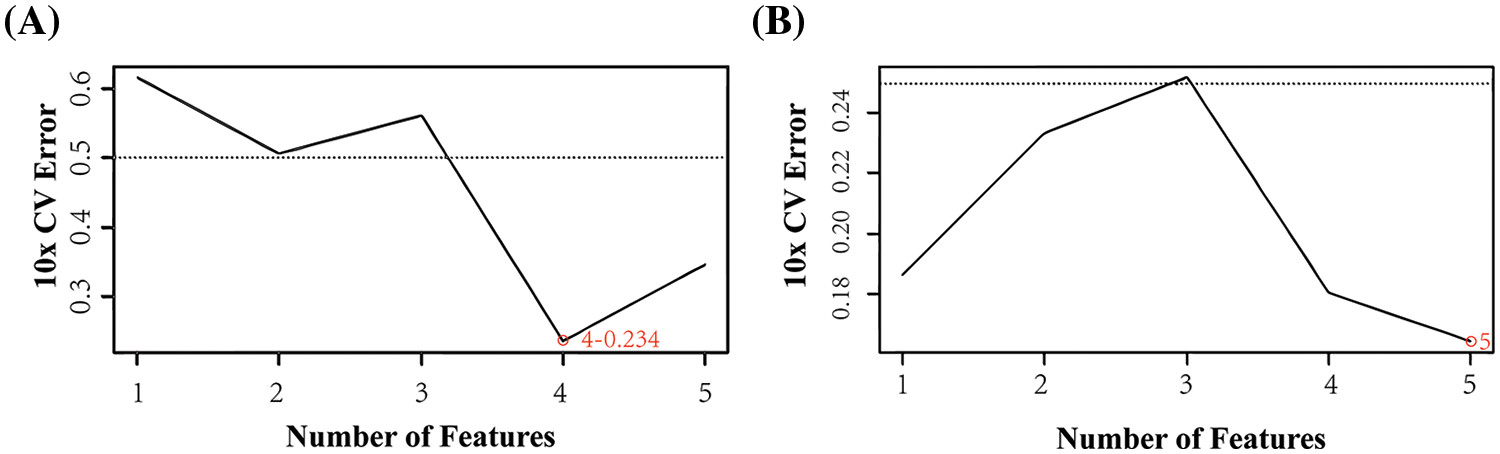
Figure 5: Support vector machine (SVM) algorithm. (A) SVM analysis of the high-low expression group (B) SVM of the experimental and control group.
Correlation of biomarkers with macrophages
Expression levels of the seven genes in macrophages in the experiment group compared with the control group were significantly different. The correlation between genes and macrophages was analyzed using the Pearson correlation coefficient method, which refers to the presence or absence of a correlation between seven genes and macrophages. Correlation coefficients with an absolute value <0.4 were considered to be correlated. The crossover gene of interest, FZD4, showed a significant negative correlation with macrophages (cor = −0.66, p = 0.022). The results showed that FZD4 had a significant negative correlation with macrophages (cor = −0.66, p = 0.022) (Figs. 6A and 6B). This result suggests that there may be a strong interaction relationship between FZD4 and macrophages. ROC curve, also known as the “subject operating characteristics curve”, is used to determine whether a specific factor has a predictive value for the disease; an AUC value of 0.704 for the ROC curve indicates a good predictive effect. The ROC curve showed that FZD4 had good predictive efficacy (AUC = 0.704) (Fig. 6B). It suggests that FZD4 is accurate for BP infection.
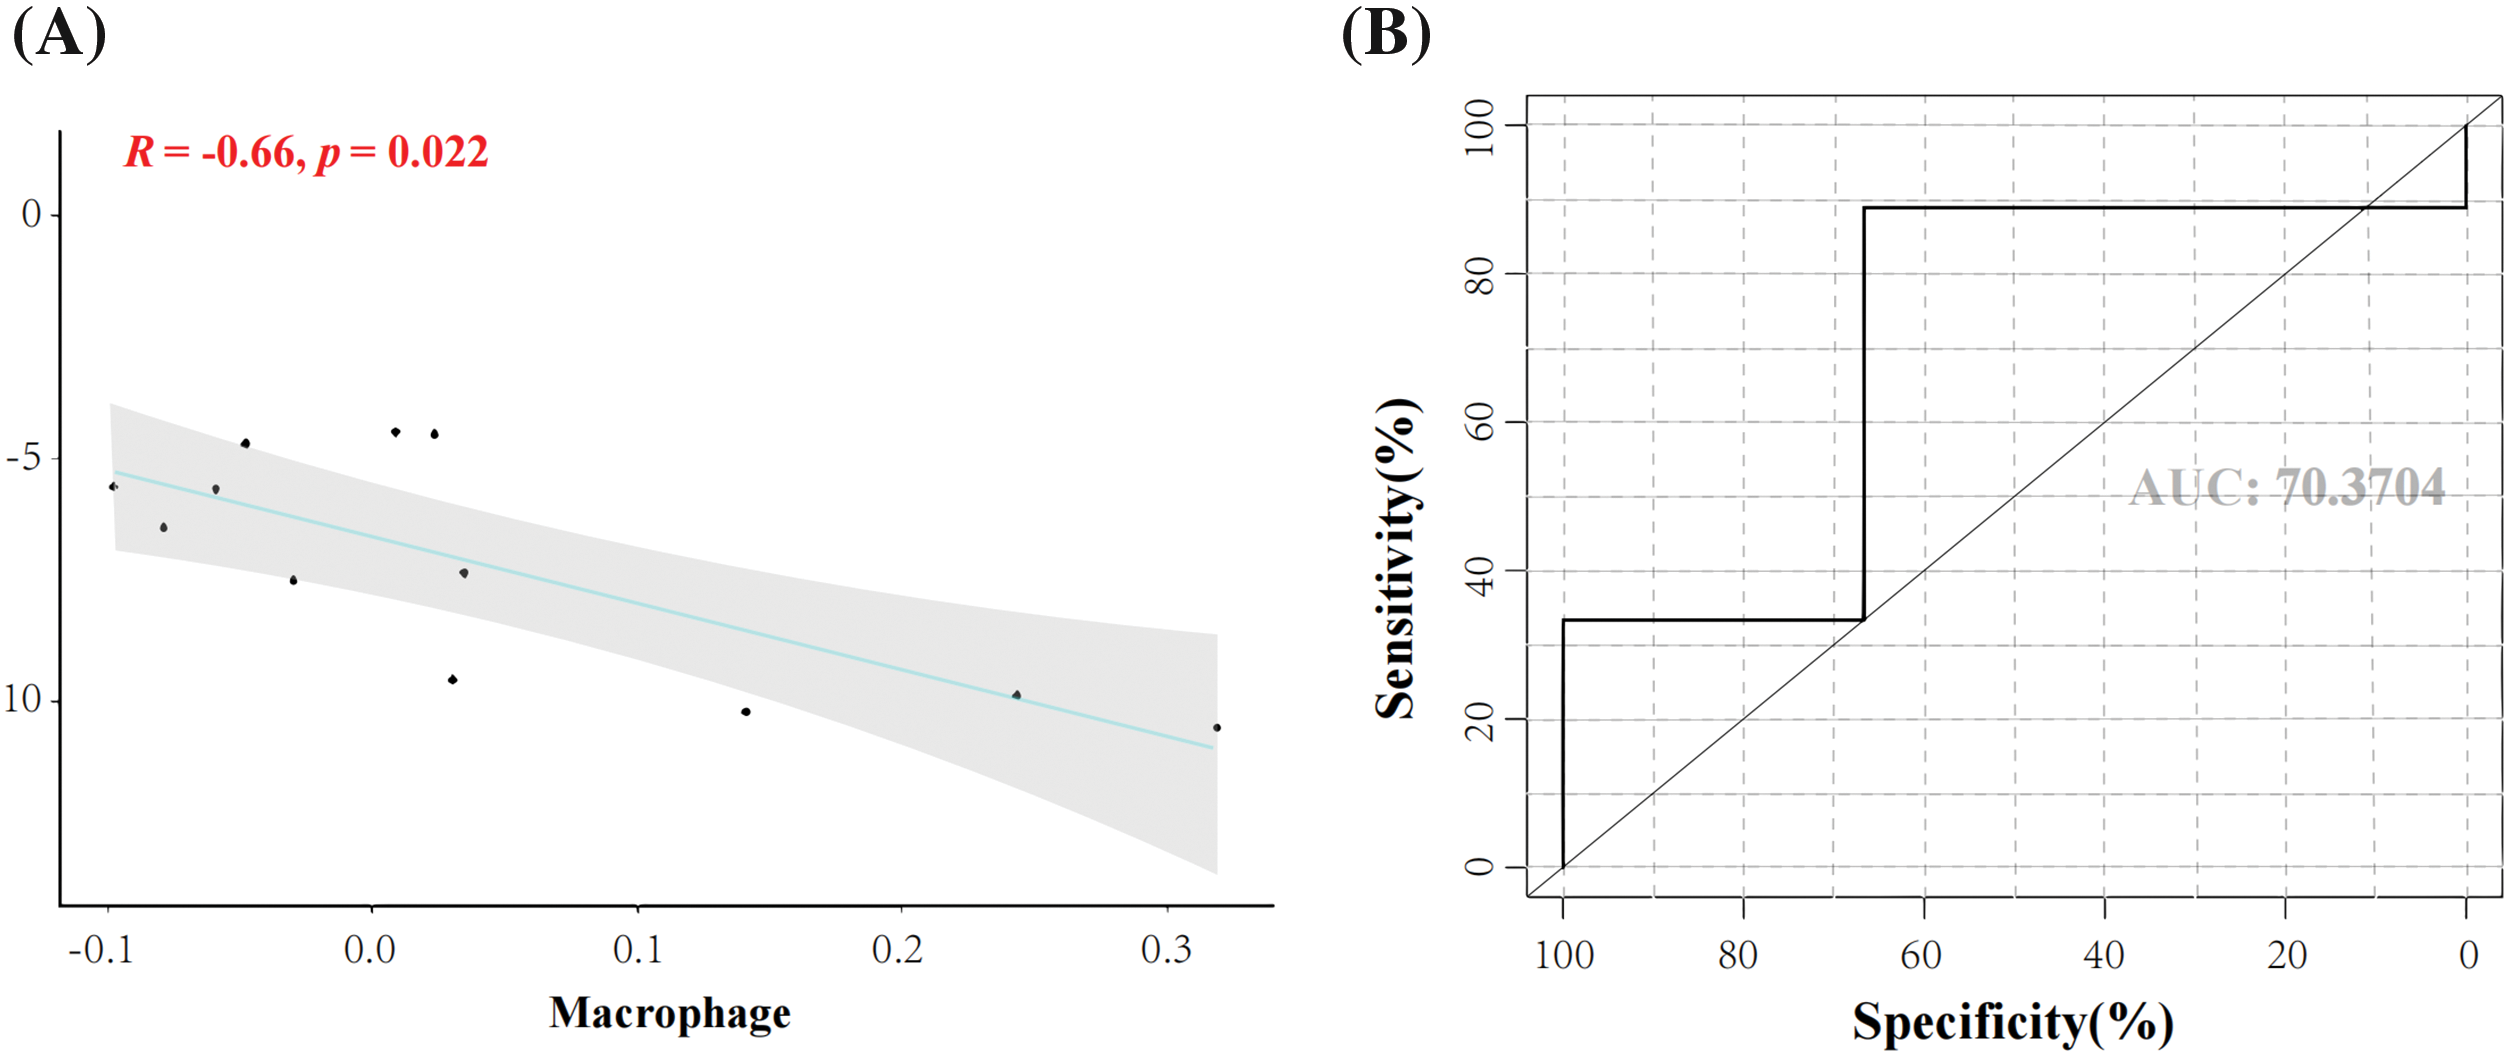
Figure 6: Correlation analysis of biomarkers with macrophages and predictive efficacy. (A) Correlation analysis of frizzled receptor 4 (FZD4) and macrophages (B) Area under the survival curve of the FZD4 gene.
Burkholderia pseudomallei induces the expression of frizzled receptor 4 in RAW264.7
Based on the above analysis of biomarkers with macrophages, we speculated whether BP induces FZD4 expression in macrophages. Western blotting analysis revealed significant upregulation of FZD4 from 0.5 h post-infection (hpi) to 24 hpi (Fig. 7A). FZD4 expression was significantly upregulated, suggesting that BP induces an increase in the expression of FZD4. Results shown in Fig. 7A are representative of at least three independent experiments. The ratios of FZD4 to beta-actin in macrophages were calculated based on the density of target bands (Fig. 7B) and showed a gradual increase with the time of infection. In addition, the ratios at different time intervals differed significantly. The above results show that BP induces FZD4 expression in macrophages time-dependently.
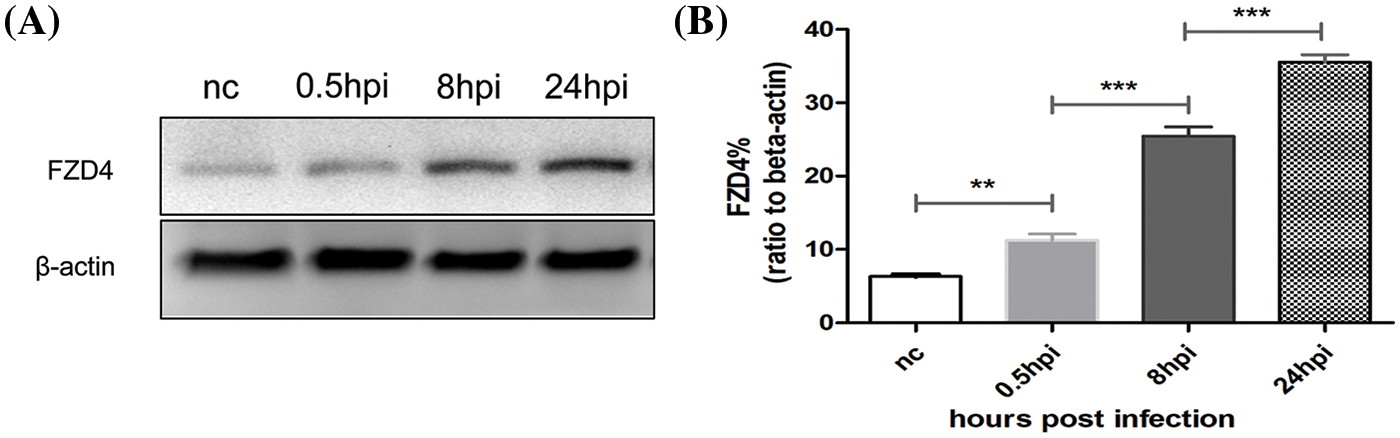
Figure 7: Burkholderia pseudomallei induces frizzled receptor 4 (FZD4) expression in RAW264.7 cells in a time-dependent manner. (A) Western blotting of FZD4 and beta-actin levels after Burkholderia M infection (MOI = 10) for 0.5, 8, and 24 h. (B) Western blotting showing the protein levels of FZD4 in the macrophages. The ratios of FZD4 to beta-actin are illustrated in the graphs. The data are expressed as mean ± SEM. **p < 0.01, ***p < 0.001.
Burkholderia pseudomallei induces the expression of frizzled receptor 4 in lung tissue of mice
As Fig. 8A shows, an inhalation infection model with BP was established via nasal infection under the dose of 3 × 10⁵ CFU of BP. The mice were observed daily until 10 days of infection, the survivors were sacrificed, and the lung tissues were harvested (Fig. 8B). The immunohistochemical analysis revealed a high expression of FZD4 in the cytoplasm of pulmonary epithelial cells in BP-infected lungs of mice, compared with the PBS control group (Figs. 8C and 8D).
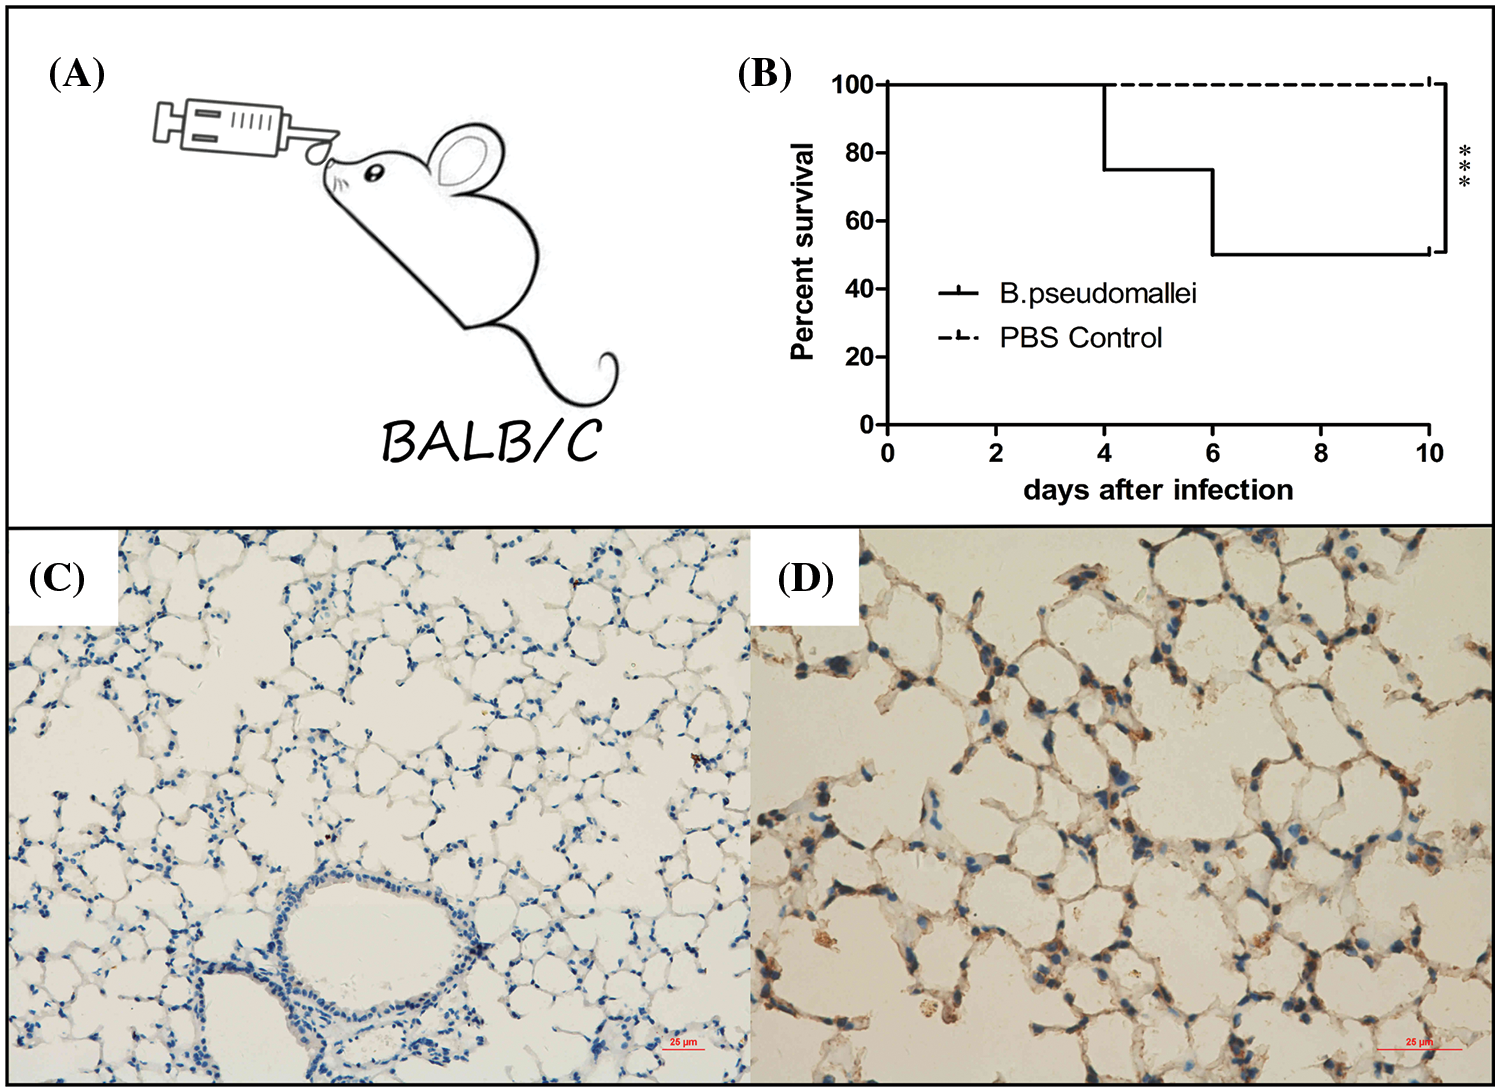
Figure 8: Burkholderia pseudomallei induces FZD4 expression in mice lung tissues. (A, B) Establishment and evaluation of a BALB/c mouse model of BP infection through inhalation. (A) The inhalation inoculation, (B) The survival curve of mice after BP infection for 10 days (***p < 0.001). (C, D) Immunohistochemistry for FZD4 in lung tissues of mice after inoculation via nasal with equivalent BP liquid (3 × 10⁵ CFU) or PBS buffer as non-infection control. (C) Represents the control group, (D) Suggests the infection group (scale bar = 25 μm).
Bacterial infections play an essential role in the progression of many infectious diseases [17–19]. BP is widespread in the water and soil environments of epidemic regions and can even spread through aerosol, making it highly infectious and challenging to prevent. Melioidosis is an infectious disease with severe pathogenicity that causes high morbidity and mortality in certain tropical regions. The diagnosis is difficult as there are only a few specific biomarkers available for melioidosis in clinical practice. In this study, we used gene microarrays to obtain mRNA from mouse macrophages infected with BP. We used bioinformatics analysis such as enrichment, weighted co-expression network screening, and LASSO logistic analysis to provide reasonable and potential biomarkers for diagnosing melioidosis.
The inflammatory response to streptozotocin (STZ)-induced diabetic mice infected with BP was investigated by Chin et al. [20]. They performed a genome-wide expression analysis of the livers of the STZ-induced diabetic murine acute-phase melioidosis model of mice. The study revealed that 1,000 genes displayed significantly different expressions. Our study focussed on the gene response of BP-infected macrophages, and 416 genes were significantly and correlated with macrophages, with gene FZD4 found to be strongly associated with BP infection.
The definitive diagnosis of melioidosis was made by bacterial culture, but it was time-wasting (4 days or longer) and inefficient for timely anti-infection therapy. Similarly, a common disadvantage of antigenic assay is that the number of suspected pathogens in the blood is usually below the achievable detection level [21,22]. This may result in patients missing the optimal time for the treatment, and rapid antimicrobial therapy is necessary to improve patient prognosis. Previous studies have shown that 35% of patients with melioidosis die within 2 days of admission. Patients who received appropriate drug treatment for melioidosis within 2 days of admission had a 30% reduction in mortality [23]. Thus, an early and accurate diagnosis of melioidosis effectively improves patient survival. To this end, researchers have developed several early detection methods. However, these existing techniques have their limitations. The presentation of melioidosis is diverse and clinically challenging to identify. A rapid immunochromatic cassette test (ICT) in northeastern Thailand was used to diagnose melioidosis, with a sensitivity and specificity of 86% and 47% for IgG ICT and 82% and 47% for IgM ICT, respectively. The high background rate of positive serology for BP in this population is one of the reasons for decreased clinical use of ICT [24]. The indirect haemagglutination test is the most commonly used. This method has a sensitivity of 56% in Australia, respectively [25,26]. To explore more effective potential predictive markers for melioidosis, we used a machine-learning approach to assist in screening target genes. LASSO logistic analysis identified 10 gene signatures with independent predictive power with factors significantly affecting macrophages. SVM analysis of genes between high and low-risk groups, or control and experimental groups, suggests that BP FZD4 is closely associated with BP infection, and the ROC curve showed that FZD4 has good predictive efficacy with an AUC value of 0.704.
FZD4 could also be an adjuvant clinical therapeutic target for melioidosis due to its strong association with the immune response of macrophages. The FZD4 gene on chromosome 11q14.2 encodes a 7-transmembrane protein containing 537 amino acids and is a co-receptor for Wnt and Norrin ligands [27]. Overexpression of FZD4 decreases the course of inflammation [28,29]. Bacillus anthracis can interfere with host defenses in a similar infectious disease, leading to cell death and inflammation in anthrax [30]. On the contrary, Bis-2-(5-phenylacetamido-1,3,4-thiadiazol-2-yl)ethyl sulfide (BPTES), a glutaminase inhibitor, can treat anthrax lethal toxin-associated inflammatory diseases by specifically inhibiting the activation of inflammatory vesicles in macrophages [31].
Numerous studies have shown that macrophages are closely associated with the inflammatory response and that improving the inflammatory milieu by regulating the activation state of macrophages is an effective way to treat the disease [32–34]. Notably, this study revealed a significant negative correlation of FZD4 with macrophages. Clinical trials have found that macrophage migration inhibitory factor (MIF) has emerged as a critical mediator of innate immunity, with MIF concentrations significantly correlated with melioidosis patient prognosis [35,36]. Polyciprofloxacin prodrug is a surprisingly effective pre-exposure prophylactic agent targeting macrophages in a high-lethality mouse model of aerosolized human pulmonary rhinophyma [37]. Taken together, the results of this study suggest that the FZD4 gene, significantly negatively correlated with macrophages, is a reliable tool for detecting melioidosis. As a promising diagnostic method, it could be used as a complement to improve the detection and diagnosis of the disease.
Early diagnosis is crucial in treating melioidosis effectively. FZD4 may serve as a predictive biomarker for BP infection. If FZD4 proves to be a reliable and specific biomarker in future clinical trials, healthcare professionals may identify infected individuals more quickly, allowing for prompt treatment and containment. It is also applicable to monitor BP infection in suspected melioidosis-endemic regions. Identifying outbreaks or areas with a higher incidence of BP infection can help implement targeted prevention strategies, such as improving environmental health or public health control measures.
Current research on FZD4 is focused more on tumors, and the relationship between FZD4 and infectious diseases still needs to be clarified. Although this study suggested a correlation between FZD4 and BP-infected macrophages through machine learning algorithms, the specific mechanism between FZD4 and macrophages still requires further experimental validation, and the predictive efficacy of FZD4 must be supported by more clinical evidence.
We processed the digital signals using the percentile shift method. This analysis revealed a significant association between homogeneous G protein-coupled receptors and biological processes, as well as molecular functions. A support vector machine analysis of 14 gene signatures identified two intersecting genes. Among them, FZD4 exhibited good diagnostic efficacy and could serve as a diagnostic marker for BP infection. Furthermore, FZD4 showed a significant negative correlation with macrophages and could be a potential target for treating melioidosis. BP infection induces FZD4 expression in RAW264.7 cells, as evidenced by western blotting. Additionally, FZD4 exhibits high expression in the cytoplasm of pulmonary epithelial cells in the lungs of BP-infected mice. These findings suggest that BP induces FZD4 expression in macrophages and lung tissue, indicating its potential as a biomarker for BP infection.
Acknowledgement: None.
Funding Statement: The study was supported by Yuying Program Incubation Project of General Hospital of Center Theater (ZZYFH202104), Wuhan Young and Middle-Aged Medical Backbone Talent Project 2020 (2020-55), Logistics Research Program Project 2019 (CLB19J029).
Author Contributions: HL, ZH and YF contributed to the conception of the study, YF, FX and FT contributed significantly to bioinformatics analysis and manuscript preparation, YF, LQ, FY and JF performed all experiments, YF, HL and FT helped perform the analysis and contributed conceptually through constructive discussions and critical reading.
Availability of Data and Materials: The data used to support the findings of this study are available from the corresponding author upon request.
Ethics Approval: All animal care and use protocols in this study were performed in accordance with the Regulations for the Administration of Affairs Concerning Experimental Animals approved by the State Council of People’s Republic of China. All animal experiments in this study were approved by the Animal Ethical and Experimental Committee of the General Hospital of Center Theater of PLA (Wuhan, Hubei Province. Permit No. 2011-04) in accordance with their rules and regulations. All surgery was performed under sodium pentobarbital anesthesia, and all efforts were made to minimise suffering.
Conflicts of Interest: The authors report no declarations of interest.
References
1. Raja NS, Scarsbrook C. Burkholderia pseudomallei causing bone and joint infections: a clinical update. Infect Dis Ther. 2016;5:17–29. [Google Scholar] [PubMed]
2. White NJ. Melioidosis. Lancet. 2003;361:1715–22. [Google Scholar] [PubMed]
3. Prescott HC, Angus DC. Enhancing recovery from sepsis: a review. JAMA. 2018;319:62–75. [Google Scholar] [PubMed]
4. Trevino SR, Dankmeyer JL, Fetterer DP, Klimko CP, Raymond JLW, Moreau AM, et al. Comparative virulence of three different strains of Burkholderia pseudomallei in an aerosol non-human primate model. Plos Neglect Trop D. 2021;15:e9125. [Google Scholar]
5. Dance DA. Melioidosis. Curr Opin Infect Dis. 2002;15:127–32. [Google Scholar]
6. Pilatz S, Breitbach K, Hein N, Fehlhaber B, Schulze J, Brenneke B, et al. Identification of Burkholderia pseudomallei genes required for the intracellular life cycle and in vivo virulence. Infect Immun. 2006;74:3576–86. [Google Scholar] [PubMed]
7. Kundangar RS, Bhat SN, Mohanty SP. Melioidosis mimicking tubercular cold abscess. Case Rep. 2017;2017:2017–221787. [Google Scholar]
8. Mariappan V, Vellasamy KM, Barathan M, Girija AS, Shankar EM, Vadivelu J. Hijacking of the host’s immune surveillance radars by Burkholderia pseudomallei. Front Immunol. 2021;12:718719. [Google Scholar] [PubMed]
9. Dilucca M, Ramos S, Shkarina K, Santos JC, Broz P. Guanylate-binding protein-dependent noncanonical inflammasome activation prevents Burkholderia thailandensis-induced multinucleated giant cell formation. mBio. 2021;12:10–1128. [Google Scholar]
10. Pruksachartvuthi S, Aswapokee N, Thankerngpol K. Survival of Pseudomonas pseudomallei in human phagocytes. J Med Microbiol. 1990;31:109–14. [Google Scholar] [PubMed]
11. Srisaowakarn C, Pudla M, Ponpuak M, Utaisincharoen P. Caspase-4 mediates restriction of Burkholderia pseudomallei in human alveolar epithelial cells. Infect Immun. 2020;88:10–1128. [Google Scholar]
12. Wiersinga WJ, Virk HS, Torres AG, Currie BJ, Peacock SJ, Dance DA, et al. Melioidosis. Nat Rev Dis Primers. 2018;4:1–22. [Google Scholar]
13. Canton M, Sánchez-Rodríguez R, Spera I, Venegas FC, Favia M, Viola A, et al. Reactive oxygen species in macrophages: sources and targets. Front Immunol. 2021;12:734229. [Google Scholar] [PubMed]
14. Araujo A, Pagnier A, Frange P, Wroblewski I, Stasia MJ, Morand P, et al. Lymphohistiocytic activation syndrome and Burkholderia cepacia complex infection in a child revealing chronic granulomatous disease and chromosomal integration of the HHV-6 genome. Arch Pediatrie. 2011;18:416–9. [Google Scholar] [PubMed]
15. Woo PC, Woo GK, Lau SK, Wong SS, Yuen K. Single gene target bacterial identification: groEL gene sequencing for discriminating clinical isolates of Burkholderia pseudomallei and Burkholderia thailandensis. Diagn Micr Infec Dis. 2002;44:143–9. [Google Scholar]
16. Pan L, Feng F, Wu J, Fan S, Han J, Wang S, et al. Demethylzeylasteral targets lactate by inhibiting histone lactylation to suppress the tumorigenicity of liver cancer stem cells. Pharmacol Res. 2022;181:106270. [Google Scholar] [PubMed]
17. Tsao Y, Tsai Y, Liao W, Shen C, Shen C, Cheng C. Differential markers of bacterial and viral infections in children for point-of-care testing. Trends Mol Med. 2020;26:1118–32. [Google Scholar] [PubMed]
18. Vouga M, Greub G. Emerging bacterial pathogens: the past and beyond. Clin Microbiol Infect. 2016;22(1):12–21. [Google Scholar] [PubMed]
19. Matos ADO, Dantas PHDS, Silva-Sales M, Sales-Campos H. TREM-1 isoforms in bacterial infections: to immune modulation and beyond. Crit Rev Microbiol. 2021;47:290–306. [Google Scholar] [PubMed]
20. Chin CY, Monack DM, Nathan S. Delayed activation of host innate immune pathways in streptozotocin-induced diabetic hosts leads to more severe disease during infection with Burkholderia pseudomallei. Immunol. 2012;135:312–32. [Google Scholar]
21. Pongsunk S, Thirawattanasuk N, Piyasangthong N, Ekpo P. Rapid identification of Burkholderia pseudomallei in blood cultures by a monoclonal antibody assay. J Clin Microbiol. 1999;37:3662–7. [Google Scholar] [PubMed]
22. Chantratita N, Tandhavanant S, Wongsuvan G, Wuthiekanun V, Teerawattanasook N, Day NP, et al. Rapid detection of Burkholderia pseudomallei in blood cultures using a monoclonal antibody-based immunofluorescent assay. Am J Trop Med Hyg. 2013;89:971. [Google Scholar] [PubMed]
23. Sangwichian O, Whistler T, Nithichanon A, Kewcharoenwong C, Sein MM, Arayanuphum C, et al. Adapting microarray gene expression signatures for early melioidosis diagnosis. J Clin Microbiol. 2020;58(7):10–1128. [Google Scholar]
24. Cheng AC, Peacock SJ, Limmathurotsakul D, Wongsuvan G, Chierakul W, Amornchai P, et al. Prospective evaluation of a rapid immunochromogenic cassette test for the diagnosis of melioidosis in northeast Thailand. T Roy Soc Trop Med Hyg. 2006;100:64–7. [Google Scholar]
25. Harris PN, Ketheesan N, Owens L, Norton RE. Clinical features that affect indirect-hemagglutination-assay responses to Burkholderia pseudomallei. Clin Vaccine Immunol. 2009;16:924–30. [Google Scholar] [PubMed]
26. Harris PN, Williams NL, Morris JL, Ketheesan N, Norton RE. Evidence of Burkholderia pseudomallei-specific immunity in patient sera persistently nonreactive by the indirect hemagglutination assay. Clin Vaccine Immunol. 2011;18:1288–91. [Google Scholar] [PubMed]
27. Tang M, Ding X, Li J, Hu A, Yuan M, Yang Y, et al. Novel mutations in FZD4 and phenotype-genotype correlation in Chinese patients with familial exudative vitreoretinopathy. Mol Vis. 2016;22:917–32. [Google Scholar] [PubMed]
28. Liu Y, El-Serag HB, Jiao L, Lee J, Moore D, Franco LM, et al. WNT signaling pathway gene polymorphisms and risk of hepatic fibrosis and inflammation in HCV-infected patients. PLoS One. 2013;8:e84407. [Google Scholar] [PubMed]
29. Li J, Liu D, Wu K, Chen Q, Lei J. Circ_0003972 promotes the proliferation and inflammation of fibroblast-like synovial cells in rheumatoid arthritis through regulation of the miR-654-5p/FZD4 axis. Immunol Invest. 2022;51:1437–51. [Google Scholar] [PubMed]
30. Lee C, Chen S, Chang I, Chen S, Wu S. Comparison of clinical manifestations and outcome of community-acquired bloodstream infections among the oldest old, elderly, and adult patients. Med. 2007;86:138–44. [Google Scholar]
31. Wang J, Yang D, Shen X, Wang J, Liu X, Lin J, et al. BPTES inhibits anthrax lethal toxin-induced inflammatory response. Int Immunopharmacol. 2020;85:106664. [Google Scholar] [PubMed]
32. Wynn TA, Vannella KM. Macrophages in tissue repair, regeneration, and fibrosis. Immunity. 2016;44:450–62. [Google Scholar] [PubMed]
33. Yunna C, Mengru H, Lei W, Weidong C. Macrophage M1/M2 polarization. Eur J Pharmacol. 2020;877:173090. [Google Scholar] [PubMed]
34. Lee SM, Son K, Shah D, Ali M, Balasubramaniam A, Shukla D, et al. Histatin-1 attenuates LPS-induced inflammatory signaling in RAW264. 7 macrophages. Int J Mol Sci. 2021;22:7856. [Google Scholar] [PubMed]
35. Wiersinga WJ, Calandra T, Kager LM, van der Windt GJ, Roger T, Le Roy D, et al. Expression and function of macrophage migration inhibitory factor (MIF) in melioidosis. PLoS Neglect Trop D. 2010;4:e605. [Google Scholar]
36. Wang J, Sahoo M, Lantier L, Warawa J, Cordero H, Deobald K, et al. Caspase-11-dependent pyroptosis of lung epithelial cells protects from melioidosis while caspase-1 mediates macrophage pyroptosis and production of IL-18. Plos Pathog. 2018;14:e1007105. [Google Scholar] [PubMed]
37. Chavas TE, Su F, Srinivasan S, Roy D, Lee B, Lovelace-Macon L, et al. A macrophage-targeted platform for extending drug dosing with polymer prodrugs for pulmonary infection prophylaxis. J Control Release. 2021;330:284–92. [Google Scholar] [PubMed]
Cite This Article
 Copyright © 2024 The Author(s). Published by Tech Science Press.
This work is licensed under a Creative Commons Attribution 4.0 International License , which permits unrestricted use, distribution, and reproduction in any medium, provided the original work is properly cited.
 Downloads
 Citation Tools