
 Submit a Paper
 Propose a Special lssue
 Open Access
ARTICLE

«Silver Bullet of Acidification»: Studying Anti-PD Neuroprotective Mechanisms of Transient pH-Decrease
Institute of Cell Biophysics, Russian Academy of Sciences, Federal Research Center “Pushchino Scientific Center for Biological Research of the Russian Academy of Sciences”, Pushchino, 142290, Russia
* Corresponding Authors: Alexander D. Nadeev. Email: ; Alexey V. Berezhnov. Email:
(This article belongs to the Special Issue: Mitochondrial Dysfunction in Metabolic and Neuromuscular Diseases: Mechanisms and Therapeutic Strategies)
BIOCELL 2025, 49(3), 451-464. https://doi.org/10.32604/biocell.2025.061624
Received 28 November 2024; Accepted 27 February 2025; Issue published 31 March 2025
 View Full Text
 Download PDF
Abstract
Objective: Activation of mitophagy is a promising option to overcome the mitochondrial malfunction that accompanies many diseases. Herein, we investigate the mechanisms underlying the ability of sodium lactate and pyruvate to initiate mitophagy, from the perspective of action on mitochondrial network and expression levels. Methods: Fluorescent and confocal microscopy was used to assess key cell parameters characterizing the state of the mitochondrial network and the level of mitophagy in human fibroblasts carrying mutations in genes encoding LRRK2 and PINK1 after the combined application of lactate and pyruvate and after direct acidification. qRT-PCR was used to study the expression levels of key mitophagy genes. Results: Cells with a mutation in the PINK1 gene showed a lower basal cytosolic pH. The application of sodium lactate and pyruvate to the cells with mutations associated with Parkinson’s disease caused intracellular acidification. Lowering extracellular pH to 6.0 led to a decrease in mitochondrial membrane potential, while the effect of lactate and pyruvate tended to increase this parameter. Extracellular acidification, as well as the effects of lactate and pyruvate, led to an increased level of mitophagy, and also affected such parameters of the mitochondrial network morphology as the ratio of individual to network mitochondria, branch length in mitochondrial network, number of mitochondrial junctions in the network, and also altered the expression of key mitophagy genes. Conclusion: Direct acidification and one induced by lactate and pyruvate do not differ in the efficiency of their effects on the mitochondrial network and mitophagy but change the cell fate differently. The mechanisms of acidification-induced activation of mitophagy differ in control and mutant fibroblasts.Keywords
Supplementary Material
Supplementary Material FileParkinson’s disease (PD) is a socially significant, ubiquitous, and still idiopathic pathology, affecting about 1% of the population over the age of 60 [1–3]. Clinical manifestations include slowness of movement, impaired posture, rigidity, and uncontrolled resting tremor. Impaired motor functions are accompanied by cognitive, sleep, gastrointestinal, olfactory, and other disorders. The pathophysiologic cause of all mentioned symptoms is a progressive loss of dopaminergic neurons in the substantia nigra pars compacta (SNpc) [4].
In turn, mitochondrial dysfunction, which plays a critical role in both sporadic and hereditary forms of PD, can be considered the cause of dopaminergic neuronal cell death [5,6]. Dopaminergic neurons of the substantia nigra are particularly sensitive to disturbances in mitochondrial functioning because of their high metabolic activity and constant energy demand. Therefore, mitochondrial quality control mechanisms (proteostasis, biogenesis, dynamics, and autophagy) are essential for their normal functioning [7]. Under conditions of oxidative stress, cells need to promptly segregate damaged mitochondria from the rest of the mitochondrial network (MN) through the machinery of mitochondrial fission and safely remove them in a process of specific autophagy-mitophagy.
Safe ways to activate mitophagy are currently attracting particular attention from researchers because of the possible protective effect in various pathologies [8–11]. But such options, unfortunately, very few are known so far. An almost exclusive way to initiate mitophagy is the acidification of intracellular medium [12,13] since pH-sensitive elements have also been found in mitophagy cascades [14–17]. However, a decrease in cytosolic pH has been shown to induce mitophagy through different proposed mechanisms. In previous studies, we managed to find nontoxic compounds, namely sodium lactate and sodium pyruvate, capable of initiating mitophagy via transient cytosolic acidification [18].
Evidence supporting the neuroprotective potential of pyruvate and lactate is abundant [19,20]. The mechanisms underlying it are assumed to be diverse and sometimes contradictory. Among them are protection against glutamate-induced excitotoxicity [21], by reducing PARP-1 overactivity [22]; by activation of P2Y receptors and K+ATP channels [23]. Of course, they also act as cellular metabolic substrates to restore neural tissue function, particularly after brain injury [24,25] Also, their therapeutic action as activators of mitophagy is being considered [26]. However, the cellular mechanisms of this phenomenon are not fully understood.
In view of the above, in the present study, we aimed to delineate the role of intracellular acidification on mitochondrial quality control processes and to unmask the mechanisms of action of lactate and pyruvate.
2′,7′-dichlorodihydrofluorescein diacetate (H2DCFDA, cat. no. C6827), tetramethylrhodamine, methyl ester, perchlorate (TMRM, cat. no. T668), 2′,7′-bis-(2-carboxyethyl)-5-(and-6)-carboxyfluorescein, acetoxymethyl ester (BCECF-AM cat. no. B1170), MitoSOX Red (cat. no. M7513), and MitoTracker Red CM-H2XRos (cat. no. M7513), MitoTracker Green FM (cat. no. M7514), LysoTracker Red DND-99 (cat. no. L7528), propidium iodide (cat. no. P1304MP), Hoechst 33342 (cat. no. H1398), nigericin (cat. no. N1495) were purchased from Invitrogen (Waltham, MA, USA); Dulbecco’s Modified Eagle Medium (DMEM, cat. no. 10313021), Glutamax (cat. no. 35050061), Fetal bovine serum (FBS, cat. no. A5670801), TrypLE™ Express (cat. no. A1217702), were purchased from Gibco (Carlsbad, CA, USA); Hank’s Balanced Salt Solution (HBSS, cat. no. СР020-50) were purchased from PanEco (Moscow, Russia); Sodium Pyruvate (cat. no. S8636), Sodium Lactate (cat. no. 71718), Carbonyl cyanide-p-trifluoromethoxyphenylhydrazone (FCCP, cat. no. C2920) were purchased from Sigma-Aldrich (Merck, Darmstadt, Germany).
The studies were conducted on the following cell lines: human skin fibroblasts carrying mutations in the genes encoding PINK1 (homozygous p.Try90Leufsx12), LRRK2 gene (G2019S), as well as on control fibroblasts. All of the cell cultures were generously supplied by Prof. Andrey Y. Abramov (UCL Institute of Neurology, London, UK).
Cells were cultured on 25 cm2 culture flasks in DMEM containing 10% FBS, 2 mM glutamine (as Glutamax), and 1 mM Sodium Pyruvate at 37°C, 5% CO2, and 100% humidity. Upon reaching 80%–85% confluence, the cells were split to maintain the culture or seeded on round 25 mm glass coverslips for the experiment. All cells used in the experiments did not exceed 18 passages. Tests performed for mycoplasma contamination were negative.
2.3 Lactate and Pyruvate Applications
For lactate and pyruvate treatment, sodium lactate (10 mM) and sodium pyruvate (10 mM) were added simultaneously to the cell culture medium (denoted as SL_SP in figures). The compounds were added directly to the complete DMEM medium containing 10% FBS, 2 mM glutamine (as Glutamax), and 1 mM baseline pyruvate. Cells were then incubated with these supplements for 24 h at 37°C, 5% CO2 and 100% humidity before subsequent experiments.
Cells were loaded for 15 min with 20 µM propidium iodide and 10 µM Hoechst 33342. Hoechst is a blue fluorescent dye that stains chromatin DNA, while propidium iodide only penetrates dead cells, exhibiting red fluorescence. This allows us to calculate the percentage of dead cells (showing red fluorescence) to the total number of cells (showing blue fluorescence).
2.5 Mitochondrial Membrane Potential Measurements
The mitochondrial membrane potential (Δψm) measurements were performed using TMRM at 20 nM concentration with a 40-min loading period. Importantly, TMRM remained present in the medium throughout all measurements to maintain a steady-state distribution of the dye. Using the confocal microscope Zeiss 900 CLSM (Carl Zeiss Microscopy GmbH, Jena, Germany), we acquired Z-stack images and identified the region of maximum intensity using the Z-projection function in Fiji software. This middle region, containing the highest fluorescence intensity, was selected to ensure consistent measurements across all samples. All mitochondria in the resulting image were masked to obtain average TMRM fluorescence intensity values. This process was repeated for each cell, each coverslip, and each experimental condition. Following image acquisition, 2 μM FCCP (Carbonyl cyanide 4-(trifluoromethoxy) phenylhydrazon) was added to completely depolarize mitochondria, resulting in TMRM redistribution from mitochondria to cytosol and consequent loss of fluorescence signal to background levels. The mitochondrial membrane potential was calculated as the difference between the maximum TMRM signal and this background signal after FCCP, with the control fibroblast values set as 100%
2.6 Mitochondrial Network Morphology Analysis
The methods created in our previous study were used to evaluate the MN morphological characteristics [27]. In brief, confocal images of mitochondria visualized by TMRM membrane potential dye were analyzed according to the following algorithm: 1) Preprocessement of the original confocal image, which includes background subtraction, median filter, and local contrast enhancement (CLACHE) functions. 2) Image binarization using a threshold function calculated using Otsu’s method. 3) Mitochondrial footprint was calculated using the sum of mitochondrial areas in the Fiji “Particle Analyzer” plugin. 4) The image was skeletonization using the “Skeletonization” function and processed using the built-in “Skeleton Analysis” function. 5) The obtained mitochondrial data were transferred to the R programming environment (R version 4.2.1) and separated using the “filter” function from the “dplyr” package (version 1.1.0) into two subsets: “mitochondrial network” and “individual mitochondria” according to the described rule (mitochondrial networks were considered objects consisting of more than one branch and containing a non-zero connection, whereas individual mitochondria consisted of only one branch and a zero connection). These manipulations allowed us to get the following parameters: mitochondrial footprint area, ratio of individual mitochondria to network mitochondria, branch length in MN, and number of mitochondrial junctions in the network.
Prior to mitochondrial network analysis, we evaluated potential cell volume differences between the studied fibroblast lines using Calcein-AM fluorescence (5 μM, 30 min loading at room temperature). Z-stack confocal microscopy images were acquired and analyzed for cell volume estimation. As described in our previous work [23], no significant differences in cell volume were found between control and mutant fibroblast lines. Importantly, we have previously confirmed that treatment with sodium lactate (10 mM) and sodium pyruvate (10 mM) does not affect cell volume in these experimental conditions.
2.7 Measurements of Cytosolic pH (pHcyt)
Cells were loaded for 40 min with a 5 μM BCECF-AM dual-wavelength fluorescent dye, followed by washing three times with HBSS. Studies were performed on a Spark 10 M (Tecan Group Ltd., Männedorf, Switzerland) multifunctional plate reader. For this purpose, cells were grown on 48-well culture plates. Fluorescence was excited at wavelengths of 430 ± 10 nm and 510 ± 12 nm and recorded at 560 ± 10 nm. Fluorescence signals were first calibrated in accordance with the manufacturer-recommended protocol for each culture. Briefly, the working medium was replaced with calibration solutions with high potassium ion content and known pH values (4.5–8.5 range) with the addition of 10 μM nigericin. Then the calibration curve equations were calculated using a standard protocol. The coefficients obtained in the calibration curves for each culture were used to calculate the intracellular pH under different exposures.
2.8 Mitochondria and Lysosomes Colocalization
For the identification of mitochondrial and lysosomal colocalization, cells were loaded with 200 nM MitoTracker Green FM and 50 nM LysoTracker Red DND-99 in HBSS for 30 min before experiments (including the treatment of cells with lactate and pyruvate). The 488-nm Argon laser line was used to excite Mito-Tracker Green fluorescence, which was measured between 505 nm and 530 nm. Illumination intensity was kept to a minimum (about 1% of laser output) to avoid phototoxicity and the pinhole was set to give an optical slice of ~2 μm. For LysoTracker Red DND-99, the 543 nm Ne/He laser line was used with measurements above 650 nm.
Total RNA was extracted from cell cultures using a commercial RNA extraction kit (Eurogen, Moscow, Russia, cat. no. BC032). The concentration of the obtained RNA was measured spectrophotometrically at 260 nm. Murine leukemia virus reverse transcriptase (cat. no. SK022S, Eurogen, Moscow, Russia) was used to synthesize complementary DNA. Primers were purchased from Eurogen (Moscow, Russia) and are specified in Table S1. The resulting coding DNA samples were then used for quantitative real-time PCR on a DTlite amplifier (DNA-Technoligies, Russia). Relative expression levels were calculated using the 2–ΔΔСt method, where the GAPDH gene was used as a reference gene.
All data presented were obtained from at least 5 coverslips and 2–4 different cell preparations. Statistical analysis was performed using OriginPro 2018 (64-bit) SR1 b9.5.1195 (OriginLab Corporation, Northampton, MA, USA). Before hypothesis testing, all data were assessed for normality using the Shapiro-Wilk criterion. Parametric tests were used for statistical comparisons of normally distributed data. Differences between control and experimental groups were analyzed using Student’s unpaired t-test, as well as one-way and two-way analysis of variance (Tukey’s post-hoc test with Bonferroni correction). OriginPro 2018 was used to generate the graphs. Box plots show median and interquartile range, dots represent individual data values, p < 0.05 was considered statistically significant (denoted by *), and p < 0.01 is denoted by **.
3.1 Intracellular pH Measurements
Intracellular pH was measured using the ratiometric BCECF-AM indicator. Prior calibration was performed for each cell culture to obtain absolute pH values, as described in the Materials and Methods section. To decrease intracellular pH without pharmacological agents bathing solution was replaced by a solution with a lower pH value for 30 min, and then replaced again. As shown in Fig. 1A, this short-term extracellular acidification effectively lowered the intracellular pH. Notably, PINK1 mutant fibroblasts had a significantly lower basal pH (6.8) that dropped to more acidic levels compared to control fibroblasts upon extracellular acidification. No differences were found between control and LRRK2 mutant fibroblasts in pH response behavior. As we have shown earlier [18], the addition of lactate and pyruvate in the form of sodium salts leads to a short-term (10–20 min) reversible acidification of the intracellular medium in neuroblastoma cells. Here we also examined how 24-h lactate/pyruvate supplementation affected intracellular pH (Fig. 1B). Lactate/pyruvate addition lowered intracellular pH in LRRK2 mutants to 7.0 and PINK1 mutants to 6.6, but did not alter pH in control fibroblasts.
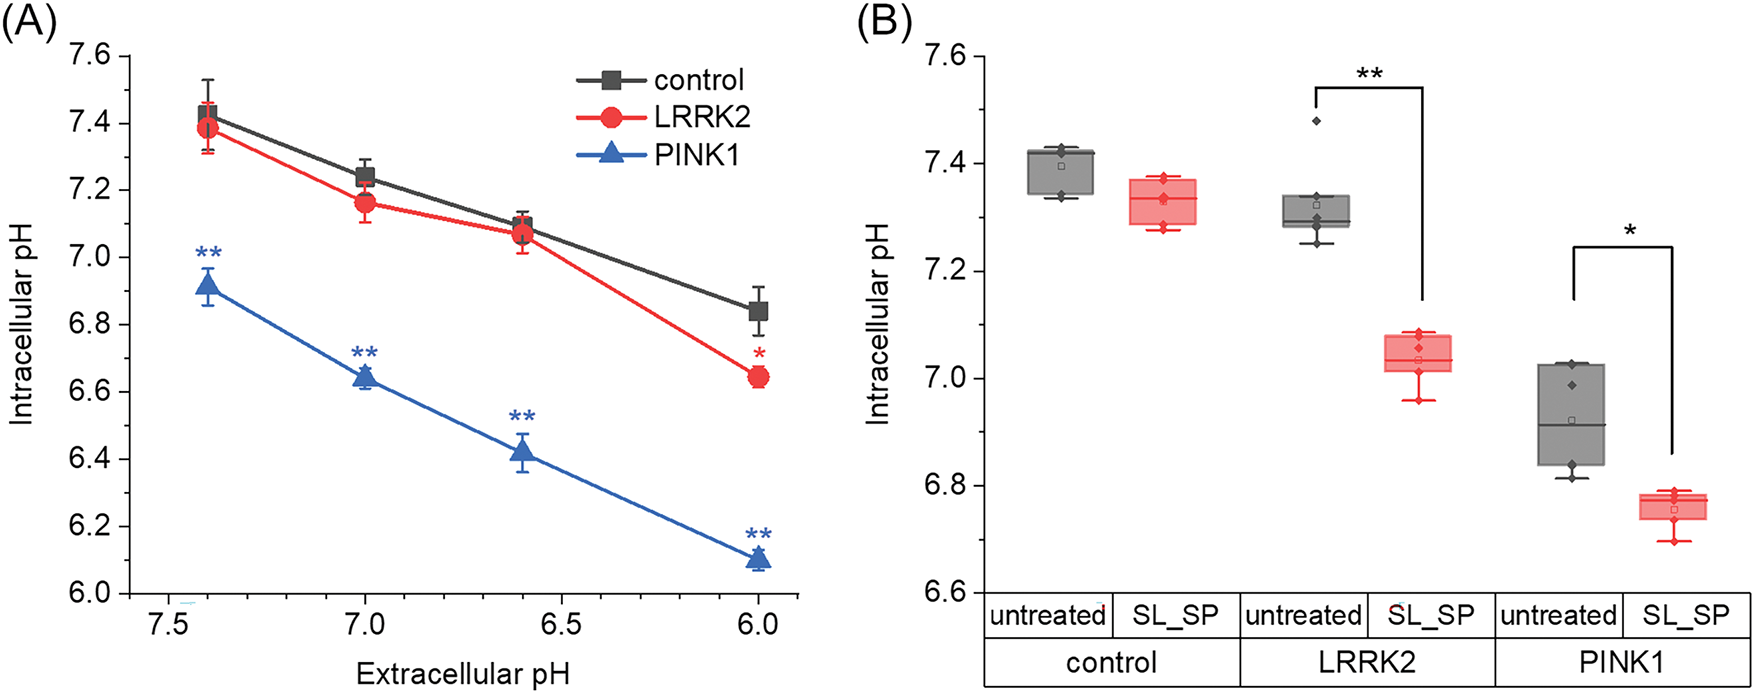
Figure 1: Changes in intracellular pH as a function of the extracellular medium and combined sodium lactate (SL, 10 mM) and sodium pyruvate (SP, 10 mM) supplementation. A) Maximal changes in intracellular pH in control fibroblasts and fibroblasts with LRRK2 and PINK1 after the extracellular medium was acidified for 30 min (*p < 0.05, **p < 0.01 compared to control cells). B) The effects of sodium lactate (10 mM) and sodium pyruvate (10 mM) on intracellular pH level in control fibroblasts and fibroblasts with LRRK2 and PINK1 after 24 h incubation with sodium lactate (SL) and sodium pyruvate (SP). n = 4 independent experiments. Statistical significance of intracellular pH for untreated and lactate and pyruvate-treated cells was determined using Student’s unpaired t-criterion (*p < 0.05, **p < 0.01)
Next, cell viability in culture was assessed after the investigated exposure (Fig. 2). For this purpose, the Hoechst 33342 and Propidium Iodide double staining protocol were used. When examining the number of non-viable cells in cultures, it was shown that control fibroblasts and cells with PD mutations had ~4% dead cells in control conditions. The number of dead cells in the control fibroblast culture and LRRK2 cells was not significantly altered by any type of acidification, in contrast to fibroblasts with PINK1 mutation: changing the medium from pH 6.0 for 1 h resulted in an increase in dead cells to 11.2 ± 3.0%.
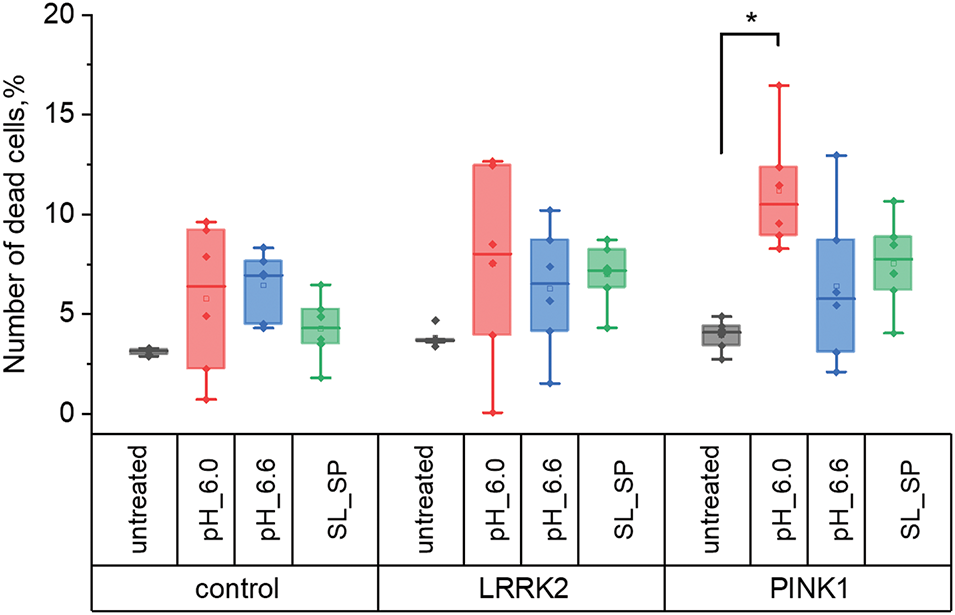
Figure 2: Number of dead cells in control fibroblasts and fibroblasts with LRRK2 and PINK1 mutations after short-term acidification mediated by replacing the extracellular medium for 30 min with pH 6.0 and 6.6, respectively, and adding sodium lactate (10 mM) and sodium pyruvate (10 mM) for 24 h, expressed as a percentage of the initial (*p < 0.05)
3.3 Mitochondrial Membrane Potential
Mitochondrial membrane potential was measured using the fluorescent probe TMRM and is presented relative to untreated control fibroblasts (Fig. 3). We found that PINK1 mutant fibroblasts exhibited a lower mitochondrial membrane potential of 89 ± 17% compared to control ones, while LRRK2 mutants had an elevated potential of 132 ± 10%. Direct acidification with pH 6.0 medium led to mitochondrial membrane depolarization (to 69 ± 10%, 65 ± 5%, 63 ± 8% in control, LRRK2, and PINK1 fibroblasts respectively), which was statistically significant only in LRRK2 cells. In contrast, lactate/pyruvate treatment increased mitochondrial membrane potential in mutant lines (180 ± 8% for LRRK2, 120 ± 17% for PINK1).
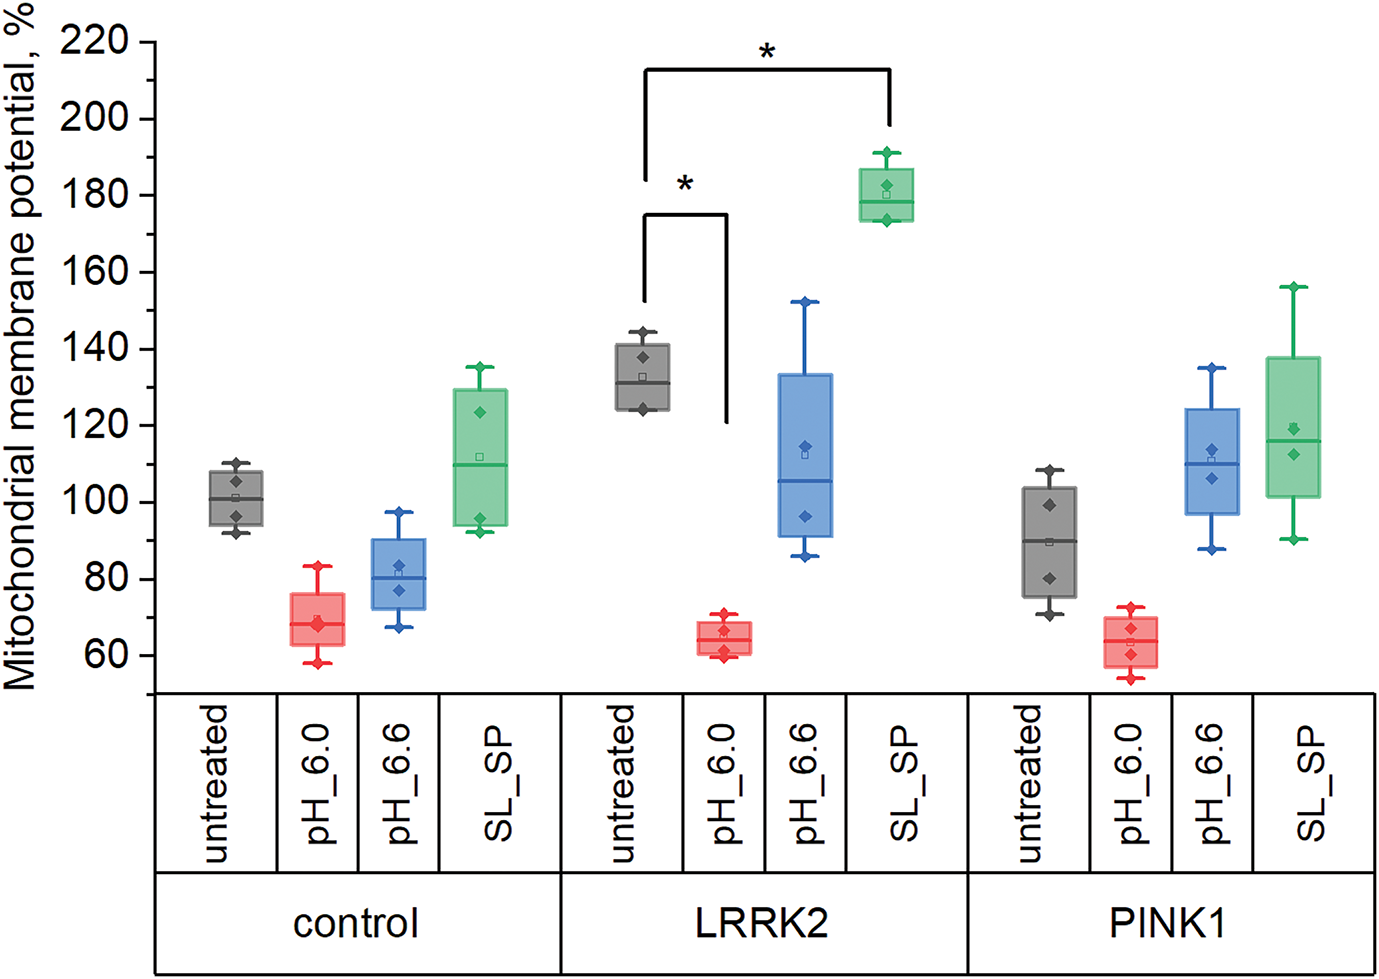
Figure 3: Mitochondrial membrane potential in control fibroblasts and fibroblasts with LRRK2 and PINK1 mutations after short-term acidification mediated by replacing the extracellular medium for 30 min with pH 6.0 and 6.6, respectively, and adding sodium lactate (10 mM) and sodium pyruvate (10 mM) for 24 h, expressed as a percentage of the initial (*p < 0.05)
We investigated how acidification induced by lowering extracellular pH to 6.0 and 6.6, as well as sodium lactate/pyruvate supplementation, impacted mitophagy activation in the studied cell lines. For this purpose, we assessed the degree of mitochondria-lysosome colocalization in confocal images (Fig. 4A–B).
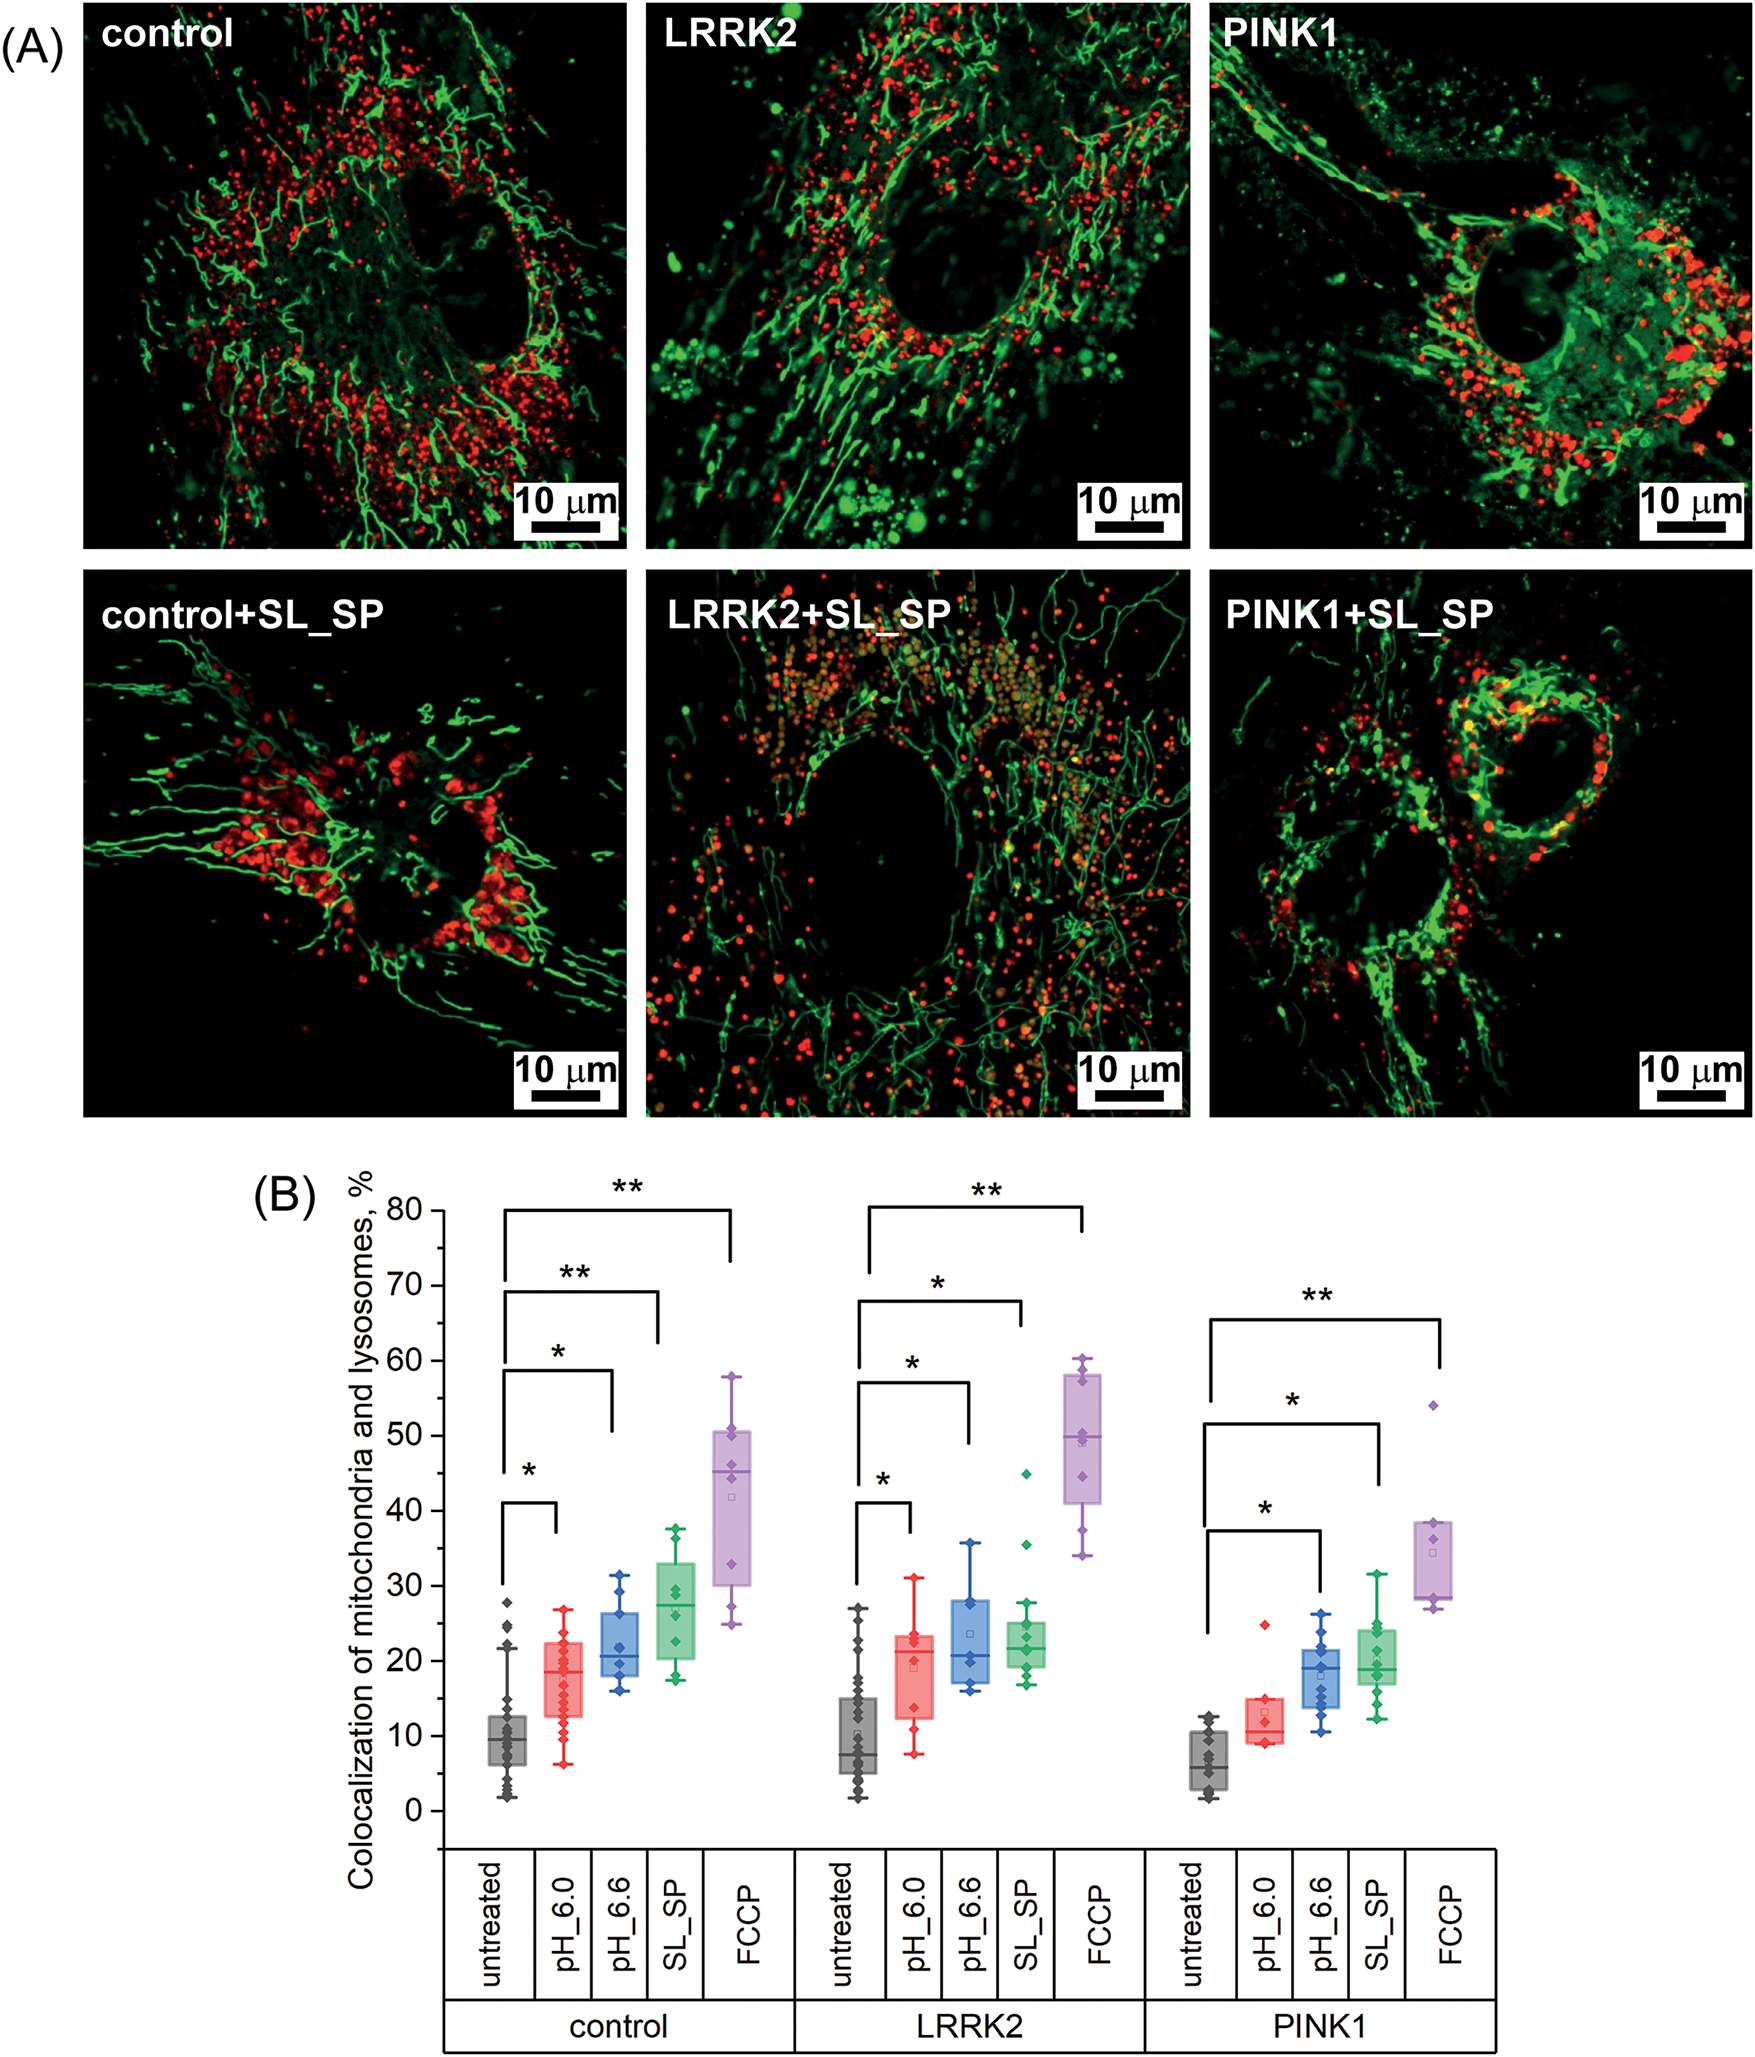
Figure 4: Effects of acidification and supplementation of sodium lactate (SL) and sodium pyruvate (SP) on mitophagy levels in control and LRRK2 and PINK1 mutant fibroblasts. A) Confocal images of control fibroblasts and fibroblasts with mutations in LRRK2 and PINK1 protein genes stained with a fluorescent probe specific to mitochondria (MitoTrtacker Green) and lysosomes (LizoTracker Red) without treatment and after the addition of sodium lactate (10 mM) and sodium pyruvate (10 mM) for 24 h. B) Percentage of mitochondrial and lysosome colocalization in control fibroblast cells and fibroblasts with LRRK2 and PINK1 protein gene mutations after short-term acidification mediated by replacing the extracellular medium for 30 min with pH 6.0 and 6.6, respectively, and adding sodium lactate (10 mM) and sodium pyruvate (10 mM) for 24 h, or after 2 h treatment with 10 μM FCCP; Statistical significance was determined using one-factor analysis of variance and Tukey’s multiple comparison criterion. Bonferroni correction was used to adjust the level of significance for multiple comparisons (*p < 0.05, **p < 0.01)
As shown in Fig. 4B, short-term extracellular acidification significantly increased mitochondria-lysosome colocalization compared to basal levels in control fibroblasts as well as LRRK2 and PINK1 mutant fibroblasts. The mitochondrial uncoupler FCCP (10 μM) was used as a positive control for maximal mitophagy induction (see Fig. S1). Specifically, lowering extracellular pH to 6.0 elevated colocalization from 10.83 ± 6.15% at baseline to 17.5 ± 5.8% in control fibroblasts, from 10.2 ± 6.2% to 19.1 ± 7.1% in LRRK2 fibroblasts, and from 6.7 ± 3.8% to 13.1 ± 6.1% in PINK1 fibroblasts. Interestingly, at the higher pH of 6.6, the increase in colocalization was even more pronounced across all fibroblast lines: control 10.83 ± 6.15% to 21.8 ± 5.4%, LRRK2 10.2 ± 6.2% to 23.5 ± 7.1%, PINK1 6.7 ± 3.8% to 18.3 ± 4.6%. Lactate/pyruvate supplementation also significantly elevated mitochondria-lysosome colocalization, to 27 ± 7.5% in controls, 24.5 ± 7.8% in LRRK2, and 20.2 ± 5.3% in PINK1 fibroblasts. Positive control treatment with the mitochondrial uncoupler FCCP for 2 h resulted in the highest colocalization levels: 41.8 ± 12% in controls, 49 ± 9.7% in LRRK2, and 34.4 ± 9.9% in PINK1 fibroblasts. These results indicate that both extracellular acidification and lactate/pyruvate are potent inducers of mitophagy across the different cell lines studied, including PD patient fibroblasts with mitochondrial dysfunction. Mitophagy activation was observed even with a mild acidification of pH 6.6. Lactate/pyruvate supplementation enhanced mitophagy to levels comparable to acidic pH treatment.
3.5 Mitochondrial Network Morphology
Our further interest was focused on how acidification affects mitochondrial network morphology. We analyzed parameters such as mitochondrial network area, the ratio of individual to network mitochondria, the branch length of mitochondria in networks, and the number of connections in mitochondrial networks.
As shown in Fig. 5A, in control fibroblasts, when extracellular pH was decreased and lactate and sodium pyruvate were added, the mitochondrial footprint area did not change significantly, whereas in cells with LRRK2 mutation, the footprint area decreased at extracellular pH 6.0 (from 1529.2 µm2 to 899.83 µm2) and when lactate and sodium pyruvate were added (from 1529.2 µm2 to 819.26 µm2). In cells with PINK1 mutation, similar changes also occurred at pH 6.0 (mitochondrial area decreases from 1373.15 µm2 to 803.82 µm2), and the addition of lactate and sodium pyruvate (from 1373.15 µm2 to 807.3 µm2). It is worth noting that despite changes in the pH of the medium, the length of mitochondria in the networks remained stable in all fibroblast cultures studied (Fig. 5C). In contrast, the average number of connections decreased upon acidification (direct and with sodium lactate and sodium pyruvate): in control fibroblasts, the number of junctions became 2.17-fold and 2.15-fold lower when the medium was replaced by medium with pH 6.0 and 6.6, respectively; in LRRK2 culture, 3.79-fold (at pH 6.0), 2.77-fold (at pH 6.6), and 1.86-fold when exposed to sodium lactate and sodium pyruvate; 3.78-fold in PINK1 cells at pH 6.0 medium, 3.66-fold at pH 6.6 medium, and 3.65-fold less when treated with sodium lactate and sodium pyruvate (Fig. 5D). These data indicate that acidification of the medium leads to a decrease in MN connectivity, which is particularly pronounced when the pH is reduced to 6.0 in cells with a mutation of the PINK1 protein gene. At the same time, the stability of mitochondrial length despite changes in MN density indicates potential inhibition of mitochondrial fusion processes under the influence of acidification.
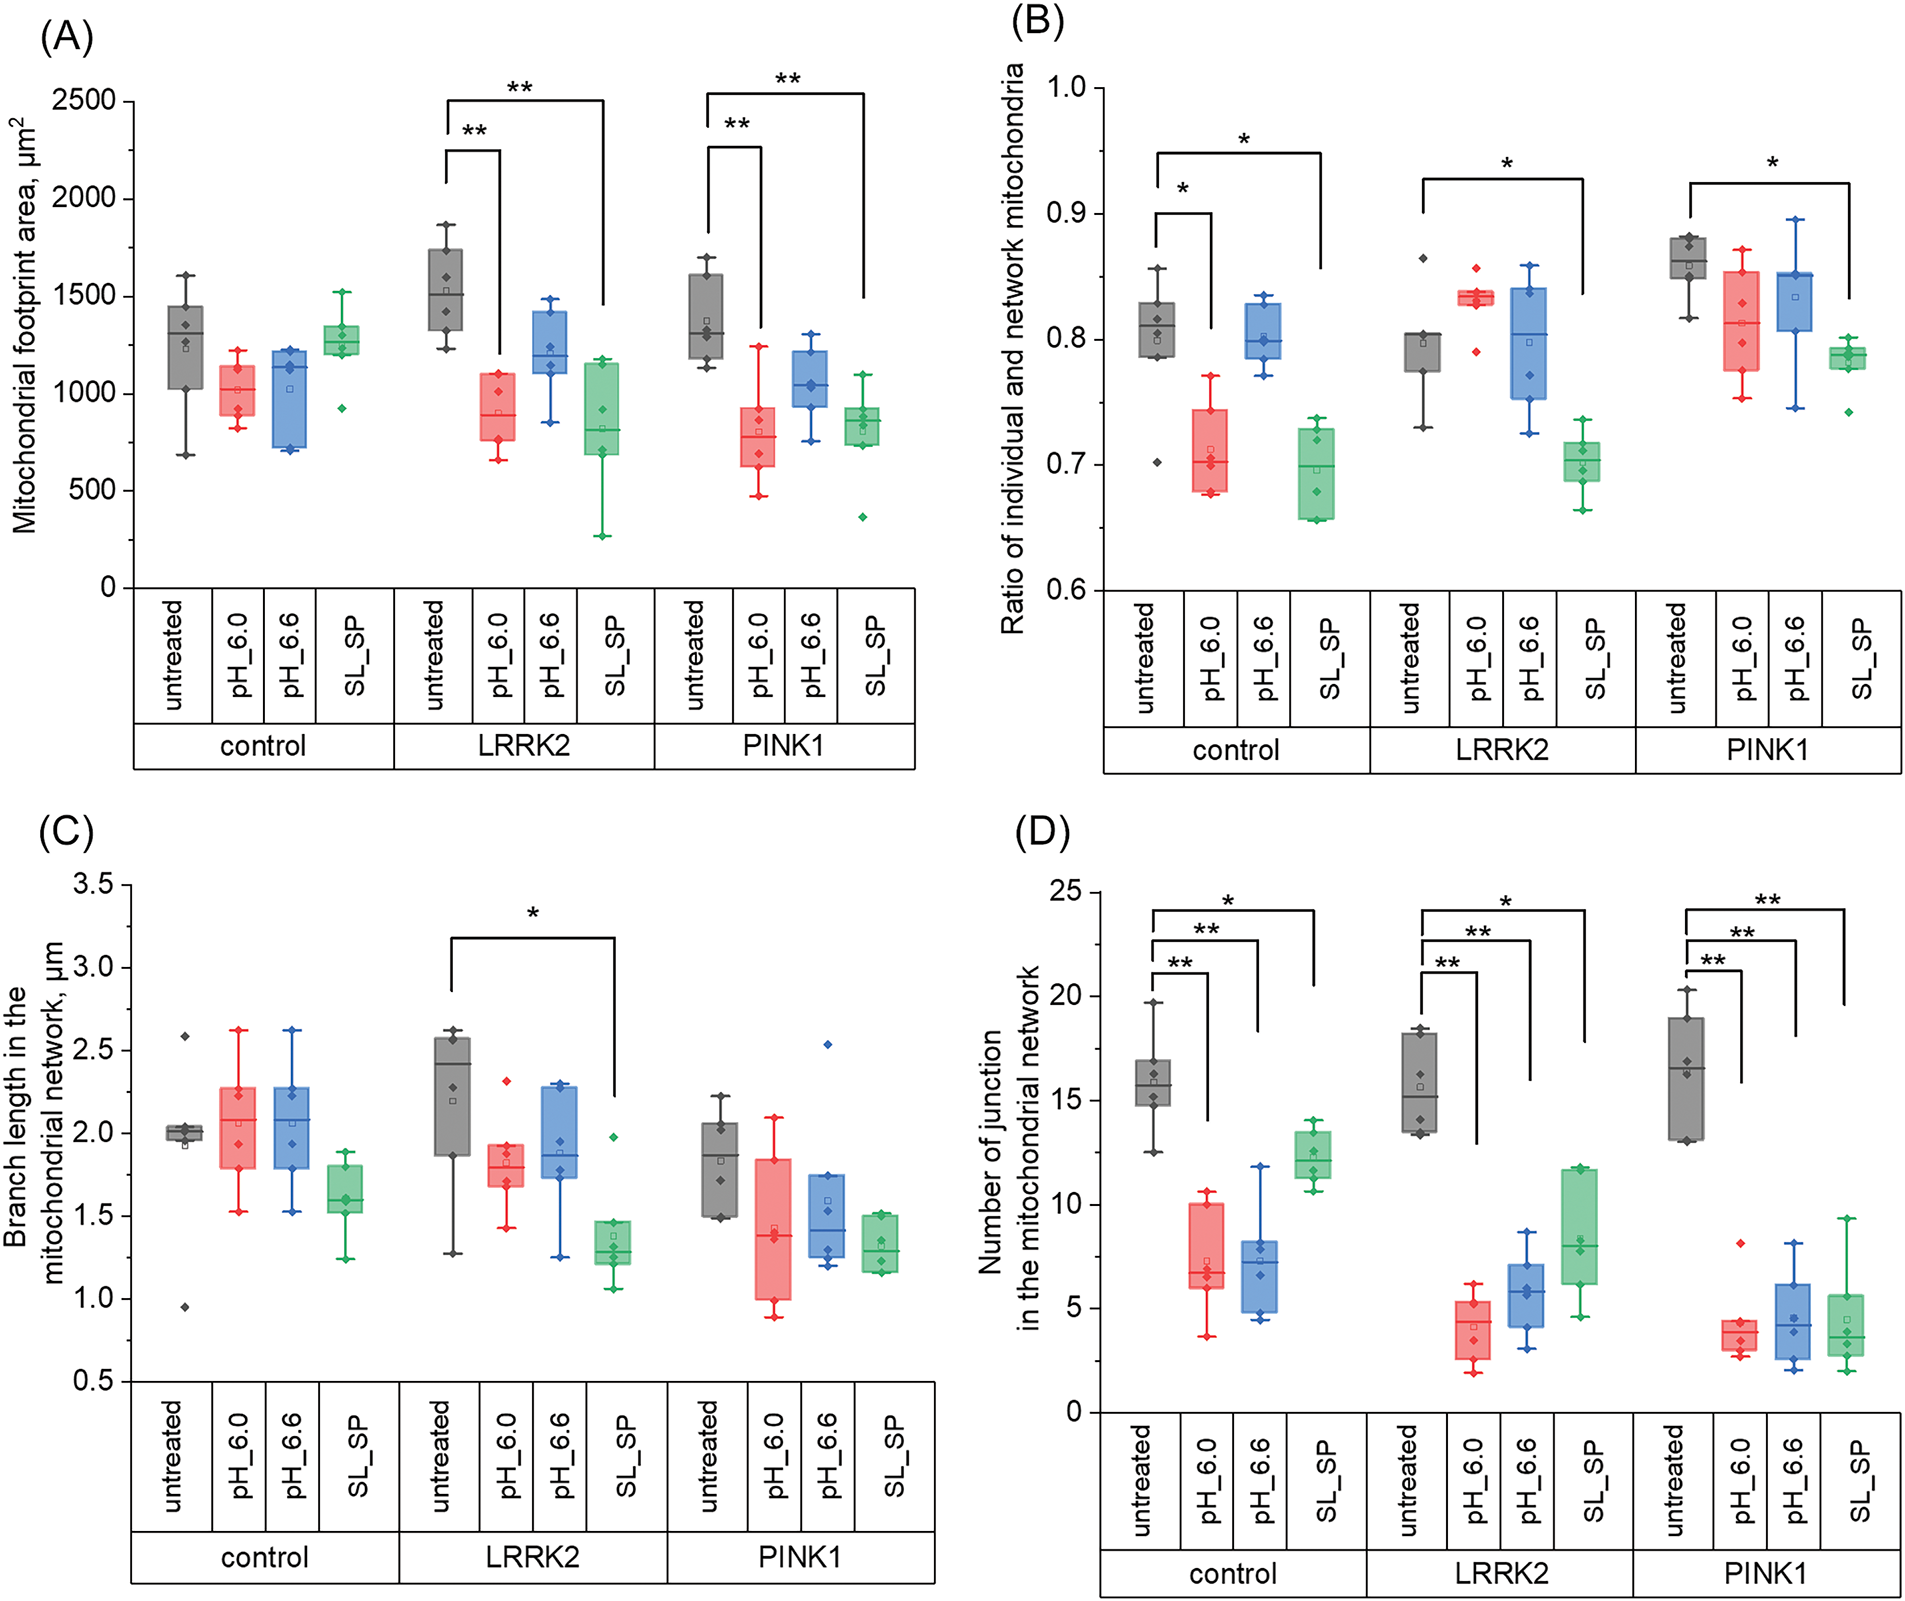
Figure 5: Effects of acidification (30 min with pH 6.0 and 6.6) and supplementation of sodium lactate (SL) and sodium pyruvate (SP) (10 mM both for 24 h) on mitochondrial network dynamics in control and LRRK2 and PINK1 mutant fibroblasts. A) Mitochondrial footprint area. B) Ratio of individual mitochondria to network mitochondria. C) Branch length in MN. D) Number of mitochondrial junctions in the network. Statistical significance was determined using one-factor analysis of variance and Tukey’s multiple comparison criterion. Bonferroni correction was used to adjust the level of significance for multiple comparisons (*p < 0.05, **p < 0.01)
We also analyzed the ratio of individual mitochondria to network mitochondria, which allows us to assess the efficiency of mitochondrial fusion and mitophagy, since the accumulation of individual mitochondria may indicate defects in these processes. In the experiment, we measured the ratios of individual mitochondria to network mitochondria in control fibroblasts and cells with mutations in the LRRK2 and PINK1 protein genes (Fig. 5B). The results showed (Fig. 5B) that the number of individual mitochondria was increased in PINK1 fibroblasts and was 0.9 ± 0.02 compared to control cells (0.79 ± 0.05) and LRRK2 cells (0.79 ± 0.04), however, after treatment of cells with lactate and sodium pyruvate, this index in PINK1 cells decreased to the level comparable with control fibroblasts (0.78 ± 0.02), and also this index significantly decreased in LRRK2 cells (0.70 ± 0.02).
3.6 Key Mitochondrial Dynamics Genes’ Expression Levels
Also, we studied how the described above morphological changes are supported on the transcriptional level. The expression levels of genes encoding proteins involved in mitochondrial dynamics were comprehensively analyzed. Mitochondrial fusion is a critical process mediated by the concerted action of Opa1, Mfn1, and Mfn2 proteins. Conversely, mitochondrial fission relies on the activities of Fis1, Drp1, and Mff. As illustrated in Fig. 6A, 24-h treatment with sodium lactate/pyruvate resulted in differential modulation of these key mitochondrial dynamics genes across the various experimental conditions. In control fibroblasts, lactate/pyruvate supplementation led to increased mRNA expression of Opa1, Mfn1, and Fis1, suggesting a potential shift towards both enhanced mitochondrial fusion and fission events. Fibroblasts carrying the LRRK2 mutation exhibited upregulated expression of Opa1, Mfn1, and Drp1 upon treatment, implying a bias towards fusion coupled with increased fission activity. Notably, in cells carrying the PINK1 mutation, lactate/pyruvate treatment augmented the expression of Opa1, Mfn1, and Fis1, mirroring the gene expression pattern observed in control cells. These findings reveal the intricate interplay between mitochondrial fusion and fission processes, which appears to be differentially modulated by lactate/pyruvate exposure across distinct genetic backgrounds.
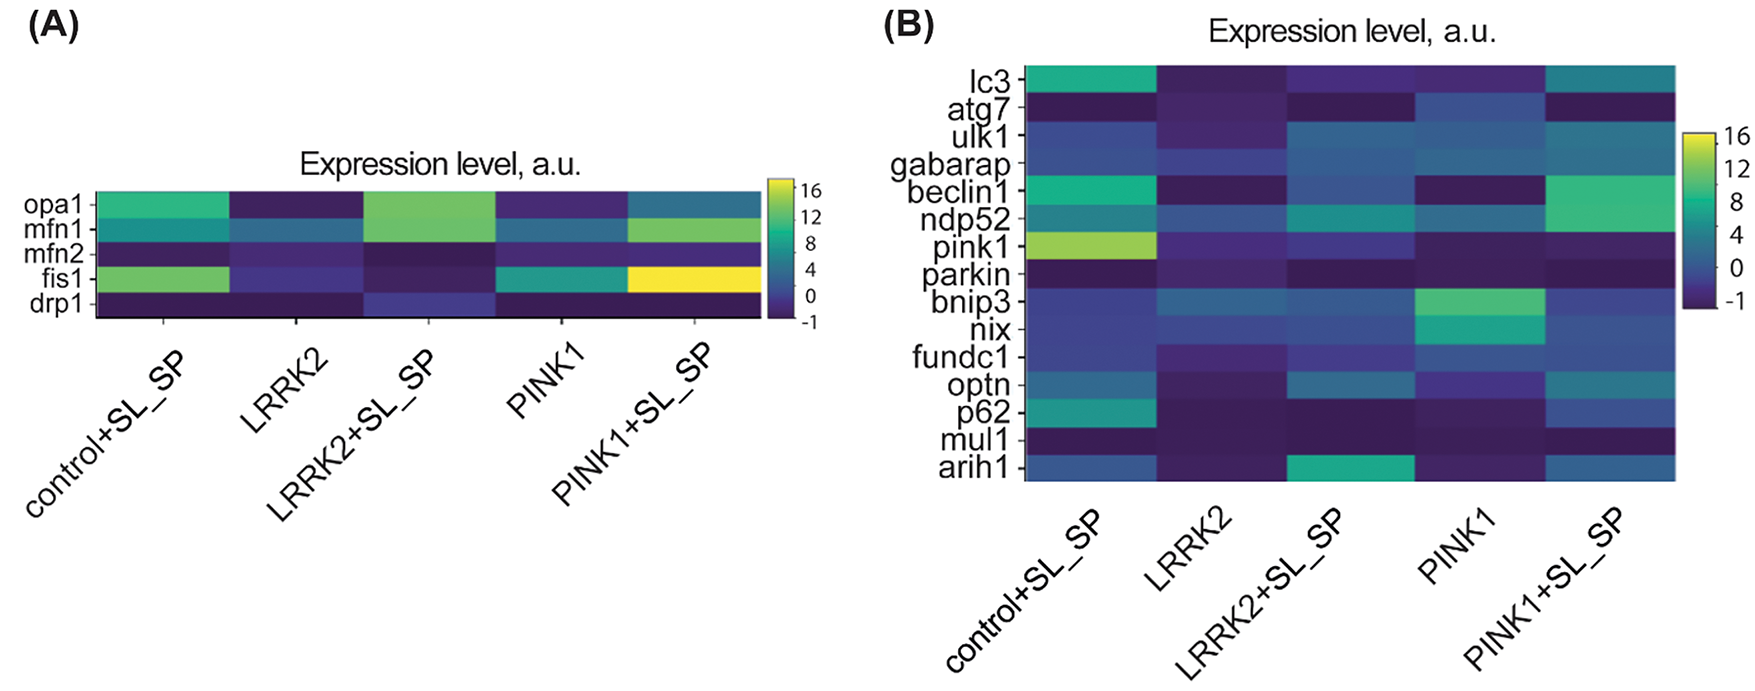
Figure 6: Relative mRNA expression levels in control and LRRK2 and PINK1 mutant fibroblasts after the addition of sodium lactate (10 mM) and sodium pyruvate (10 mM) for 24 h. A) Mitochondrial fission and fusion-related genes. B) autophagy and mitophagy-related genes; The maps use a relative expression scale where colors range from purple (low expression) to yellow (high expression)
Saving for last, we evaluated mRNA expression levels of key genes involved in mitophagy and autophagy pathways, encoding proteins such as the serine/threonine kinase PINK1 (PARK6), ubiquitin ligases Parkin (PARK2) and Arih1, autophagy receptor adapters p62 (SQSTM1), Optineurin (OPTN), NDP52 (CALCOCO2), autophagosome formation proteins LC3, ATG7, ULK1, GABARAP, Beclin1, as well as mitophagy receptors NIX (BNIP3L), BNIP3, and FUNDC1 (Fig. 6B). In untreated PINK1 mutant fibroblasts compared to untreated control fibroblasts, we observed increased expression of mitophagy markers Optineurin, NDP52, BNIP3, NIX, FUNDC1, as well as autophagy genes ATG7, ULK1, and GABARAP. LRRK2 mutant fibroblasts showed elevated mRNA levels of NDP52, GABARAP, BNIP3, and NIX. These data indicate induction of mitophagy in the mutant fibroblast lines, likely through an alternative BNIP3/NIX receptor-mediated pathway commonly associated with stress and hypoxic conditions [28] Interestingly, upon lactate/pyruvate treatment, control fibroblasts exhibited increased expression of PINK1, ARIH1, p62, OPTN, NDP52, and Beclin1 compared to untreated controls. In LRRK2 fibroblasts, lactate/pyruvate upregulated ARIH1, OPTN, NDP52, and ULK1. While in PINK1 mutants, ARIH1, p62, OPTN, LC3, ULK1, and Beclin1 were induced. These findings suggest that lactate/pyruvate supplementation can enhance the expression of mitophagy and autophagy genes, potentially through different mechanisms in control vs. PD mutant cells. The data also highlights distinct patterns of altered basal expression between LRRK2 and PINK1 mutant lines. Overall, our gene expression analysis supports the premise that lactate/pyruvate treatment, and potentially intracellular acidification, can activate mitochondrial quality control pathways disrupted in PD.
Parkinson’s disease is one of the most common neurodegenerative disorders in which there is a progressive loss of dopaminergic neurons in the substantia nigra, resulting in motor impairment that progresses over time. The etiology of this pathology is still unknown, but there are several different elements involved in the neurodegenerative processes that influence each other [29]. PD includes genetic [30], environmental, and toxicological factors, but oxidative damage and mitochondrial dysfunction are thought to play a central role in the cascade of events leading to the degeneration of dopaminergic neurons. Consequently, in conditions of oxidative stress, so characteristic of many pathologies, it is especially important to investigate the potential of pharmacological agents capable of modulating cellular defense mechanisms, including the Mitochondrial quality control system [31]. In the present study, we investigated the effects of sodium lactate and sodium pyruvate in comparison with direct acidification caused by short-term replacement of the extracellular medium in fibroblast models carrying mutations in proteins involved in autophagy (LRRK2) and mitophagy (PINK1).
Fibroblasts are the only available (unlike neurons) source of living cells from patients with genetic forms of PD, which allows them to be cultured for long periods of time and to perform multiple experiments studying pathogenetic mechanisms in a natural genomic context. It has been shown that the key mitochondrial dysfunctions observed in PD (alterations in fusion/fission processes, mitophagy abnormalities, oxidative stress) are evident not only in neurons but also in fibroblasts, possibly due to the fact that the basic mechanisms of regulation of mitochondrial dynamics are conservative across cell types [32]. At the same time, it is clear that different types of neurons can demonstrate different sensitivity to mitochondrial dysfunction depending on their features.
One of the first completion of this study is that short-term extracellular acidification, mediated by a decrease in the pH of the incubation medium, in a similar way to lactate and sodium pyruvate, changed the dynamics of MN and induced mitophagy, but in the first case, it could be toxic and lead to cell death. In particular, with a decrease in pH to 6.0 and 6.6, as well as the addition of lactate and sodium pyruvate in MN control and mutant fibroblasts, the connectivity of MN decreased, and the ratio of individual and network mitochondria decreased (Fig. 5). In addition, direct acidification and the addition of sodium lactate and pyruvate led to an increase in the level of colocalization of mitochondria and lysosomes in control and mutant fibroblasts (Fig. 4). Despite the similarity of the effects on MN, even a short-term change in extracellular pH to 6.0 contributed to a decrease in mitochondrial membrane potential and an increase in the number of necrotic cells in the culture of PINK1 mutant fibroblasts (Figs. 2 and 3). On the contrary, the addition of lactate and sodium pyruvate significantly increased the mitochondrial membrane potential in LRRK2 fibroblasts (Fig. 3). It is possible that pH stress, in the case of a decrease in pH to 6.0, activated mitophagy due to depolarization of the mitochondrial membrane, which can lead to cell death. Thus, similar external effects in the case of the addition of lactate and sodium pyruvate may have a protective effect, and direct acidification may be toxic.
Secondly, we can conclude that in our experiments, the addition of lactate or pyruvate led to mitophagy activation through different mechanisms in control and mutant fibroblasts. Currently, two pathways of mitophagy are known: PINK1/Parkin-dependent and PINK1/Parkin-independent (alternative, receptor-mediated) [33]. Interestingly, the expression of mRNA genes of proteins associated with receptor-mediated mitophagy was initially increased in PINK1 fibroblasts (Fig. 6B), which may be related to the compensatory function of the alternative pathway, as previously shown in PINK1-related mutations in patients with PD [29]. When lactate and sodium pyruvate were added, the mRNA expression level of the PINK1 protein gene increased in control fibroblasts and mutant LRRK2 fibroblasts, but this did not happen in the case of PINK1 mutant fibroblasts, which, on the contrary, the mRNA expression levels of the Bnip3 and Nix protein genes associated with receptor-mediated mitophagy increased (Fig. 6B).
The changes described above may be explained by the different temporal, chemical, and cellular aspects. The mechanism by which lactate and pyruvate induce intracellular acidification involves several interconnected pathways. Lactate and pyruvate enter cells via monocarboxylate transporter (MCT) by a proton-coupled mechanism. This co-transport system moves one proton along with each lactate/pyruvate molecule, directly contributing to cytosolic acidification. The combined influx of lactate and pyruvate with protons can temporarily overwhelm cellular pH homeostatic mechanisms to create a gradual acidification window that appears sufficient to trigger mitophagy-related pathways, whereas direct acidification represents pure stress without compensatory benefits. These benefits may occur because lactate and pyruvate serve not only as acidifying agents but also as essential metabolic substrates. This may explain why lactate and pyruvate treatment produces more favorable outcomes compared to direct acidification, particularly in PINK1 mutant cells, where we observed different effects on cell viability and mitochondrial membrane potential.
Our findings provide important therapeutic implications for PD treatment. The demonstration that lactate and pyruvate can safely activate mitophagy through transient acidification suggests a promising metabolic approach to treating PD, particularly valuable for patients with PINK1 mutations, where we observed the activation of alternative mitophagy pathways. From a practical therapeutic perspective, both lactate and pyruvate are naturally occurring metabolites with established safety profiles. Their ability to induce mild acidification offers a gentler alternative to direct pH manipulation, potentially reducing side effects while maintaining therapeutic efficacy. These compounds could potentially be administered as dietary supplements undergo increased production in an organism or be combined with existing PD treatments or even in other neurodegenerative disorders, which are also being actively investigated [34,35].
Our findings provide insight into how pH modulation may serve as a mechanism to enhance mitophagy and mitochondrial integrity, which could have therapeutic implications for PD and other mitochondrial disorders.
Acknowledgement: The authors thank Optical Microscopy and Spectrophotometry core facility of ICB RAS at the Federal Research Center “Pushchino Scientific Center for Biological Research of the Russian Academy of Sciences” for technical support.
Funding Statement: This work was supported by the Ministry of Science and Higher Education of the Russian Federation in the Framework of State Assignment of PSCBR RAS 075-00609-24-01 (No. 1022080100047-5-1.6.4, Neuroprotective drugs of a new generation).
Author Contributions: The authors confirm contribution to the paper as follows: study conception and design: Alexey V. Berezhnov, Kristina A. Kritskaya; data collection: Kristina A. Kritskaya, Evgeniya I. Fedotova; analysis and interpretation of results: Alexey V. Berezhnov, Kristina A. Kritskaya, Evgeniya I. Fedotova; Alexander D. Nadeev; draft manuscript preparation: Alexander D. Nadeev, Kristina A. Kritskaya. All authors reviewed the results and approved the final version of the manuscript.
Availability of Data and Materials: The data that support the findings of this study are available from the corresponding author upon reasonable request.
Ethics Approval: Not applicable.
Conflicts of Interest: The authors declare no conflicts of interest to report regarding the present study.
Supplementary Materials: The supplementary material is available online at https://doi.org/10.32604/biocell.2025.061624.
References
1. Rocca WA. The burden of Parkinson’s disease: a worldwide perspective. Lancet Neurol. 2018;17(11):928–9. doi:10.1016/S1474-4422(18)30355-7. [Google Scholar] [PubMed] [CrossRef]
2. Dorsey ER, Sherer T, Okun MS, Bloem BR. The emerging evidence of the Parkinson pandemic. J Parkinsons Dis. 2018;8(s1):S3–8. doi:10.3233/JPD-181474. [Google Scholar] [PubMed] [CrossRef]
3. Luo Y, Qiao L, Li M, Wen X, Zhang W, Li X. Global, regional, national epidemiology and trends of Parkinson’s disease from 1990 to 2021: findings from the global burden of disease study 2021. Front Aging Neurosci. 2025;16:1498756. doi:10.3389/fnagi.2024.1498756. [Google Scholar] [PubMed] [CrossRef]
4. Schnabel J. Secrets of the shaking palsy. Nature. 2010;466(7310):S2–5. doi:10.1038/466S2b. [Google Scholar] [PubMed] [CrossRef]
5. Hang L, Thundyil J, Lim K. Mitochondrial dysfunction and Parkinson disease: a Parkin-AMPK alliance in neuroprotection. Ann N Y Acad Sci. 2015;1350(1):37–47. doi:10.1111/nyas.12820. [Google Scholar] [PubMed] [CrossRef]
6. Goiran T, Eldeeb MA, Zorca CE, Fon EA. Hallmarks and molecular tools for the study of mitophagy in Parkinson’s disease. Cells. 2022;11(13):2097. doi:10.3390/cells11132097. [Google Scholar] [PubMed] [CrossRef]
7. Rugarli EI, Langer T. Mitochondrial quality control: a matter of life and death for neurons. EMBO J. 2012;31(6):1336–49. doi:10.1038/emboj.2012.38. [Google Scholar] [PubMed] [CrossRef]
8. Georgakopoulos ND, Wells G, Campanella M. The pharmacological regulation of cellular mitophagy. Nat Chem Biol. 2017;13(2):136–46. doi:10.1038/nchembio.2287. [Google Scholar] [PubMed] [CrossRef]
9. Masaldan S, Callegari S, Dewson G. Therapeutic targeting of mitophagy in Parkinson’s disease. Biochem Soc Trans. 2022;50(2):783–97. doi:10.1042/BST20211107. [Google Scholar] [PubMed] [CrossRef]
10. Hong WL, Huang H, Zeng X, Duan CY. Targeting mitochondrial quality control: new therapeutic strategies for major diseases. Mil Med Res. 2024;11(1):59. doi:10.1186/s40779-024-00556-1. [Google Scholar] [PubMed] [CrossRef]
11. Pavlova JA, Guseva EA, Dontsova OA, Sergiev PV. Natural activators of autophagy. Biochem Mosc. 2024;89(1):1–26. doi:10.1134/S0006297924010012. [Google Scholar] [PubMed] [CrossRef]
12. Berezhnov AV, Soutar MPM, Fedotova EI, Frolova MS, Plun-Favreau H, Zinchenko VP, et al. Intracellular pH modulates autophagy and mitophagy. J Biol Chem. 2016;291(16):8701–8. doi:10.1074/jbc.M115.691774. [Google Scholar] [PubMed] [CrossRef]
13. Komilova NR, Angelova PR, Berezhnov AV, Stelmashchuk OA, Mirkhodjaev UZ, Houlden H, et al. Metabolically induced intracellular pH changes activate mitophagy, autophagy, and cell protection in familial forms of Parkinson’s disease. FEBS J. 2022;289(3):699–711. doi:10.1111/febs.16198. [Google Scholar] [PubMed] [CrossRef]
14. Walton ZE, Brooks RC, Dang CV. mTOR senses intracellular pH through lysosome dispersion from RHEB. BioEssays. 2019;41(7):1800265. doi:10.1002/bies.201800265. [Google Scholar] [PubMed] [CrossRef]
15. Freeman SA, Grinstein S, Orlowski J. Determinants, maintenance, and function of organellar pH. Physiol Rev. 2023;103(1):515–606. doi:10.1152/physrev.00009.2022. [Google Scholar] [PubMed] [CrossRef]
16. Li TY, Wang Q, Gao AW, Li X, Sun Y, Mottis A, et al. Lysosomes mediate the mitochondrial UPR via mTORC1-dependent ATF4 phosphorylation. Cell Discov. 2023 7;9(1):92. doi:10.1038/s41421-023-00589-1. [Google Scholar] [PubMed] [CrossRef]
17. Bagnoli E, Lin YE, Burel S, Jaimon E, Antico O, Themistokleous C, et al. Endogenous LRRK2 and PINK1 function in a convergent neuroprotective ciliogenesis pathway in the brain. Proc Natl Acad Sci U S A. 2025;122(5):e2412029122. doi:10.1073/pnas.2412029122. [Google Scholar] [PubMed] [CrossRef]
18. Fedotova EI, Dolgacheva LP, Abramov AY, Berezhnov AV. Lactate and pyruvate activate autophagy and mitophagy that protect cells in toxic model of Parkinson’s disease. Mol Neurobiol. 2022;59(1):177–90. doi:10.1007/s12035-021-02583-8. [Google Scholar] [PubMed] [CrossRef]
19. Cai M, Wang H, Song H, Yang R, Wang L, Xue X, et al. Lactate is answerable for brain function and treating brain diseases: energy substrates and signal molecule. Front Nutr. 2022;9:800901. doi:10.3389/fnut.2022.800901. [Google Scholar] [PubMed] [CrossRef]
20. Olek RA, Kujach S, Radak Z. Current knowledge about pyruvate supplementation: a brief review. Sports Med Health Sci. 2024;6(4):295–301. doi:10.1016/j.smhs.2024.02.007. [Google Scholar] [PubMed] [CrossRef]
21. Bliss TM, Ip M, Cheng E, Minami M, Pellerin L, Magistretti P, et al. Dual-gene, dual-cell type therapy against an excitotoxic insult by bolstering neuroenergetics. J Neurosci. 2004;24(27):6202–8. [Google Scholar] [PubMed]
22. Zilberter Y, Gubkina O, Ivanov AI. A unique array of neuroprotective effects of pyruvate in neuropathology. Front Neurosci. 2015;9:17. [Google Scholar] [PubMed]
23. Jourdain P, Allaman I, Rothenfusser K, Fiumelli H, Marquet P, Magistretti PJ. L-Lactate protects neurons against excitotoxicity: implication of an ATP-mediated signaling cascade. Sci Rep. 2016;6:21250. [Google Scholar] [PubMed]
24. Álvarez Z, Castaño O, Castells AA, Mateos-Timoneda MA, Planell JA, Engel E, et al. Neurogenesis and vascularization of the damaged brain using a lactate-releasing biomimetic scaffold. Biomaterials. 2014;35(17):4769–81. [Google Scholar] [PubMed]
25. Cerina M, Levers M, Keller JM, Frega M. Neuroprotective role of lactate in a human in vitro model of the ischemic penumbra. Sci Rep. 2024;14(1):7973. [Google Scholar] [PubMed]
26. Khosravi P, Shahidi F, Eskandari A, Khoramipour K. High-intensity interval training reduces Tau and beta-amyloid accumulation by improving lactate-dependent mitophagy in rats with type 2 diabetes. Iran J Basic Med Sci. 2024;27(11):1430–9. [Google Scholar] [PubMed]
27. Kritskaya KA, Fedotova EI, Berezhnov AV. Impaired mitochondrial network morphology and reactive oxygen species production in fibroblasts from Parkinson’s disease patients. Biomedicines. 2024;12(2):282. doi:10.3390/biomedicines12020282. [Google Scholar] [PubMed] [CrossRef]
28. Zhang J, Ney PA. Role of BNIP3 and NIX in cell death, autophagy, and mitophagy. Cell Death Differ. 2009;16(7):939–46. doi:10.1038/cdd.2009.16. [Google Scholar] [PubMed] [CrossRef]
29. Dolgacheva LP, Zinchenko VP, Goncharov NV. Molecular and cellular interactions in pathogenesis of sporadic Parkinson disease. Int J Mol Sci. 2022;23(21):13043. doi:10.3390/ijms232113043. [Google Scholar] [PubMed] [CrossRef]
30. Liu T, Hao Y, Zhao L. Pathogenic genes associated with parkinson’s disease: molecular mechanism overview. BIOCELL. 2024;48(5):707–29. doi:10.32604/biocell.2024.049130. [Google Scholar] [CrossRef]
31. Shen X, Sun P, Zhang H, Yang H. Mitochondrial quality control in the brain: the physiological and pathological roles. Front Neurosci. 2022;16:1075141. doi:10.3389/fnins.2022.1075141. [Google Scholar] [PubMed] [CrossRef]
32. Henrich MT, Oertel WH, Surmeier DJ, Geibl FF. Mitochondrial dysfunction in Parkinson’s disease—a key disease hallmark with therapeutic potential. Mol Neurodegener. 2023;18(1):83. doi:10.1186/s13024-023-00676-7. [Google Scholar] [PubMed] [CrossRef]
33. Palikaras K, Lionaki E, Tavernarakis N. Mechanisms of mitophagy in cellular homeostasis, physiology and pathology. Nat Cell Biol. 2018;20(9):1013–22. doi:10.1038/s41556-018-0176-2. [Google Scholar] [PubMed] [CrossRef]
34. Yamagata K. Lactate supply from astrocytes to neurons and its role in ischemic stroke-induced neurodegeneration. Neuroscience. 2022;481:219–31. doi:10.1016/j.neuroscience.2021.11.035. [Google Scholar] [PubMed] [CrossRef]
35. Zhang Y, Tong L, Ma L, Ye H, Zeng S, Zhang S, et al. Progress in the research of lactate metabolism disruption and astrocyte-neuron lactate shuttle impairment in schizophrenia: a comprehensive review. Adv Biol. 2024;8(6):e2300409. doi:10.1002/adbi.202300409. [Google Scholar] [PubMed] [CrossRef]
Cite This Article
 Copyright © 2025 The Author(s). Published by Tech Science Press.
This work is licensed under a Creative Commons Attribution 4.0 International License , which permits unrestricted use, distribution, and reproduction in any medium, provided the original work is properly cited.
 Downloads
 Citation Tools