
 Submit a Paper
 Propose a Special lssue
 Open Access
ARTICLE
Exploring the Role of SGK1 in Kidney Physiology: Insights from Transcriptomic Analysis
1 Division of Cardiovascular Surgery, Department of Surgery, Kaohsiung Veterans General Hospital, Kaohsiung, 813414, Taiwan
2 Department of Laboratory Medicine, Zuoying Armed Forces General Hospital, Kaohsiung, 813204, Taiwan
3 Department of Medical Education and Research, Kaohsiung Veterans General Hospital, Kaohsiung, 813414, Taiwan
* Corresponding Author: Hsin-Hung Chen. Email:
# Chieh-Jen Wu and Yu-He Li contributed equally to this work
(This article belongs to the Special Issue: Heart-Kidney Interactions: Mechanisms in Metabolic Dysfunction and Organ Injury)
BIOCELL 2025, 49(5), 857-872. https://doi.org/10.32604/biocell.2025.064071
Received 04 February 2025; Accepted 18 April 2025; Issue published 27 May 2025
 View Full Text
 Download PDF
Abstract
Background: Serum- and glucocorticoid-induced kinase 1 (SGK1) is a member of the serine/threonine kinase family, playing a crucial role in regulating ion channel function, hormone secretion, cellular growth, survival mechanisms, and neuronal activity. SGK1 is implicated in kidney diseases, hypertension, and metabolic syndromes, influencing salt intake, renal growth, and renal potassium (K+) excretion during mineralocorticoid overdose. Although SGK1’s renal functions have been explored, comprehensive identification of SGK1-related genes and signaling cascades remains limited. Objectives: This research sought to explore the cellular mechanisms and signaling pathways influenced by SGK1 in rat kidney cells. Methods: NRK-52E cells, derived from rat kidneys, were exposed to the SGK1 inhibitor GSK 650394 (GSK) at doses of 50, 100, and 200 μM. A comparative transcriptomic approach was employed, utilizing mRNA sequencing (RNA-seq) and differential gene expression (DEG) analysis. To investigate key signaling pathways and molecular mechanisms, analyses including Gene Ontology (GO), Kyoto Encyclopedia of Genes and Genomes (KEGG), and Gene Set Enrichment Analysis (GSEA) were carried out. Results: In total, 13,987 genes were detected, with differential expression observed across treatment groups. Specifically, 749 DEGs (401 upregulated, 348 downregulated) were identified in the 50 μM group, 2267 DEGs (897 upregulated, 1370 downregulated) in the 100 μM group, and 5631 DEGs (2547 upregulated, 3084 downregulated) in the 200 μM group. A total of 176 DEGs were consistently present across all treatment groups (adjusted p-value < 0.05; |log2 fold change| > 1). Enrichment analysis revealed that these genes play a significant role in pathways potentially associated with SGK1 regulation. Conclusion: Through RNA-seq and DEG analysis, potential target genes and signaling pathways influenced by SGK1 in rat kidney cells were identified, providing a basis for future investigations into SGK1-associated molecular mechanisms and physiological roles in the kidney.Keywords
Serum- and glucocorticoid-induced kinase 1 (SGK1) was initially discovered in rat mammary tumor cells [1]. A key serine/threonine kinase regulates kidney function [2]. SGK1 is broadly expressed across various tissues, and its transcription is modulated by osmotic pressure fluctuations in response to hormones like glucocorticoids and mineralocorticoids [3]. Additionally, SGK1 is recognized as a potent modulator of metabolism, transcription, enzymatic activity, and renal transport functions [4]. Insulin also influences SGK1 regulation [5], particularly in sodium chloride (NaCl) balance, where SGK1 plays a crucial role in regulating the epithelial sodium channel (ENaC) within the cortical collecting duct [6]. SGK1 acts as an early response gene to aldosterone, enhancing the apical membrane expression of ENaC and increasing sodium ion (Na+) absorption in renal collecting duct cells [7]. Moreover, SGK1 stimulates various renal tubular transport proteins to maintain electrolyte balance.
SGK1 engages with the renal outer medullary K+ channel (ROMK), a key potassium (K+) secretion channel located at the apical membrane of the distal nephron [7]. The currently known SGK1 modulates ROMK function/expression through three distinct mechanisms: 1. SGK1 phosphorylates ROMK1 at Ser44, leading to increased plasma membrane abundance [8]. 2. This effect is additionally influenced by the Na+/H+ exchange regulatory factor 2 (NHERF2) [9], implying that SGK1 facilitates ROMK1 trafficking and its presence on the cell surface. 3. SGK1 phosphorylates WNK4 at Ser1169 [10] and Ser1196 [11], preventing clathrin-mediated endocytosis of ROMK2 and thereby increasing its expression at the plasma membrane [12]. A prior study by Estilo et al. indicated that aldosterone has no regulatory effect on BK function in cortical collecting duct (CCD) cells [13]. Nevertheless, other studies have reported that aldosterone enhances BK mRNA expression, promotes its luminal presence, and facilitates K+ secretion in the mouse colon [14]. The variation among these studies is probably attributable to differences in aldosterone stimulation approaches: CCD research utilized a low-Na+ diet, while colonic studies implemented a high-K+ diet. Subsequent mouse studies confirmed that a high-K+ diet stimulates aldosterone, and mineralocorticoid receptor (MR) blockade significantly reduces BK expression [15]. Subsequent studies revealed that, even in conditions of low-Na+ and high-K+ diets, adrenalectomized mice receiving low aldosterone supplementation showed reduced BK expression compared to controls, reinforcing aldosterone’s function in BK upregulation [16]. The influence of SGK1 on BK function is still being explored. A 2017 study analyzing SGK1-knockout and control mice observed that whole-cell BK current remained unchanged, even under a high-K+ diet [17]. Moreover, in SGK1-knockout mice maintained on a high-K+ diet, whole-cell ROMK current, amiloride-sensitive Na+ current, and Na+ excretion showed no significant alterations. These results were unexpected, as ENaC surface expression was diminished under comparable conditions [17]. In a rat ischemia/reperfusion kidney injury model, SGK1 was found to be overexpressed and activated, demonstrating its protective effect against hypoxia/reoxygenation damage by promoting autophagy [18]. While these findings highlight SGK1’s physiological importance, a comprehensive understanding of its downstream regulatory network remains lacking.
This study investigates SGK1-associated genes and signaling pathways in renal epithelial cells to bridge this gap using an in vitro approach. In this study, SGK1 activity will be suppressed using the SGK1 inhibitor GSK 650394 (GSK) in NRK-52E, a rat kidney epithelial cell line. To identify genes influenced by SGK1 inhibition, RNA sequencing (RNA-seq) and differential gene expression (DEG) analysis will be conducted. Subsequently, bioinformatics approaches, including gene set enrichment analysis (GSEA), will be applied to uncover potential cellular mechanisms and signaling pathways associated with SGK1 regulation. This approach aims to expand the understanding of SGK1’s molecular functions in renal physiology and pathology.
NRK-52E, a rat kidney epithelial cell line, was procured from the Bioresource Collection and Research Center, Taiwan Food Industry Research Institute (BCRC, 60086, Hsinchu, Taiwan). The cells were cultured in Dulbecco’s Modified Eagle Medium (DMEM) (Hyclone, SH30243.02, Logan, UT, USA), enriched with 5% bovine calf serum (Hyclone, SH30087.03), 1% Penicillin-Streptomycin-Amphotericin B Solution (Elabscience, PB180121, Houston, TX, USA). The cells used in this study were not contaminated with Mycoplasma. To inhibit SGK1 expression in NRK-52E cells, the SGK1 inhibitor GSK 650394 (MedChemExpress, HY-15192, Monmouth Junction, NJ, USA) was used. The cells were seeded at 60%–80% confluency and incubated overnight. Following initial incubation, the culture medium was exchanged for a fresh one containing distinct concentrations of GSK 650394 (50, 100, and 200 μM). After 48 h of treatment, the cells were collected for further experimental analysis. The untreated group served as the control (Mock).
2.2 RNA Extraction and Quantitative RT-PCR (RT-qPCR)
Total RNA was extracted using QIAzol Lysis Reagent (QIAGEN, 79306, Germantown, MD, USA), and RNA concentration was measured using a QuickDrop Spectrophotometer (Molecular Devices, 5047178, Walpole, MA, USA). After RNA extraction, 1 μg of total RNA was processed into complementary DNA (cDNA) through reverse transcription using the Magic RT Master Mix cDNA Synthesis Kit (Bio-Genesis Technologies, DBU-RT-100, Taipei, Taiwan). The synthesized cDNA underwent dilution before being mixed with 3 μM gene primers (SGK1 and GAPDH, respectively) and iTaq Universal SYBR Green Supermix (Bio-Rad, 1725124, Hercules, CA, USA). The quantification of gene expression was conducted via real-time PCR (qPCR) using the ABI Prism Step-OnePlus Real-Time PCR System (Applied Biosystems, 4376592, Carlsbad, CA, USA). Gene expression levels were analyzed using the 2−ΔΔCt method, and fold-change values were calculated relative to the control group. The qPCR primers for rat SGK1 (Forward: 5′-GGG ACA ACG TCC ACC TTC TG-3′; Reverse: 5′-CGG CTG CTT ATG GAG AAC CT-3′) and the housekeeping gene GAPDH (Forward: 5′-TGC ACC ACC AAC TGC TTA GC-3′; Reverse: 5′-GGC ATG GAC TGT GGT CAT-3′) were designed using Primer Express 3.0 (Applied Biosystems) and synthesized by Genomics Co., Ltd. (Taiwan).
2.3 Cellular Protein Extraction and Immunoblotting
To extract cellular proteins, NRK-52E cells were lysed with Cell Lytic M Cell Lysis Reagent (Sigma, C2978, St. Louis, MO, USA) in the presence of protease and phosphatase inhibitors. Protein concentration was determined using the Coomassie Plus Protein Assay Kit (Thermo Scientific, 23236, Rockford, IL, USA). For SDS-PAGE, 15 μg of total protein extract was separated by electrophoresis and transferred onto polyvinylidene fluoride membranes (PVDF) (PerkinElmer, NEF1002001PK, Waltham, MA, USA). The membranes were incubated overnight at 4°C with primary antibodies against SGK1 (1:1000; Sigma, 07-315) or β-Actin (1:5000; Sigma, A2228). Following washing, the membranes were incubated for 2 h at room temperature with HRP-conjugated secondary antibodies, including goat anti-rabbit and anti-mouse IgG (1:5000; GeneTex, GTX213110-01 and GTX213111-01, Taiwan). Protein bands were detected through enhanced chemiluminescence using the WesternBright ECL Western blotting kit (Advansta, K-12045-D50, San Jose, California, USA), and images were documented with Image Lab software (Bio-Rad). β-Actin was utilized as a reference protein for normalization.
2.4 RNA Sequencing and Differentially Expressed Gene Analysis
To conduct eukaryotic transcriptome sequencing, the TruSeq Stranded mRNA Library Prep Kit (Illumina, San Diego, CA, USA) was utilized. The process began with 1 μg of purified total RNA. mRNA was extracted using oligo (dT) magnetic beads and subsequently fragmented by heat-induced hydrolysis. First-strand cDNA synthesis was performed using random primers and reverse transcriptase, followed by second-strand synthesis involving dNTPs, RNase H, and DNA polymerase, ultimately yielding double-stranded cDNA. AMPure XP magnetic beads (Beckman Coulter, Beverly, MA, USA) were used to purify double-stranded cDNA, which then underwent end-repair and 3′ adenylation, culminating in the ligation of sequencing adaptors. The final sequencing library was amplified using PCR and purified with magnetic beads. The Agilent BioAnalyzer 2100 system (Agilent Technologies, G2939AA, Santa Clara, CA, USA) was employed for library quality assessment, and a Real-Time PCR system (Applied BioSystems, 4453536) was used for concentration quantification. The successfully validated libraries underwent sequencing on an Illumina NovaSeq 6000 platform with 150-base paired-end (PE) reads. Raw sequencing data were processed using bcl2fastq to convert BCL/CBCL files into FASTQ format. The FASTQ files (raw sequencing data) were subjected to quality control using fastp to remove low-quality bases, adapter sequences, and reads containing excessive unknown nucleotides (N). Reads were then aligned to the reference genome after removing ribosomal RNA sequences. Differential gene expression analysis was performed, followed by gene set enrichment analysis (GSEA) and functional enrichment analysis. GSEA was rigorously conducted to uncover the critical biological processes and signaling pathways impacted by SGK1 inhibition. We meticulously analyzed the differentially expressed genes (DEGs) identified through RNA sequencing, leveraging the powerful ShinyGO tool (version 0.76.2, accessed on 18 October 2022; available at http://bioinformatics.sdstate.edu/go/). Our functional annotation focused on key Gene Ontology (GO) categories, including Biological Process, Cellular Component, and Molecular Function [19]. In addition, we performed comprehensive KEGG pathway enrichment analysis to identify biological pathways significantly associated with our findings. An adjusted p-value (FDR) threshold of less than 0.05.
All experiments were conducted in three independent replicates (N = 3). Data are presented as mean ± standard deviation (SD). The students’ t-test was used to determine the statistical significance of the treatment and control groups. A p-value of < 0.05 was considered statistically significant.
3.1 Effects of SGK1 Inhibition on Gene and Protein Expression in NRK-52E Cells
To investigate genes interacting with SGK1 in kidney cells, NRK-52E cells were used as an experimental platform, and the SGK1 inhibitor GSK 650394 was applied to suppress SGK1 RNA and protein expression. The objective was to identify genes affected by SGK1 inhibition and analyze their physiological functions. NRK-52E cells were seeded at 60%–80% confluency and incubated overnight for proper attachment. Following initial preparation, the cells were subjected to treatment with various concentrations of the SGK1 inhibitor GSK 650394 (50, 100, and 200 μM) for 48 h to suppress SGK1 expression. As shown in Fig. 1A, increasing concentrations of the SGK1 inhibitor resulted in higher cell death rates, accompanied by a decrease in total RNA and protein levels, suggesting that SGK1 inhibition affects cell growth and that SGK1 is associated with renal cell viability (Fig. 1B,C). Experimental validation using RT-qPCR and Western blot confirmed a pronounced suppression of SGK1 expression in cells exposed to GSK 650394 at concentrations ranging from 50 to 200 μM.
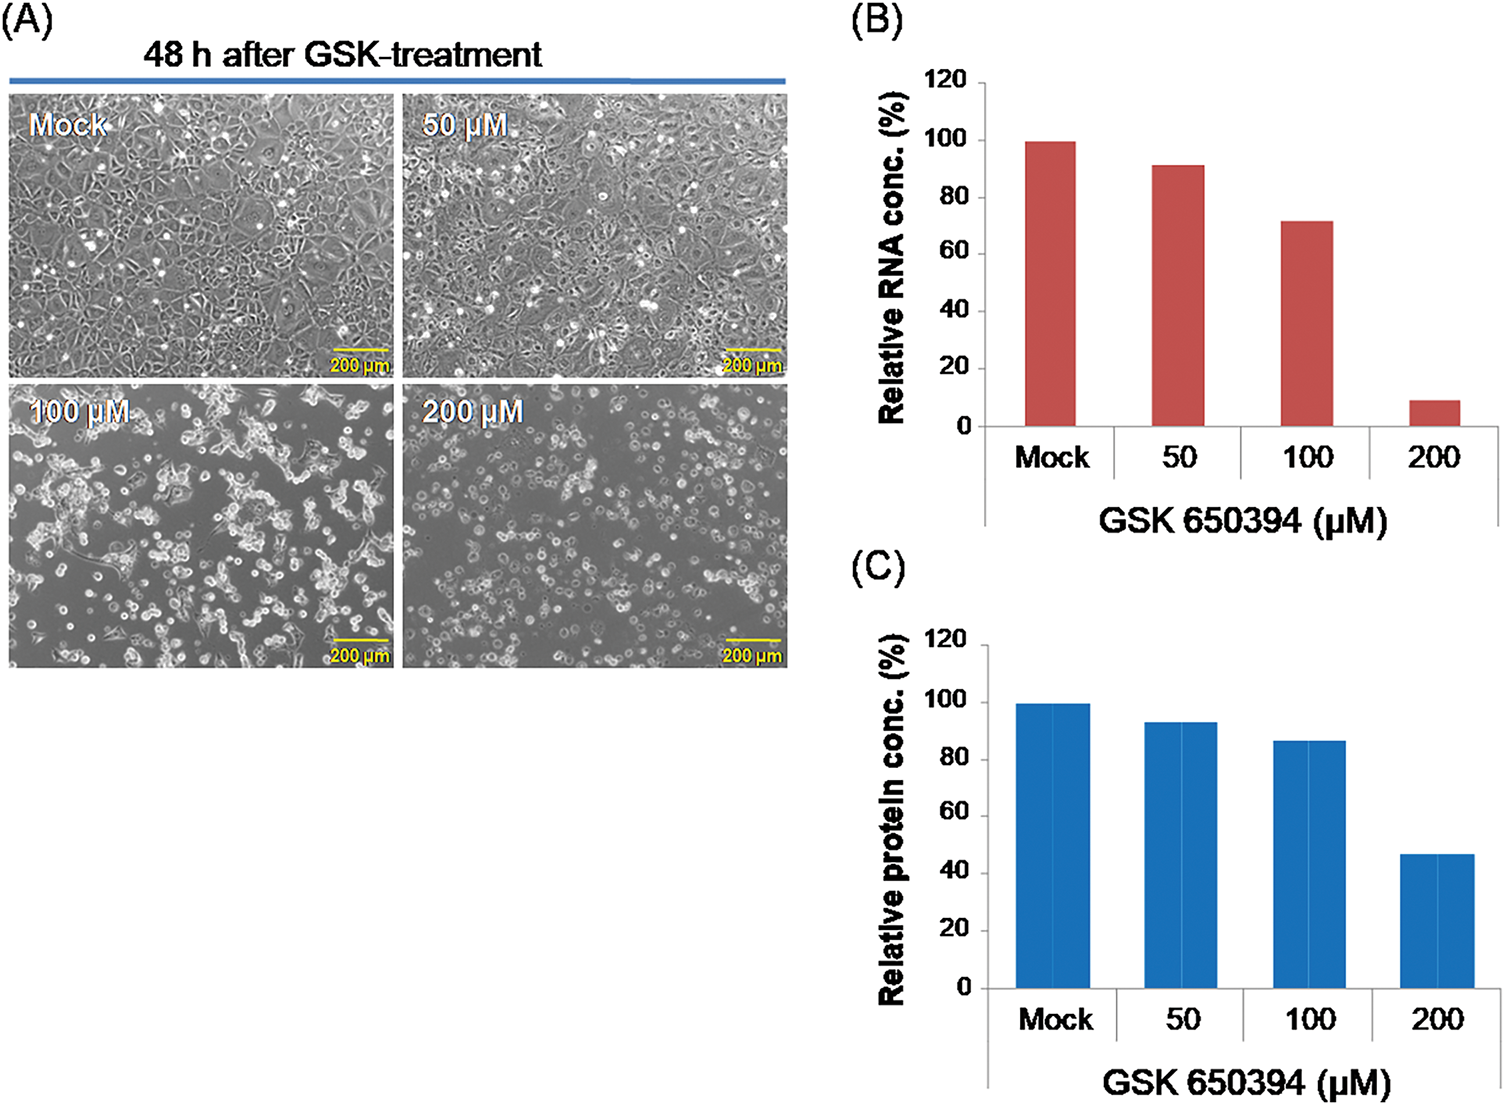
Figure 1: Treatment of SGK1 inhibitor GSK 650394 treatment in NRK-52E cells. (A) Cell image, (B) relative RNA concentration, and (C) relative protein concentration of NRK-52E cells after GSK 650394 treatment for 48 h
Specifically, SGK1 mRNA levels decreased by 30% at 50 μM, 27% at 100 μM, and 65% at 200 μM (Fig. 2A). Correspondingly, SGK1 protein levels were reduced by 38% at 100 μM and 80% at 200 μM (Fig. 2B). Our results suggest that GSK 650394 plays a key role in repressing SGK1 expression at both transcriptional and translational levels in NRK-52E cells.
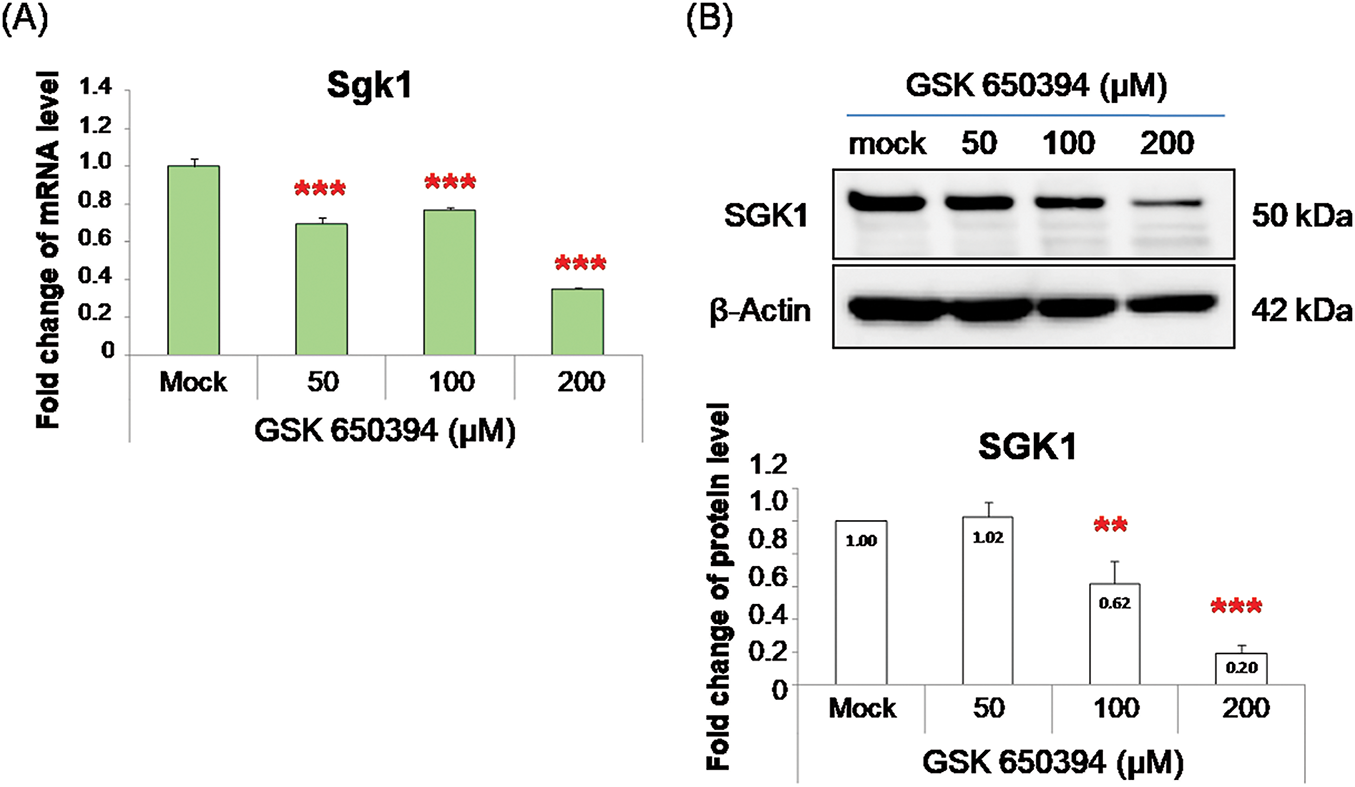
Figure 2: GSK 650394 treatment results in downregulation of SGK1 gene and protein expression in NRK-52E cells. (A) RT-qPCR and (B) Western blot assays illustrating SGK1 expression in NRK-52E cells incubated with GSK 650394 for 48 h (N = 3; mean ± SD; compared to mock group; **p< 0.01; ***p< 0.001)
3.2 Transcriptomic Profiling of Differentially Expressed Genes after GSK 650394 Treatment
To explore genes potentially interacting with SGK1, RNA-seq was performed to assess transcriptomic variations in NRK-52E cells after GSK 650394 treatment. 13,987 genes were identified, and differentially expressed genes (DEGs) were determined by comparing GSK 650394-treated cells with the control group. Selection was based on an adjusted p-value of <0.05 and a log2 fold change surpassing 1 or dropping below −1, 749 DEGs (401 upregulated, 348 downregulated) were identified in the 50 μM group, 2267 DEGs (897 upregulated, 1370 downregulated) in the 100 μM group, and 5631 DEGs (2547 upregulated, 3084 downregulated) in the 200 μM group (Fig. 3A). Principal component analysis (PCA) revealed that the transcriptomic profiles of GSK 650394-treated cells significantly differed from those of the control group (Fig. 3B). According to the Venn diagram analysis, a total of 176 DEGs overlapped across the three different treatment groups (Fig. 3C).
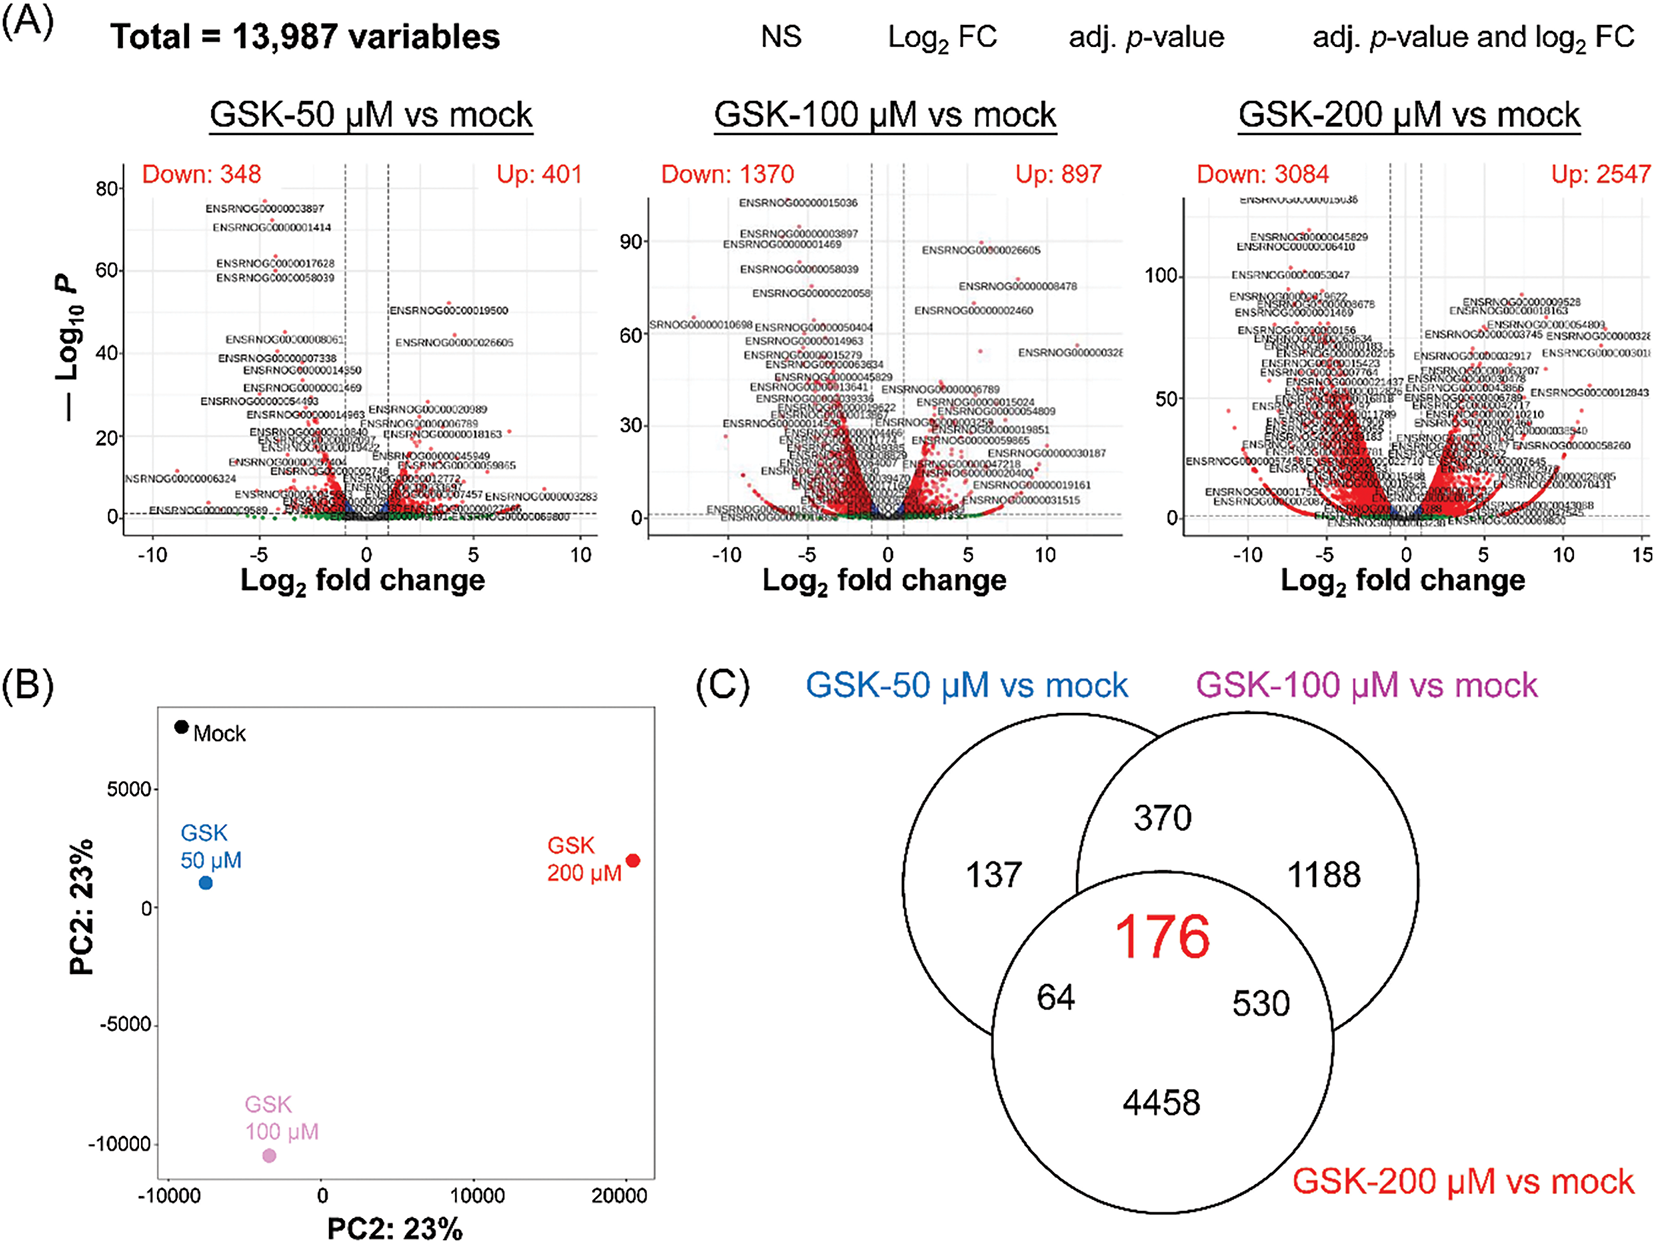
Figure 3: Transcriptomic analysis, including RNA-seq and DEG identification, in NRK-52E cells exposed to the SGK1 inhibitor. (A) Volcano plots, (B) principal component analysis (PCA), and (C) Venn diagram. Criteria for DEGs: log2 fold change = ±1, −log10 p = 1.3 (adjusted p-value = 0.05)
Heatmap analysis of the top 100 DEGs showed three distinct gene expression patterns: 53 genes exhibited increased expression with higher GSK 650394 concentrations, 25 genes showed a concentration-dependent decrease, and 22 genes displayed no clear correlation with GSK 650394 concentration (Fig. 4). These findings suggest that SGK1 inhibition significantly alters gene expression in NRK-52E cells and that SGK1 may regulate multiple cellular processes through these DEGs.
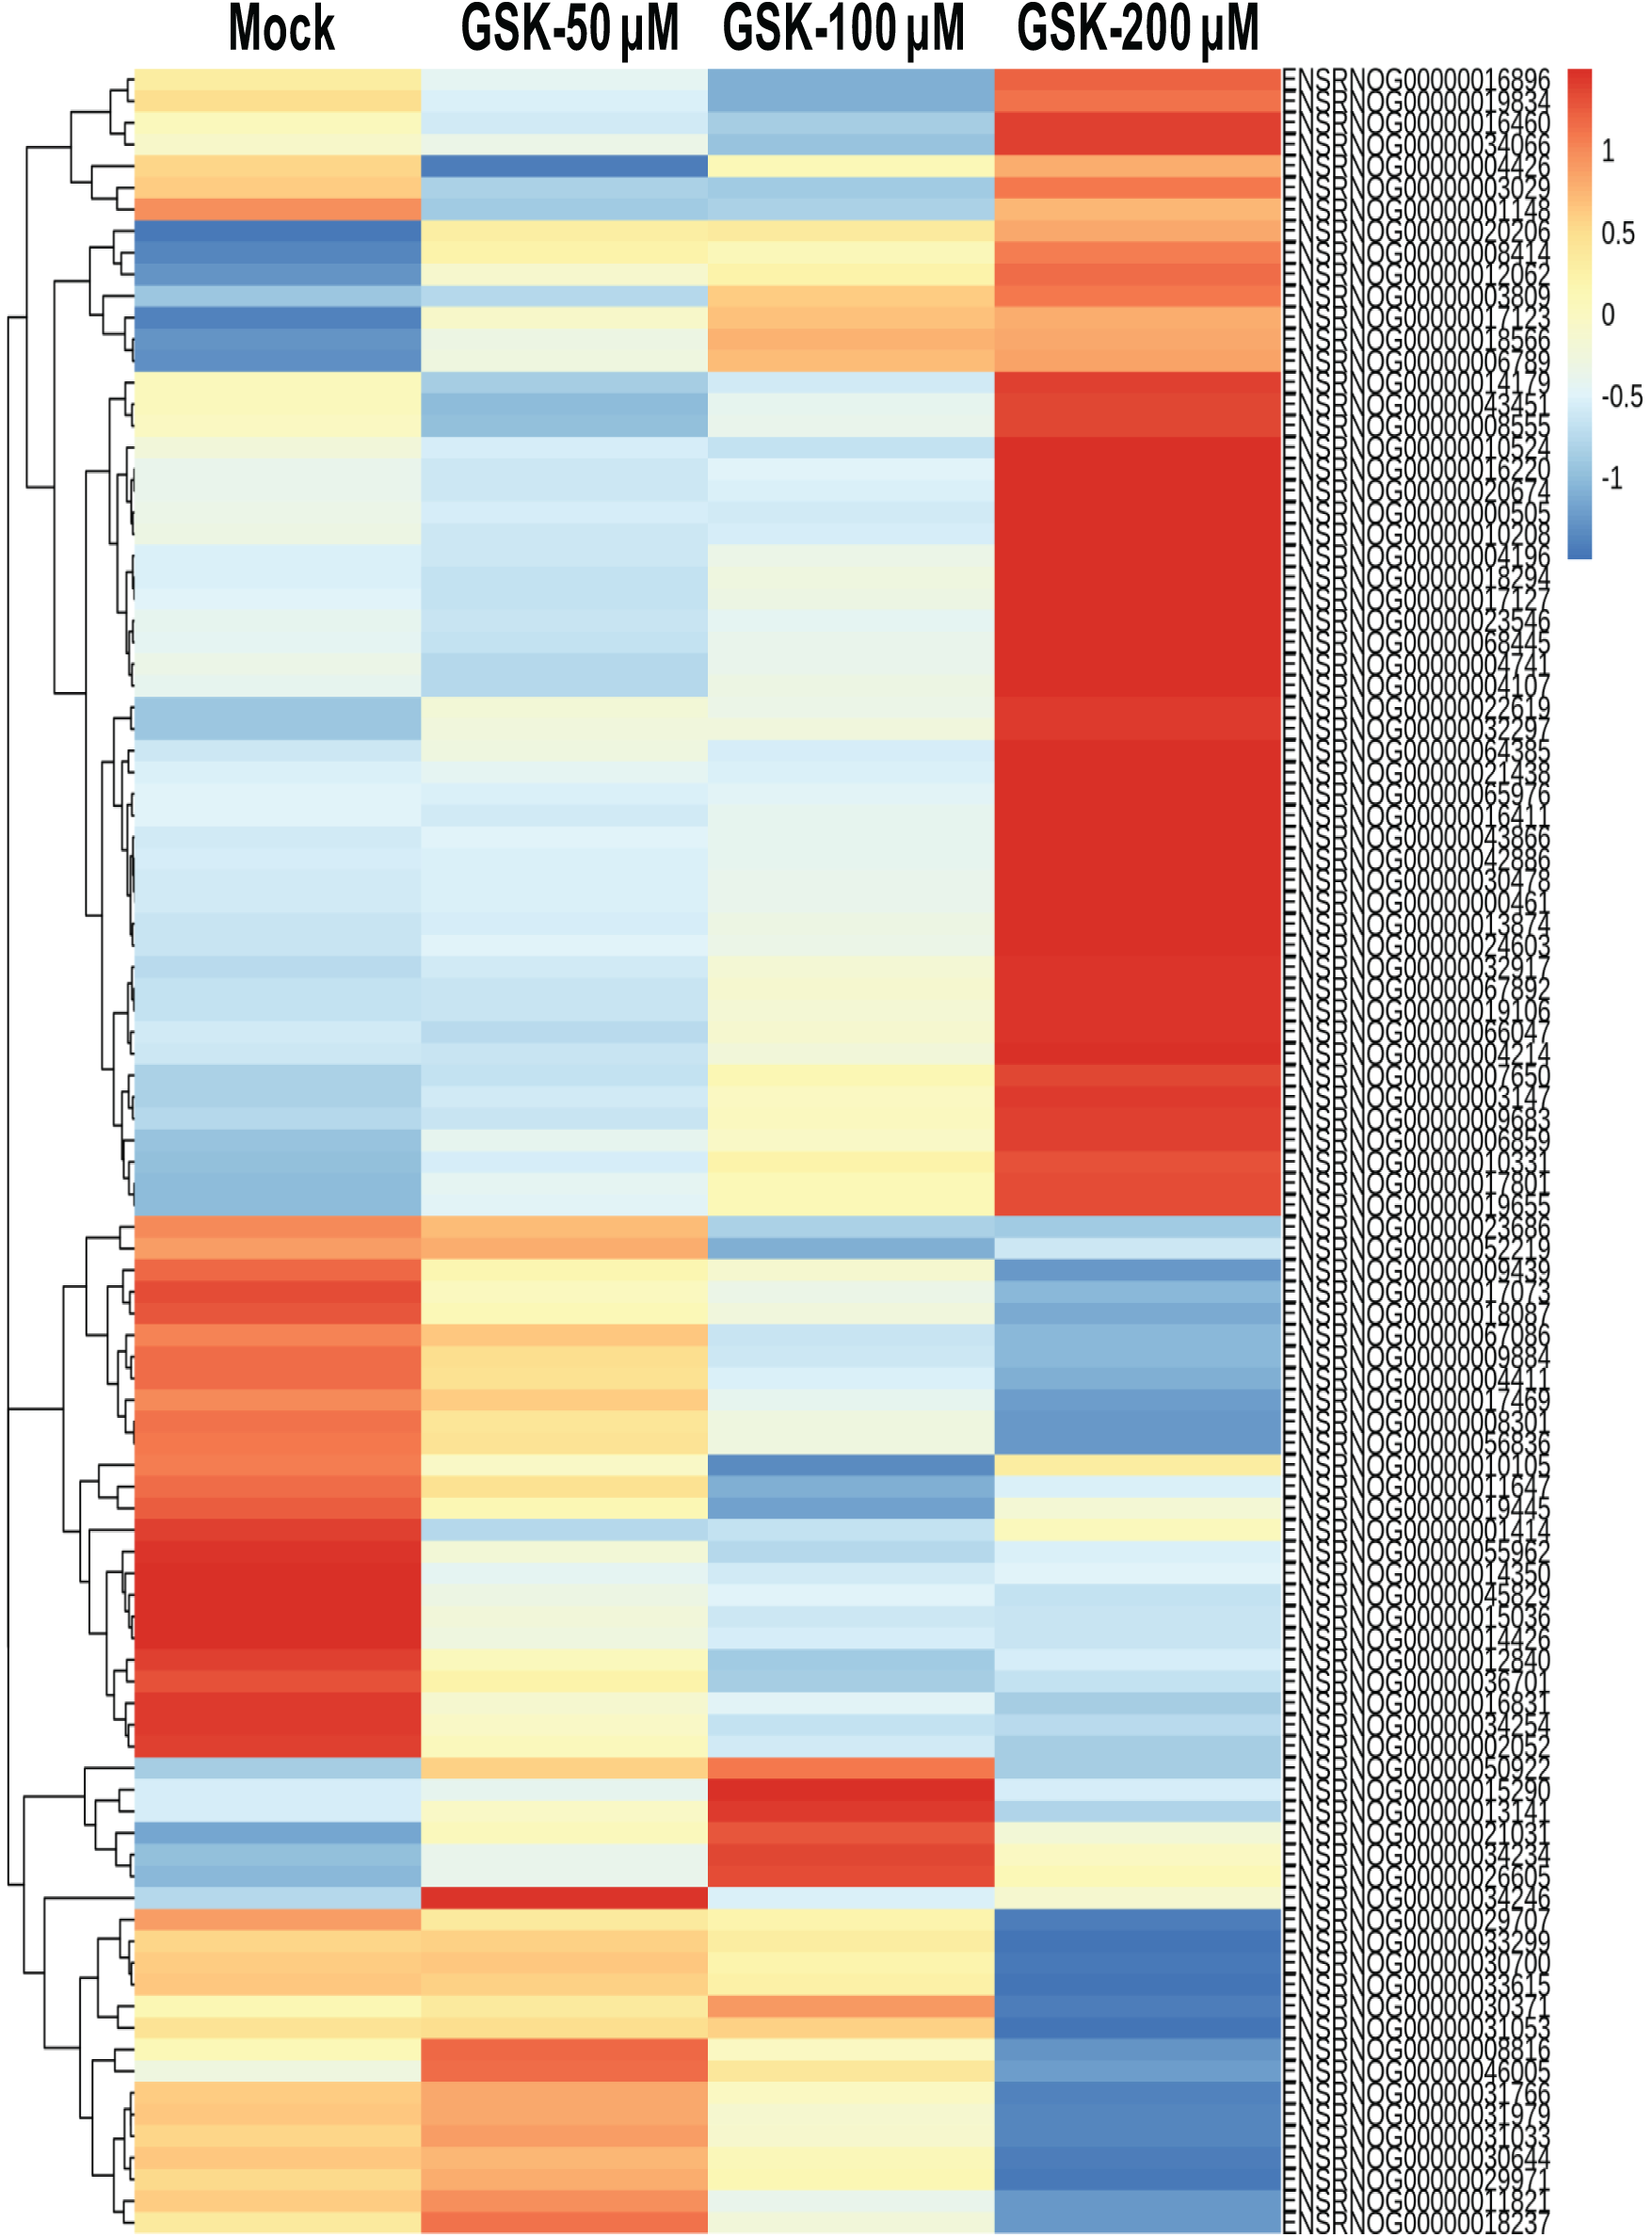
Figure 4: Heatmap analysis of the top 100 genes expressed by RNA-seq analysis between GSK 650394-treated NRK-52E and the mock group
3.3 Enrichment Analysis of Differentially Expressed Genes
A gene set comprises genes that exhibit related functions or characteristics. This study employed two key analytical techniques: over-representation analysis (ORA) and GSEA.
Gene Ontology (GO) categorizes gene attributes into three key domains: biological processes, cellular components, and molecular functions. Meanwhile, the Kyoto Encyclopedia of Genes and Genomes (KEGG) is a comprehensive database for genomic, enzymatic, and biochemical pathway information. GO analysis, including biological process, cellular component, and molecular function classifications, was applied to DEGs from each treatment group to explore potential SGK1-associated pathways (adjusted p-value < 0.05, log2 fold change > 1 or <−1). Furthermore, KEGG pathway enrichment, GSEA-GO, and GSEA-KEGG analyses were carried out to enhance pathway interpretation. The top 20 enriched pathways are shown in Figs. 5–7 (FDR < 0.05). Fig. 5 presents the top enriched pathways for the 50 μM GSK 650394 treatment group. The biological processes mainly involve wound healing, extracellular matrix organization, and cell-substrate adhesion. The cellular components include extracellular structures, actin cytoskeleton, and focal adhesion sites, while the molecular functions highlight actin binding, collagen binding, and growth factor binding. KEGG pathway analysis suggests that PI3K-Akt signaling, focal adhesion, and proteoglycans in cancer are significantly affected. Fig. 6 summarizes enrichment results for the 100 μM GSK 650394 treatment group. This group shares similar biological processes with the 50 μM group, including cell adhesion, extracellular matrix remodeling, and response to transforming growth factor-beta (TGF-β). The cellular components feature chromosomal regions and stress fibers, while molecular functions indicate enrichment in ATP-dependent activities and kinase regulation. KEGG analysis reveals involvement in apoptosis-related pathways, Hippo signaling, and viral carcinogenesis. Fig. 7 illustrates the enriched pathways for the 200 μM GSK 650394 treatment group, showing a shift towards cell cycle regulation, RNA processing, and DNA replication. The cellular components highlight mitochondrial protein complexes, the nuclear speck, and chromatin organization, while the molecular functions emphasize RNA splicing, helicase activity, and transcription regulation. KEGG pathways are enriched in neurodegenerative disease pathways, ribosome biogenesis, and proteoglycans in cancer.
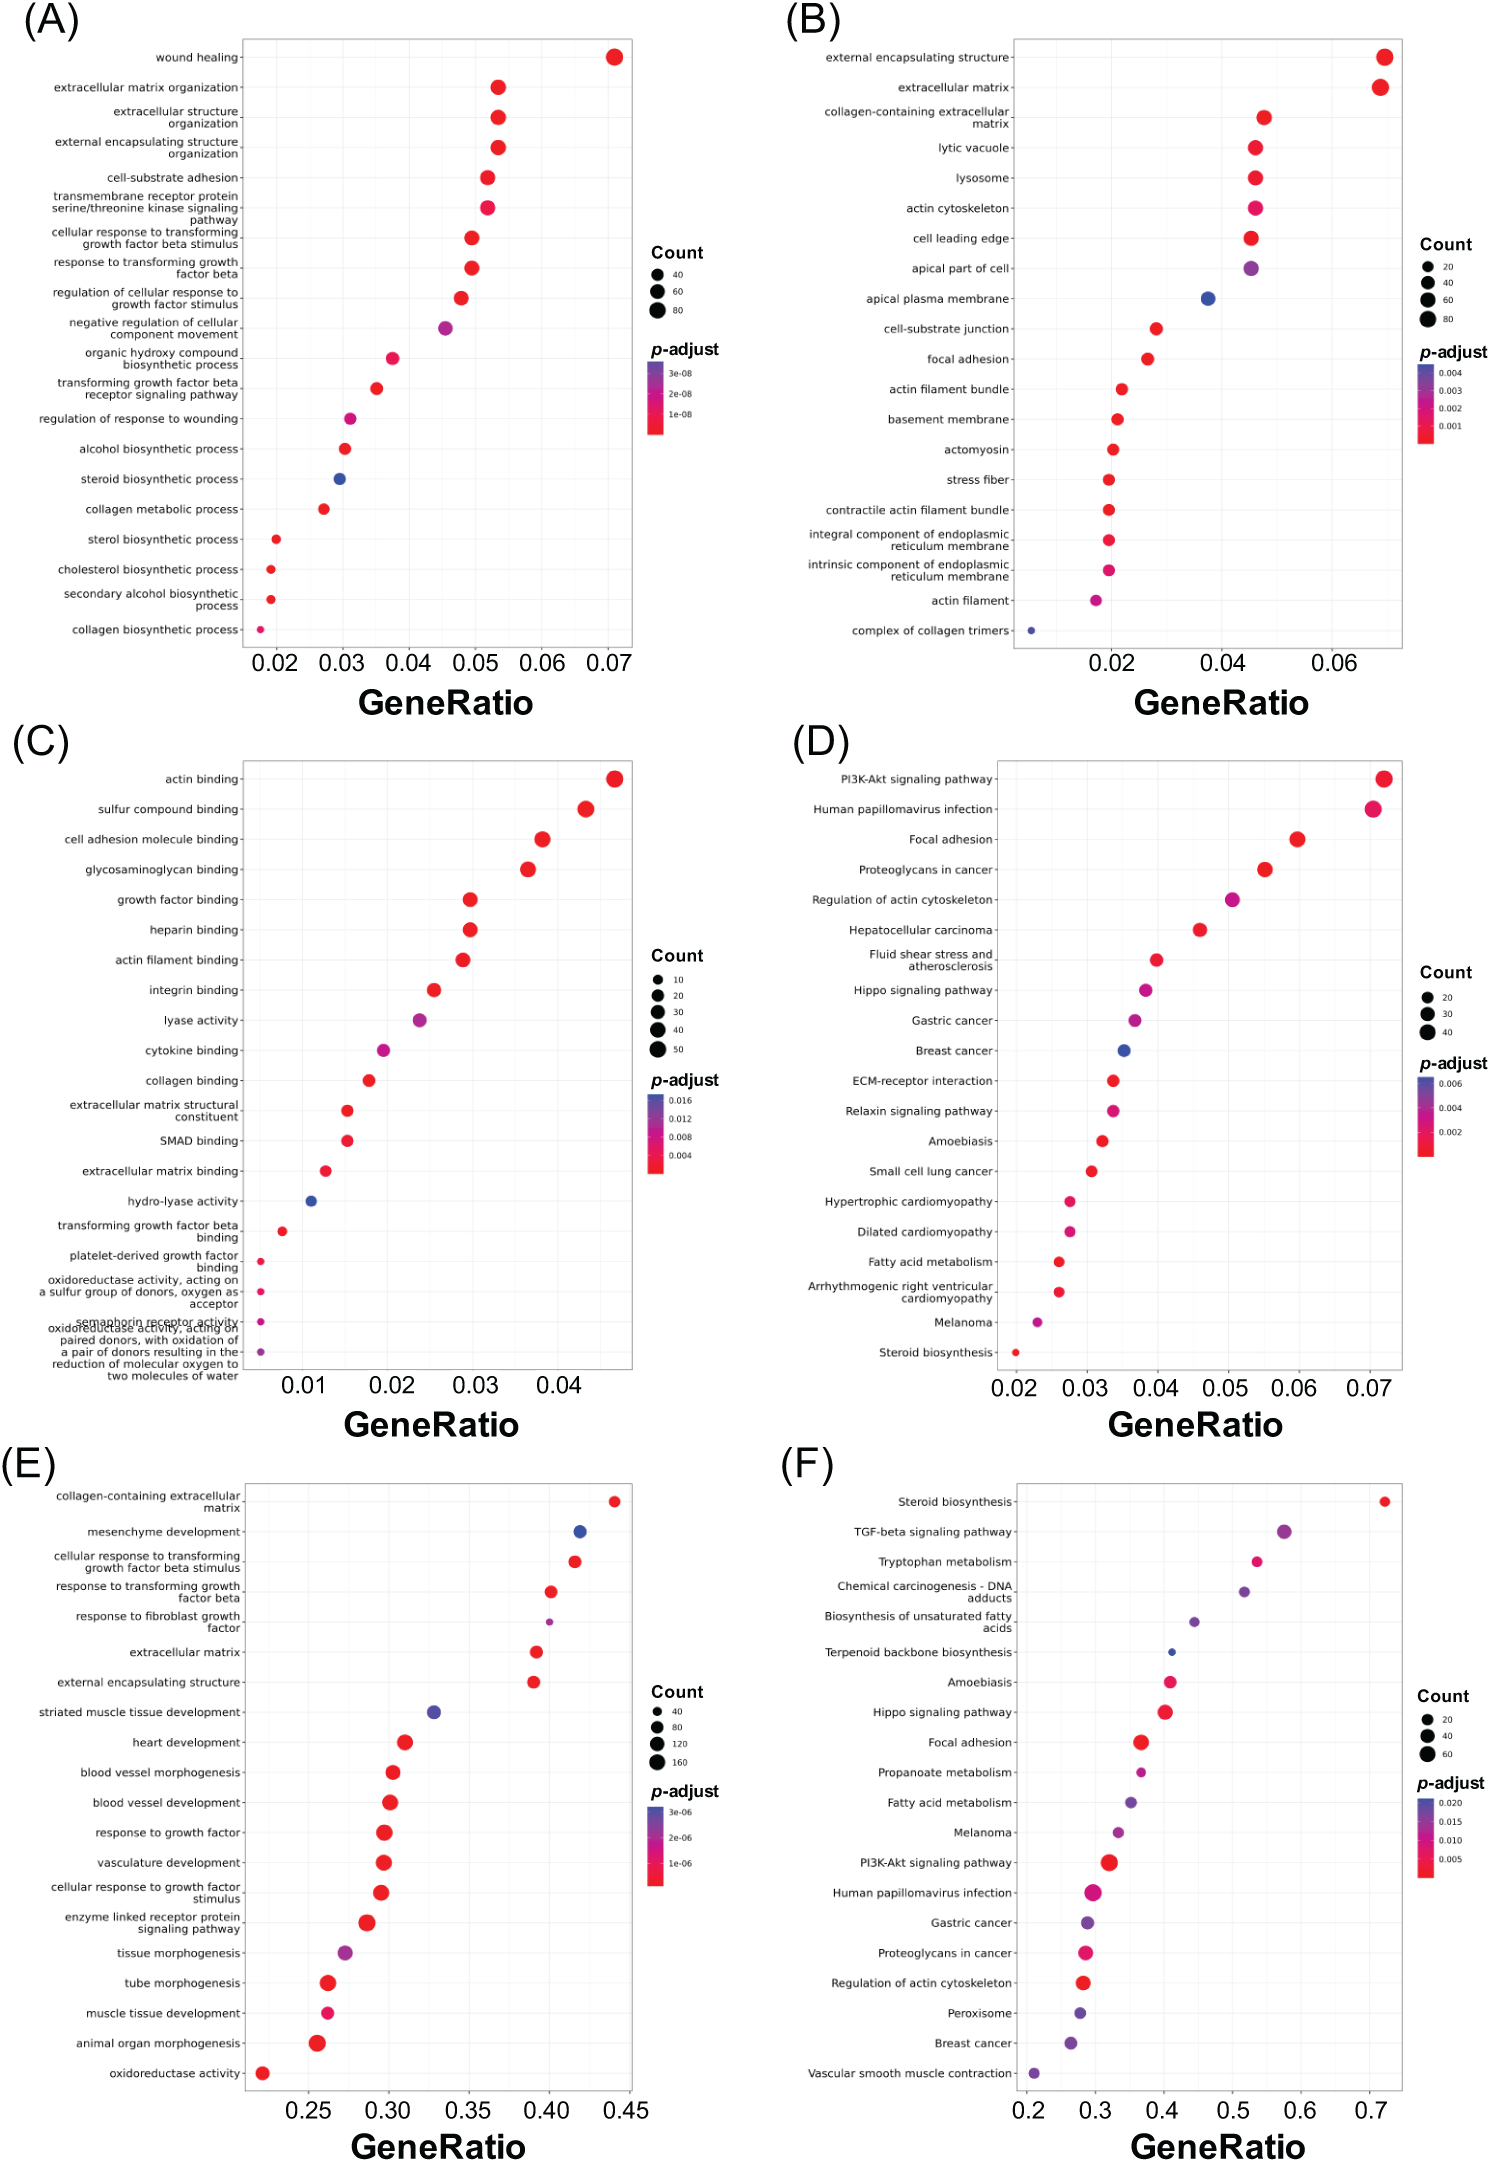
Figure 5: The 20 most significantly enriched pathways identified from DEG analysis in GSK 650394-treated NRK-52E cells (50 μM vs. mock). (A) GO Biological Process, (B) Cellular Component, (C) Molecular Function, (D) KEGG, (E) GSEA-GO, and (F) GSEA-KEGG enrichment analyses. FDR < 0.05
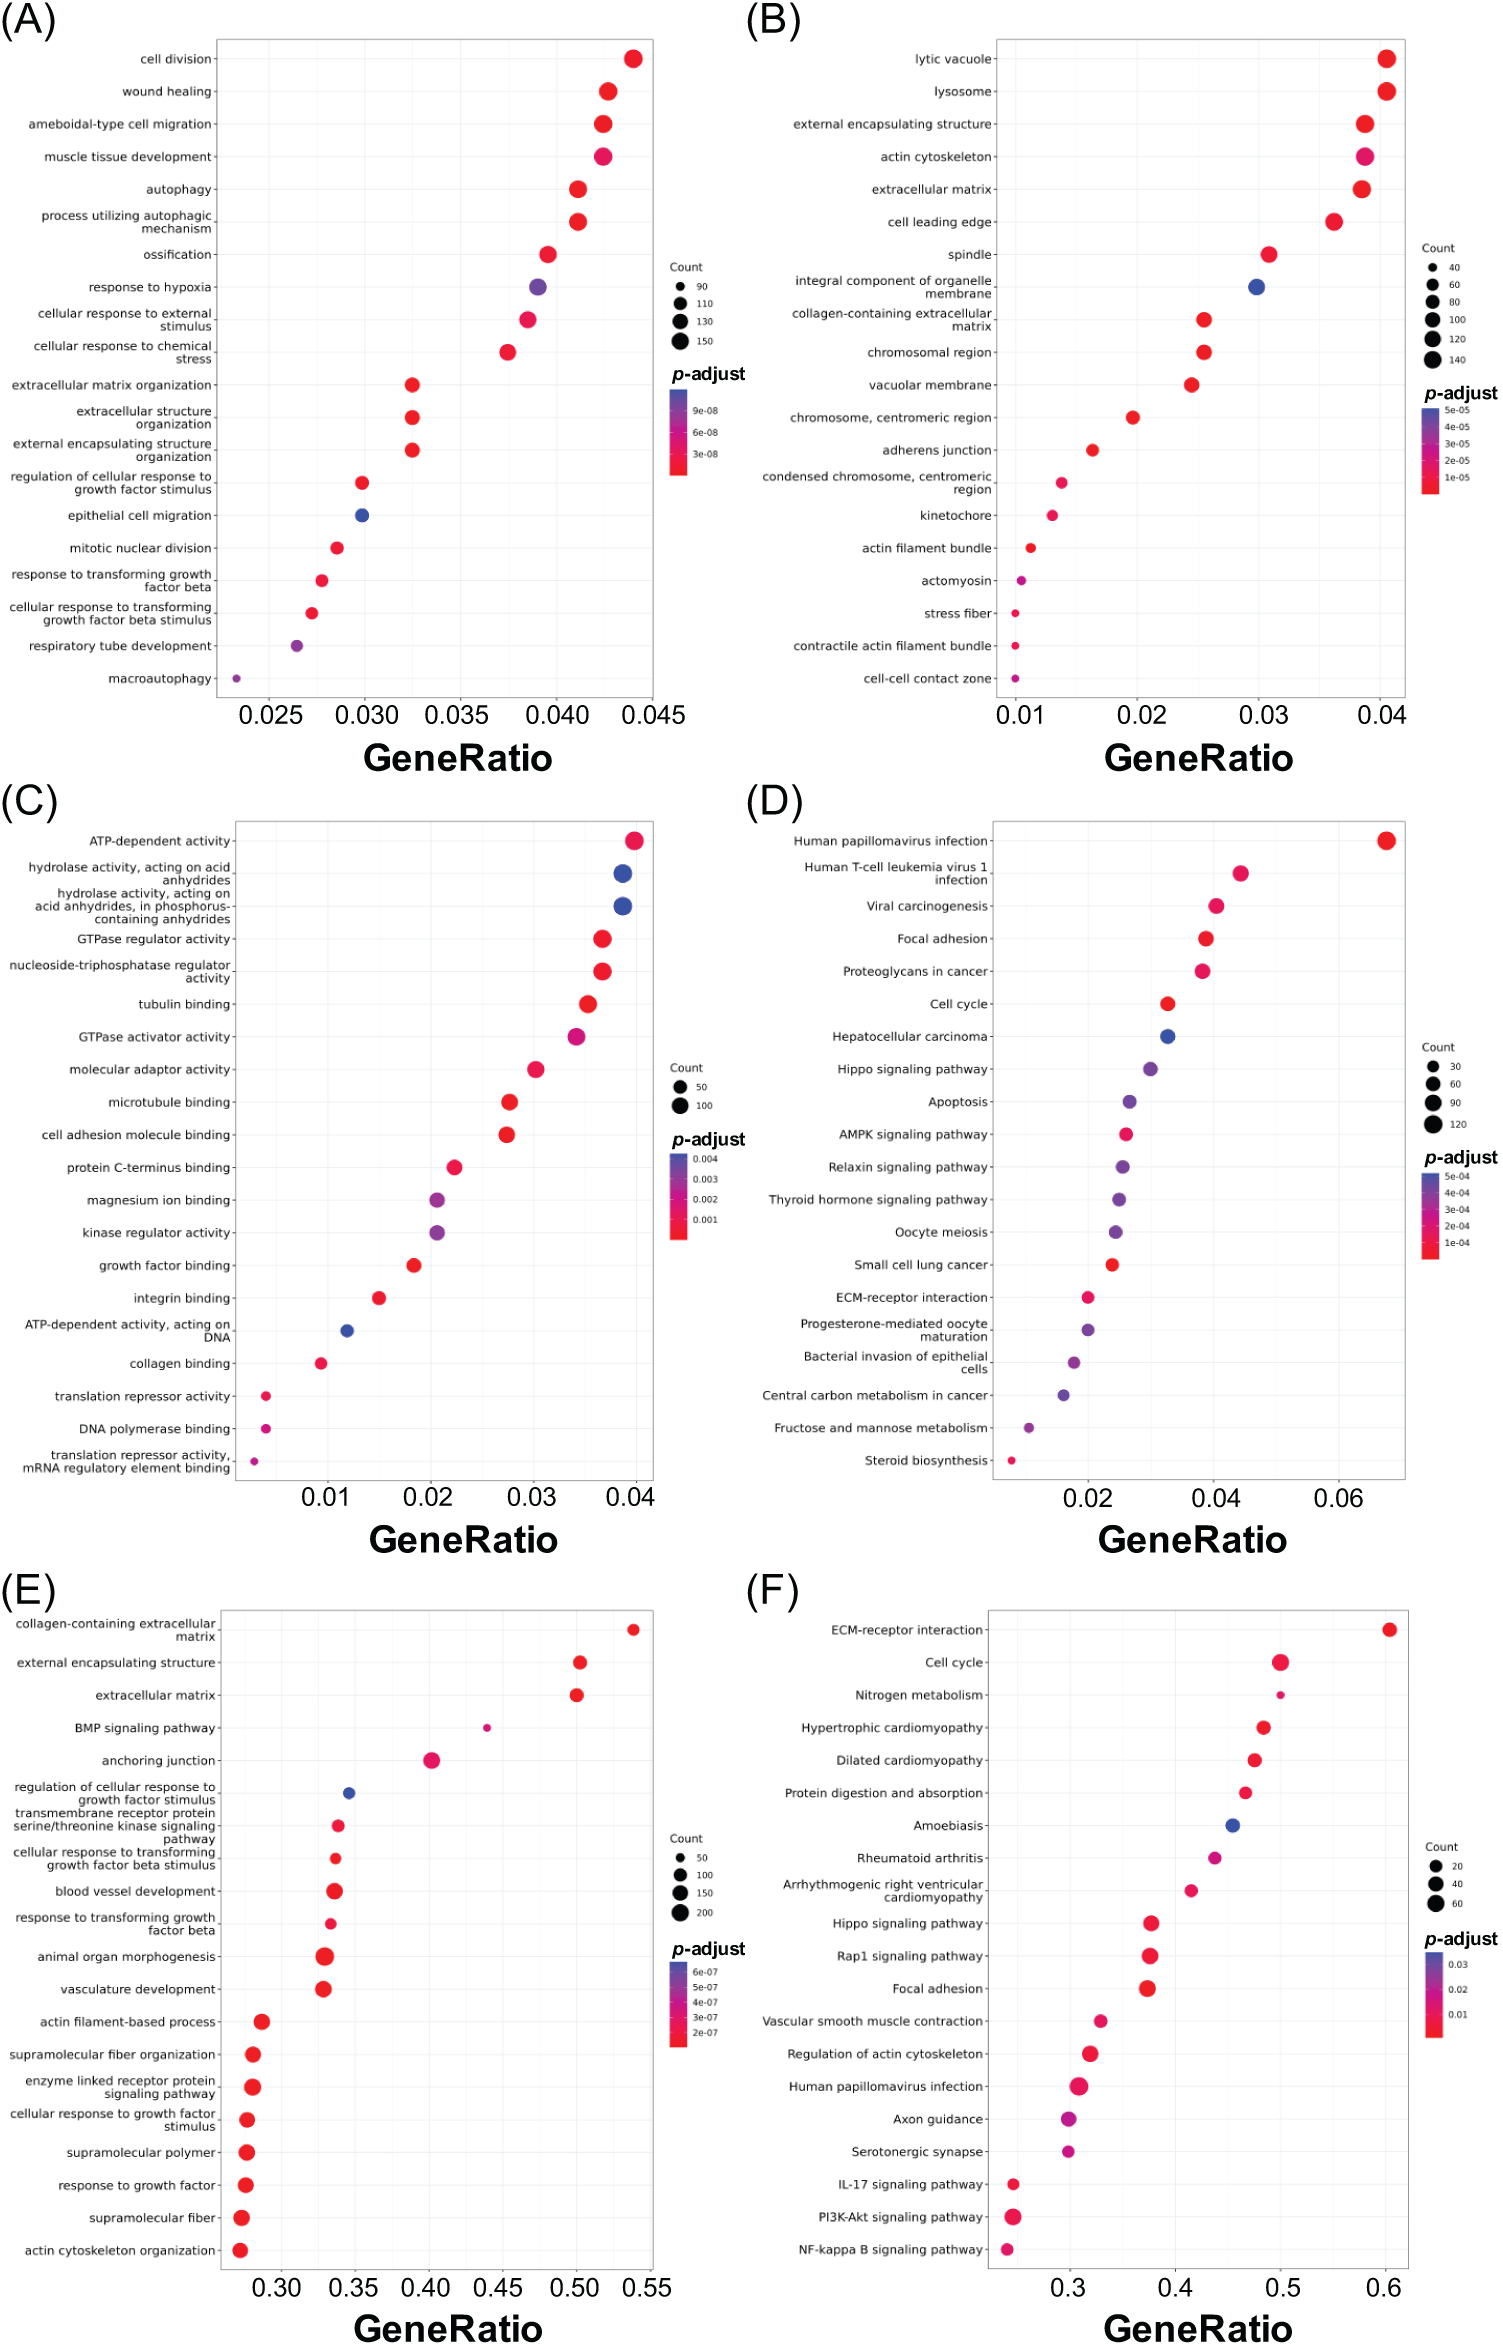
Figure 6: Enrichment analysis of the top 20 pathways derived from DEG profiling in NRK-52E cells exposed to GSK 650394 (100 μM vs. mock). Categories include (A) GO Biological Process, (B) Cellular Component, (C) Molecular Function, (D) KEGG, (E) GSEA-GO, and (F) GSEA-KEGG. FDR < 0.05
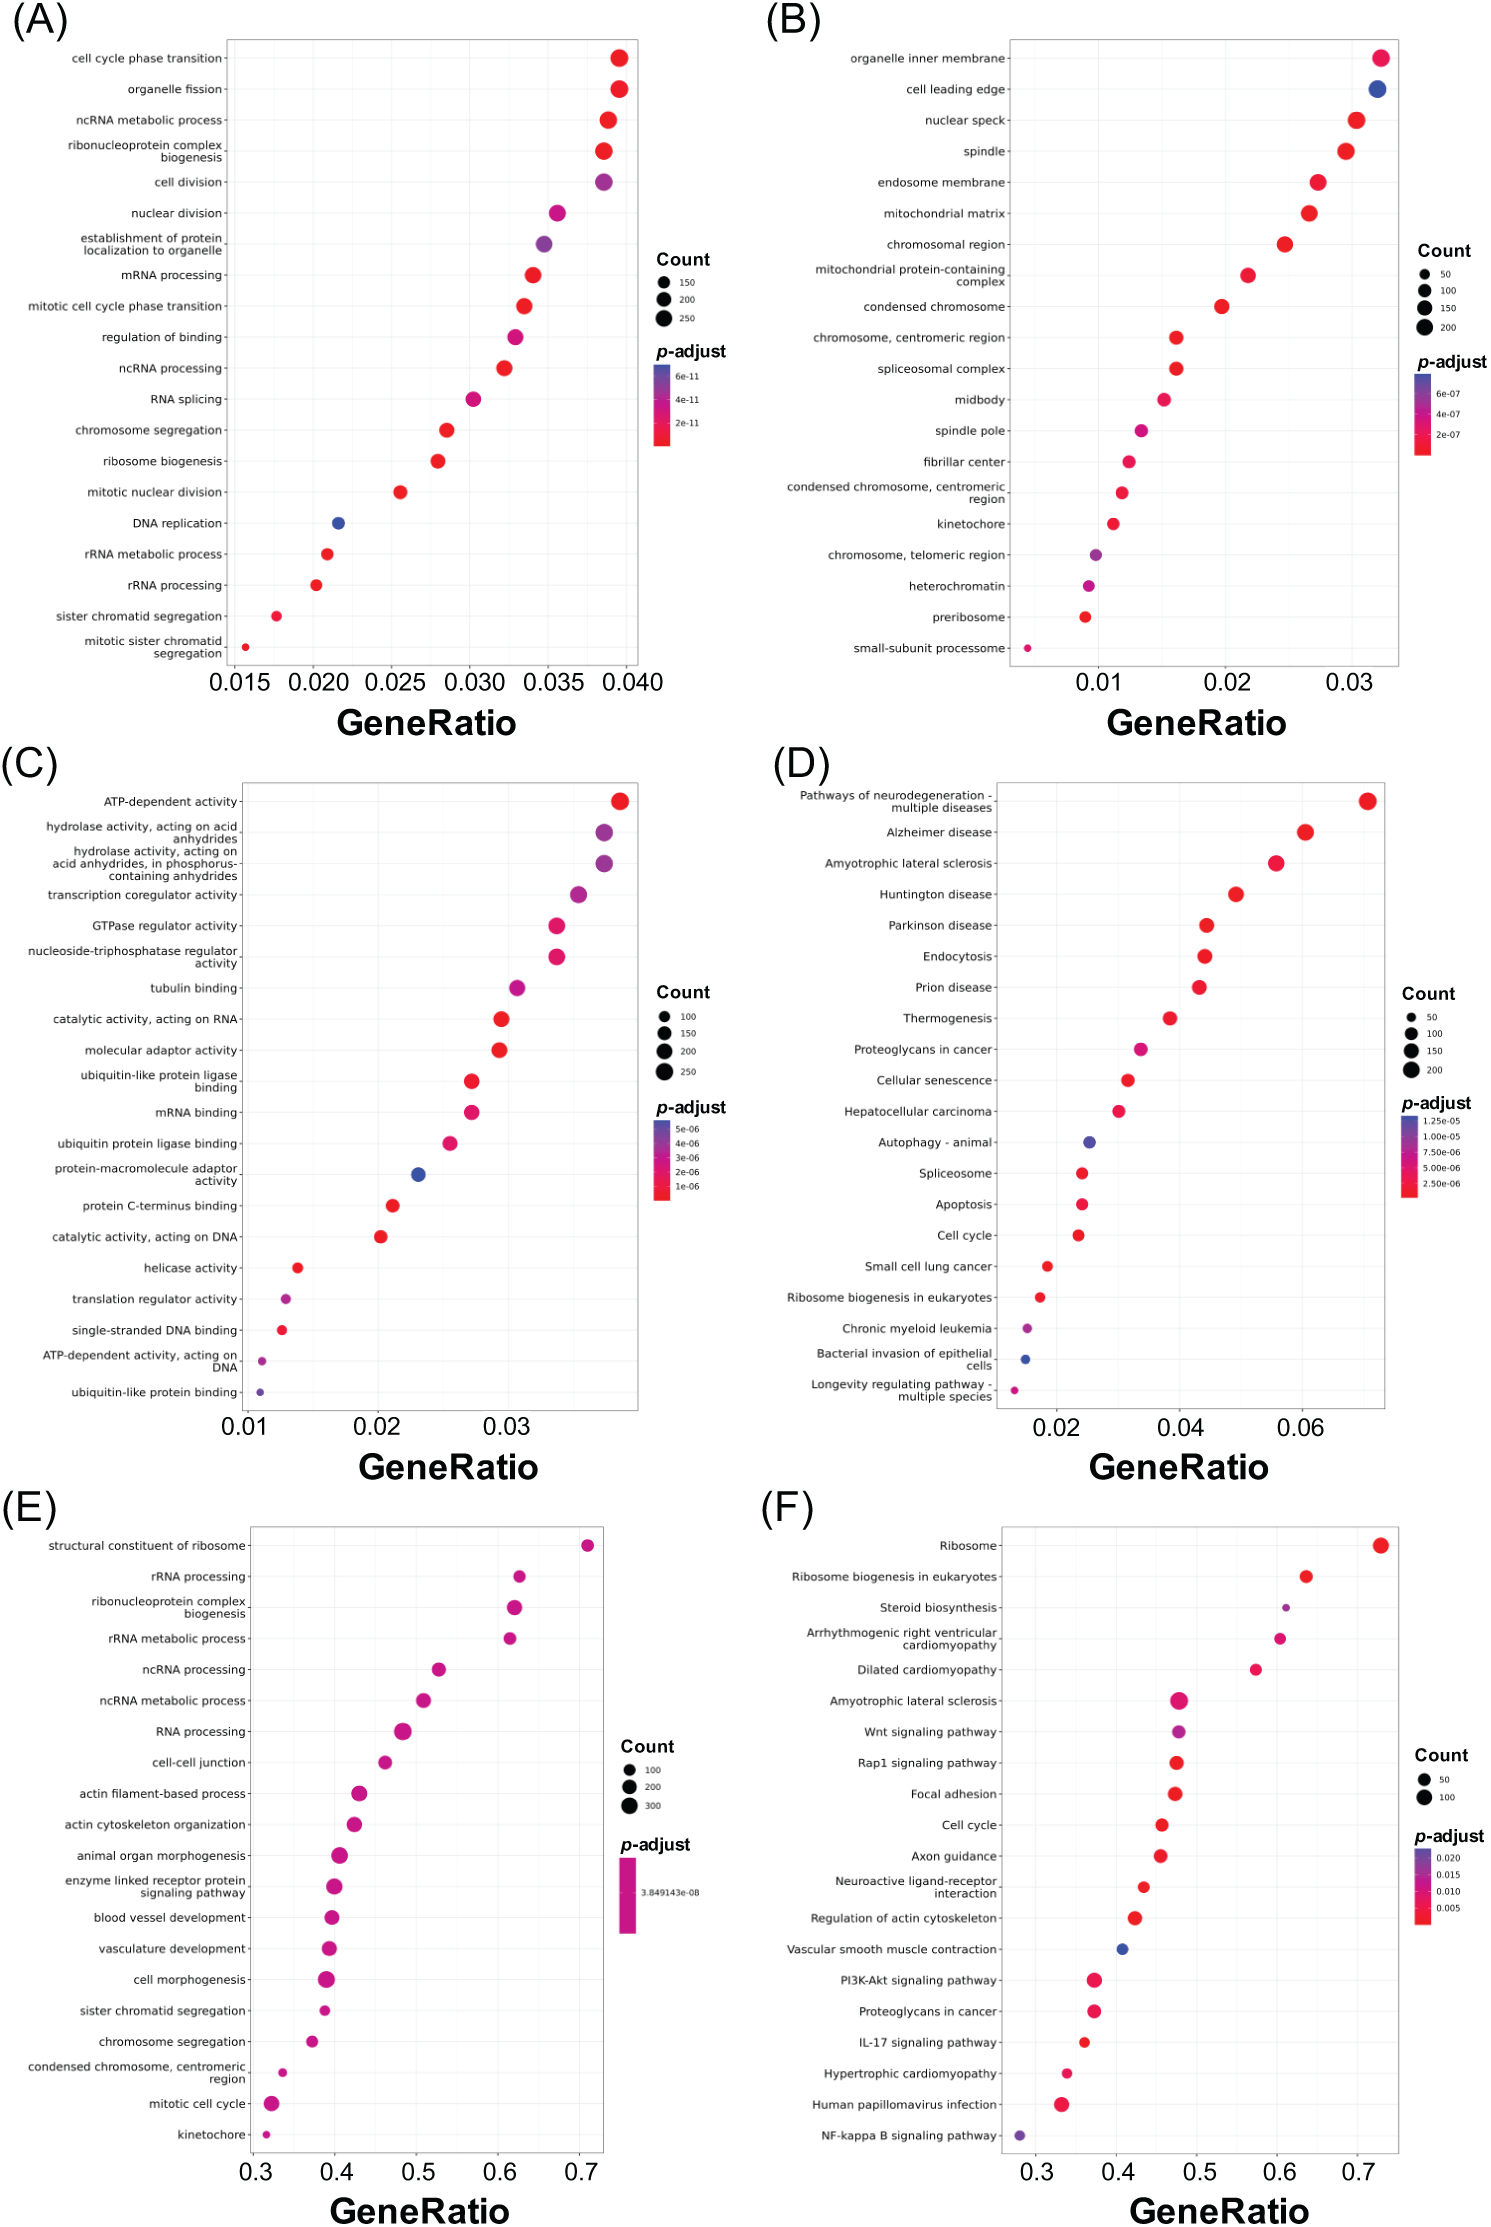
Figure 7: Identification of the top 20 enriched pathways from DEG analysis in NRK-52E cells treated with GSK 650394 (200 μM vs. mock). Pathways were classified into (A) GO Biological Process, (B) Cellular Component, (C) Molecular Function, (D) KEGG, (E) GSEA-GO, and (F) GSEA-KEGG categories. FDR < 0.05
Additionally, GO biological process and KEGG pathway analyses were performed on the 176 common DEGs identified in all three GSK 650394 treatment groups (Fig. 8). Fig. 8A highlights the Gene Ontology (GO) biological processes, with a strong enrichment in lipid metabolism, biosynthesis of small molecules, alcohol metabolism, and steroid biosynthetic processes. Notably, cholesterol metabolism and steroid biosynthesis pathways show highly significant enrichment, suggesting that SGK1 inhibition influences lipid and steroid metabolic processes in kidney cells. Fig. 8B focuses on KEGG pathway analysis, revealing key metabolic pathways affected by SGK1 inhibition. The most significantly enriched pathways include steroid biosynthesis, metabolic pathways, fatty acid metabolism, and the pentose phosphate pathway. These findings indicate that SGK1 may regulate cellular metabolism, particularly lipid and energy metabolism. These analyses revealed potential SGK1-associated genes and physiological regulatory mechanisms, suggesting that SGK1 plays a critical role in various signaling pathways in kidney cells.
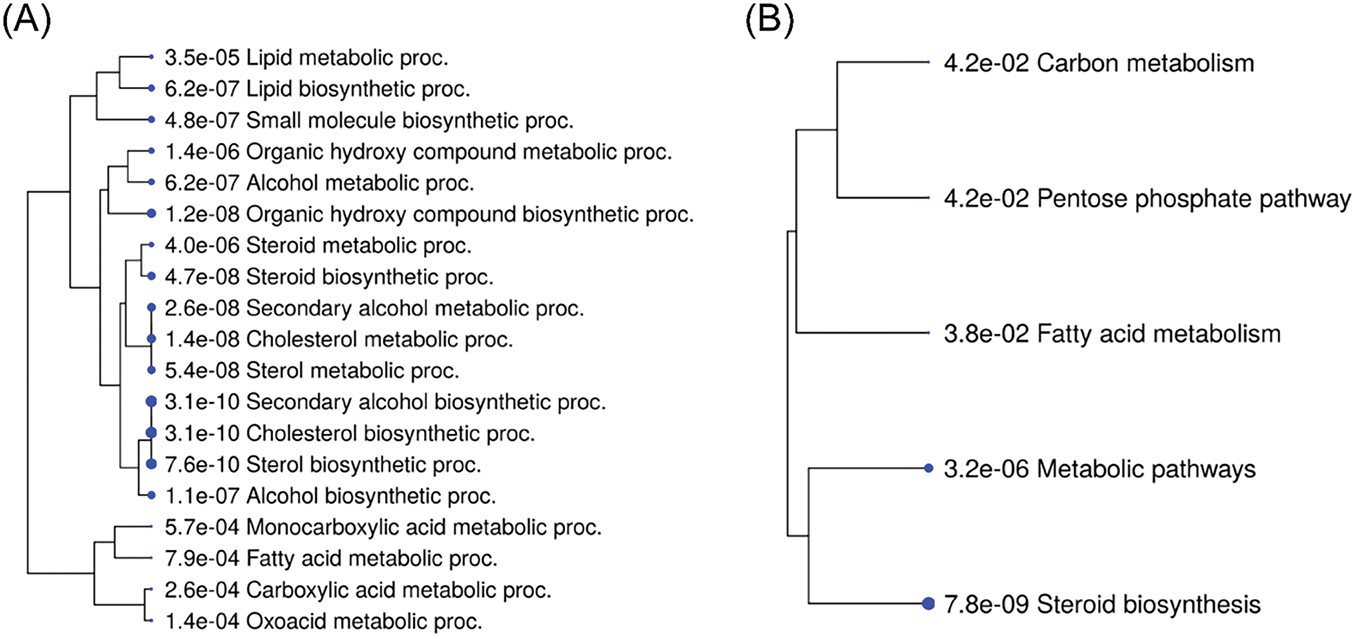
Figure 8: Top 20 pathways of enrichment analysis of 176 common DEGs. (A) GO Biological Process and (B) KEGG gene enrichment analysis. FDR < 0.05
Our study demonstrates that SGK1 inhibition in NRK-52E cells leads to significant transcriptomic changes, highlighting its regulatory role in kidney epithelial cells. Using RNA sequencing and differentially expressed gene analysis, we identified 13,987 genes, among which 176 were consistently differentially expressed across all GSK 650394 treatment groups. The findings suggest that SGK1 modulates multiple cellular functions, including ion transport, cellular metabolism, and stress response pathways. The dose-responsive decrease in SGK1 expression, observed at both the RNA and protein levels, provides additional evidence supporting its pivotal role as a regulatory kinase in renal physiology.
To elucidate the biological relevance of these differentially expressed genes, Gene Ontology and KEGG enrichment analyses were conducted, which revealed that SGK1 inhibition affects pathways associated with epithelial ion transport, oxidative stress response, and metabolic regulation. Given the established role of SGK1 in modulating ion channels such as ENaC and ROMK [7,20], the observed gene expression alterations suggest that SGK1 may influence sodium and potassium homeostasis at the transcriptional level. Additionally, the enrichment of genes involved in apoptotic and autophagy-related pathways indicates that SGK1 may exert a protective role in renal epithelial cell survival, aligning with previous studies that have linked SGK1 to stress adaptation in kidney function [18].
SGK1 plays a pivotal role in kidney physiology by regulating various sodium transport pathways essential for maintaining fluid and electrolyte balance. SGK1 enhances the activity of key ion channels and transporters, including the epithelial sodium channel (ENaC), Na+/K+-ATPase, and Na+/H+ exchange isoform 3 (NHE3) [3,7]. This regulation is crucial for sodium reabsorption in the distal nephron, where SGK1 modulates ENaC function, leading to increased sodium retention and potassium elimination, processes vital for blood pressure regulation and overall kidney function [21,22]. The activation of SGK1 is influenced by various factors, including insulin and growth factors, which further underscores its importance in metabolic processes [1,23]. Notably, alterations in the SGK1 gene have been correlated with an increased risk of hypertension and type 2 diabetes mellitus, indicating that dysregulation of SGK1 pathways can contribute to renal pathologies and metabolic disorders [24–26]. Moreover, SGK1’s ability to enhance the abundance and open probability of ENaC channels significantly impacts sodium transport efficiency, which is critical in conditions such as diabetic nephropathy, where altered sodium handling can exacerbate kidney damage [3]. Thus, SGK1-regulated pathways are integral to kidney physiology, influencing both sodium homeostasis and the pathophysiology of renal diseases.
Beyond renal physiology, SGK1 has been implicated in various cellular functions, such as immune regulation [27,28], cardiovascular health [29], and metabolic disorders [30,31]. Studies have shown that SGK1 contributes to the regulation of insulin signaling, affecting glucose homeostasis and adipocyte differentiation [23,25,30]. Moreover, SGK1 is linked to inflammatory responses and immune cell function, with implications for autoimmune diseases and cancer progression [32,33]. Dysregulated SGK1 expression has also been observed in neurodegenerative disorders, demonstrating its diverse p-hysiological roles [34,35].
Although the transcriptomic analysis provides a broad overview of SGK1-regulated gene networks, further experimental validation is necessary to determine the direct targets of SGK1 and their functional consequences. Future studies should include chromatin immunoprecipitation sequencing (ChIP-seq) to identify SGK1-bound genomic regions and assess whether SGK1 directly regulates the transcription of key DEGs. Additionally, functional assays such as electrophysiological measurements of ion channel activity or metabolic profiling could further elucidate the physiological impact of SGK1 inhibition. The observed reduction in total RNA and protein levels upon SGK1 suppression also raises the question of whether SGK1 plays a role in maintaining global transcriptional and translational efficiency in renal epithelial cells.
Given the role of SGK1 in kidney disease, hypertension, and metabolic syndromes, the findings of this study could have broader clinical implications. Identifying SGK1-dependent gene networks provides new insights into potential molecular targets for therapeutic intervention in renal disorders. Future studies should explore the impact of SGK1 inhibition in vivo models to determine whether these transcriptional changes translate into physiological or pathological effects. Furthermore, since SGK1 has been implicated in glucocorticoid signaling, its regulation of stress-responsive genes may contribute to corticosteroid-related kidney dysfunction. Understanding these mechanisms could provide new avenues for modulating SGK1 activity in disease contexts, offering potential strategies for treating electrolyte imbalances and kidney dysfunction.
SGK1 is central to cellular signaling regulation and modulates various physiological functions. Its significance in kidney function has been well established. In this study, SGK1 expression was inhibited in the rat kidney epithelial cell line NRK-52E, and RNA-seq combined with DEG analysis was used to identify genes potentially affected by SGK1 suppression. Enrichment analysis was further performed to identify genes interacting with SGK1 and the potential cellular mechanisms and signaling pathways involved in kidney cell function. This study provides a comprehensive analysis of genes and signaling pathways that may be regulated by SGK1, offering valuable insights into its molecular signaling and physiological regulatory roles in kidney cells. These findings may contribute to future research on SGK1’s involvement in kidney diseases.
Acknowledgement: We thank Cheng-Chiang Chang, MD, PhD for his valuable contributions (writing—review and editing, supervision, funding acquisition) to this work.
Funding Statement: This work was supported by the Kaohsiung Veterans General Hospital (KSVGH-114-047 and KSVGH-114-102) and the Zuoying Armed Forces General Hospital (KAFGH-ZY_A_111020 and KAFGH-ZY-A-112012).
Author Contributions: The authors confirm contribution to the paper as follows: Conceptualization, Chieh-Jen Wu and Yu-He Li; methodology, Yu-He Li; software, Yu-He Li; validation, Chieh-Jen Wu; formal analysis, Yu-He Li; investigation, Chieh-Jen Wu; resources, Yu-He Li; data curation, Yu-He Li; writing—original draft preparation, Chieh-Jen Wu and Yu-He Li; writing—review and editing, Hsin-Hung Chen; visualization, Yu-He Li; supervision, Hsin-Hung Chen; project administration, Chieh-Jen Wu and Yu-He Li; funding acquisition, Chieh-Jen Wu and Yu-He Li. All authors reviewed the results and approved the final version of the manuscript.
Availability of Data and Materials: The data supporting this study’s findings are available from the Corresponding Author, Hsin-Hung Chen, upon reasonable request.
Ethics Approval: Not applicable.
Conflicts of Interest: The authors declare no conflicts of interest to report regarding the present study.
Abbreviations
| SGK1 | Serum and glucocorticoid-regulated kinase 1 |
| NRK-52E | Normal rat kidney epithelial cells |
| RNA-seq | RNA sequencing |
| DEG | Differentially expressed gene |
| GSK | GSK 650394 (SGK1 inhibitor) |
| GO | Gene Ontology |
| KEGG | Kyoto Encyclopedia of Genes and Genomes |
| GSEA | Gene set enrichment analysis |
| ENaC | Epithelial sodium channel |
| ROMK | Renal outer medullary potassium channel |
| BK | Large-conductance calcium-activated potassium channel |
| RT-qPCR | Quantitative reverse transcription PCR |
| PVDF | Polyvinylidene fluoride |
| SDS-PAGE | Sodium dodecyl sulfate-polyacrylamide gel electrophoresis |
| ECL | Enhanced chemiluminescence |
| PCA | Principal component analysis |
| NHERF2 | Na+/H+ exchange regulatory factor 2 |
| WNK4 | With no lysine kinase 4 |
References
1. Gulzar M, Noor S, Hasan GM, Hassan MI. The role of serum and glucocorticoid-regulated kinase 1 in cellular signaling: implications for drug development. Int J Biol Macromol. 2024;258(Pt 1):128725. doi:10.1016/j.ijbiomac.2023.128725. [Google Scholar] [PubMed] [CrossRef]
2. Noor S, Mohammad T, Ashraf GM, Farhat J, Bilgrami AL, Eapen MS, et al. Mechanistic insights into the role of serum-glucocorticoid kinase 1 in diabetic nephropathy: a systematic review. Int J Biol Macromol. 2021; 193(Pt A):562–73. doi:10.1016/j.ijbiomac.2021.10.165. [Google Scholar] [PubMed] [CrossRef]
3. Sierra-Ramos C, Velazquez-Garcia S, Keskus AG, Vastola-Mascolo A, Rodriguez-Rodriguez AE, Luis-Lima S, et al. Increased SGK1 activity potentiates mineralocorticoid/NaCl-induced kidney injury. Am J Physiol Renal Physiol. 2021;320(4):F628–F43. doi:10.1152/ajprenal.00505.2020. [Google Scholar] [PubMed] [CrossRef]
4. Adella A, de Baaij JHF. mTOR signaling in renal ion transport. Acta Physiol. 2023;238(1):e13960. doi:10.1111/apha.13960. [Google Scholar] [PubMed] [CrossRef]
5. Nakamura M, Tsukada H, Seki G, Satoh N, Mizuno T, Fujii W, et al. Insulin promotes sodium transport but suppresses gluconeogenesis via distinct cellular pathways in human and rat renal proximal tubules. Kidney Int. 2020;97(2):316–26. doi:10.1016/j.kint.2019.08.021. [Google Scholar] [PubMed] [CrossRef]
6. Rotin D, Staub O. Function and regulation of the epithelial Na+ channel ENaC. Compr Physiol. 2021;11(3):2017–45. [Google Scholar] [PubMed]
7. Saha B, Shabbir W, Takagi E, Duan XP, Leite Dellova DCA, Demko J, et al. Potassium activates mTORC2-dependent SGK1 phosphorylation to stimulate epithelial sodium channel: role in rapid renal responses to dietary potassium. J Am Soc Nephrol. 2023;34(6):1019–38. [Google Scholar] [PubMed]
8. Yoo D, Kim BY, Campo C, Nance L, King A, Maouyo D, et al. Cell surface expression of the ROMK (Kir 1.1) channel is regulated by the aldosterone-induced kinase, SGK-1, and protein kinase A. J Biol Chem. 2003;278(25):23066–75. [Google Scholar] [PubMed]
9. Yun CC, Palmada M, Embark HM, Fedorenko O, Feng Y, Henke G, et al. The serum and glucocorticoid-inducible kinase SGK1 and the Na+/H+ exchange regulating factor NHERF2 synergize to stimulate the renal outer medullary K+ channel ROMK1. J Am Soc Nephrol. 2002;13(12):2823–30. [Google Scholar] [PubMed]
10. Ring AM, Leng Q, Rinehart J, Wilson FH, Kahle KT, Hebert SC, et al. An SGK1 site in WNK4 regulates Na+ channel and K+ channel activity and has implications for aldosterone signaling and K+ homeostasis. Proc Natl Acad Sci U S A. 2007;104(10):4025–9. [Google Scholar] [PubMed]
11. Rozansky DJ, Cornwall T, Subramanya AR, Rogers S, Yang YF, David LL, et al. Aldosterone mediates activation of the thiazide-sensitive Na-Cl cotransporter through an SGK1 and WNK4 signaling pathway. J Clin Invest. 2009;119(9):2601–12. [Google Scholar] [PubMed]
12. Kahle KT, Wilson FH, Leng Q, Lalioti MD, O’Connell AD, Dong K, et al. WNK4 regulates the balance between renal NaCl reabsorption and K+ secretion. Nat Genet. 2003;35(4):372–6. [Google Scholar] [PubMed]
13. Estilo G, Liu W, Pastor-Soler N, Mitchell P, Carattino MD, Kleyman TR, et al. Effect of aldosterone on BK channel expression in mammalian cortical collecting duct. Am J Physiol Renal Physiol. 2008;295(3):F780–8. [Google Scholar] [PubMed]
14. Sorensen MV, Matos JE, Sausbier M, Sausbier U, Ruth P, Praetorius HA, et al. Aldosterone increases KCa1.1 (BK) channel-mediated colonic K+ secretion. J Physiol. 2008;586(17):4251–64. [Google Scholar] [PubMed]
15. Wen D, Cornelius RJ, Yuan Y, Sansom SC. Regulation of BK-alpha expression in the distal nephron by aldosterone and urine pH. Am J Physiol Renal Physiol. 2013;305(4):F463–76. [Google Scholar] [PubMed]
16. Nickerson AJ, Rajendran VM. Aldosterone up-regulates basolateral Na+-K+-2Cl− cotransporter-1 to support enhanced large-conductance K+ channel-mediated K+ secretion in rat distal colon. FASEB J. 2021;35(5):e21606. [Google Scholar] [PubMed]
17. Yang L, Frindt G, Lang F, Kuhl D, Vallon V, Palmer LG. SGK1-dependent ENaC processing and trafficking in mice with high dietary K intake and elevated aldosterone. Am J Physiol Renal Physiol. 2017;312(1):F65–76. [Google Scholar] [PubMed]
18. Xie Y, Jiang D, Xiao J, Fu C, Zhang Z, Ye Z, et al. Ischemic preconditioning attenuates ischemia/reperfusion-induced kidney injury by activating autophagy via the SGK1 signaling pathway. Cell Death Dis. 2018;9(3):338. [Google Scholar] [PubMed]
19. Sharma R, Bhullar A, Bansal P, Kaur G, Gupta V. Bioinformatics analysis identifies potential hub genes, therapeutic agents, and crucial pathways in the pathogenesis of refsum’s disease. Medinformatics. 2023;1–12. doi:10.47852/bonviewMEDIN32021516. [Google Scholar] [CrossRef]
20. Sorensen MV, Saha B, Jensen IS, Wu P, Ayasse N, Gleason CE, et al. Potassium acts through mTOR to regulate its own secretion. JCI Insight. 2019;4(11):e126910. [Google Scholar]
21. Mutchler SM, Kirabo A, Kleyman TR. Epithelial sodium channel and salt-sensitive hypertension. Hypertension. 2021;77(3):759–67. doi:10.1161/HYPERTENSIONAHA.120.14481. [Google Scholar] [PubMed] [CrossRef]
22. Pearce D, Manis AD, Nesterov V, Korbmacher C. Regulation of distal tubule sodium transport: mechanisms and roles in homeostasis and pathophysiology. Pflugers Arch. 2022;474(8):869–84. doi:10.1007/s00424-022-02732-5. [Google Scholar] [PubMed] [CrossRef]
23. Sierra-Ramos C, Velazquez-Garcia S, Vastola-Mascolo A, Hernandez G, Faresse N, Alvarez de la Rosa D. SGK1 activation exacerbates diet-induced obesity, metabolic syndrome and hypertension. J Endocrinol. 2020;244(1):149–62. doi:10.1530/JOE-19-0275. [Google Scholar] [PubMed] [CrossRef]
24. Haas AV, En Yee L, Yuan YE, Wong YH, Hopkins PN, Jeunemaitre X, et al. Genetic predictors of salt sensitivity of blood pressure: the additive impact of 2 hits in the same biological pathway. Hypertension. 2021;78(6):1809–17. doi:10.1161/HYPERTENSIONAHA.121.18033. [Google Scholar] [PubMed] [CrossRef]
25. Zhou B, Zhang Y, Li S, Wu L, Fejes-Toth G, Naray-Fejes-Toth A, et al. Serum- and glucocorticoid-induced kinase drives hepatic insulin resistance by directly inhibiting AMP-activated protein kinase. Cell Rep. 2021;37(1):109785. doi:10.1016/j.celrep.2021.109785. [Google Scholar] [PubMed] [CrossRef]
26. Staub O, Debonneville A, Stifanelli M, Juffre A, Maillard MP, Gumz ML, et al. Renal tubular SGK1 is required to achieve blood pressure surge and circadian rhythm. Am J Physiol Renal Physiol. 2023;325(5):F629–F37. doi:10.1152/ajprenal.00211.2023. [Google Scholar] [PubMed] [CrossRef]
27. Wu C, Chen Z, Xiao S, Thalhamer T, Madi A, Han T, et al. SGK1 governs the reciprocal development of Th17 and regulatory T cells. Cell Rep. 2018;22(3):653–65. doi:10.1016/j.celrep.2017.12.068. [Google Scholar] [PubMed] [CrossRef]
28. Elijovich F, Kleyman TR, Laffer CL, Kirabo A. Immune mechanisms of dietary salt-induced hypertension and kidney disease: Harry Goldblatt Award for Early Career Investigators 2020. Hypertension. 2021;78(2):252–60. doi:10.1161/HYPERTENSIONAHA.121.16495. [Google Scholar] [PubMed] [CrossRef]
29. Yarmohammadi F, Karimi G. Serum and glucocorticoid-regulated kinase 1 (SGK1) as an emerging therapeutic target for cardiac diseases. Pharmacol Res. 2024;208:107369. doi:10.1016/j.phrs.2024.107369. [Google Scholar] [PubMed] [CrossRef]
30. Zhang M, Chen H, Liu MS, Zhu KY, Hao Y, Zhu DL, et al. Serum- and glucocorticoid-inducible kinase 1 promotes insulin resistance in adipocytes via degradation of insulin receptor substrate 1. Diabetes Metab Res Rev. 2021;37(4):e3451. doi:10.1002/dmrr.3451. [Google Scholar] [PubMed] [CrossRef]
31. Hill MA, Yang Y, Zhang L, Sun Z, Jia G, Parrish AR et al. Insulin resistance, cardiovascular stiffening and cardiovascular disease. Metabolism. 2021;119:154766. doi:10.1016/j.metabol.2021.154766. [Google Scholar] [PubMed] [CrossRef]
32. Jang H, Park Y, Jang J. Serum and glucocorticoid-regulated kinase 1: structure, biological functions, and its inhibitors. Front Pharmacol. 2022;13:1036844. doi:10.3389/fphar.2022.1036844. [Google Scholar] [PubMed] [CrossRef]
33. Zhu R, Yang G, Cao Z, Shen K, Zheng L, Xiao J, et al. The prospect of serum and glucocorticoid-inducible kinase 1 (SGK1) in cancer therapy: a rising star. Ther Adv Med Oncol. 2020;12:1758835920940946. doi:10.1177/1758835920940946. [Google Scholar] [PubMed] [CrossRef]
34. Anacker C, Cattaneo A, Musaelyan K, Zunszain PA, Horowitz M, Molteni R, et al. Role for the kinase SGK1 in stress, depression, and glucocorticoid effects on hippocampal neurogenesis. Proc Natl Acad Sci U S A. 2013;110(21):8708–13. doi:10.1073/pnas.1300886110. [Google Scholar] [PubMed] [CrossRef]
35. Kwon OC, Song JJ, Yang Y, Kim SH, Kim JY, Seok MJ, et al. SGK1 inhibition in glia ameliorates pathologies and symptoms in Parkinson disease animal models. EMBO Mol Med. 2021;13(4):e13076. doi:10.15252/emmm.202013076. [Google Scholar] [PubMed] [CrossRef]
Cite This Article
 Copyright © 2025 The Author(s). Published by Tech Science Press.
This work is licensed under a Creative Commons Attribution 4.0 International License , which permits unrestricted use, distribution, and reproduction in any medium, provided the original work is properly cited.
 Downloads
 Citation Tools