
 Submit a Paper
 Propose a Special lssue
 Open Access
ARTICLE
Cellular Knockdown of SELENOM Promotes Apoptosis Induction in Human Glioblastoma (A-172) Cells via Redox Imbalance
Institute of Cell Biophysics of the Russian Academy of Sciences, Federal Research Center “Pushchino Scientific Center for Biological Research of the Russian Academy of Sciences”, Pushchino, 142290, Russia
* Corresponding Author: Egor A. Turovsky. Email:
(This article belongs to the Special Issue: MitoROS: Exploring Mitochondria and Oxidative Stress)
BIOCELL 2026, 50(2), 10 https://doi.org/10.32604/biocell.2025.073728
Received 24 September 2025; Accepted 21 November 2025; Issue published 14 February 2026
 View Full Text
 Download PDF
Abstract
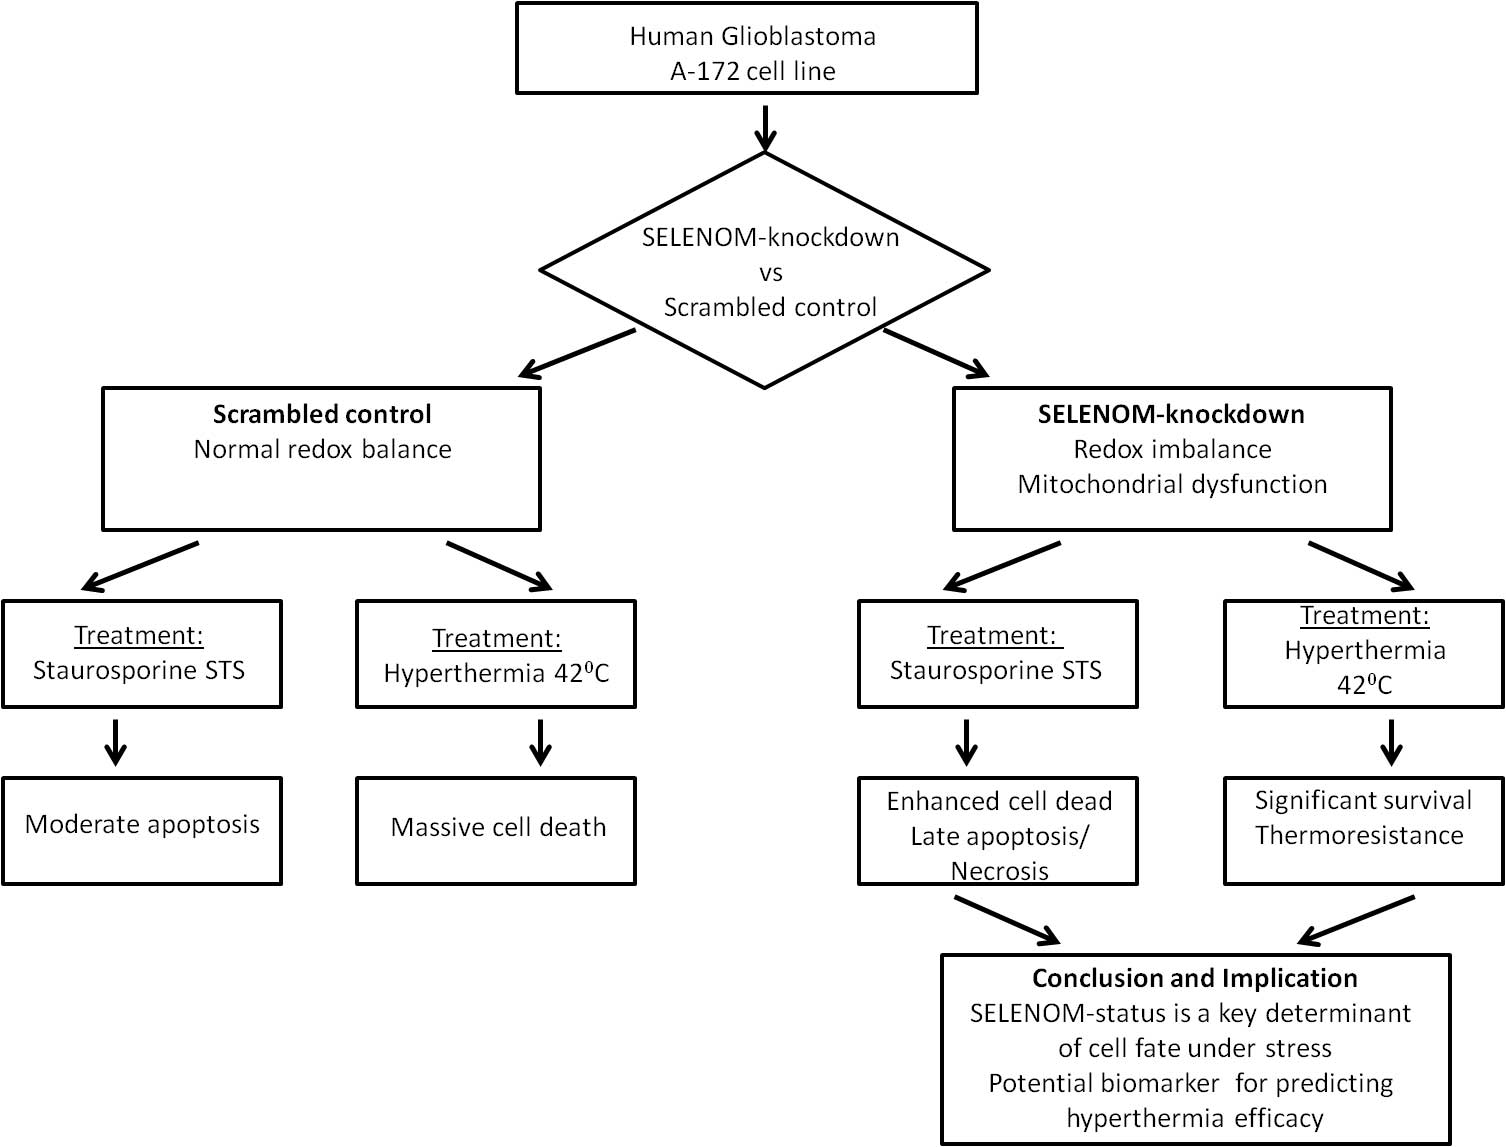
Objectives: Glioblastoma multiforme (GBM) is highly resistant to apoptosis. This study investigates the role of Selenoprotein M (SELENOM), a redox-regulating protein, in the response of human glioblastoma A-172 cells to staurosporine (STS) and hyperthermia. Methods: A stable SELENOM-knockdown (SELENOM-KD) cell line was created. We measured reactive oxygen species (ROS), mitochondrial membrane potential (ΔΨm), cell death, and apoptotic gene expression. Results: SELENOM-KD increased basal ROS levels and induced mitochondrial dysfunction. It sensitized cells to STS-induced apoptosis, enhancing the upregulation of pro-apoptotic genes. Conversely, under hyperthermia (42°C), SELENOM-KD cells exhibited significant thermoresistance, with 52% survival vs. 99% death in controls, associated with suppressed pro-apoptotic signaling. Conclusions: SELENOM is a critical redox and mitochondrial regulator in GBM. Its loss produces a context-dependent effect on cell fate: sensitizing to chemical apoptosis while conferring resistance to hyperthermia. SELENOM expression is a promising predictive biomarker for stratifying GBM patients for hyperthermia-based therapies.Graphic Abstract
Keywords
Supplementary Material
Supplementary Material FileGlioblastoma is the most aggressive and lethal primary brain tumor, characterized by rapid infiltrative growth, high resistance to standard therapy (temozolomide and radiotherapy), and an almost 100% recurrence rate [1,2]. A fundamental mechanism underlying therapy resistance is the innate aptitude of glioblastoma cells to escape apoptosis [3]. This phenomenon results from multiple molecular aberrations, such as overexpression of anti-apoptotic Bcl-2 (B-Cell Leukemia/Lymphoma 2) proteins, inactivation of pro-apoptotic factors like p53, and persistent activation of pro-survival pathways like PI3K/Akt and STAT3 (signal transducer and activator of transcription 3) [4,5]. Overcoming resistance to apoptosis is a primary objective in developing new glioblastoma treatments.
The role of redox homeostasis and selenoproteins in controlling tumor cell survival has garnered increasing attention in recent years [6]. Selenoproteins, which contain the amino acid selenocysteine in their active site, play a critical role in antioxidant defense, detoxification, redox signaling, and inflammation [7,8]. Among them, selenoprotein M (SELENOM) is of particular interest due to its predominant localization in the endoplasmic reticulum and its putative involvement in calcium homeostasis, the oxidative stress response, and neuroprotection [9–12]. It has been shown that SELENOM expression is altered in various cancer types; however, its specific role in the pathogenesis of glioblastoma, particularly in the context of apoptosis regulation and response to therapeutic interventions, remains largely unexplored.
Hyperthermia (exposure to elevated temperatures of 42°C–43°C) is a promising approach in cancer therapy, frequently used as a radiosensitizer [13]. However, glioblastoma cells also demonstrate significant resistance to this form of stress, largely due to the robust induction of heat shock proteins (HSPs) and the activation of adaptive pro-survival signaling pathways [14]. Consequently, the search for targets whose modulation could enhance tumor cell sensitivity to hyperthermia is of significant practical interest.
The rationale for this study was based on the hypothesis that SELENOM, as a key regulator of redox balance, plays an important role in controlling the survival of glioblastoma cells, and that its knockdown could modulate cell sensitivity to pro-apoptotic stimuli such as staurosporine and to hyperthermia.
To specifically investigate the role of SELENOM in the stress response, we selected two distinct stressors known to disrupt cellular processes in which SELENOM is involved. Staurosporine, a broad-spectrum kinase inhibitor, induces intrinsic apoptosis primarily through mitochondrial dysfunction and ROS generation [15,16]. Hyperthermia, a physical stressor, also disrupts mitochondrial integrity and induces significant proteotoxic and oxidative stress [17,18]. The hyperthermia conditions (42°C for 24 h) were selected based on established protocols in the field of cancer biology [19,20]. This regimen represents a clinically relevant mild hyperthermia, which has been shown to effectively induce cytotoxic effects, including proteotoxic and oxidative stress, in various cancer cell lines without causing immediate necrosis [21]. Furthermore, such hyperthermia parameters are known to inhibit DNA repair pathways and are actively investigated as a sensitizing modality in combinatorial cancer therapy [13]. Thus, we hypothesized that SELENOM, as a key regulator of redox homeostasis and endoplasmic reticulum function [22,23], would critically determine cell fate upon exposure to these specific damaging factors, making them ideal models for studying its context-dependent functions. The aim of the work was to investigate the effect of SELENOM gene knockdown on the induction of apoptosis, mitochondrial function, redox status, and survival of glioblastoma A-172 cells under conditions of staurosporine exposure and moderate hyperthermia (42°C).
The human glioblastoma A-172 cell line (Cat# CRL-1620) was obtained from the American Type Culture Collection (ATCC, Manassas, VA, USA). Cells were cultured in Dulbecco’s Modified Eagle Medium (DMEM, Thermo Fisher Scientific, Cat# 11965092, Waltham, MA, USA) containing 10% fetal bovine serum (FBS, Gibco, Cat# 10270106, Waltham, MA, USA) and 50 μg/mL gentamicin at 37°C in a 5% CO2 humidified atmosphere. For experiments, cells were seeded on round 25 mm coverslips (VWR International, Cat# 48382-085, Radnor, PA, USA) at a density of 3.0 × 10⁵ cells per well and allowed to grow for 48 h until reaching 80%–95% confluence, as determined by daily microscopic observation. Cell line was maintained under standard sterile conditions and regularly checked for morphological characteristics and growth patterns. The selected confluency range ensured optimal cell viability and experimental consistency across different assays. Cell culture reagents were purchased from Thermo Fisher Scientific unless otherwise specified, and all procedures were performed under aseptic conditions in a certified biosafety cabinet. Cells were tested for mycoplasma contamination using the MycoAlert™ Mycoplasma Detection Kit (Cat# LT07-318, Lonza, Basel, Switzerland) according to the manufacturer’s protocol. All experiments were performed with mycoplasma-free cells.
2.2 Generation of SELENOM-Knockdown Cells via RNAi and Lentiviral Transduction
For target gene knockdown, the RNA interference method was employed using a vector containing a small hairpin RNA (shRNA) sequence. shRNA design was performed using the online platform siRNA Wizard (Invitrogen, Carlsbad, CA, USA), selecting 3–5 different variants for the SELENOM gene. But the most effective sequence turned out to be shRNA SELENOM (5′ → 3′ gctttcgtcacgcaggacattttcaagagaaatgtcctgcgtgacgaaagctttttt). Scramble shRNA (a non-specific sequence) was used as a control, allowing for the assessment of knockdown specificity and potential off-target effects.
Delivery of shRNA into cells was achieved via lipofection using Lipofectamine 2000 reagent (Invitrogen, Carlsbad, CA, USA). For this purpose, 5 × 10⁴ A-172 cells were grown in a 24-well plate to 70%–80% confluency. The cells were grown in a 5% CO2 incubator at 37°C in DMEM medium supplemented with 10% serum and antibiotics for 24 h. A solution containing 1 μg of shRNA was then prepared with serum-free Opti-MEM medium. Lipofectamine (Invitrogen, Carlsbad, CA, USA) (1 μL) was separately diluted in 1 mL of serum-free Opti-MEM medium (Thermo Fisher Scientific, Cat# 31985070, Waltham, MA, USA). The two solutions were then mixed and incubated for 20 min at room temperature. After incubation, the resulting complex was added to the cells, incubated for 48 h, and then the transfection efficiency was analyzed using fluorescence microscopy. The pGPV vector (general-purpose vector), containing the P1 promoter for shRNA expression, also included the gene for the CopGFP fluorescent protein, enabling the evaluation of transfection efficiency by inverted motorized microscope Leica DMI6000B (Leica Microsystems, Wetzlar, Germany) with a high-speed monochrome CCD-camera HAMAMATSU C9100 (Hamamatsu Photonics, Hamamatsu, Japan) and a high-speed light filter replacing system Leica’s Ultra-Fast Filter Wheels (Leica Microsystems, Wetzlar, Germany).
For stable shRNA expression in target cells, lentiviral particles were utilized. The construction of lentiviral vectors and the production of viral particles were carried out by Evrogen Company (Moscow, Russia). Transduction of 5 × 10⁴ tumor cells was performed in 24-well plates during the logarithmic growth phase (60%–70% confluency). To achieve 80%–90% efficiency, a 5-fold excess of lentivirus (500 μL of particles with a titer of 106 IU/mL per 105 cells, multiplicity of infection [MOI] is 10) was used. After 24 h, the medium was replaced, and transduction efficiency was assessed after 72 h by CopGFP fluorescence. The knockdown efficiency after transduction with lentiviral particles was also assessed using real-time PCR (polymerase chain reaction) and Western blotting.
Selection of successfully transduced cells was carried out in a medium containing puromycin (1 µg/mL medium) (Cat# A1113803, Invitrogene, Carlsbad, CA, USA), as the pGPV vector contained a resistance gene for this antibiotic. Knockdown efficiency was confirmed using quantitative real-time PCR and Western blotting methods (Supplementary Fig. S1). This approach provided specific and stable suppression of SELENOM expression in the studied cell lines.
2.3 Cell Viability and Death Assessment
The assessment of cell viability and detection of necrosis and apoptosis were performed using fluorescent nuclear staining with 1 μM propidium iodide (PI) (Sigma-Aldrich, Cat# P4170, St. Louis, MO, USA) and 1 μM Hoechst 33342 (HO342) (Abcam, Cat# ab228551, Cambridge, UK). Cells were incubated with the dye-containing solution (HBSS medium) for 20 min at 37°C. Following the incubation, the dye solution was gently removed, and the cells were washed twice. Hoechst 33342 stains chromatin in all cells but shows 3–4 times higher fluorescence intensity in apoptotic cells due to chromatin condensation, while propidium iodide selectively stains nuclei of necrotic cells with compromised membranes but cannot penetrate viable cells. Fluorescence imaging was conducted using an Axio Observer Z1 inverted microscope (Carl Zeiss Microscopy GmbH, Jena, Germany) equipped with a Hamamatsu ORCA-Flash 2.8 high-speed monochrome CCD camera (Hamamatsu Photonics, Hamamatsu City, Japan) and a Lambda DG-4 Plus illumination system (Sutter Instrument, Novato, CA, USA). Two filter sets were employed for fluorescence detection: set 01 with BP 365/12 excitation filter, FT395 beam splitter, and LP 397 emission filter for Hoechst 33342; and set 20 with BP 546/12 excitation filter, FT560 beam splitter, and BP 575-640 emission filter for propidium iodide. Imaging was performed using an HCX PL APO 20.0×/0.70 IMM UV objective with a refractive index of 1.52. This approach allowed clear discrimination between viable cells (Hoechst-positive only), apoptotic cells (intensely Hoechst-positive), and necrotic cells (PI-positive). The method provided a quantitative assessment of different cell death pathways while maintaining high specificity and sensitivity for each cell state. All imaging parameters were carefully standardized and maintained constant throughout the experiments to ensure consistency in fluorescence detection and subsequent quantitative analysis by ImageJ software (Java 1.6.0_12, Version 1.43, RRID: SCR_003070, LOCI, University of Wisconsin, Madison, WI, USA).
2.4 Assessment of Mitochondrial Membrane Potential
Measurement of ΔΨm in acute experiments (5–6 min registration) was performed using the fluorescent probe Rhodamine 123 (Rh-123) (Thermo Fisher Scientific, Сat# R302, Waltham, MA, USA). Cells were loaded with 1 μM Rh-123 for 15 min at 37°C in Hanks’ Balanced Salt Solution (HBSS). Subsequently, the cells were washed three times with the working HBSS medium. The HBSS contained (in mM): 138 NaCl, 1.3 CaCl2, 0.4 MgSO4, 0.5 MgCl2, 5.3 KCl, 0.45 KH2PO4, 4 NaHCO3, 0.3 Na2HPO4, 10 glucose, and 20 HEPES (pH = 7.3). Measurements were performed using a fluorescence imaging station based on a Leica DMI6000 B inverted microscope (Leica Microsystems, Wetzlar, Germany). The excitation wavelength of the probe fluorescence was 488 nm, and the emission wavelength was 525 nm. The probe concentration was 1 μM. At a ratio of 1 μM probe/1 mg mitochondrial protein/1 mL, a linear dependence of changes in the probe fluorescence intensity on ΔΨm changes was observed in the range from 50 to 200 mV. At these concentrations, Rhodamine 123 did not affect oxidative phosphorylation parameters [24]. The mitochondrial staining protocol used in the cells leads to concentration-dependent quenching of the dye molecules in energized mitochondria. Consequently, depolarization of the mitochondrial membranes results in an increase in Rh-123 fluorescence [25]. During the experiments, image series were acquired at 5-s intervals. To assess ΔΨm, regions in the vicinity of the nucleus were selected. The addition of 1 μM FCCP in the experiments revealed the maximum degree of mitochondrial depolarization. For the processing of ΔΨm measurement data, the ImageJ software (Java 1.6.0_12, RRID: SCR_003070, LOCI, University of Wisconsin, Madison, WI, USA) with the Time Series Analyzer plugin was used. The software was used to calculate the mean pixel intensity values within each defined region of interest (ROI) for every frame in the image series.
2.5 Evaluation of Intracellular Oxidative Stress Levels
The generation of reactive oxygen species (ROS) was quantified using the oxidation-sensitive fluorescent indicator 2′,7′-dichlorodihydrofluorescein diacetate (H2DCF-DA) (Cat# D399, Thermo Fisher Scientific, Waltham, MA, USA). Cells were plated in 96-well microplates (1.5 × 10⁴ cells per well) and allowed to adhere for 48 h until they reached 90% confluence. Cells were cultured in DMEM supplemented with 10% fetal bovine serum (FBS) and 50 μg/mL gentamicin at 37°C in a humidified atmosphere containing 5% CO2.
Prior to analysis, cells were gently washed with phosphate-buffered saline to remove residual compounds, followed by loading with 20 μM H2DCF-DA in serum-free DMEM. The dye loading was performed for 30 min under standard culture conditions (37°C, 5% CO2). Fluorescence measurements were conducted using a Spark 10M microplate reader (Tecan Trading AG, Männedorf, Switzerland) configured with 485 nm excitation and 535 nm emission wavelengths. Settings: Excitation/emission filters: 485 nm (excitation), 530 nm (emission), gain—120, number of flashes per well—20, exposure time—40 μs, background correction—fluorescence from untreated cells (negative control) was subtracted. To account for potential photobleaching effects and minimize light-induced artifact generation, fluorescence readings were collected at regular 5-min intervals.
For positive control conditions, baseline fluorescence was established before introducing 10 μM antimycin A as a known ROS-generating compound. Acquired fluorescence data underwent initial processing using ImageJ analysis software (Java 1.6.0_12, Version 1.43, RRID: SCR_003070, LOCI, University of Wisconsin, Madison, WI, USA), with subsequent statistical evaluation and visualization performed using Origin 8.5 (Microcal Software Inc., Northampton, MA, USA) and GraphPad Prism 8 (GraphPad Software, Boston, MA, USA). Results represent averaged values from three or more independent biological experiments, with each condition measured in triplicate, and are presented as mean values ± standard error of the mean (SEM). This optimized protocol ensures sensitive detection of oxidative stress while maintaining experimental consistency across replicates and treatment conditions. The methodology accounts for potential confounding factors through controlled measurement intervals and inclusion of appropriate positive controls.
Total RNA was isolated from cultured cells using the Extract RNA reagent (Evrogen, Moscow, Russia, Cat# BC032), a phenol-guanidine isothiocyanate-based solution. For optimal extraction, 1 mL of reagent was added per 10 cm2 of cell monolayer surface area, following the manufacturer’s standardized protocol. To eliminate potential genomic DNA contamination, all RNA samples subsequently underwent DNase I treatment (Thermo Fisher Scientific, Waltham, MA, USA, Cat# EN0521) using 1 U of enzyme per 1 μg of total RNA. The reaction was carried out at 37°C for 60 min, followed by enzyme inactivation with EDTA (50 mM final concentration) and heat treatment at 60°C for 10 min.
RNA purity and integrity were then verified through two complementary methods: (1) spectrophotometric analysis with absorbance measurements at 260 nm, and (2) electrophoretic separation on 1% agarose gels. The gels contained ethidium bromide (EtBr) (Cat# A1152.0025, PanReac AppliChem, Darmstadt, Germany) at a concentration of 0.5 μg/mL. Electrophoresis was performed at an operating voltage of up to 10 V/cm for 30 min.
2.7 cDNA Synthesis and Quantitative PCR Analysis
First-strand cDNA synthesis was performed using the MMLV reverse transcriptase kit (Evrogen, Moscow, Russia, Cat# SK021) with oligo (dT) primers. Input RNA quantities (1–2 μg per reaction) were normalized by parallel amplification of reference genes. The DTlite Real-Time PCR System (DNA-technology, Moscow, Russia) was used for amplification. Quantitative PCR was conducted using qPCRmix-HS SYBR master mix (Evrogen, Moscow, Russia, Cat# PK147L) under the following thermal cycling conditions: initial denaturation at 95°C for 1 min of denaturation, followed by 40 cycles: (95°C, 10 s), annealing (60°C, 10 s), and extension (72°C, 15 s). Fluorescence detection occurred during the elongation phase, with subsequent melting curve analysis (60°C–95°C, 0.3°C increments).
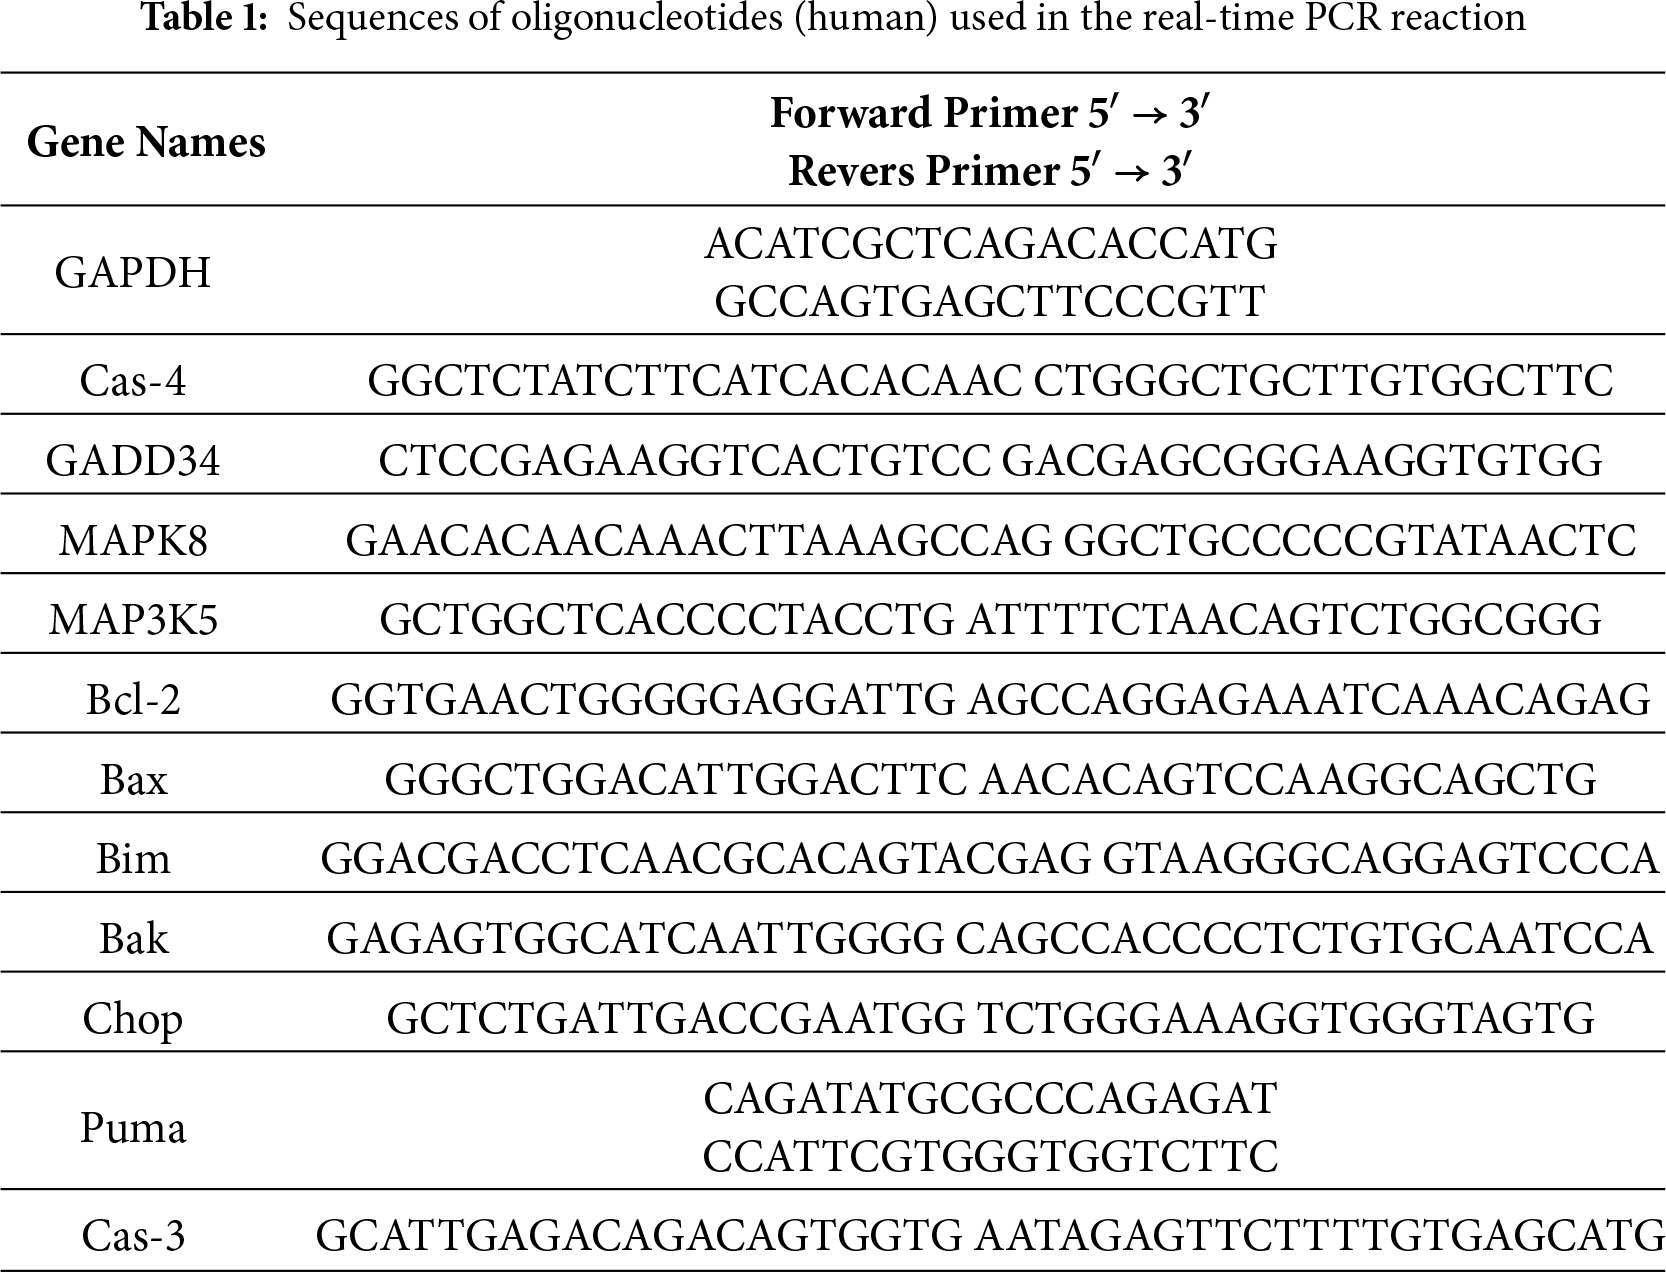
Gene expression levels were calculated using the 2−ΔΔCt method, where ΔΔCt represents the normalized difference in threshold cycles between target and reference genes. The housekeeping gene GAPDH (Glyceraldehyde-3-Phosphate Dehydrogenase) served as the internal control. Primer design followed stringent criteria: (1) exon-spanning configuration to avoid genomic DNA amplification, (2) amplicon lengths between 150–300 bp, and (3) validation through post-amplification electrophoresis on 2% agarose gels with the addition of ethidium bromide (EtBr) (PanReac AppliChem, Darmstadt, Germany, Cat# A1152.0025) at a concentration of 0.5 μg/mL. An operating voltage of up to 10 V/cm was used (10 V for each cm of space between the electrodes in the electrophoretic chamber), and the electrophoresis time was 30 min. All sequences were designed with FAST PCR 5.4 and NCBI Primer-BLAST software (Table 1).
All experimental data were processed and analyzed using Microsoft Excel (Microsoft Corp.) and GraphPad Prism 8 (GraphPad Software, Boston, MA, USA). Results are presented as mean values ± standard error (SE) derived from a minimum of three independent biological replicates. Data visualization and statistical analysis were conducted using Origin 8.5 (OriginLab Corporation, Northampton, MA, USA) and Prism 8. For comparisons among three or more independent groups (Control, Scrambled, SELENOM-KD under the same condition), a one-way ANOVA was applied, followed by Tukey’s honest significant difference (HSD) post-hoc test for multiple comparisons. For data sets with two independent variables (the effect of both genotype and STS concentration on gene expression or on cell death), a two-way ANOVA was performed, followed by Sidak’s post-hoc test for multiple comparisons. All statistical tests were performed as two-tailed comparisons with a 95% confidence interval. Variance similarity between the compared groups was verified using the homogeneity of variances. The following significance thresholds were applied: ***p < 0.001 (highly significant), **p < 0.01 (very significant), *p < 0.05 (significant), n/s (not significant) for p ≥ 0.05.
3.1 The Effects of SELENOM Knockdown on the Production of ROS and Mitochondrial Membrane Potential (ΔΨm)
To assess the impact of SELENOM gene knockdown on oxidative stress, we analyzed the level of ROS using the fluorescent probe DCF-DA. Measurements were taken over 4 h in four experimental groups: a control (non-mutated cells), cells transfected with scrambled (non-specific) siRNA, cells with SELENOM knockdown (SELENOM-KD), and cells treated with the complex III inhibitor antimycin A, which served as a positive control for ROS induction. It is known that selenium nanoparticles (SeNPs) are highly effective inducers of ROS production in various cancer cell lines [26]. Application of 5 μg/mL SeNPs to control A-172 cells caused an increase in ROS production, reaching up to 5000 fluorescence arbitrary units after 3–4 h of DCF-DA fluorescence recording (Fig. 1A, black curve).
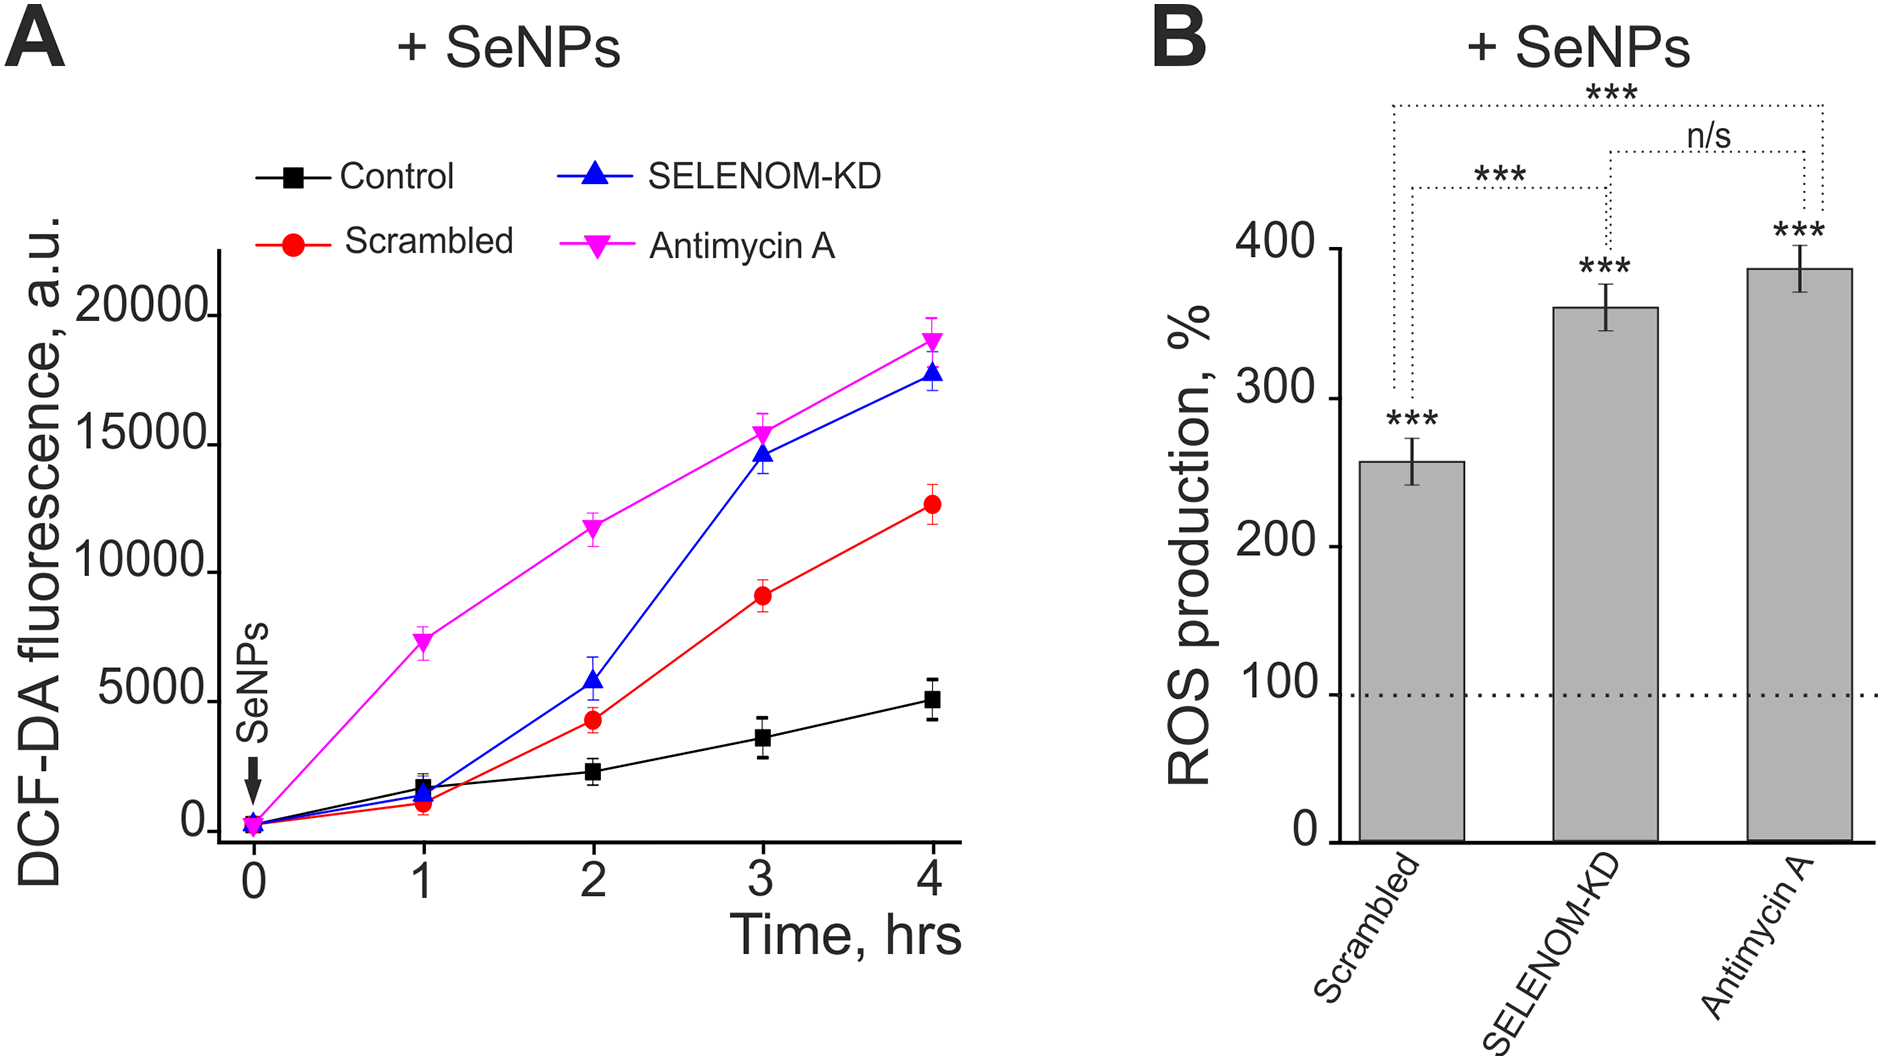
Figure 1: Effect of SELENOM knockdown and selenium nanoparticles (SeNPs) on reactive oxygen species (ROS) production in human glioblastoma A-172 cells. (A) Dynamics of ROS production over 4 h following treatment with 5 μg/mL SeNPs in three cell groups: untreated cells (Control), cells transfected with scramble shRNA (Scrambled), and cells with SELENOM knockdown (SELENOM-KD). Antimycin A was used as a positive control. ROS levels were measured based on the fluorescence of the DCF-DA dye (in arbitrary units—a.u.). Data are presented as mean ± SEM (n = 3). (B) ROS production level 4 h after SeNPs treatment, expressed as a percentage relative to the untreated control (the dashed line corresponds to 100%). Statistical significance was determined using a one-way ANOVA, followed by Tukey’s honest significant difference (HSD) post-hoc test: ***p < 0.001; n/s—not significant (p ≥ 0.05)
In contrast, in the Scrambled and SELENOM-KD groups, SeNPs application induced ROS production as early as 2 h after exposure (Fig. 1A, red and blue curves). However, after 4 h of recording, the ROS level in A-172 cells from the Scrambled group was 2.5 times higher, and in the SELENOM-KD group, it was 3.6 times higher compared to the control (Fig. 1B). Application of antimycin A to A-172 cells increased ROS production within 1 h of addition (Fig. 1A, pink curve), and the ROS level after 4 h was 3.83 times higher than in the control (Fig. 1B), showing no significant difference from the SELENOM-KD group exposed to SeNPs.
Thus, SELENOM gene knockdown critically compromises the ability of human glioblastoma A-172 cells to withstand additional oxidative stress. SELENOM-KD cells exhibit hypersensitivity to pro-oxidants, as demonstrated here with selenium nanoparticles. This suggests severe impairment of the antioxidant system and a loss of redox homeostasis.
The elevated ROS level in SELENOM-knockdown cells upon pro-oxidant exposure strongly suggests impaired mitochondrial function. To assess the functional state of the mitochondria, we measured the mitochondrial membrane potential (ΔΨm) using the fluorescent probe Rhodamine-123 (Fig. 2). Fluorescence intensity was recorded over 300 s in control cells, cells transfected with non-specific siRNA (scrambled), and cells with SELENOM gene knockdown (SELENOM-KD). The baseline fluorescence, reflecting the basal ΔΨm, was comparable across all three groups, indicating no significant differences in the initial membrane potential between the control, scrambled, and SELENOM-KD cells. A key difference between the groups emerged in their response to the addition of the oxidative phosphorylation uncoupler FCCP (carbonyl cyanide-4-(trifluoromethoxy)phenylhydrazone). In control and scrambled cells, FCCP addition caused a rapid and expected drop in ΔΨm, visualized as a sharp increase in Rh-123 fluorescence. This result confirms that the mitochondria in these groups are functional and capable of responding to pharmacological stimuli (Fig. 2). In contrast, the depolarization response to FCCP was significantly impaired in the SELENOM-KD cell line. The rate and amplitude of the Rh-123 fluorescence increase were substantially lower compared to the control groups. This indicates an impaired ability of the mitochondria to depolarize in response to FCCP.
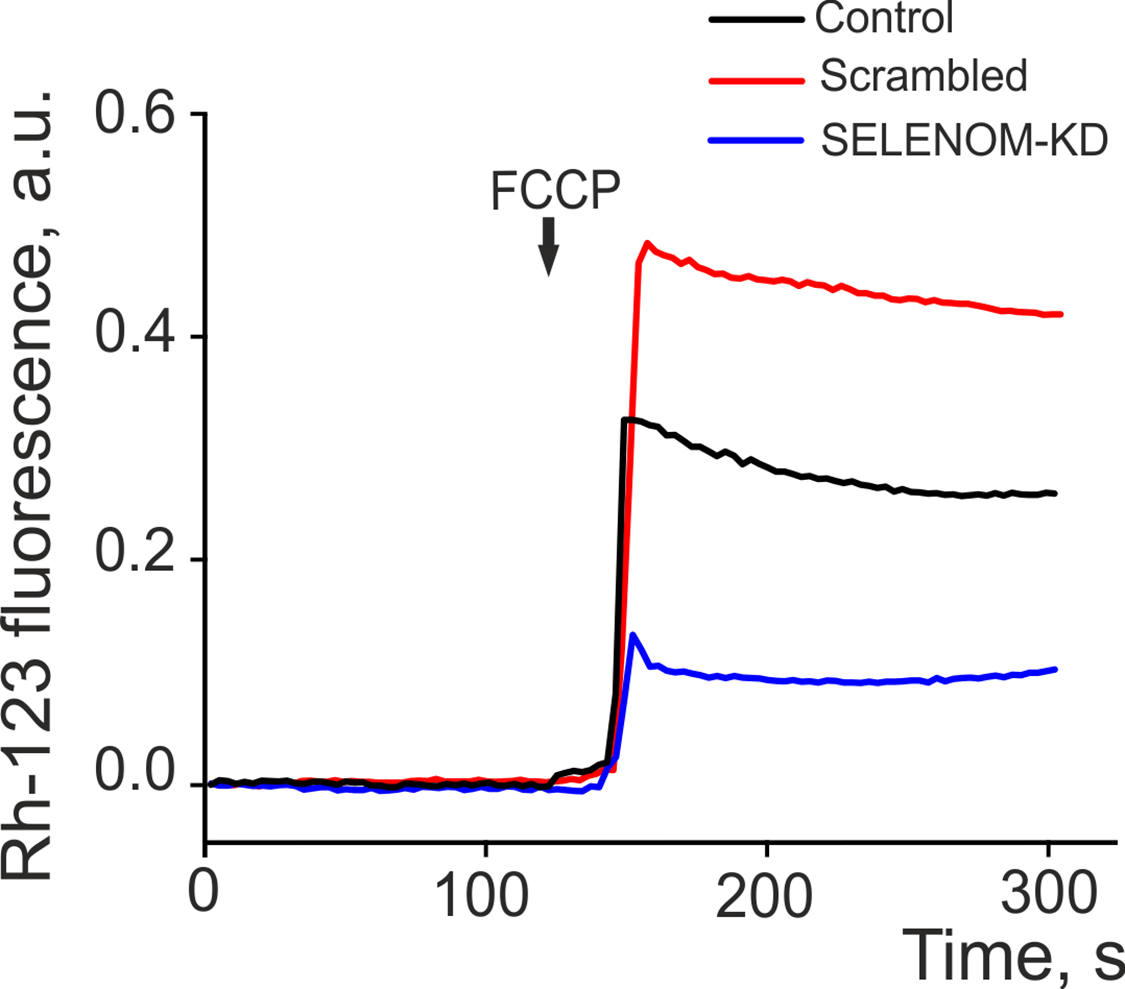
Figure 2: Dynamics of mitochondrial membrane potential (ΔΨm) changes, measured by Rhodamine 123 (Rh-123) fluorescence (in arbitrary units—a.u.), in three cell groups: untreated cells (Control), cells transfected with scramble shRNA (Scrambled), and cells with SELENOM knockdown (SELENOM-KD). The arrow indicates the time point of 1 μM FCCP, a protonophore, addition. The averaged curves from the analysis of 35 cells per group are shown
Thus, despite a comparable initial ΔΨm, SELENOM gene knockdown led to an impaired mitochondrial functional response. The attenuated reaction to FCCP in the SELENOM-KD group indicates profound disruptions in the mitochondrial electron transport chain or in the mechanisms regulating ion transport, rendering the mitochondria incapable of adequately responding to metabolic stress.
3.2 Effects of SELENOM Knockdown on Staurosporine- and Hyperthermia-Induced Cell Death
Fig. 3 presents microphotographs of A-172 cell cultures: untreated, transfected with scramble shRNA, and with SELENOM gene knockdown. As can be seen in the images, the cells in all groups formed a confluent monolayer. Propidium iodide (PI) staining revealed the absence of massive necrotic cell death in the Scrambled and SELENOM-KD groups. At the same time, eGFP fluorescence demonstrates high transfection efficiency. Conversely, a small number of PI-positive cells were observed in the untreated (non-transfected) control, indicating spontaneous cell death.
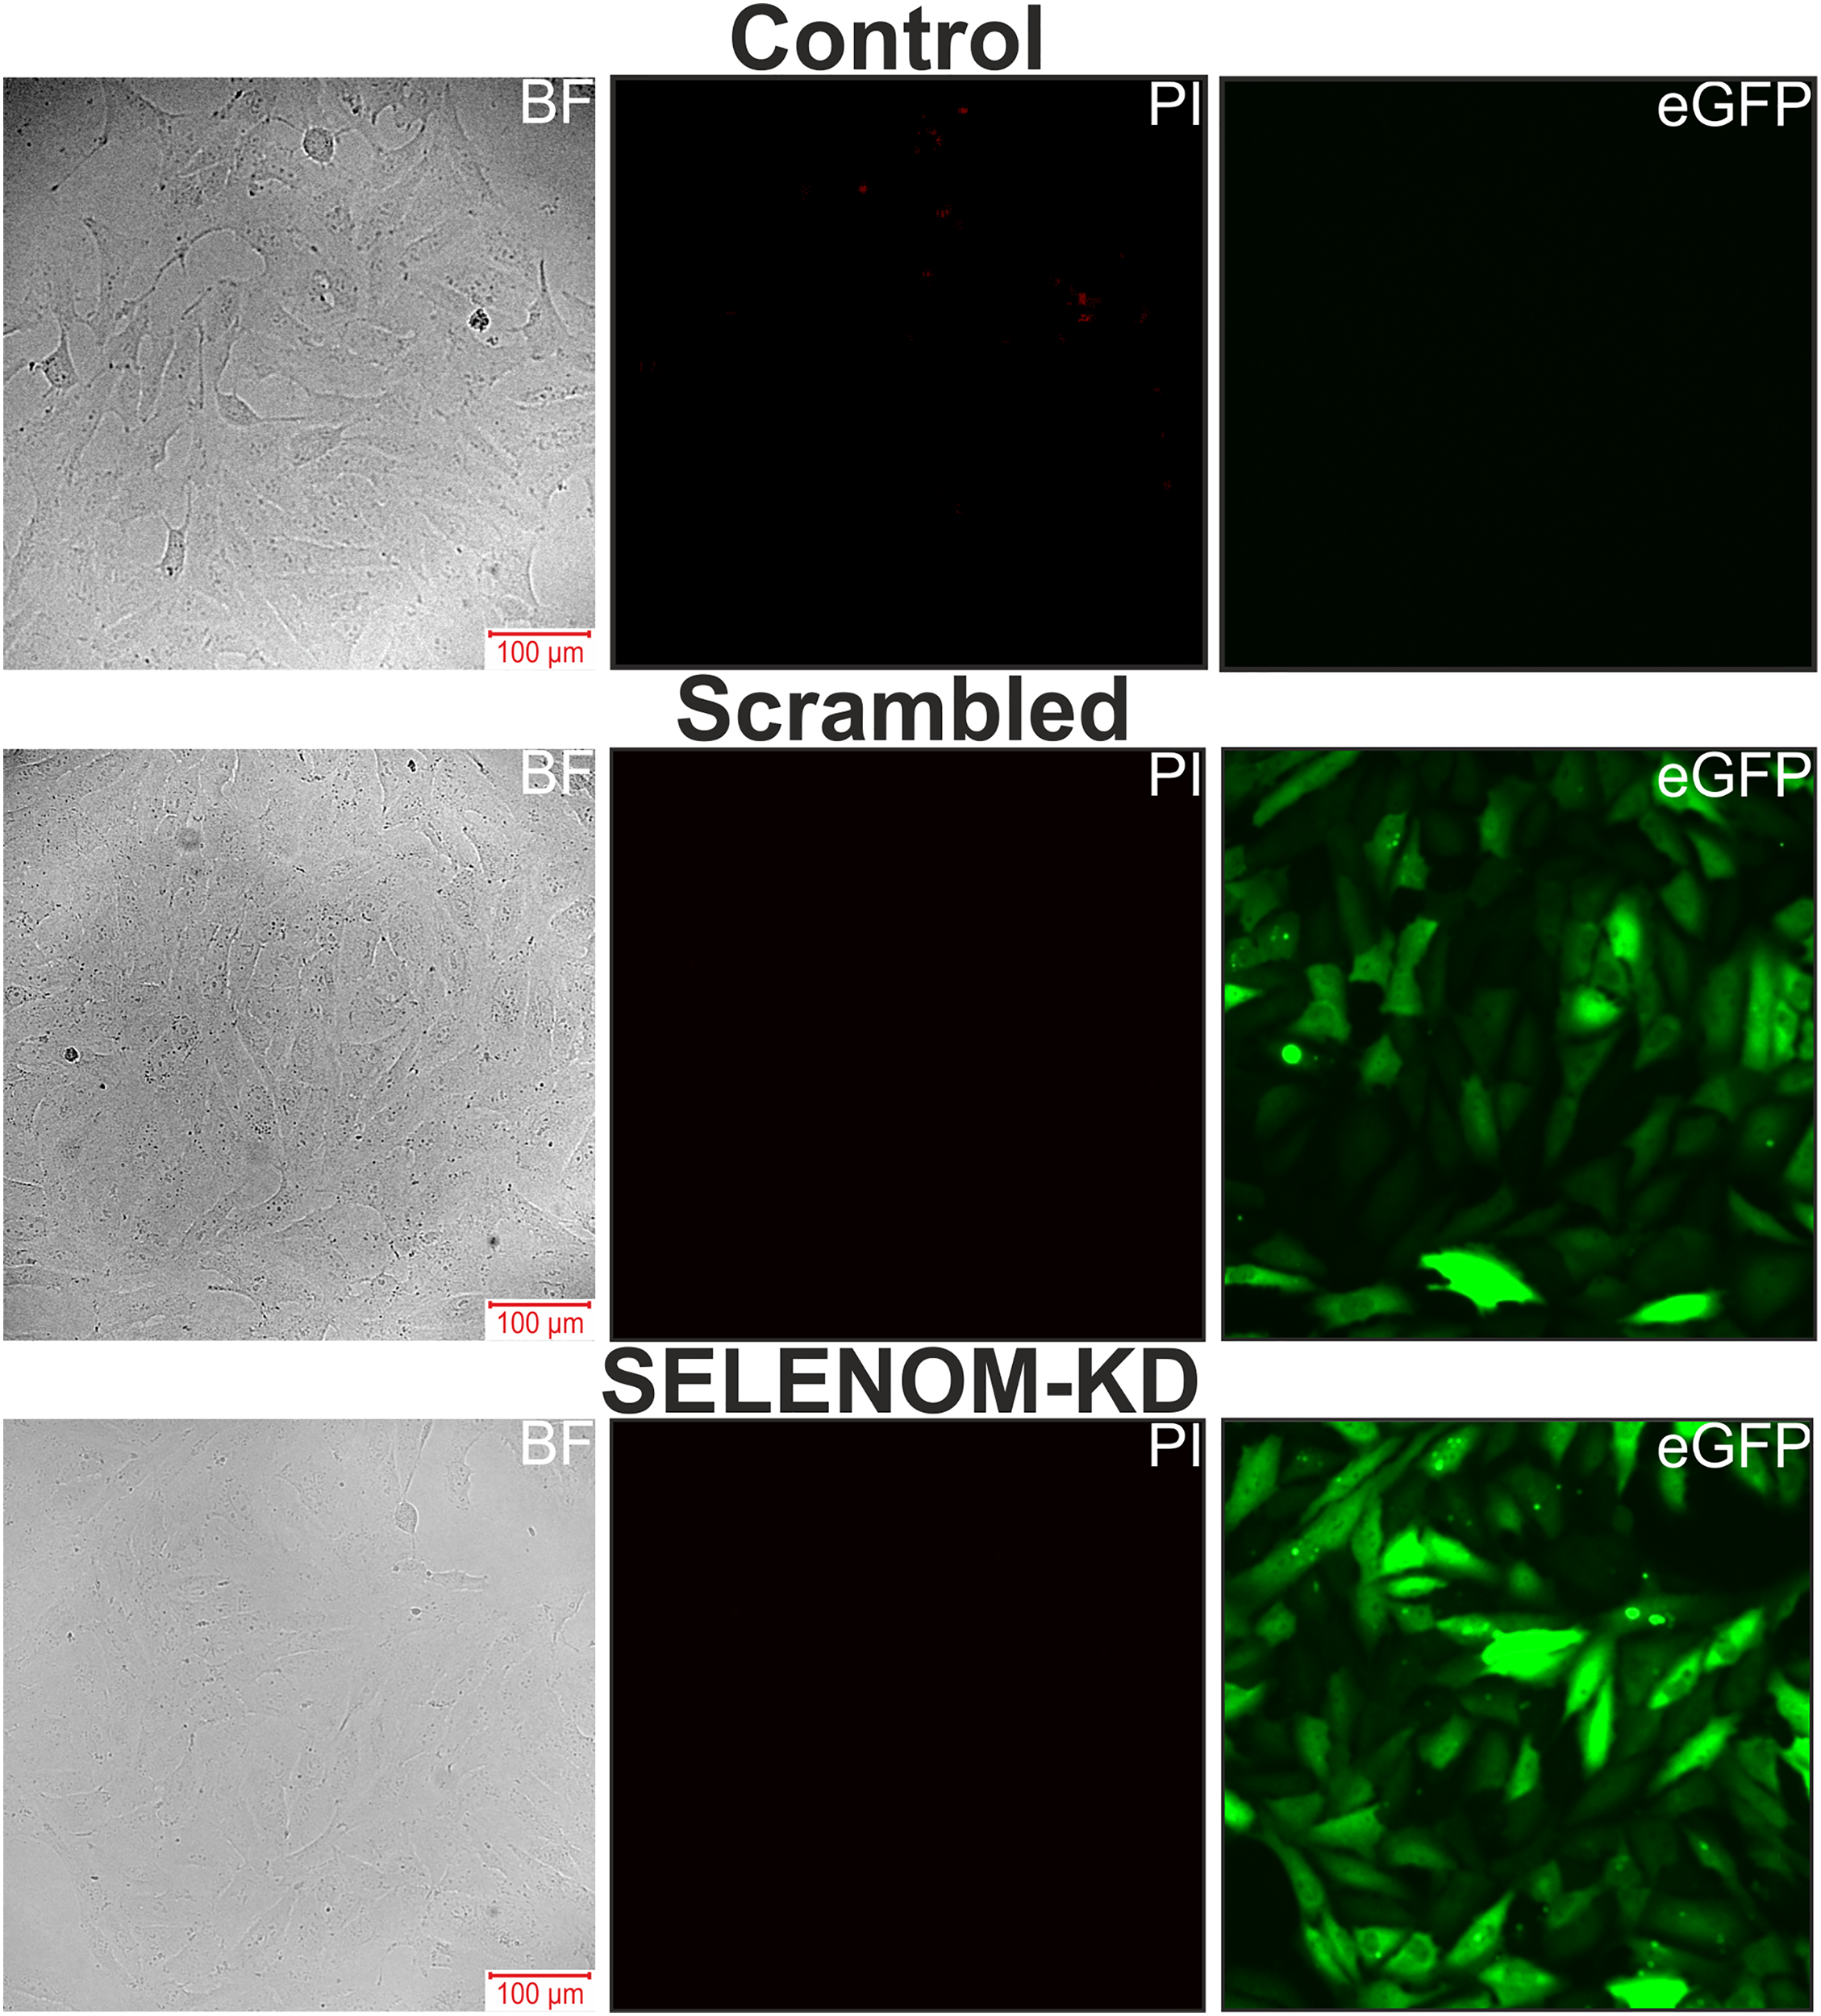
Figure 3: Microscopy images of human glioblastoma A-172 cell cultures in bright field (BF), propidium iodide (PI) fluorescence channel, and eGFP fluorescence channel. Control—untreated cells; Scrambled—cells transfected with scramble shRNA; SELENOM-KD—cells with SELENOM knockdown
To investigate the effects of SELENOM knockdown on cell death, various concentrations of the broad-spectrum protein kinase inhibitor and pro-apoptotic agent staurosporine (STS) were added to the cells for 24 h after they reached confluence. The cells were then stained with the fluorescent probes Hoechst 33342 and Propidium iodide (PI); simultaneous staining with these dyes allows for the identification of necrotic, early apoptotic, and late apoptotic cells.
In the Scrambled group without STS treatment, early and late apoptosis were detected in 4% and 8% of cells, respectively (Fig. 4A,B). After a 24-h pre-incubation of A-172 cells from the Scrambled group with 1 μM STS, early and late apoptosis were observed in 26% and 1% of cells, respectively. Increasing the STS concentration to 5 μM led to the induction of early and late apoptosis in 31% and 2% of cells. Following pre-incubation with 10 μM STS, early apoptosis was recorded in 53% of cells, late apoptosis in 10%, and necrosis in 3% of cells (Fig. 4A,B).
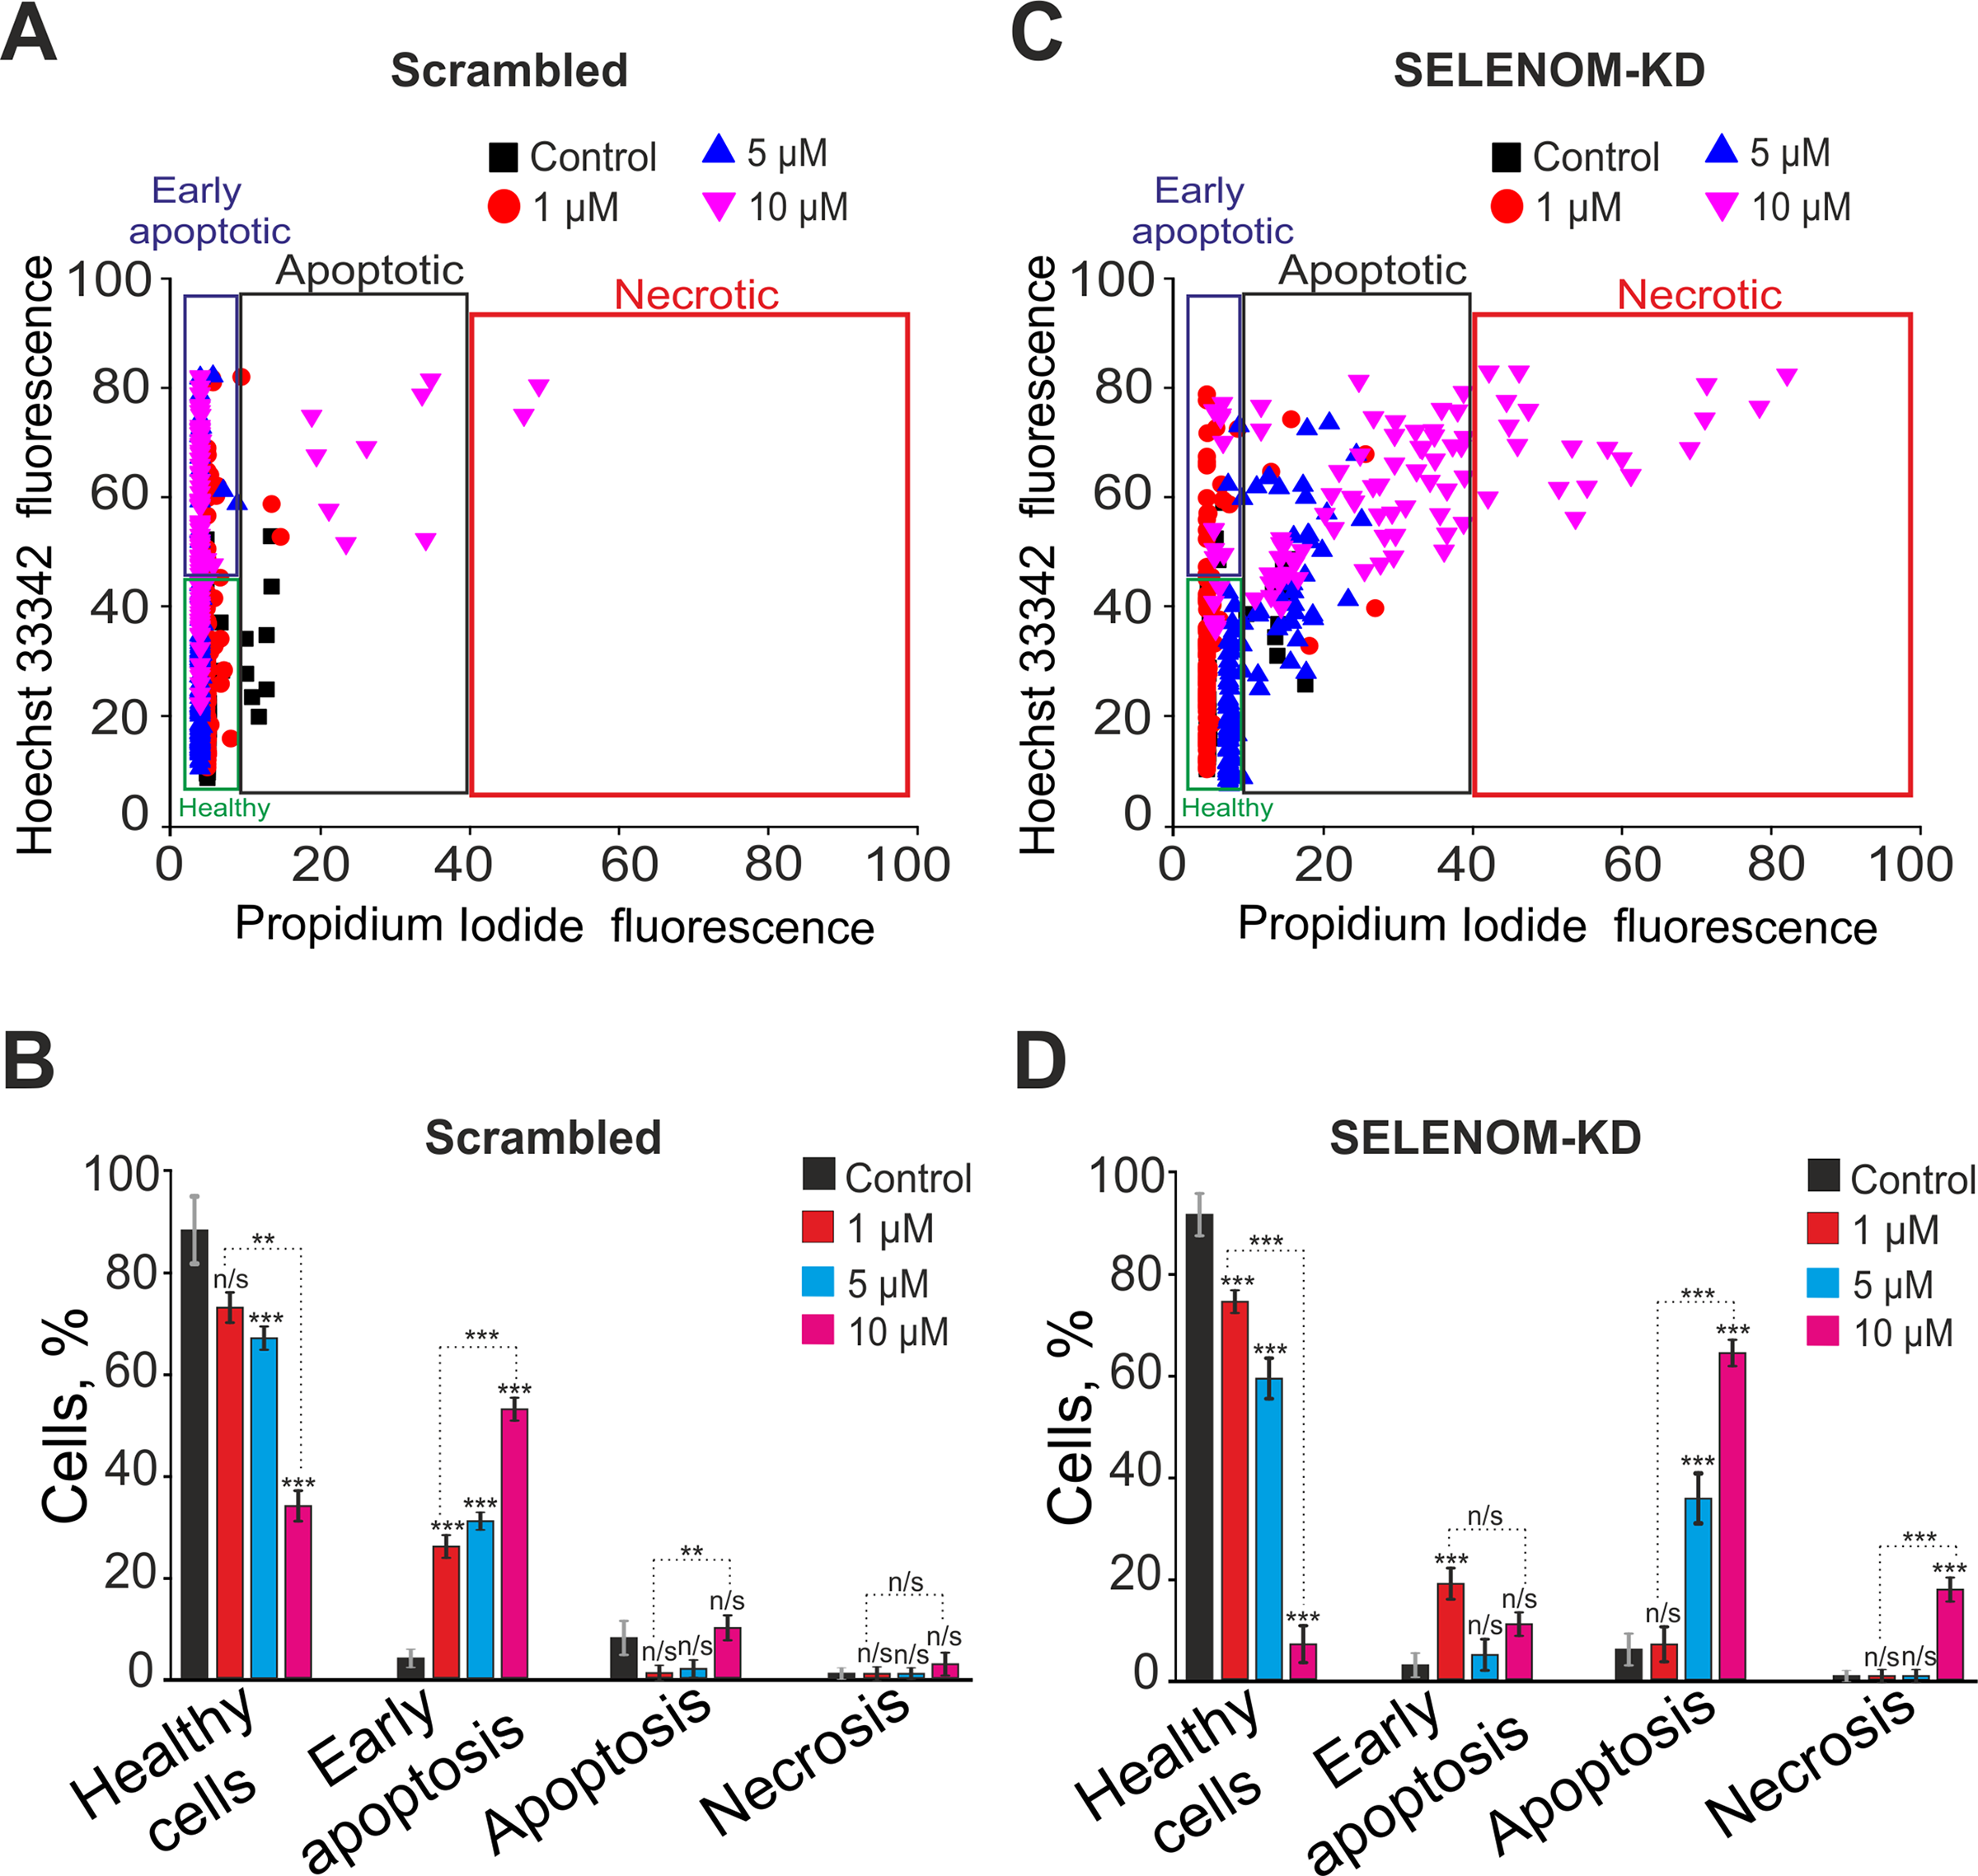
Figure 4: Effect of staurosporine on the viability and death pathways of human glioblastoma A-172 cells with and without SELENOM knockdown. (A,C) Viability cytograms of A-172 cells transfected with scramble shRNA (negative control) (A) and cells with SELENOM knockdown (SELENOM-KD) (C) after 24-h incubation with increasing concentrations of the broad-spectrum protein kinase inhibitor and pro-apoptotic agent staurosporine (STS). (B,D) Quantitative analysis of the effect of STS on cell viability and the induction of apoptotic and necrotic death in A-172 scramble shRNA (B) and A-172 SELENOM-KD (D) cells. The mode of cell death was assessed by double staining with the fluorescent probes Hoechst 33342 and propidium iodide. Data are presented as mean ± standard error of the mean (SE) from four independent experiments (n = 4). Statistical significance was determined using a two-way ANOVA was performed, followed by Sidak’s post-hoc test for multiple comparisons (n/s—not significant, p ≥ 0.05; **p < 0.01, ***p < 0.001)
In the experimental group of cells with SELENOM knockdown (SELENOM-KD) without STS exposure, early and late apoptosis were detected in 3% and 6% of cells, respectively (Fig. 4C,D). A 24-h pre-incubation of SELENOM-KD cells with 1 μM STS led to the induction of early and late apoptosis in 19% and 7% of cells. Increasing the STS concentration to 5 μM resulted in a rise of cells in the early and late stages of apoptosis to 5% and 36%, respectively. In contrast, pre-incubation with 10 μM STS induced early apoptosis in 11% of cells, late apoptosis in 64%, and necrosis was recorded in 18% of the SELENOM-KD cells (Fig. 4C,D). Representative images of the cell cultures are shown in Supplementary Fig. S2.
To assess the apoptotic response, untreated control cells (Control), A-172 cells transfected with scramble shRNA (Scrambled), and cells with SELENOM gene knockdown (SELENOM-KD) were treated with various concentrations of STS for 24 h. Total RNA was then isolated, and changes in the mRNA levels of key pro-apoptotic genes were analyzed by real-time PCR. Treatment of A-172 cells in the Scrambled group with 1 μM STS led to a 2- to 2.3-fold increase in the expression of PUMA (p53 upregulated modulator of apoptosis) and BAK (Bcl-2 antagonist/killer) and a decrease in Bcl-2 expression, which can be interpreted as a pro-apoptotic effect. In contrast, the reduced expression of Caspase-4 (Cas-4) and MAPK-8 (JNK1, c-Jun N-terminal kinase 1) may indicate an anti-apoptotic response (Fig. 5A). Increasing the STS concentration to 5 μM did not substantially alter the overall expression profile of the studied genes. A further increase in PUMA expression was observed, alongside a simultaneous decrease in the expression of BIM (Bcl-2 interacting mediator of cell death), Caspase-4, and MAPK-8 (JNK1) (Fig. 5A). Pre-incubation of Scrambled group cells with 10 μM STS resulted in more significant changes in gene expression. There was an increase in the expression of genes encoding pro-apoptotic proteins, such as Bax (Bcl-2-associated X protein), PUMA, CHOP (C/EBP homologous protein), and GADD34 (growth arrest and DNA damage-inducible protein 34), but a decrease in the expression of BIM and MAP3K5 (ASK1, apoptosis signal-regulating kinase 1), which may be assessed as an anti-apoptotic effect (Fig. 5A).
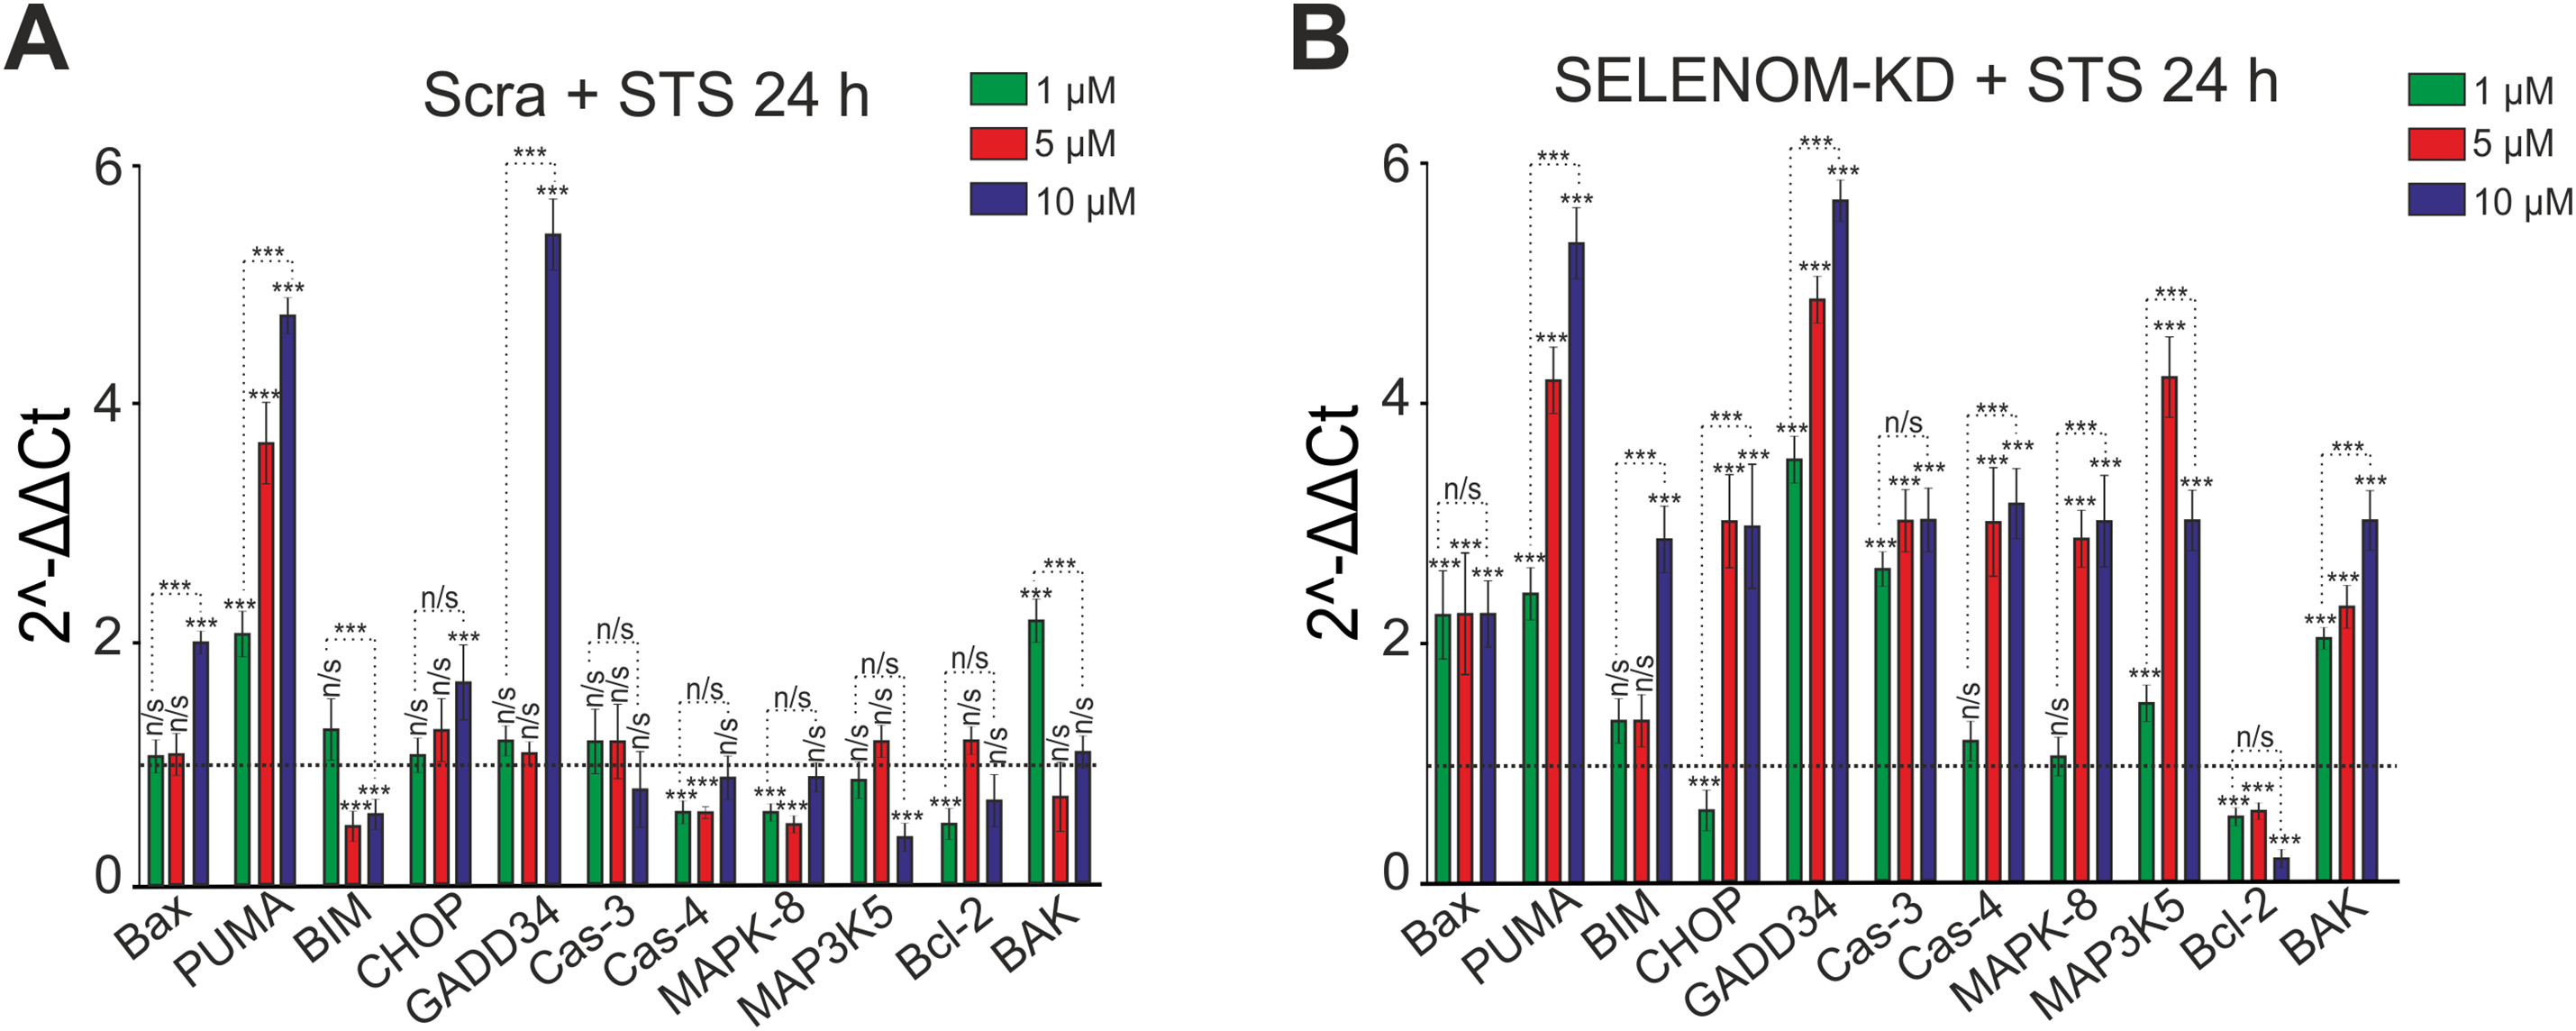
Figure 5: Expression of genes encoding cell death regulatory proteins in A-172 negative control (scramble shRNA) cells (A) and SELENOM knockdown (SELENOM-KD) cells (B) after 24-h incubation with increasing concentrations of staurosporine (STS). The expression level in untreated control cells (0 μM STS) of each line was set to 1 (dashed line). Experiments were performed in three biological replicates. Statistical significance was determined using a two-way ANOVA was performed, followed by Sidak’s post-hoc test for multiple comparisons: ***p < 0.001; n/s—not significant (p ≥ 0.05)
Pre-incubation of A-172 cells from the SELENOM-KD experimental group with 1 μM STS led to a 2- to 3.8-fold increase in the expression of genes encoding pro-apoptotic proteins—BAX, PUMA, GADD34, Caspase-3, MAP3K5 (ASK1), and BAK—while the level of Bcl-2 decreased (Fig. 5B). Pre-incubation with 5 μM STS enhanced the expression of the aforementioned genes and also induced an increase in the expression of CHOP and MAPK-8 (JNK1), alongside a reduction in Bcl-2 expression (Fig. 5B). When 10 μM STS was used in the SELENOM-KD group, an even more pronounced increase in the expression of all investigated pro-apoptotic genes was observed, ranging from 2.2 to 5.8-fold (Fig. 5B).
In the hyperthermia model, the results revealed a contrasting effect of SELENOM knockdown. Incubation of cells in a CO2 incubator at 42°C for 24 h, followed by staining with Hoechst-33342 and propidium iodide, revealed that approximately 99% of cells in the Scrambled group died. Among these, 1% were in early apoptosis, 51% in late apoptosis, and 47% were necrotic (Fig. 6A,B). Unexpectedly, a significant survival rate (52%) was observed in SELENOM-KD cells under hyperthermic conditions. In this group, 37% of cells were in early apoptosis, 7% in late apoptosis, and necrosis was detected in 10% of cells (Fig. 6A,B). Representative images of the cell cultures are shown in Supplementary Fig. S3. Analysis of the expression of genes encoding cell death regulatory proteins after 24 h of hyperthermia showed that in the Scrambled group, the expression of most investigated pro-apoptotic genes increased by 2 to 2.7-fold, while the expression of the anti-apoptotic gene Bcl-2 decreased simultaneously (Fig. 6C). Conversely, in the SELENOM-KD experimental group, the expression level of pro-apoptotic genes after 24 h of hyperthermia remained at the control level (cells cultured at 37°C), while the expression of the pro-apoptotic gene PUMA and the anti-apoptotic gene Bcl-2 was decreased (Fig. 6C).
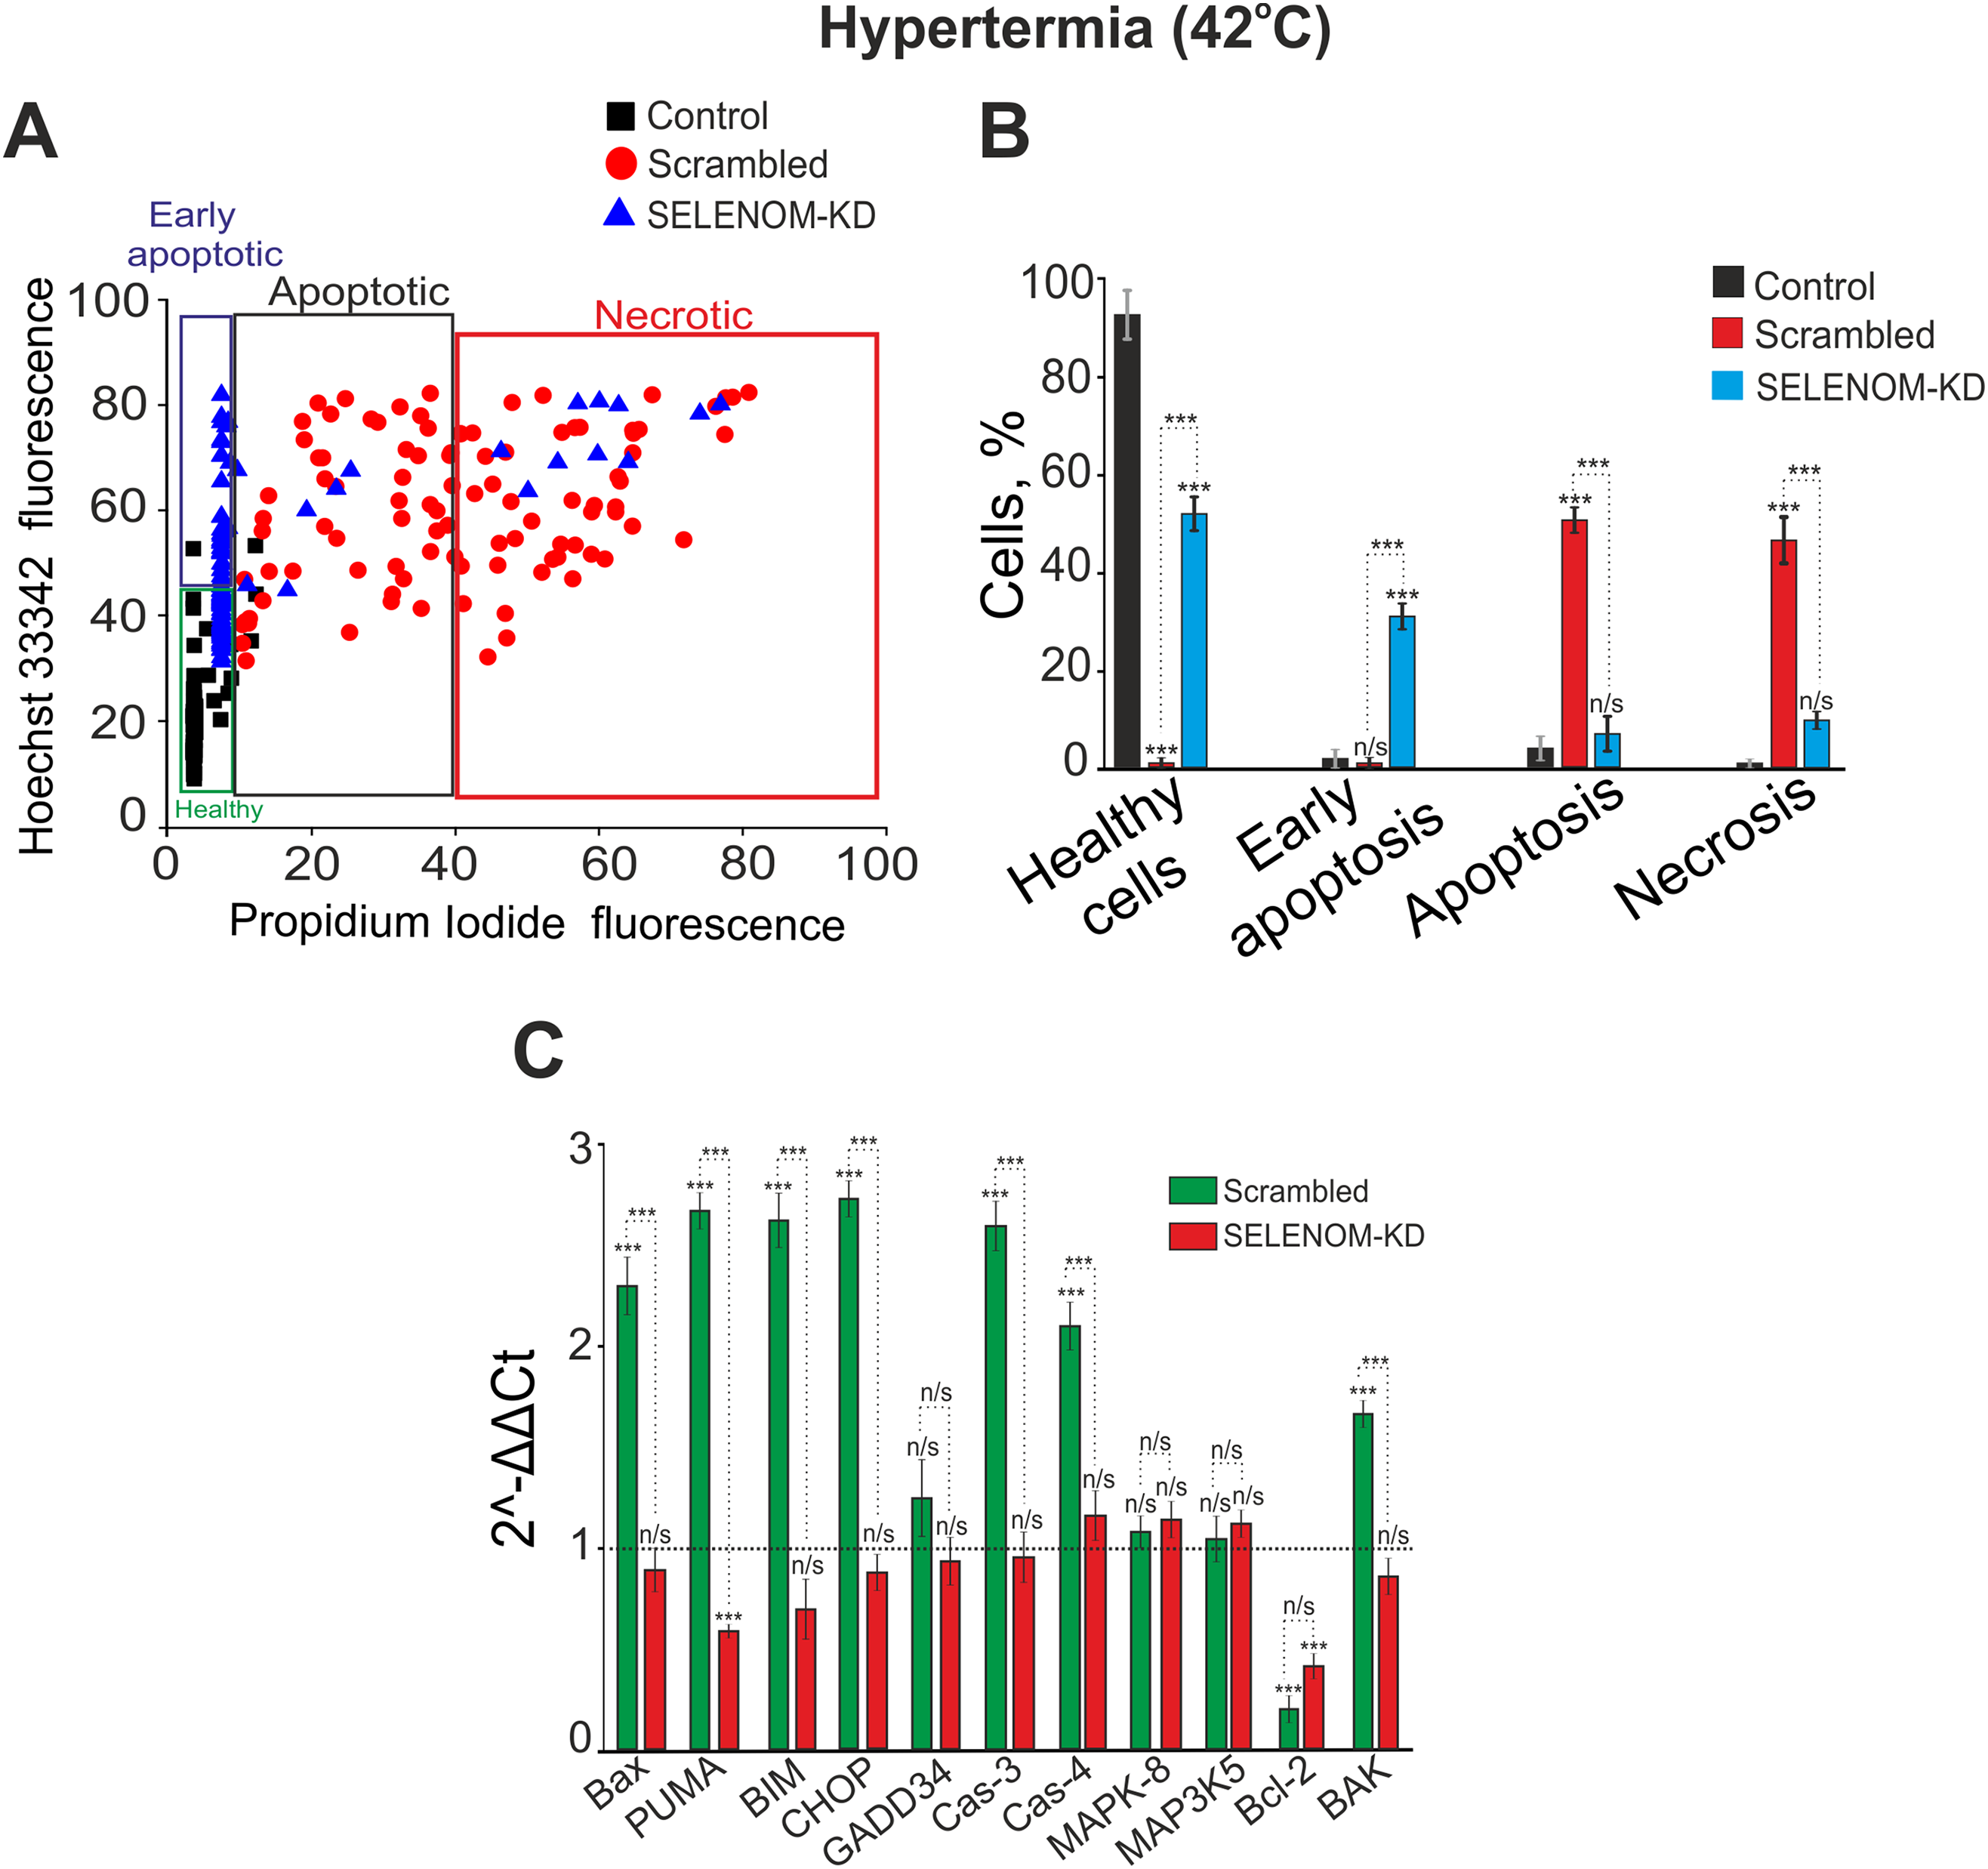
Figure 6: Effect of hyperthermia on the viability and death pathways of human glioblastoma A-172 cells with and without SELENOM knockdown. (A) Viability cytograms of control A-172 cells, cells transfected with scramble shRNA (negative control), and cells with SELENOM knockdown (SELENOM-KD) after 24-h incubation under hyperthermia conditions (42°C). (B) Quantitative analysis of the effect of hyperthermia (42°C) on cell viability and the induction of apoptotic and necrotic death in control A-172 cells, scramble shRNA, and A-172 SELENOM-KD cells. The mode of cell death was assessed by double staining with the fluorescent probes Hoechst 33342 and propidium iodide. Data are presented as mean ± standard error of the mean (SEM) from four independent experiments (n = 4).Statistical significance was determined relative to the control incubated at 37°C (n/s—not significant, p > 0.05; ***p < 0.001). (C) Expression of genes encoding cell death regulatory proteins in A-172 negative control (scramble shRNA) cells and SELENOM knockdown (SELENOM-KD) cells after 24-h hyperthermia exposure (42°C). The expression level in untreated control cells (37°C) was set to 1 (dashed line). Experiments were performed in three biological replicates. Statistical significance was determined using a one-way ANOVA, followed by Tukey’s honest significant difference (HSD) post-hoc test: n/s—not significant, p > 0.05; ***p < 0.001
Thus, the SELENOM protein acts as an important regulator of cell death in glioblastoma A-172 cells. Its presence renders the cells highly sensitive to hyperthermia, suggesting a potential role for SELENOM as a target for improving the efficacy of thermal therapy. At the same time, SELENOM knockdown alters the cell death pattern in response to STS from apoptotic to predominantly necrotic, underscoring its complex and likely context-dependent role in regulating cell death.
Our results reveal a previously unrecognized duality in SELENOM function, positioning it not merely as a guardian of redox homeostasis, but also as a critical determinant of cell fate under various stress conditions. The context-dependent effects of its knockout—sensitization to a chemical inducer and protection from hyperthermia—suggest that the role of SELENOM is integrated into specific signaling networks, and the outcome of their activation depends on the nature of the stimulus. A key consequence of SELENOM knockdown is a significant increase in the level of ROS and an impairment of the cells’ ability to adequately respond to the oxidative stress induced by selenium nanoparticles (SeNPs) [27,28]. This finding is consistent with the well-established role of selenoproteins as key components of the cellular antioxidant system [6,29]. Moreover, the impaired mitochondrial depolarization in response to the uncoupler FCCP in SELENOM-KD cells indicates profound mitochondrial dysfunction. Despite a normal basal membrane potential (ΔΨm), the mitochondria lose their “functional plasticity”—the ability to adequately respond to metabolic challenges. This can be explained by a model in which chronic oxidative stress, caused by the absence of SELENOM, leads to damage of electron transport chain components and increased proton leak, rendering the mitochondria “rigid” and incapable of normal depolarization [30]. Therefore, SELENOM functions not merely as an antioxidant but as a critical regulator of mitochondrial redox homeostasis.
4.1 The Controversial Role of SELENOM in Apoptosis Regulation: A Context-Dependent Effect
Our results reveal that SELENOM acts not merely as a context-dependent factor, but as a molecular switch of cell death. In response to staurosporine (STS), SELENOM knockdown increased cellular sensitivity to STS, manifested as enhanced activation of pro-apoptotic genes (BAX, PUMA, Caspase-3) and a shift towards late apoptosis and necrosis at high STS concentrations. This can be explained by the pre-existing pro-oxidant status of SELENOM-KD cells “priming” them for apoptosis by lowering the activation threshold of the mitochondrial pathway. This phenomenon of sensitization to chemotherapeutic agents against a background of induced oxidative stress is well-documented [31]. However, in response to hyperthermia, SELENOM knockdown paradoxically led to a pronounced resistance to heat shock. While control cells underwent massive cell death, approximately 52% of SELENOM-KD cells survived. This finding requires a specific explanation. It is known that the induction of heat shock proteins (HSPs) is a key mechanism of protection against hyperthermia [14]. The acquired thermoresistance in SELENOM-KD cells can be explained by several non-exclusive mechanisms driven by chronic oxidative stress. First, these cells may exhibit a pre-adaptive state, characterized by the constitutive activation of the Heat Shock Factor 1 (HSF1) pathway, leading to elevated basal levels of cytoprotective heat shock proteins such as HSP70 and HSP27. This pre-existing “shield” could render them less susceptible to subsequent proteotoxic stress from hyperthermia [14,32]. Second, beyond the HSF1/HSP axis, chronic redox imbalance might tonically activate other master regulators of cytoprotection. The transcription factor Nrf2 (Nuclear factor erythroid 2–related factor 2), a key sensor of oxidative stress, could be constitutively activated, bolstering the antioxidant response element (ARE)-driven gene network and providing an enhanced baseline defense against the oxidative burst induced by hyperthermia [33,34]. While this provides a plausible framework, this specific mechanism requires direct experimental validation in the future through analysis of HSF1 activation and HSP expression. Furthermore, the altered balance of pro-survival and pro-apoptotic signaling kinases is a plausible contributing factor. For instance, a baseline shift towards increased activity of the PI3K/Akt or ERK signaling pathways, known to be modulated by persistent ROS [35], could lower the threshold for survival under heat stress. Finally, the possibility that SELENOM loss directly impairs the activation of specific pro-apoptotic cascades uniquely triggered by hyperthermia warrants investigation. It is conceivable that the absence of SELENOM disrupts the hyperthermia-induced activation of stress kinases like JNK or p38 MAPK, or specific mitochondrial permeabilization events, thereby uncoupling the heat stress signal from the apoptotic machinery [36]. These speculative mechanisms provide a framework for future studies aimed at dissecting the intricate molecular interplay between selenoproteins, redox homeostasis, and stress signaling. Alternatively, the absence of SELENOM may disrupt the transmission of the specific pro-apoptotic signal triggered by heat shock, which requires further investigation. It is important to note that hyperthermia itself is a potent inducer of oxidative stress [19]. It is possible that SELENOM-KD cells, already in a state of “redox alertness”, are better equipped to handle the additional oxidative burden from hyperthermia than native cells, which experience a sharp and severe redox shock.
4.2 Potential Mechanisms and Therapeutic Implications
Our findings position SELENOM not merely as a guardian of redox homeostasis but as a critical molecular switch that determines the fate of glioblastoma cells depending on the type of stress. This newly discovered duality opens up both promising therapeutic opportunities and important caveats, requiring in-depth study of the underlying mechanisms for the development of rational treatment strategies. The observed sensitivity of SELENOM-KD cells to staurosporine (STS) underscores the key role of this protein in protecting against chemically induced apoptosis. The pre-existing state of chronic oxidative stress and mitochondrial dysfunction in SELENOM-deficient cells likely “primes” them for death by lowering the activation threshold for mitochondrial outer membrane permeabilization (MOMP) [37,38]. This is directly confirmed by our data showing enhanced activation of key pro-apoptotic genes such as BAX, PUMA, and Caspase-3 in response to STS. This suggests that pharmacological inhibition of SELENOM could be a powerful strategy to synergize with conventional chemotherapeutic agents. Many chemotherapeutic drugs, including temozolomide (the standard of care for GBM), exert part of their cytotoxic action through ROS generation and the intrinsic apoptosis pathway [39].
The discovered resistance of SELENOM-KD cells to hyperthermia, although requiring the elucidation of molecular mechanisms, leads us to propose a model in which the chronic redox imbalance caused by the loss of SELENOM creates a pre-adaptive cellular state that protects the cell from thermal stress through several non-exclusive pathways. Cells under constant oxidative stress may exhibit tonic activation of Heat Shock Factor 1 (HSF1), the master regulator of the HSR [14]. This could lead to constitutively elevated levels of cytoprotective heat shock proteins (HSPs) such as HSP70 and HSP27. When hyperthermia is applied, these cells are already “shielded” from proteotoxic stress, thereby blunting the apoptotic signal [19]. On the other hand, persistent elevation of ROS levels is a potent activator of the transcription factor Nrf2 [7]. In SELENOM-KD cells, Nrf2 may be constitutively nuclear, leading to the continuous expression of a battery of genes regulated by the antioxidant response element (ARE) (e.g., NAD(P)H quinone dehydrogenase 1 (NQO1), heme oxygenase-1 (HO-1)). This enhanced basal antioxidant capacity would provide superior protection against the oxidative burst inevitably induced by hyperthermia, effectively suppressing a key factor in heat-induced cell death [33]. Furthermore, as an endoplasmic reticulum (ER)-resident protein, SELENOM might be specifically involved in sensing or transducing ER stress signals triggered by heat shock. Its absence could uncouple hyperthermia from its downstream pro-apoptotic effectors, such as the specific activation of stress kinases (JNK, p38 MAPK) or the PERK-eIF2α-ATF4-CHOP arm of the unfolded protein response [40]. This would mean that the “death signal” generated by heat shock fails to be properly executed in the absence of SELENOM.
The context-dependent role of SELENOM demands a highly personalized approach to glioma therapy. Our data strongly suggest that SELENOM expression levels could serve as a crucial predictive biomarker. Tumors with high SELENOM expression are expected to respond well to hyperthermia-based therapies (e.g., magnetic hyperthermia, laser interstitial thermal therapy) [13]. In contrast, tumors with low SELENOM expression may be intrinsically resistant. Thus, pre-treatment assessment of SELENOM status in patient biopsies could guide clinical decision-making, preventing the application of an ineffective and invasive treatment modality to a non-responsive patient population. The opposing effects of SELENOM knockdown indicate that it should not be targeted in isolation. Instead, strategic combinations are key. For instance, SELENOM inhibition could be powerfully combined with chemotherapy or radiotherapy [41]. However, it should likely be avoided in regimens where hyperthermia is the primary or a key sensitizing component. Conversely, for tumors identified as SELENOM-negative and thus resistant to hyperthermia, one could explore co-targeting the adaptive survival pathways that confer resistance, for example, simultaneous inhibition of HSP90 or the PI3K/Akt pathway alongside thermal therapy [42].
Although this study provides novel insights into the context-dependent role of SELENOM in glioblastoma cell death, several limitations should be acknowledged. First, the investigation was conducted using a single human glioblastoma cell line (A-172). Given the well-established heterogeneity of GBM, the universal applicability of our conclusions requires validation in other GBM cell lines and, more importantly, in patient-derived primary cells or in vivo models. Second, the analysis of apoptotic pathways relied predominantly on transcriptional data (qRT-PCR) for key pro-apoptotic genes. Although informative, mRNA levels do not necessarily correlate with the expression and activation status (e.g., cleavage) of the corresponding proteins. Complementary Western blot analysis would strengthen the conclusions regarding the execution of apoptosis and necrosis. Third, the intriguing phenomenon of acquired thermoresistance in SELENOM-KD cells is explained by a plausible hypothesis involving pre-adaptation and the induction of heat shock proteins. However, this study lacks direct experimental evidence, such as measurements of HSF1 activation or HSP70/HSP90 protein levels, to substantiate the proposed mechanism. Finally, the assessment of mitochondrial dysfunction was primarily based on measurements of the membrane potential (ΔΨm). A more comprehensive functional profile, including an analysis of mitochondrial respiration and ATP production, would provide a deeper understanding of the metabolic consequences of SELENOM knockdown.
Future research should focus on elucidating the precise molecular mechanisms underlying the observed effects, particularly the relationship between SELENOM, oxidative stress, and heat shock signaling pathways. Addressing these limitations in future studies will be crucial for fully elucidating the role of SELENOM in GBM pathophysiology and its potential as a therapeutic target. Additionally, while standardized analysis protocols were used to ensure objectivity, the lack of formal blinding during data acquisition and analysis represents a potential source of bias. Future studies would benefit from implementing a blinded experimental design to further strengthen the findings. We also acknowledge that Western blot analysis of key apoptosis-related proteins (e.g., cleaved Caspase-3, Bcl-2, Bax) would have provided deeper mechanistic insights. The inability to include this protein-level data represents a limitation of the current study and is a recognized objective for our future research.
In conclusion, our study uncovers a paradoxical, context-dependent role of SELENOM in determining the fate of glioblastoma cells under stress. Contrary to the conventional view of selenoproteins as universal cytoprotectants, we demonstrate that SELENOM functions as a critical molecular switch that can either sensitize cells to chemical apoptosis inducers or confer robust resistance to thermal stress. The profound mitochondrial dysfunction and redox imbalance caused by SELENOM knockdown create a cellular state that is primed for chemical-induced death but conversely resilient to hyperthermia. These findings not only redefine SELENOM’s function in cancer cell biology but also carry significant therapeutic implications, suggesting that targeting SELENOM could be a strategic approach to enhance the efficacy of conventional chemotherapeutics. Conversely, our data caution that SELENOM status may serve as a crucial predictive biomarker for the outcome of hyperthermia-based treatments, underscoring the necessity for patient stratification in thermal therapy. Thus, SELENOM emerges as a key player at the crossroads of redox signaling and stress response, whose manipulation could open new avenues for combinatorial GBM therapy.
Acknowledgement: None.
Funding Statement: This study was conducted in the framework of the State assignment No. 075-00607-25-00.
Author Contributions: Study conception and design, fluorescent microscopy: Egor A. Turovsky. Elena G. Varlamova produced a genetic construct, performed PCR, analysis, and interpretation of results. All authors reviewed the results and approved the final version of the manuscript.
Availability of Data and Materials: The datasets generated during and/or analyzed during the current study are available from the corresponding author on reasonable request.
Ethics Approval: Not applicable.
Conflicts of Interest: The authors declare no conflicts of interest to report regarding the present study.
Supplementary Materials: Supplementary Fig. S1.: Western blot analysis of SELENOM content in A-172 samples. Supplementary Fig. S2. Viability of A-172 cells after 24-h pre-incubation with different concentrations of staurosporine. Supplementary Fig. S3. Viability of A-172 cells after 24-h hyperthermia (42°C). The supplementary material is available online at https://www.techscience.com/doi/10.32604/biocell.2025.073728/s1.
References
1. Stupp R, Hegi ME, Mason WP, van den Bent MJ, Taphoorn MJ, Janzer RC, et al. Effects of radiotherapy with concomitant and adjuvant temozolomide vs. radiotherapy alone on survival in glioblastoma in a randomised phase III study: 5-year analysis of the EORTC-NCIC trial. Lancet Oncol. 2009;10(5):459–66. doi:10.1016/S1470-2045(09)70025-7. [Google Scholar] [PubMed] [CrossRef]
2. Louis DN, Perry A, Wesseling P, Brat DJ, Cree IA, Figarella-Branger D, et al. The 2021 WHO classification of tumors of the central nervous system: a summary. Neuro Oncol. 2021;23(8):1231–51. doi:10.1093/neuonc/noab106. [Google Scholar] [PubMed] [CrossRef]
3. Pistritto G, Trisciuoglio D, Ceci C, Garufi A, D’Orazi G. Apoptosis as anticancer mechanism: function and dysfunction of its modulators and targeted therapeutic strategies. Aging. 2016;8(4):603–19. doi:10.18632/aging.100934. [Google Scholar] [PubMed] [CrossRef]
4. The Cancer Genome Atlas Research Network. Comprehensive genomic characterization defines human glioblastoma genes and core pathways. Nature. 2008;455(7216):1061–8. doi:10.1038/nature07385. [Google Scholar] [PubMed] [CrossRef]
5. Lathia JD, Mack SC, Mulkearns-Hubert EE, Valentim CLL, Rich JN. Cancer stem cells in glioblastoma. Genes Dev. 2015;29(12):1203–17. doi:10.1101/gad.261982.115. [Google Scholar] [PubMed] [CrossRef]
6. Labunskyy VM, Hatfield DL, Gladyshev VN. Selenoproteins: molecular pathways and physiological roles. Physiol Rev. 2014;94(3):739–77. doi:10.1152/physrev.00039.2013. [Google Scholar] [PubMed] [CrossRef]
7. Avery J, Hoffmann P. Selenium, selenoproteins, and immunity. Nutrients. 2018;10(9):1203. doi:10.3390/nu10091203. [Google Scholar] [PubMed] [CrossRef]
8. Mal’tseva VN, Goltyaev MV, Turovsky EA, Varlamova EG. Immunomodulatory and anti-inflammatory properties of selenium-containing agents: their role in the regulation of defense mechanisms against COVID-19. Int J Mol Sci. 2022;23(4):2360. doi:10.3390/ijms23042360. [Google Scholar] [PubMed] [CrossRef]
9. Reeves MA, Hoffmann PR. The human selenoproteome: recent insights into functions and regulation. Cell Mol Life Sci. 2009;66(15):2457–78. doi:10.1007/s00018-009-0032-4. [Google Scholar] [PubMed] [CrossRef]
10. Varlamova EG, Goltyaev MV, Turovsky EA. The role of selenoproteins SELENOM and SELENOT in the regulation of apoptosis, ER stress, and calcium homeostasis in the A-172 human glioblastoma cell line. Biology. 2022;11(6):811. doi:10.3390/biology11060811. [Google Scholar] [PubMed] [CrossRef]
11. Rogachev VV, Goltyaev MV, Varlamova EG, Turovsky EA. Molecular mechanisms of the cytotoxic effect of recombinant selenoprotein SELENOM on human glioblastoma cells. Int J Mol Sci. 2023;24(7):6469. doi:10.3390/ijms24076469. [Google Scholar] [PubMed] [CrossRef]
12. Turovsky EA, Plotnikov EY, Varlamova EG. Regulatory role and cytoprotective effects of exogenous recombinant SELENOM under ischemia-like conditions and glutamate excitotoxicity in cortical cells in vitro. Biomedicines. 2024;12(8):1756. doi:10.3390/biomedicines12081756. [Google Scholar] [PubMed] [CrossRef]
13. Hurwitz M, Stauffer P. Hyperthermia, radiation and chemotherapy: the role of heat in multidisciplinary cancer care. Semin Oncol. 2014;41(6):714–29. doi:10.1053/j.seminoncol.2014.09.014. [Google Scholar] [PubMed] [CrossRef]
14. Dai C, Sampson SB. HSF1: guardian of proteostasis in cancer. Trends Cell Biol. 2016;26(1):17–28. doi:10.1016/j.tcb.2015.10.011. [Google Scholar] [PubMed] [CrossRef]
15. Belmokhtar CA, Hillion J, Ségal-Bendirdjian E. Staurosporine induces apoptosis through both caspase-dependent and caspase-independent mechanisms. Oncogene. 2001;20(26):3354–62. doi:10.1038/sj.onc.1204436. [Google Scholar] [PubMed] [CrossRef]
16. Yang ES, Huh YJ, Park JW. RNA interference targeting sensitive-to-apoptosis gene potentiates doxorubicin- and staurosporine-induced apoptosis of PC3 cells. Anticancer Res. 2013;33(3):847–55. [Google Scholar] [PubMed]
17. Rasola A, Bernardi P. The mitochondrial permeability transition pore and its involvement in cell death and in disease pathogenesis. Apoptosis. 2007;12(5):815–33. doi:10.1007/s10495-007-0723-y. [Google Scholar] [PubMed] [CrossRef]
18. Iba T, Kondo Y, Maier CL, Helms J, Ferrer R, Levy JH. Impact of hyper- and hypothermia on cellular and whole-body physiology. J Intensive Care. 2025;13(1):4. doi:10.1186/s40560-024-00774-8. [Google Scholar] [PubMed] [CrossRef]
19. Mantso T, Vasileiadis S, Anestopoulos I, Voulgaridou GP, Lampri E, Botaitis S, et al. Hyperthermia induces therapeutic effectiveness and potentiates adjuvant therapy with non-targeted and targeted drugs in an in vitro model of human malignant melanoma. Sci Rep. 2018;8(1):10724. doi:10.1038/s41598-018-29018-0. [Google Scholar] [PubMed] [CrossRef]
20. Oei AL, Vriend LEM, Crezee J, Franken NAP, Krawczyk PM. Effects of hyperthermia on DNA repair pathways: one treatment to inhibit them all. Radiat Oncol. 2015;10(1):165. doi:10.1186/s13014-015-0462-0. [Google Scholar] [PubMed] [CrossRef]
21. Richter K, Haslbeck M, Buchner J. The heat shock response: life on the verge of death. Mol Cell. 2010;40(2):253–66. doi:10.1016/j.molcel.2010.10.006. [Google Scholar] [PubMed] [CrossRef]
22. Pitts MW, Hoffmann PR. Endoplasmic reticulum-resident selenoproteins as regulators of calcium signaling and homeostasis. Cell Calcium. 2018;70:76–86. doi:10.1016/j.ceca.2017.05.001. [Google Scholar] [PubMed] [CrossRef]
23. Zoidis E, Seremelis I, Kontopoulos N, Danezis GP. Selenium-dependent antioxidant enzymes: actions and properties of selenoproteins. Antioxidants. 2018;7(5):66. doi:10.3390/antiox7050066. [Google Scholar] [PubMed] [CrossRef]
24. Johnson LV, Walsh ML, Bockus BJ, Chen LB. Monitoring of relative mitochondrial membrane potential in living cells by fluorescence microscopy. J Cell Biol. 1981;88(3):526–35. doi:10.1083/jcb.88.3.526. [Google Scholar] [PubMed] [CrossRef]
25. Kahlert S, Zündorf G, Reiser G. Detection of de- and hyperpolarization of mitochondria of cultured astrocytes and neurons by the cationic fluorescent dye rhodamine 123. J Neurosci Methods. 2008;171(1):87–92. doi:10.1016/j.jneumeth.2008.02.015. [Google Scholar] [PubMed] [CrossRef]
26. Mal’tseva VN, Gudkov SV, Turovsky EA. Modulation of the functional state of mouse neutrophils by selenium nanoparticles in vivo. Int J Mol Sci. 2022;23(21):13651. doi:10.3390/ijms232113651. [Google Scholar] [PubMed] [CrossRef]
27. Varlamova EG, Gudkov SV, Turovsky EA. Opposite effects of small and large diameter selenium nanoparticles on the redox-status and survival of cortical cells in toxic models in vitro. Biol Trace Elem Res. 2025;203(11):1–22. doi:10.1007/s12011-025-04682-2. [Google Scholar] [PubMed] [CrossRef]
28. Varlamova EG, Khabatova VV, Gudkov SV, Plotnikov EY, Turovsky EA. Cytoprotective properties of a new nano complex of selenium with taxifolin in the cells of the cerebral cortex exposed to ischemia/reoxygenation. Pharmaceutics. 2022;14(11):2477. doi:10.3390/pharmaceutics14112477. [Google Scholar] [PubMed] [CrossRef]
29. Varlamova EG, Rogachev VV, Novoselov SV, Turovsky EA. SELENOM-knockdown enhances the protective effect of A-172 cancer cells against MSA-induced ER-stress and staurosporine-induced apoptosis. Opera Medica Et Physiol. 2021;8(4):23–32. doi:10.24412/2500-2295-2021-4-23-32. [Google Scholar] [CrossRef]
30. Zorov DB, Juhaszova M, Sollott SJ. Mitochondrial reactive oxygen species (ROS) and ROS-induced ROS release. Physiol Rev. 2014;94(3):909–50. doi:10.1152/physrev.00026.2013. [Google Scholar] [PubMed] [CrossRef]
31. Trachootham D, Alexandre J, Huang P. Targeting cancer cells by ROS-mediated mechanisms: a radical therapeutic approach? Nat Rev Drug Discov. 2009;8(7):579–91. doi:10.1038/nrd2803. [Google Scholar] [PubMed] [CrossRef]
32. Akerfelt M, Morimoto RI, Sistonen L. Heat shock factors: integrators of cell stress, development and lifespan. Nat Rev Mol Cell Biol. 2010;11(8):545–55. doi:10.1038/nrm2938. [Google Scholar] [PubMed] [CrossRef]
33. Tonelli C, Chio IIC, Tuveson DA. Transcriptional regulation by Nrf2. Antioxid Redox Signal. 2018;29(17):1727–45. doi:10.1089/ars.2017.7342. [Google Scholar] [PubMed] [CrossRef]
34. de la Vega M Rojo, Chapman E, Zhang DD. NRF2 and the hallmarks of cancer. Cancer Cell. 2018;34(1):21–43. doi:10.1016/j.ccell.2018.03.022. [Google Scholar] [PubMed] [CrossRef]
35. Sullivan LB, Chandel NS. Mitochondrial reactive oxygen species and cancer. Cancer Metab. 2014;2(1):17. doi:10.1186/2049-3002-2-17. [Google Scholar] [PubMed] [CrossRef]
36. Jolly C, Morimoto RI. Role of the heat shock response and molecular chaperones in oncogenesis and cell death. J Natl Cancer Inst. 2000;92(19):1564–72. doi:10.1093/jnci/92.19.1564. [Google Scholar] [PubMed] [CrossRef]
37. Gorini S, De Angelis A, Berrino L, Malara N, Rosano G, Ferraro E. Chemotherapeutic drugs and mitochondrial dysfunction: focus on doxorubicin, trastuzumab, and sunitinib. Oxidative Med Cell Longev. 2018;2018(1):7582730. doi:10.1155/2018/7582730. [Google Scholar] [PubMed] [CrossRef]
38. Redza-Dutordoir M, Averill-Bates DA. Activation of apoptosis signalling pathways by reactive oxygen species. Biochim Biophys Acta Mol Cell Res. 2016;1863(12):2977–92. doi:10.1016/j.bbamcr.2016.09.012. [Google Scholar] [PubMed] [CrossRef]
39. Oliva CR, Nozell SE, Diers A, McClugage SGIII, Sarkaria JN, Markert JM, et al. Acquisition of temozolomide chemoresistance in gliomas leads to remodeling of mitochondrial electron transport chain. J Biol Chem. 2010;285(51):39759–67. doi:10.1074/jbc.M110.147504. [Google Scholar] [PubMed] [CrossRef]
40. Grootjans J, Kaser A, Kaufman RJ, Blumberg RS. The unfolded protein response in immunity and inflammation. Nat Rev Immunol. 2016;16(8):469–84. doi:10.1038/nri.2016.62. [Google Scholar] [PubMed] [CrossRef]
41. Alexander BM, Cloughesy TF. Adult glioblastoma. J Clin Oncol. 2017;35(21):2402–9. doi:10.1200/jco.2017.73.0119. [Google Scholar] [PubMed] [CrossRef]
42. Neckers L, Workman P. Hsp90 molecular chaperone inhibitors: are we there yet? Clin Cancer Res. 2012;18(1):64–76. doi:10.1158/1078-0432.ccr-11-1000. [Google Scholar] [PubMed] [CrossRef]
Cite This Article
 Copyright © 2026 The Author(s). Published by Tech Science Press.
This work is licensed under a Creative Commons Attribution 4.0 International License , which permits unrestricted use, distribution, and reproduction in any medium, provided the original work is properly cited.
 Downloads
 Citation Tools