
 Submit a Paper
 Propose a Special lssue
 Open Access
ARTICLE

Integrated WGCNA and Experimental Validation Reveals LINC00595 as Necroptosis-Regulating lncRNAs in Prostate Cancer
1 Department of Urology, Zibo Central Hospital, Zibo, China
2 Department of Clinical Laboratory, Zibo Central Hospital, Zibo, China
* Corresponding Author: Ruozeng Rong. Email:
BIOCELL 2026, 50(3), 10 https://doi.org/10.32604/biocell.2026.072154
Received 20 August 2025; Accepted 07 January 2026; Issue published 23 March 2026
 View Full Text
 Download PDF
Abstract
Objectives: Prostate cancer (PCa) is a highly prevalent male malignancy with limited efficacy in advanced stages. Dysregulated modulation of necroptosis was reported to be tightly correlated with PCa initiation and progression. Herein, we aimed to identify necroptosis-associated long non-coding RNAs (lncRNAs) and delineate their functional roles in PCa through an integrated approach combining bioinformatic analyses and in vitro experimental validation. Methods: RNA sequencing data and corresponding clinical information of PCa were downloaded from The Cancer Genome Atlas (TCGA). Differentially expressed necroptosis-related genes (NRGs) and lncRNAs were screened, and necroptosis activity was assessed by single-sample gene set enrichment analysis (ssGSEA). Weighted Gene Co-expression Network Analysis (WGCNA) identified necroptosis-related lncRNA modules, with key lncRNAs prioritized via Cox regression. Clinical correlation analyses and in vitro experiments validated the function of the key lncRNA LINC00595. Results: A total of 50 differentially expressed NRGs were identified, among which pro-necroptotic genes exhibited pronounced downregulation, while anti-necroptotic genes were significantly upregulated. Consistently, ssGSEA confirmed reduced necroptosis activity in PCa. WGCNA further identified 13 core necroptosis-related lncRNAs (NRlncRNAs), with Cox regression analysis pinpointing LINC00595 and LINC00908 as the top prognostic candidates. Both lncRNAs were downregulated in PCa, with low expression correlating with advanced T stage, lymph node metastasis, and poor prognosis. Functional experiments demonstrated that LINC00595 overexpression inhibited PCa cell proliferation, migration, and invasion, and enhanced necroptosis. Conclusions: Collectively, our findings identified LINC00595 and LINC00908 as novel regulators of necroptosis in PCa. Specifically, LINC00595 exerted tumor-suppressive effects by enhancing necroptosis, holding potential as prognostic biomarkers and therapeutic targets.Keywords
Supplementary Material
Supplementary Material FileProstate cancer (PCa) persists as the most commonly diagnosed malignancy and the second prominent cause of cancer-associated mortality in men across the globe [1,2]. While localized PCa is often curable with surgery or radiation, advanced or castration-resistant prostate cancer (CRPC)-characterized by resistance to androgen deprivation therapy-remains incurable [3]. This underscores a pressing necessity to decipher novel molecular mechanisms that drive PCa progression and therapeutic resistance [4,5].
Programmed cell death (PCD) pathways, including apoptosis, necroptosis, and pyroptosis, have emerged as critical regulators of tumor initiation, progression, and response to therapy [6,7]. Among these, necroptosis-a regulated form of necrosis mediated by receptor-interacting protein kinase 1 (RIPK1), RIPK3, and mixed lineage kinase domain-like pseudokinase (MLKL)-has gained substantial attention due to its dual role in cancers [8,9]. Necroptosis can either suppress tumor growth by eliminating malignant cells or promote tumorigenesis through the secretion of pro-inflammatory damage-associated molecular patterns (DAMPs) that fuel immune evasion and microenvironmental remodeling [9,10]. Recent investigations have implicated the roles of necroptosis in PCa pathogenesis [11,12]. As an illustration, upregulated RIPK3 expression correlated with poor prognosis in CRPC, while MLKL deficiency enhanced PCa cell survival under stress [13,14]. However, the precise molecular network governing necroptosis in PCa, particularly the role of non-coding RNAs, is still inadequately elucidated.
Long non-coding RNAs (lncRNAs), characterized as transcripts exceeding 200 nucleotides with minimal protein-coding capacity, have risen as pivotal post-transcriptional and epigenetic regulators of cancer biology [15,16]. LncRNAs modulate gene expression through diverse mechanisms, including acting as molecular scaffolds for signaling complexes, sponging microRNAs, or directly interacting with DNA/RNA/proteins to alter chromatin structure or mRNA stability [17]. Notably, emerging evidence has suggested lncRNAs may serve as critical modulators of necroptosis [18,19]. For example, lncRNA TRAF3IP2-AS1 could promote necroptosis by reducing MLKL mRNA stability in pancreatic carcinoma [20], and lncRNA ENSG00000253385.1 sequesters miR-16-2-3p, thereby relieving the repression of p-RIPK3 expression and depressing necroptosis in esophageal squamous cell carcinoma [21]. Despite these advances, the landscape of lncRNAs involved in PCa necroptosis and their functional interconnections remains largely unexplored.
Traditional differential expression analysis can identify genes altered in disease states but often fails to capture the coordinated regulatory patterns underlying complex biological processes like necroptosis [22]. Weighted Gene Co-expression Network Analysis (WGCNA) enables the discovery of functionally related gene clusters and their hub regulators by building scale-free co-expression networks to pinpoint modules of genes with high topological overlap [23,24]. This method has proven powerful in identifying key drivers of diseases, including lncRNAs, by integrating expression data with phenotypic traits [25].
In this study, we employed WGCNA to pinpoint specific lncRNAs linked to necroptosis in PCa and clarify the functional roles of candidate lncRNAs in regulating necroptosis via in vitro assays. The present study seeks to bridge the gap between necroptosis, lncRNAs, and PCa progression, with the goal of deepening insights into necroptosis-mediated PCa oncogenesis and laying a foundation for the development of lncRNA-derived diagnostic biomarkers or therapeutic strategies for PCa.
2.1 Differential Expression Analysis of RNA-Seq Data
RNA sequencing data of prostate cancer and corresponding clinical information were downloaded from The Cancer Genome Atlas (TCGA)-Prostate adenocarcinoma (PRAD, https://xenabrowser.net/datapages/) project. The DESeq2 package (version 1.40.2) was used to perform differential expression analysis. First, grouping information for “Normal” and “Tumor” samples was constructed. Variance-stabilizing transformation normalization was applied using the vst method, and principal component analysis was visualized via the plotPCA function to evaluate sample clustering. Differential analysis was implemented with the DESeq2 function for dispersion estimation and the Wald test. The dplyr package (v1.1.3) was used to filter gene annotation data (gencode.v36.annotation.gtf) and expression data, enabling separate extraction of expression profiles for long non-coding RNAs (lncRNAs) and coding RNAs (mRNAs). Significantly differentially expressed genes were screened based on differential analysis results. Volcano plots were generated using ggplot2 and ggrepel (v0.9.3), with the X-axis representing log2 fold change (FC) in gene expression and the Y-axis representing -log10 p-value. In the volcano plot, differentially expressed (DE) genes were defined as those with an absolute log2 fold change (log2FC) > 1.5 (lncRNA) or 0.3 (mRNA) and p-value < 0.05. A stricter log2FC threshold was used for lncRNAs to address their low inherent expression and reduce false positives from weak signals. A milder threshold was applied to mRNAs to fit their higher, more consistent expression and capture subtle but functionally significant variations. We chose the raw p-value instead of the commonly used adjusted p-value (FDR, Padj) primarily because the sample size of our dataset was relatively small. Using raw p-value helps balance the reduction of false negatives and the maintenance of biological relevance of the identified DE signals, especially for lncRNAs with inherently low expression that are prone to being filtered out by strict FDR correction. Different significance categories were distinguished by color and point size to visualize the distribution of differentially expressed genes.
2.2 Screening of DE Necroptosis-Related Genes (NRGs)
A list of 116 NRGs, summarized in previous studies [26,27], was retrieved. The ggvenn package (v0.1.3) was used to generate a Venn diagram that depicted the intersection of necroptosis-related genes and differentially expressed mRNAs. The pheatmap package (v1.0.12) was used to generate a heatmap of these NRGs to visualize their expression patterns.
2.3 Single-Sample Gene Set Enrichment Analysis (ssGSEA) of NRGs
GSVA (version 1.42.0) was employed to compute the enrichment score of the necroptosis-related gene set for each sample. A boxplot was generated using ggplot2 to compare enrichment score differences between the normal group (n = 52) and the tumor group (n = 499). To ascertain the statistical significance of the discrepancies, an unpaired two-tailed Student’s t-test was employed.
2.4 Weighted Gene Co-Expression Network Analysis (WGCNA)
The WGCNA package (version 1.72-1) was used to construct the lncRNA co-expression network. Tumor samples were filtered using the dplyr package (version 1.1.2), and sample clustering and quality control were performed using the hclust function (stats package). Five outlier samples were excluded, leaving 494 PRAD samples for subsequent analysis. During network construction, the pickSoftThreshold function was used to automatically select the soft threshold, and the blockwiseModules function was applied to partition gene modules. Module-trait association analysis was conducted by extracting eigengenes via moduleEigengenes, calculating Pearson correlation with necroptosis scores, and visualizing results with labeledHeatmap. The labeledHeatmap displays the Pearson correlation coefficients between each module’s eigengene (represented by rows) and the necroptosis score (represented by columns), with color intensity indicating the strength of the correlation and accompanying p-values marked to show statistical significance.
2.5 Intersection Analysis to Obtain Necroptosis-Related lncRNAs (NRlncRNAs)
The ggvenn package (version 0.1.10) was used to generate a Venn diagram of DE lncRNAs (|log2 FC| > 1.5 and p-value < 0.05) and lncRNAs in the above modules, identifying NRlncRNAs.
2.6 Gene Ontology (GO) Enrichment Analysis
GO enrichment analysis was performed using the clusterProfiler package (version 4.10.0) in R, combined with the human gene annotation database org.Hs.eg.db (version 3.18.0) for gene ID conversion. The bitr function was used to convert symbols (SYMBOL) of differentially expressed lncRNAs to ENTREZID, and the enrichGO function was applied for full ontology (biological processes (BP)/molecular function (MF)/cellular components (CC)) enrichment analysis with default significance thresholds (p < 0.05, FDR < 0.2). The dplyr package (version 1.1.2) was used to calculate the enrichment factor (richFactor = number of genes in a specific term/number of background genes), and ggplot2 (version 3.4.2), combined with purrr (version 1.0.1), was used for faceted visualization of results.
2.7 Cox Regression Analysis of lncRNAs
First, the candidate lncRNAs were screened via univariate Cox regression, and a forest plot was generated using ggplot2 (3.4.2) to display hazard ratios (HR) and their confidence intervals. A multivariate Cox model was constructed based on these significant lncRNAs. The risk score was computed as Σ (gene expression × regression coefficient). The optimal cutoff value with maximum discrimination was determined to stratify patients into high- and low-risk cohorts. Then, the timeROC package, for time-dependent receiver operating characteristic (ROC) curve analysis, was utilized to generate 1/2/3-year time-dependent ROC curves. Finally, survminer was employed to produce Kaplan-Meier (KM) survival curves, and gridExtra was used to integrate risk score trend plots and survival status scatter plots to demonstrate the clinical predictive performance of the prognostic model.
2.8 Clinical Correlation and Validation
Univariate Cox regression analysis was performed on clinical indicators (age, T stage, N stage) and molecular markers using the survival package (v3.5-7). The forestmodel package (v0.6.2) was used to generate a univariate forest plot, showing the prognostic effect of each variable with HR and 95% confidence intervals. A multivariate Cox analysis model was constructed using the survminer package (v0.4.9), which incorporated the risk score with clinical indicators. And the ggforest function was used to visualize independent prognostic factors.
The standardized expression matrix was filtered using dplyr (v1.1.2) to retain 50 necroptosis-related genes, two key NRlncRNAs, and cancer samples. The cor.test function (stats v4.3.1) was used to analyze the correlation of all NRlncRNA-NRG pairs, and a double loop was used to generate the correlation matrix. NRGs with |r| > 0.3 and p < 0.05 were selected as NRGs related to key NRlncRNAs, and a network diagram was generated using Cytoscape (version 3.10.1, Cytoscape Consortium, San Diego, CA, USA).
2.10 Validation of Key lncRNAs
Differential expression of the two key lncRNAs in normal and prostate adenocarcinoma (PRAD) tissues was retrieved from the GEPIA website (http://gepia.cancer-pku.cn/). Survival analysis for different survival types was based on TCGA-PRAD (https://xenabrowser.net/datapages/) data. The surv_cutpoint function was used to stratify lncRNAs into high and low expression groups using 30% and 50% quantiles as cutoffs. Kaplan-Meier curves were generated for four survival endpoints (overall survival (OS)/disease-specific survival (DSS)/disease-free interval (DFI)/progression-free interval (PFI)) with log-rank p values calculated. The ggplot2 (v3.4.2) and ggpubr (v0.6.0) packages were used to generate boxplots showing differential expression of the two genes across different T/N/M stages, ages, and between primary PCa and CRPC (GSE35988). We acquired the dataset GSE35988 from the Gene Expression Omnibus (GEO) database.
Human PCa cell lines LNCaP (CRL-1740), PC-3 (CRL-1435), and DU145 (HTB-81) were purchased from the American Type Culture Collection (ATCC, Manassas, VA, USA). All cell lines used throughout the experiment were confirmed to be mycoplasma-free. Cells were cultured in RPMI-1640 medium (PM150110, Procell, Wuhan, China) supplemented with 10% fetal bovine serum (FBS,10099141, Gibco, Shanghai, China) and 1% penicillin-streptomycin (MA0110, MeilunBio, Dalian, China) at 37°C in a humidified atmosphere containing 5% CO2.
2.12 RNA Extraction and Quantitative Real-Time Polymerase Chain Reaction (qRT-PCR)
Total RNA was extracted from clinical samples and cultured cells using TRIzol reagent (CW0581M, Cwbio, Taizhou, China) following the manufacturer’s protocol. cDNAs were synthesized from 500 ng of total RNA using the 5× Evo M-MLV RT Master Mix (AG11706, Accurate Biology, Changsha, China).
qRT-PCR was performed using SYBR Green Premix Pro Taq HS qPCR kit (AG11701, Accurate Biology, Changsha, China) on a CFX Connect™ Real-Time PCR System (Bio-Rad, Shanghai, China). The reaction system (20 μl) included 10 μl of TB Green Premix, 0.4 μl of each forward and reverse primer (10 μm), 2 μl of cDNA template, and 7.2 μl of nuclease-free water. The cycling conditions were: 95°C for 30 s × 2, followed by 40 cycles of 95°C for 5 s and 60°C for 30 s × 3. Relative gene expression was calculated using the 2−ΔΔCt method. Primer sequences were as follows: LINC00908 (forward: 5′-GAGTGATGGGGAGCACTGAC-3′; reverse: 5′-GAGAAGGCGTCCGTGGATAG-3′) and LINC00595 (forward: 5′-GTGATCTGTCTGCCCCTCAC-3′; reverse: 5′-CTCCCTGACTGAAGGCCAAG-3′). And GAPDH, a well-characterized housekeeping gene, was used as an internal control (forward: 5′-AGAAGGCTGGGGCTCATTTG-3′; reverse: 5′-AGGGGCCATCCACAGTCTTC-3′).
Cells were seeded in 6-well plates at a density of 5 × 10⁵ cells/well and cultured in complete RPMI 1640 medium (PM150110, Procell). For transfection, the culture medium was replaced with Opti-Medium (YC-3039A, Yuchun Biology, Shanghai, China). And cells weretransfected with LINC00595 overexpression constructs or empty vector (Genechem, Shanghai, China) using Lipofectamine 2000 reagent (11668-019, Invitrogen, Carlsbad, CA, USA) following the manufacturer’s instructions. Transfection efficiency of LINC00595 was verified by qRT-PCR at 48 h post-transfection. The primer sequences used for qRT-PCR validation were synthesized by Dingguo Prosperous (Beijing, China), with sequences as follows: LINC00595 forward:5′-GTGATCTGTCTGCCCCTCAC-3′; reverse: 5′-CTCCCTGACTGAAGGCCAAG-3′. And GAPDH was used as an internal control (forward: 5′-AGAAGGCTGGGGCTCATTTG-3′; reverse: 5′-AGGGGCCATCCACAGTCTTC-3′).
2.14 Transwell Assay for Cell Invasion and Migration
Transwell chambers (353097, Corning, NY, USA) were utilized to evaluate cell migration and invasion. In the invasion experiment, Matrigel (354234, BD Biocoat, Corning) was first used to pre-coat the upper chamber, which was then incubated at 37°C for a 30-min period. In contrast, no Matrigel was used in migration assays.
Transfected cells were adjusted to a density of 5 × 10⁴ cells per well, resuspended in serum-free RPMI-1640 medium, and then plated into the upper compartment of the Transwell chamber. Meanwhile, the lower compartment was loaded with RPMI-1640 medium supplemented with 20% FBS as a chemoattractant. Following incubation at 37°C for 24 h (for the migration assay) or 48 h (for the invasion assay), cells that had not migrated or invaded, remaining on the upper surface of the chamber membrane, were carefully removed using a sterile cotton swab. The cells that had successfully migrated or invaded the lower surface were fixed with 4% paraformaldehyde (G1101, Servicebio, Wuhan, China) and subsequently stained with 0.1% crystal violet (G1063, Solarbio, Beijing, China). Images were captured under a fluorescence inverted microscope (CKX53, Olympus, Tokyo, Japan). All experiments were independently repeated three times.
2.15 Western Blot (WB) Analysis
Protein lysates were prepared using a RIPA buffer (CW233S, Cwbio, Taizhou, China) containing phenylmethanesulfonylfluoride (PMSF, AR1192, Boster, Wuhan, China). Protein concentration was determined using the BCA assay (P0012, Beyotime, Shanghai, China). Samples (30 μg/lane) were separated by SDS-PAGE and transferred to PVDF membranes (IPVH00010, Millipore, MA, USA). Membranes were blocked with blocking buffer (P0023B, Beyotime) for 1 h at room temperature and incubated overnight at 4°C with primary antibodies against: RIP3 (1:1000, Ab305054, Abcam, Shanghai, China), p-RIP3 (Ab255705, Abcam, 1:1000), MLKL (Ab184718, Abcam, 1:2000), p-MLKL (Ab196436, Abcam, 1:1000) and GAPDH (1:50000, 60004-1-Ig, Proteintech, Wuhan, China). Secondary antibodies (HRP-conjugated goat anti-rabbit/mouse IgG, 1:10,000, ZSGB-Bio, Beijing, China) were incubated for 1 h at room temperature. Protein bands were detected using ECL substrate (MA0186-1, MeilunBio) and quantified using ImageJ software (version 1.4.3.67, National Institutes of Health, Bethesda, USA).
Data are reported as the mean ± standard deviation (SD) derived from three separate experiments. Statistical comparisons were executed using Student’s t-test or one-way analysis of variance (ANOVA) with Tukey’s post hoc test. A p-value < 0.05 was deemed statistically significant. All analyses were performed using GraphPad Prism 8.0.3 (GraphPad Software, Inc., San Diego, CA, USA).
3.1 Transcriptional Profiling of Necroptosis-Related DE-mRNAs
The flow diagram of this study was presented in Supplementary Fig. 1. To investigate the molecular landscape of PCa and its association with necroptosis, we first performed integrative bioinformatics analyses using RNA sequencing data from TCGA. Principal component analysis (PCA) of global transcriptomic profiles (Fig. 1A) revealed that the first principal component (PC1, explaining 13% of total variance) effectively separated normal (n = 52) and tumor (n = 499) prostate tissues, indicating significant transcriptomic reprogramming in PCa. As exhibited in Fig. 1B,C, volcano plots visualized the differentially expressed mRNAs (DE-mRNAs) and long non-coding RNAs (DE-lncRNAs). By intersecting differentially expressed mRNAs (DE-mRNAs) with a predefined necroptosis gene set, 50 necroptosis-related mRNAs were identified (Fig. 1D). The heatmap generated for these genes (Fig. 1E) revealed that some pro-necroptotic genes (e.g., RIPK3, CYLD) were downregulated in tumor tissues, while anti-necroptotic regulators (e.g., PLK) were significantly overexpressed. Quantification of necroptosis-related gene set enrichment score via ssGSEA based on these 50 DE-mRNAs further showed significantly lower median scores in tumor tissues compared to normal tissues (Fig. 1F), indicating inactivation of necroptosis in PCa. Collectively, these results highlighted necroptosis-related genes emerging as key differentially expressed candidates linked to PCa pathogenesis.
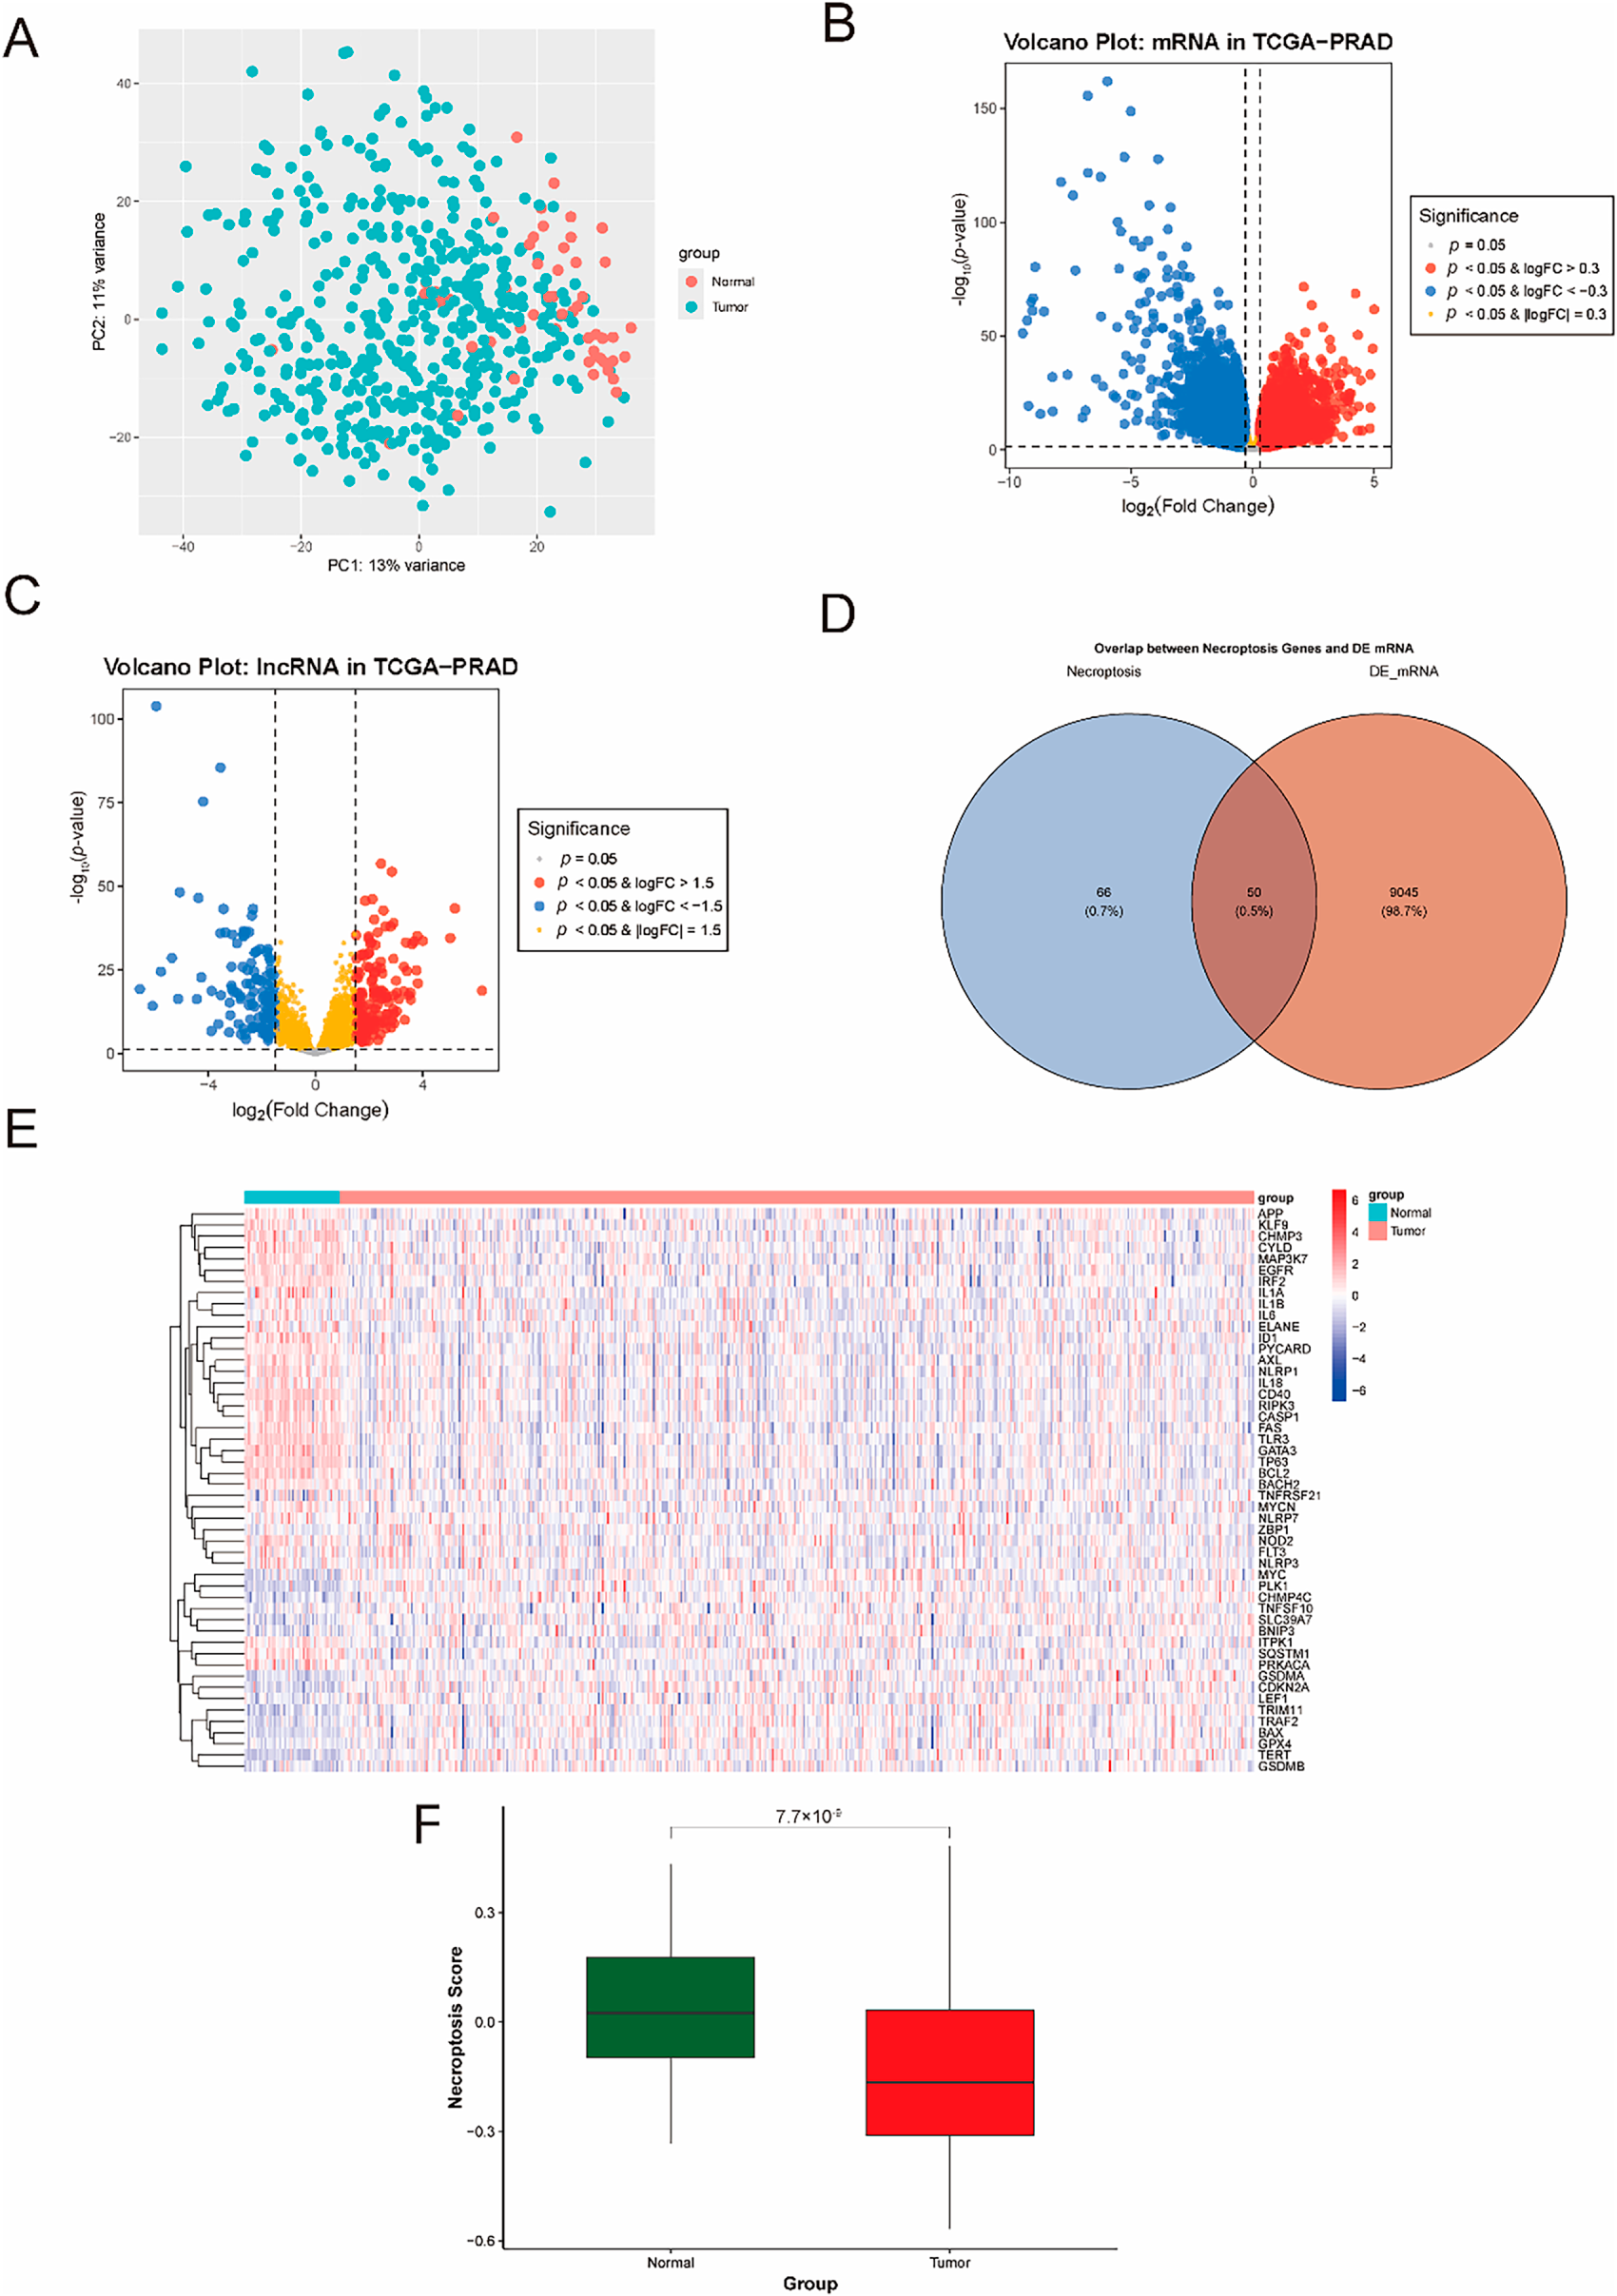
Figure 1: Transcriptional profiling of necroptosis-related differentially expressed mRNAs (DE-mRNAs) in prostate cancer (PCa). (A) Principal component analysis (PCA) of global transcriptomic profiles from the Cancer Genome Atlas (TCGA), showing separation of normal (n = 52) and tumor (n = 499) prostate tissues based on the first principal component (PC1, 13% variance explained). (B, C) Volcano plots visualizing differentially expressed mRNAs (B) and lncRNAs (C) in PCa. (D) Venn diagram illustrating the intersection of DE-mRNAs and a predefined set of necroptosis-related genes (NRGs), identifying 50 necroptosis-related DE-mRNAs. (E) Heatmap showing expression patterns of the 50 necroptosis-related DE-mRNAs in normal and tumor tissues, with pro-necroptotic genes (e.g., RIPK3, CYLD) downregulated and anti-necroptotic genes (e.g., PLK) upregulated in tumors. (F) Boxplot comparing necroptosis activity scores between normal and tumor tissues, demonstrating reduced necroptosis activity in PCa.
3.2 Identification of Necroptosis-Associated lncRNAs in PCa via WGCNA
To identify necroptosis-associated lncRNAs in PCa, we constructed a weighted gene co-expression network using WGCNA. After excluding 5 outlier samples via hierarchical clustering, 494 tumor samples were analyzed. A soft threshold power (β = 9) was selected to ensure scale-free topology (Fig. 2A,B). Hierarchical clustering identified distinct co-expression modules, which were merged into 7 modules based on topological overlap (Fig. 2C). Module-trait correlation analysis revealed that the MEgreen, MEred, and MEyellow modules were strongly associated with necroptosis scores (r = 0.68, p = 1.53 × 10−69; r = 0.65, p = 9.28 × 10−62; r = 0.51, p = 1.42 × 10⁻³⁴, respectively; Fig. 2C). A Venn diagram illustrating the intersection between DE-lncRNAs and module genes revealed 13 overlapping lncRNAs (Fig. 2D), which were correlated with necroptosis in PCa. Functional enrichment analysis revealed that these 13 lncRNAs were significantly enriched in specific BP, MF and CC. For BP, they were enriched in pathways such as “mRNA processing regulation”, “positive regulation of transcription from RNA polymerase II promoter,” “response to oxidative stress,” and “regulation of cell proliferation” (Fig. 2E), suggesting their potential roles in mediating transcriptional regulation, RNA processing, and stress responses during necroptosis. For CC, they were primarily localized to subcellular structures including “nuclear lumen,” “nucleoplasm,” “membrane-enclosed lumen,” and “stress granules” (Fig. 2F), indicating their involvement in nuclear gene expression regulation, membrane dynamics, and stress microenvironment responses. And no significant results were obtained for MF ontology in this enrichment analysis.
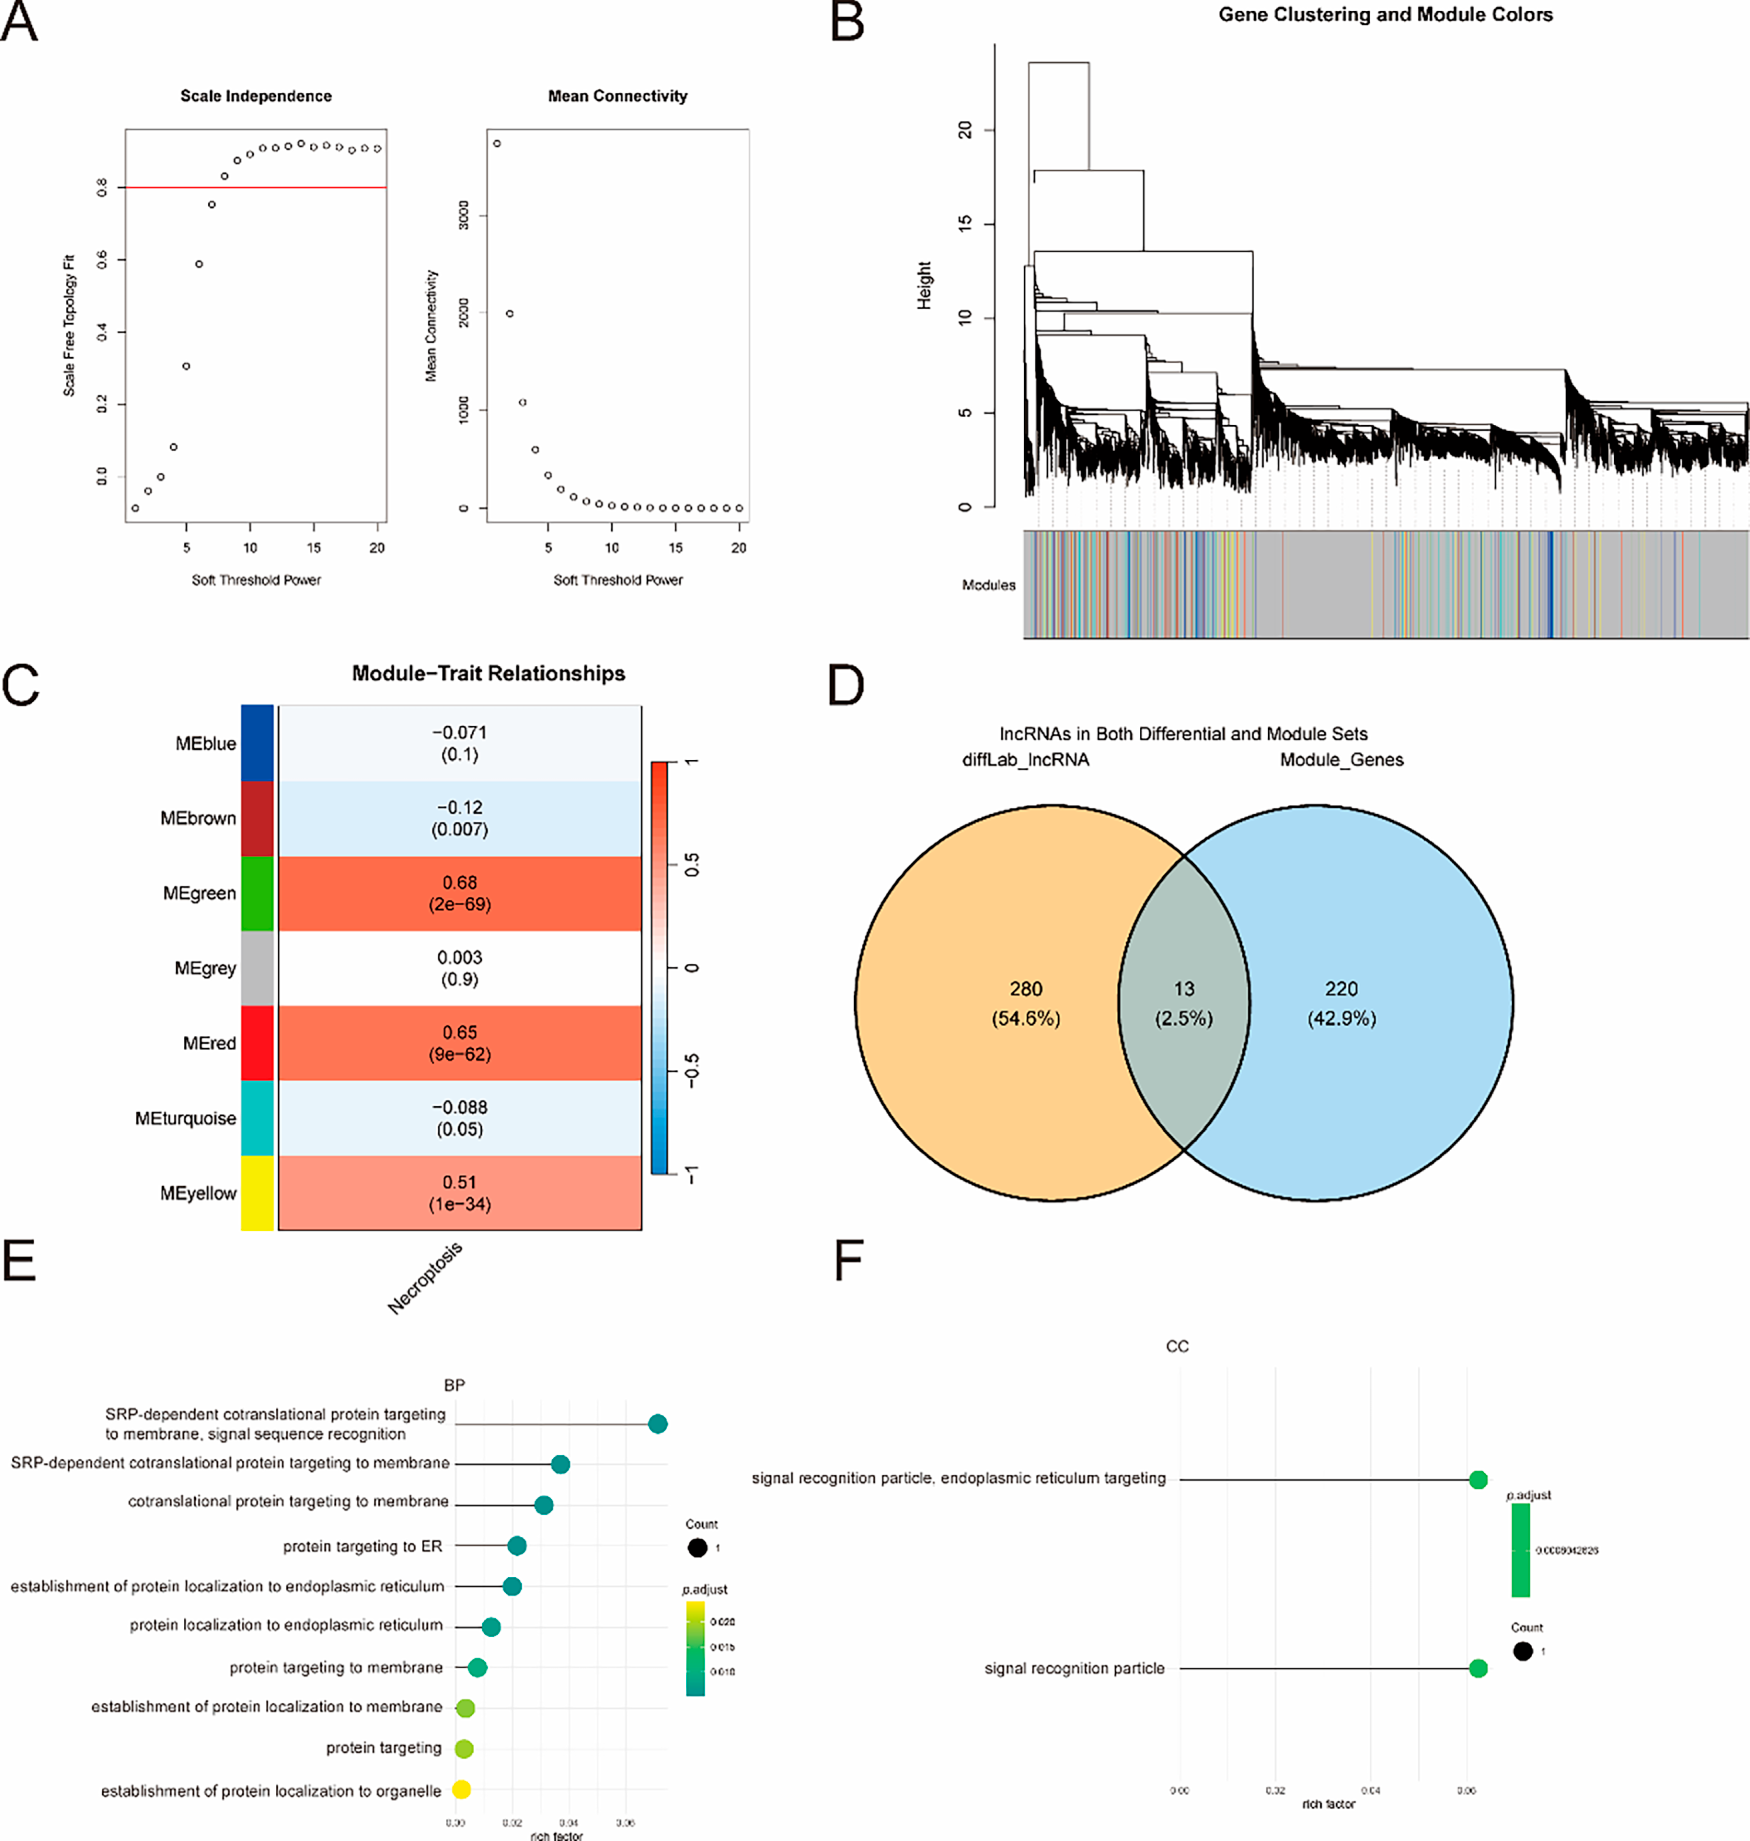
Figure 2: Identification of necroptosis-associated lncRNAs via Weighted Gene Co-expression Network Analysis (WGCNA). (A) Analysis of network topology for different soft threshold powers. The red horizontal line represents the threshold for the scale-free topology fit index. (B) Histogram of connectivity distribution and fit line for scale-free topology. (C) Hierarchical clustering of lncRNAs and module-trait correlation heatmap. (D) Venn diagram showing the intersection of differentially expressed lncRNAs (DE-lncRNAs) and lncRNAs in the three necroptosis-associated modules, identifying 13 core NRlncRNAs. (E) Functional enrichment analysis of the 13 NRlncRNAs: GO biological process (BP) enrichment. (F) Functional enrichment analysis of the 13 NRlncRNAs: GO cellular component (CC) enrichment.
3.3 Prognostic Value of Candidate lncRNAs Identified by Cox Regression Analysis
Further, univariate Cox regression analysis was performed to screen lncRNAs associated with prognosis (Fig. 3A). And two lncRNAs exhibited notable associations: LINC00595 (HR = 0.32, 95% CI: 0.13–0.80, p < 0.05) and LINC00908 (HR = 0.40, 95% CI: 0.19–0.82, p < 0.05). A multivariate Cox regression model was subsequently constructed, incorporating the two significantly associated lncRNAs (Fig. 3B). Although the independent prognostic significance of individual genes did not fully reach the statistical threshold (p > 0.05), the overall model demonstrated robust prognostic value (global p < 0.05), suggesting that the combined effects of their expression levels effectively predicted clinical outcomes. The risk score formula was derived by integrating the regression coefficients: Risk Score = (−0.7307 × LINC00595 expression) + (−0.4763 × LINC00908 expression). Further validation via univariate Cox analysis confirmed the independent prognostic value of this risk score (p < 0.001, HR = 1.30, 95% CI: 1.13–1.50; Fig. 3C and Supplementary Table S1).
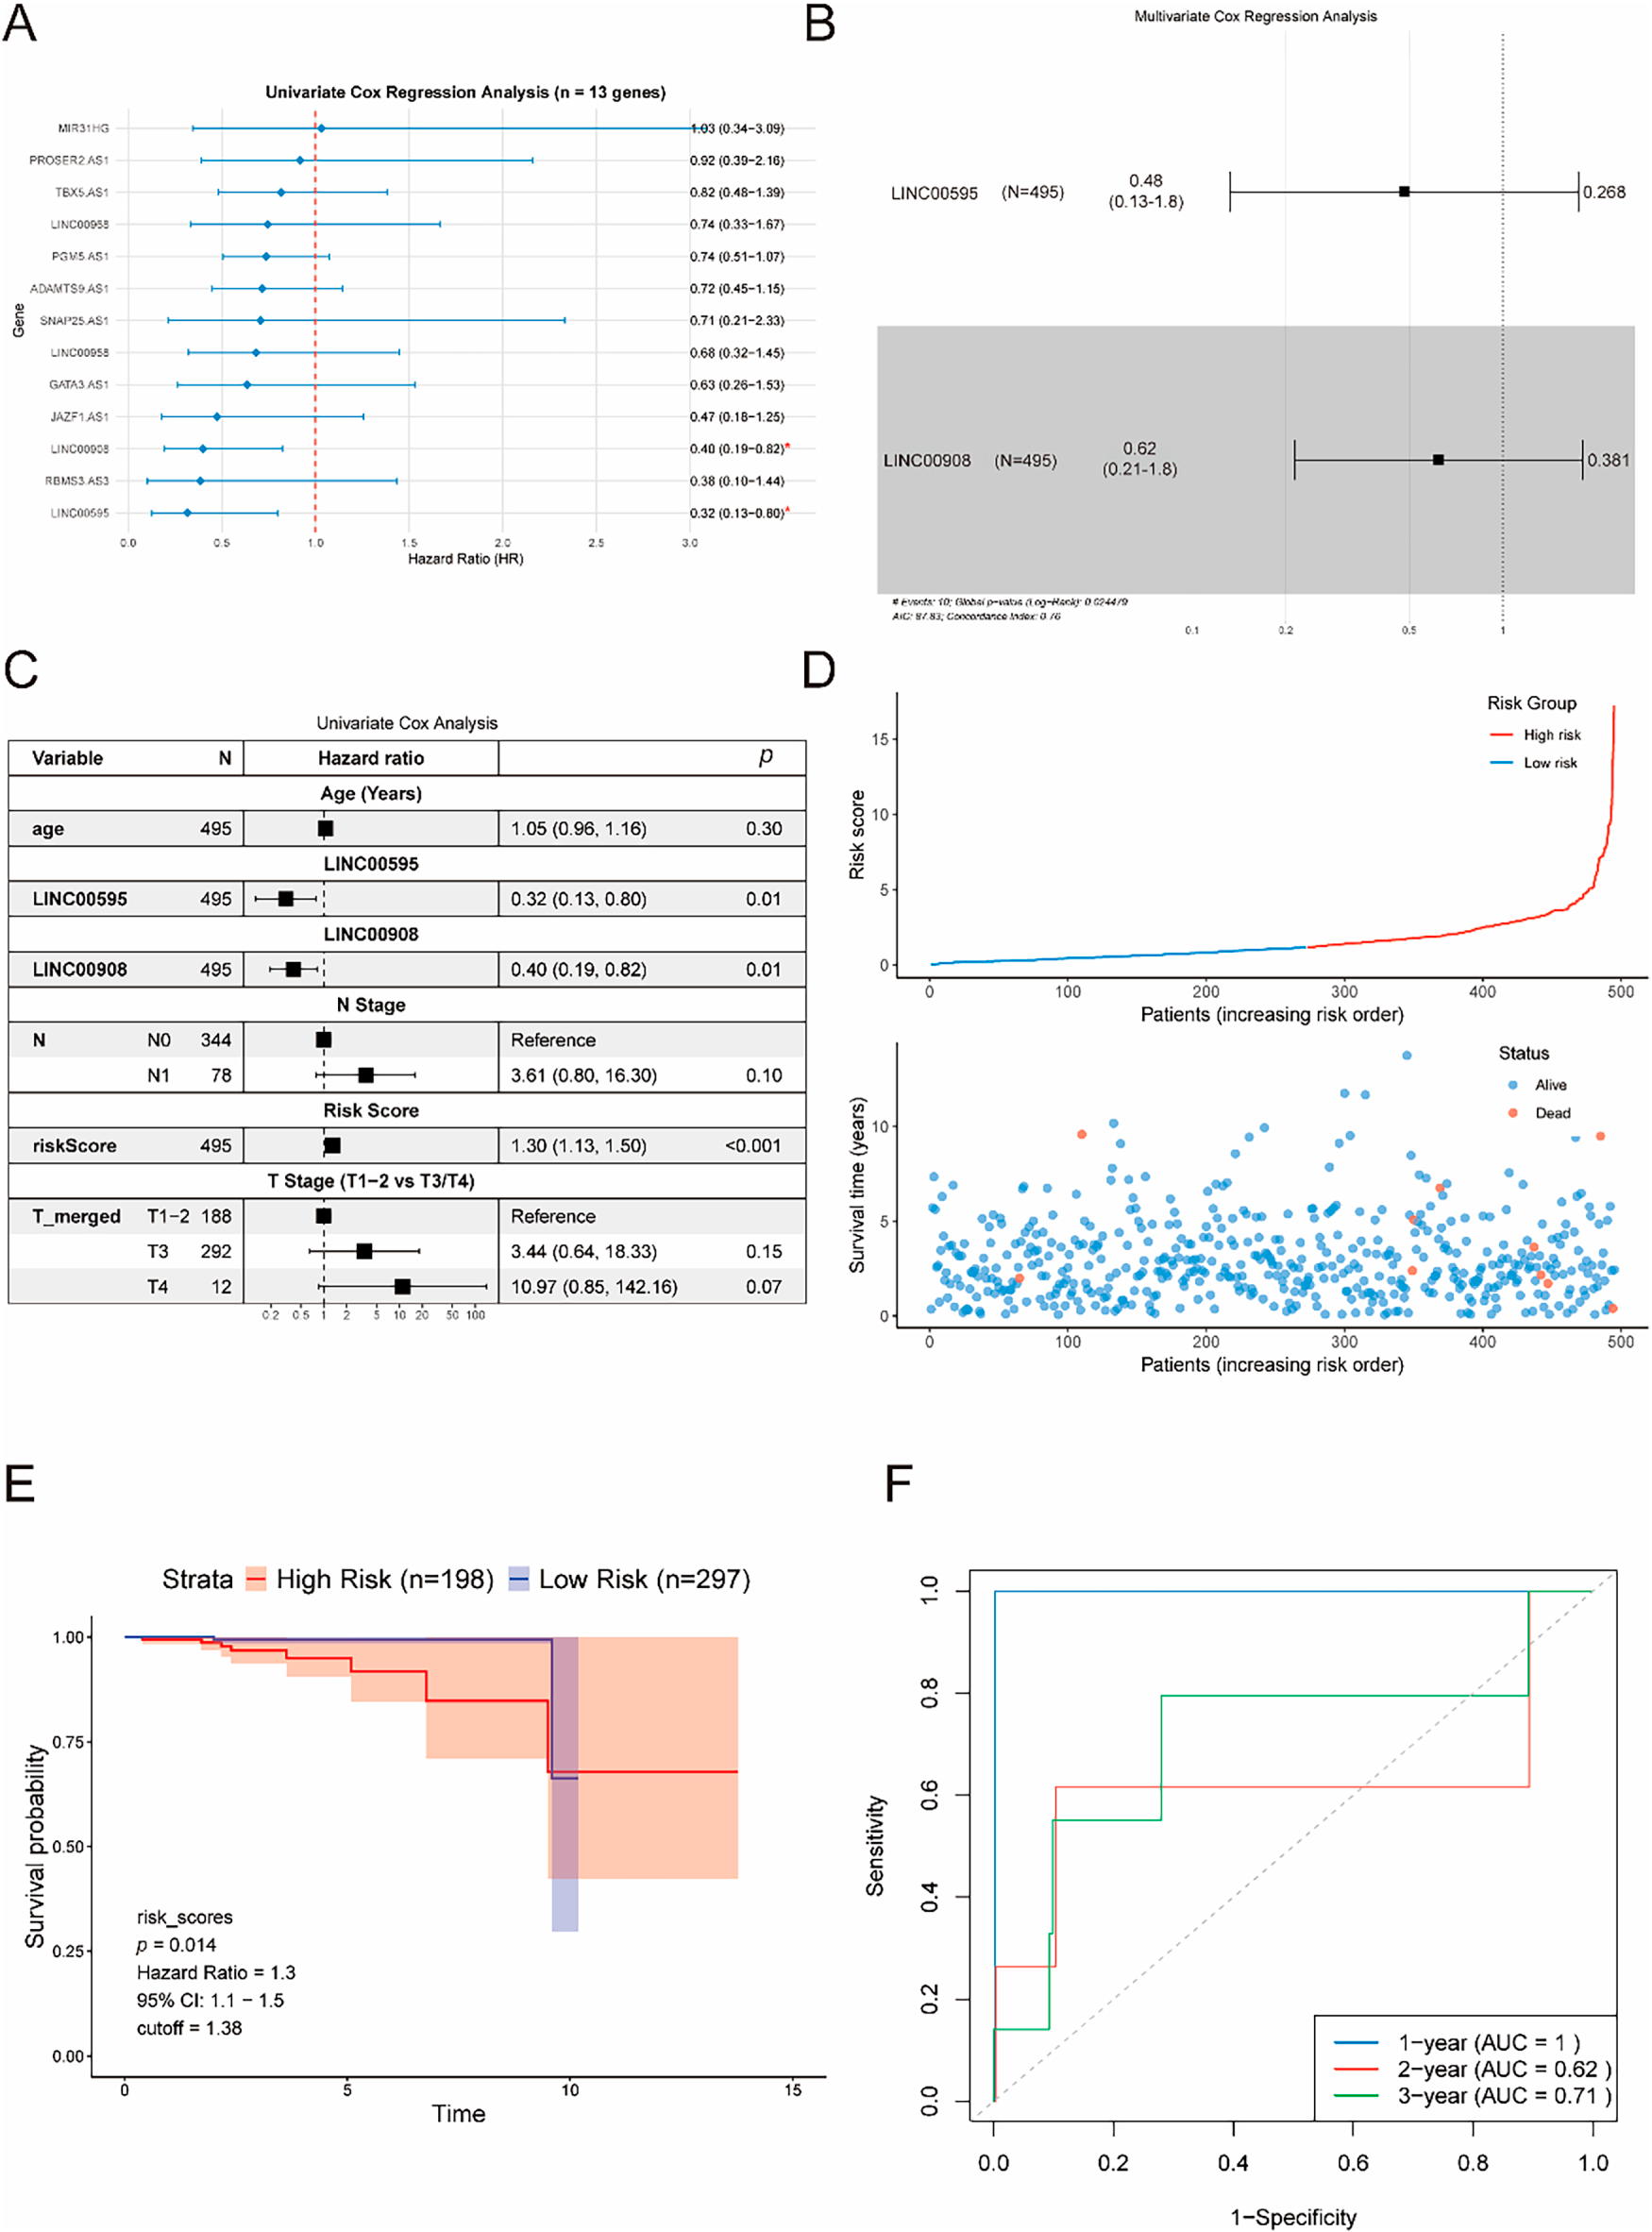
Figure 3: Prognostic value of candidate lncRNAs identified by Cox regression analysis. (A) Forest plot of univariate Cox regression analysis, showing hazard ratios (HR) and 95% confidence intervals (CI) for lncRNAs associated with PCa prognosis. The red dashed line represents the reference line for Hazard Ratio (HR) = 1.0. LINC00595 and LINC00908 are highlighted in *. (B) Forest plot of multivariate Cox regression model incorporating LINC00595 and LINC00908, showing combined prognostic value (global p < 0.05). (C) Forest plot confirming the independent prognostic value of the risk score. (D) Risk score distribution plot (top) and survival status scatter plot (bottom), showing correlation between higher risk scores and increased mortality. (E) KM survival curves for high- and low-risk patients stratified by the risk score, with shorter overall survival in the high-risk group (p = 0.014). (F) Time-dependent ROC curves for 1-year, 2-year, and 3-year survival predictions, with AUC values of 1.0, 0.62, and 0.71, respectively. *p < 0.05.
The risk score distribution plot demonstrated a notable positive association between rising risk scores and mortality incidence, visually highlighting survival disparities across groups (Fig. 3D). Based on an optimal cutoff value, patients were divided into high- and low-risk cohorts. KM survival curves further established that patients in the high-risk group exhibited obviously shorter overall survival than those in the low-risk group (p = 0.014; Fig. 3E). Time-dependent ROC curve analysis indicated moderate-to-good predictive performance of the risk score, with area under the curve (AUC) values of 1, 0.62, and 0.71 for 1-, 2-, and 3-year survival predictions, respectively (Fig. 3F). Additionally, integration of the risk score trend and survival status scatterplot further visualized the collinearity between risk scores and survival outcomes, reinforcing the reliability of the two genes.
3.4 Clinical Relevance of the Two Key lncRNAs
Then, we constructed a Spearman correlation network between the two lncRNAs and 50 necroptosis-related genes (NRGs) (Fig. 4A). 21 NRGs were identified to be significantly correlated with the two key lncRNAs. We next evaluated their expression patterns in PCa using GEPIA (tumor vs. normal tissues) and TCGA-PRAD validation (Fig. 4B–E). GEPIA analysis revealed significant downregulation of LINC00595 (p < 0.05) and LINC00908 (p < 0.05) in PCa (Fig. 4E). We then assessed correlations with clinical parameters (Fig. 4B–D). Both lncRNAs expression was negatively associated with advanced T stage and lymph node metastasis. Finally, we analyzed their prognostic value using Kaplan-Meier curves (Fig. 4F–K). Low expression of LINC00595 and LINC00908 was obviously correlated with worse outcomes. These results collectively demonstrated that LINC00958 and LINC00908 were downregulated in PCa, and correlated with aggressive clinicopathological features and good prognosis.
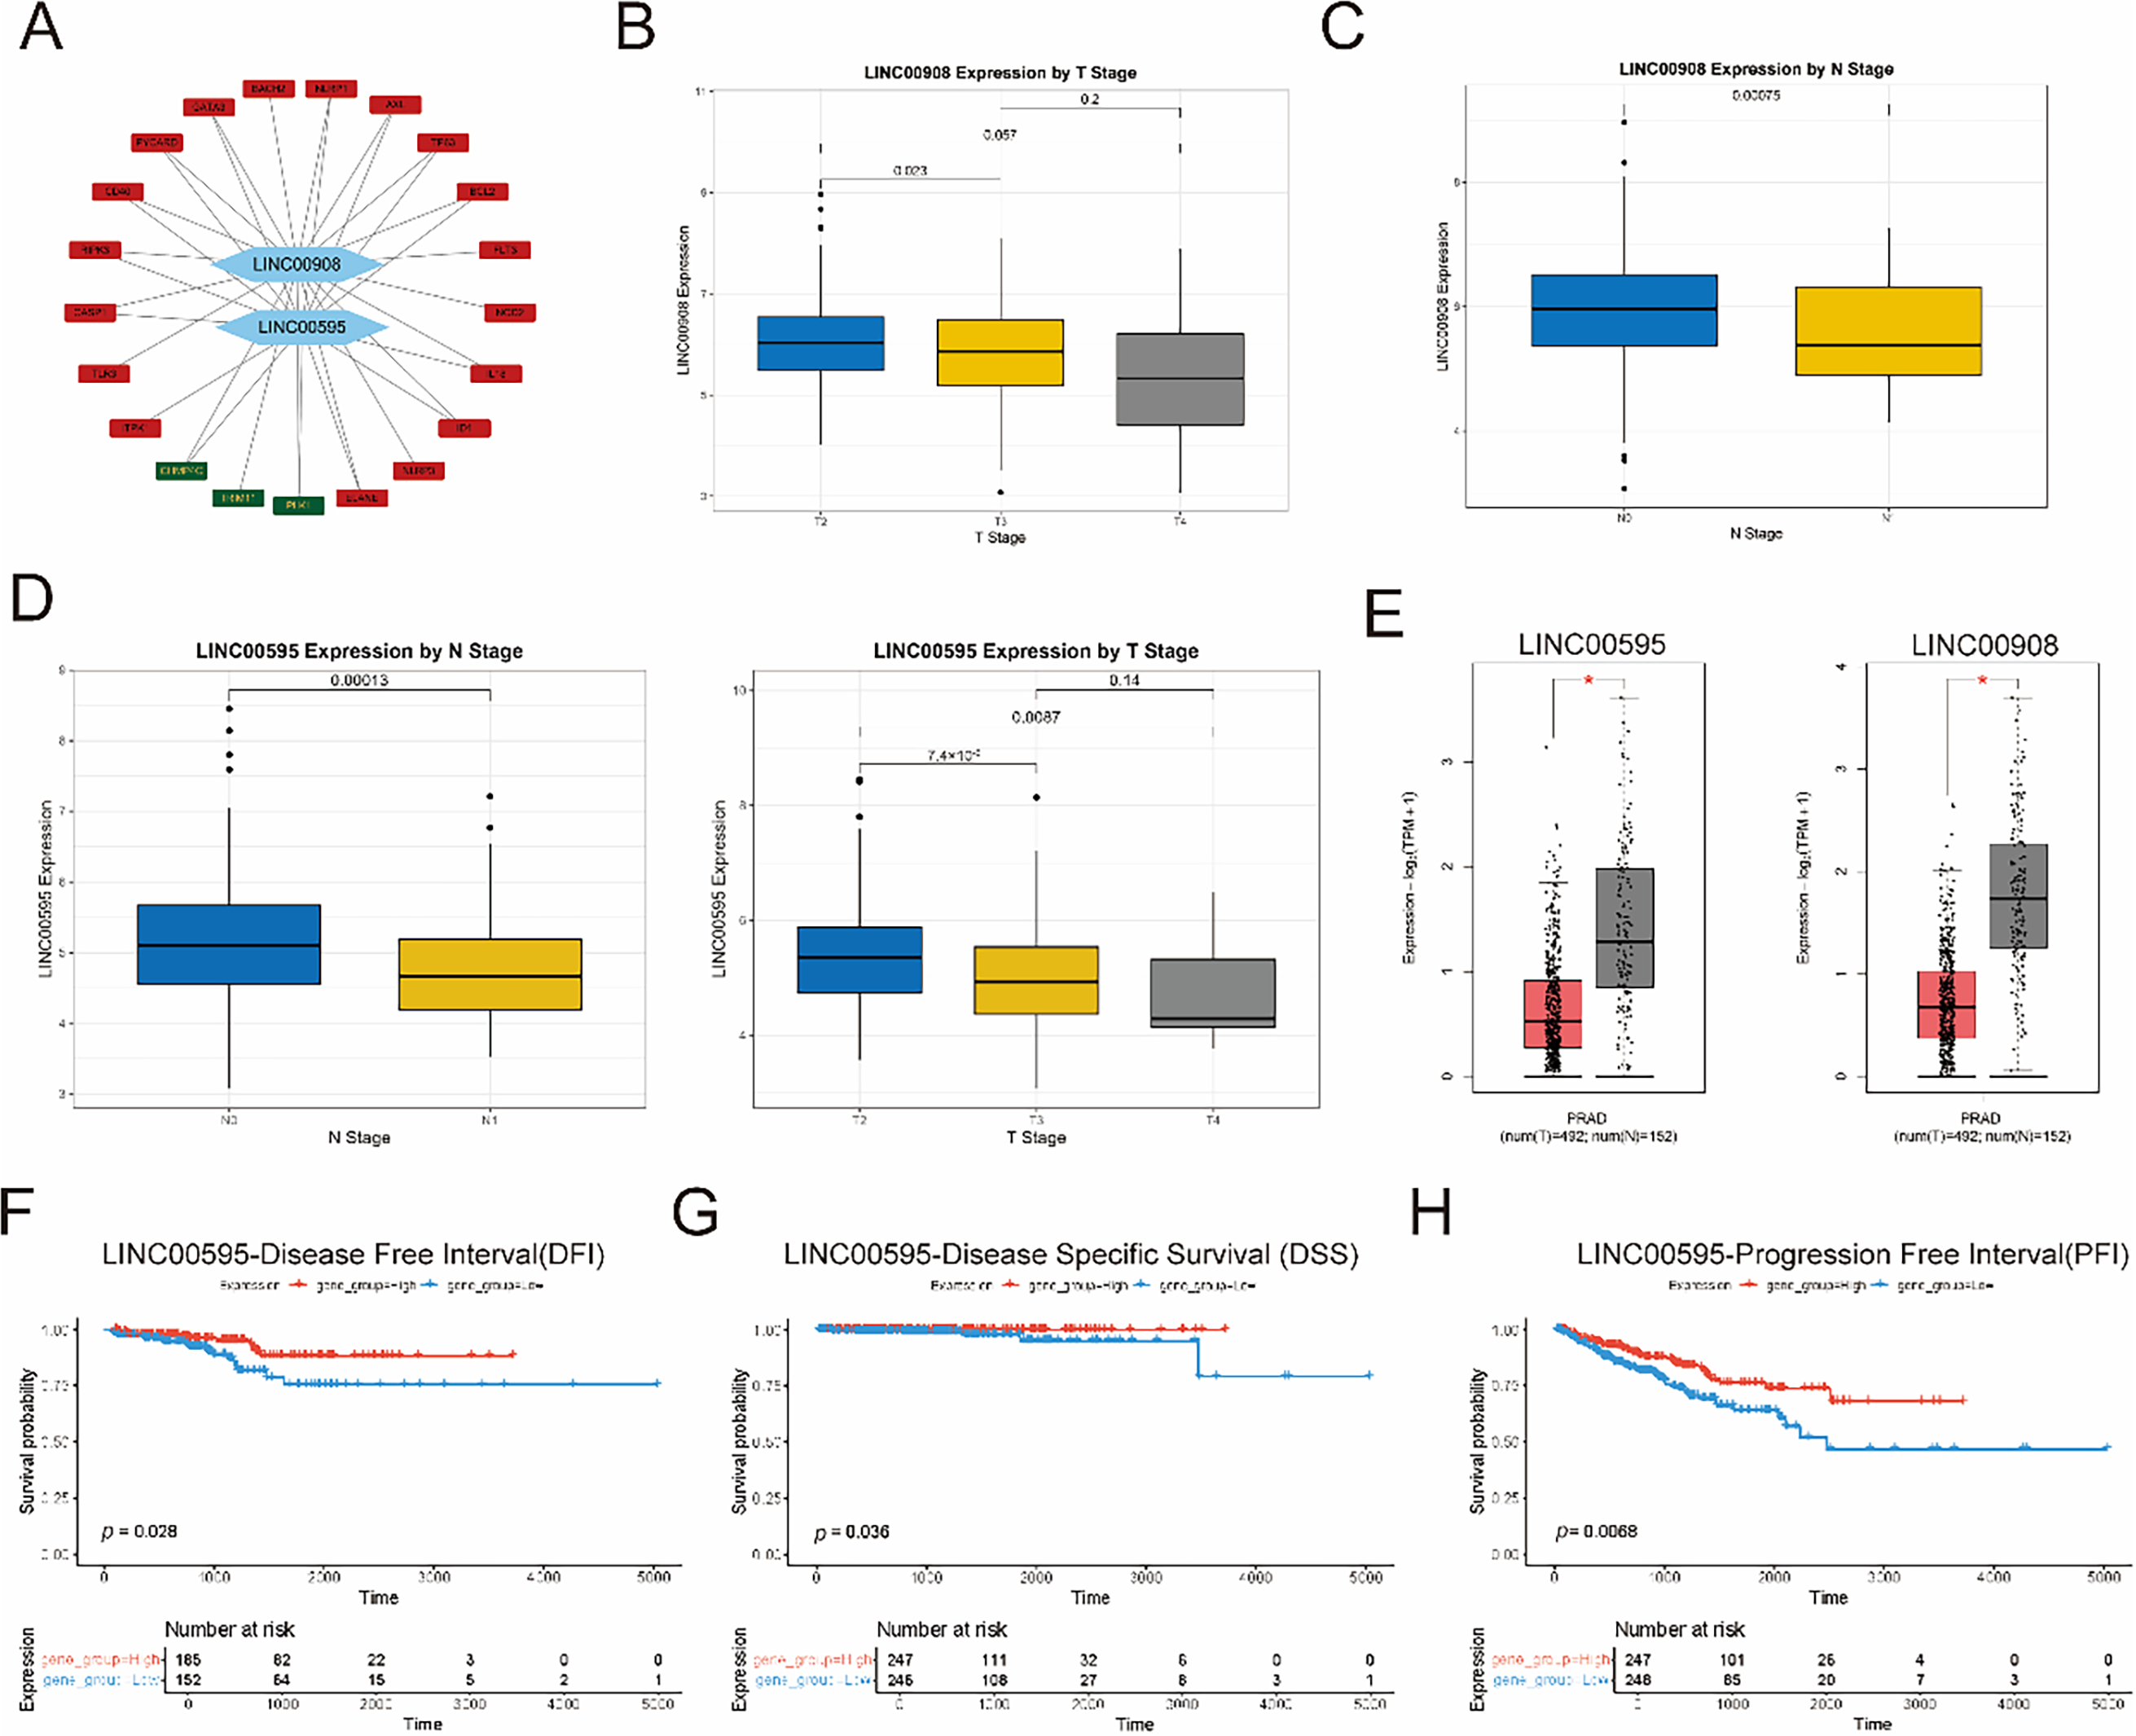
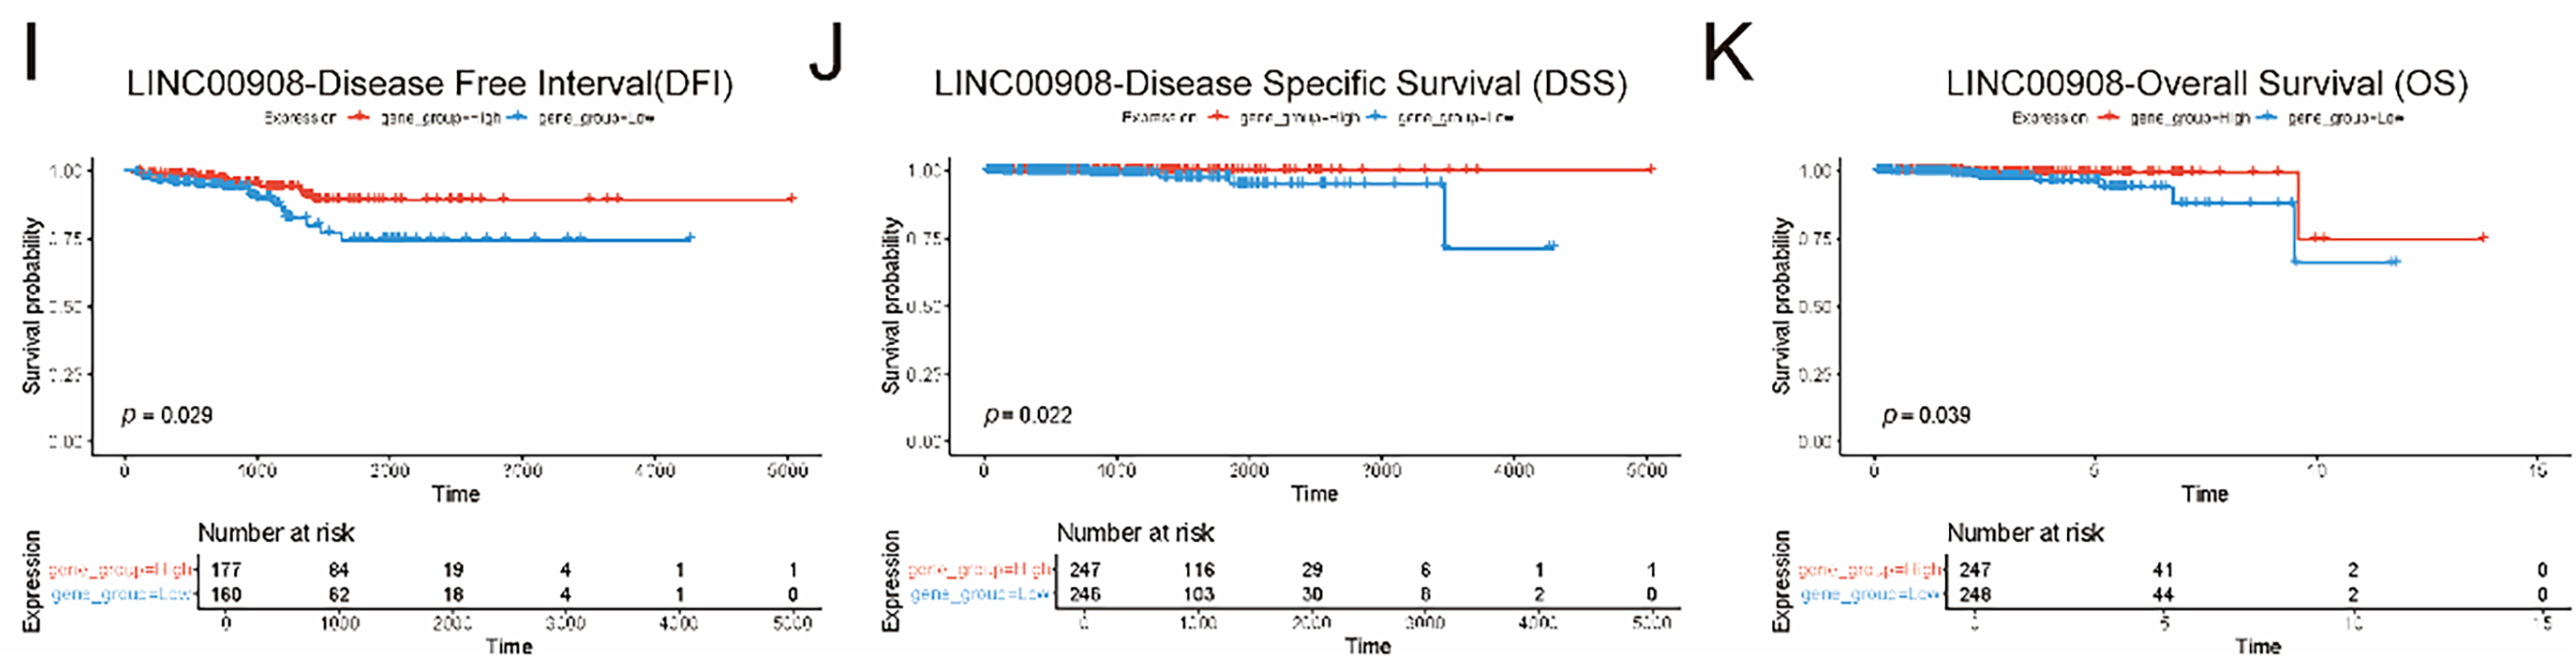
Figure 4: Clinical relevance of LINC00595 and LINC00908 in PCa. (A) Network diagram showing Spearman correlations between LINC00595/LINC00908 and necroptosis-related genes (NRGs) (|r| > 0.3, p < 0.05). (B–D) Boxplots showing associations of LINC00595/LINC00908 expression with advanced T stage (p <0.05) and lymph node metastasis (p < 0.05). (E) Boxplots from GEPIA validation showing downregulation of LINC00595 and LINC00908 in PCa tumor tissues compared to normal tissues (p < 0.05). (F–H) KM survival curves for disease-free interval (DFI), disease-specific survival (DSS), and progression-free interval (PFI) stratified by LINC00595 expression. (I–K) KM survival curves for DFI, DSS, and overall survival (OS) stratified by LINC00908 expression (log-rank p < 0.05). *p < 0.05.
3.5 Validation of the Effects of LINC00595 in PCa Cells
To confirm the function of LINC00908 and LINC00595 in PCa, we first examine their expression in PCa cell lines (DU145, PC-3, LNCaP) and the normal prostate cells RWPE-2. As shown in Fig. 5A, LINC00908 and LINC00595 were markedly reduced in all three PCa cell lines compared to RWPE-2. Given that multiple studies have already identified the tumor-suppressive role of LINC00908 in various cancers, including prostate cancer, we next turned our attention to confirming the functional role of LINC00595 in prostate cancer. We constructed a lentiviral overexpression vector (oe-LINC00595) and confirmed successful transduction in LNCaP and DU145 cells via qRT-PCR. CCK-8 assays revealed that overexpression of LINC00595 significantly inhibited cell proliferation in PCa cells (Figs. 5B and S2A). Transwell assays further demonstrated that LINC00595 overexpression reduced the migratory and invasive capacities of LNCaP and DU145 cells (Figs. 5C,D and S2B,C). To verify the role of LINC00595 on necroptosis of PCa cells, we performed WB analysis of necroptosis-related proteins. Phosphorylated RIPK3 (p-RIPK3) and p-MLKL levels were significantly increased in the oe-LINC00595 group (Figs. 5E,F and S2D,E). These findings suggested that LINC00595 may promote necroptosis of PCa cells.
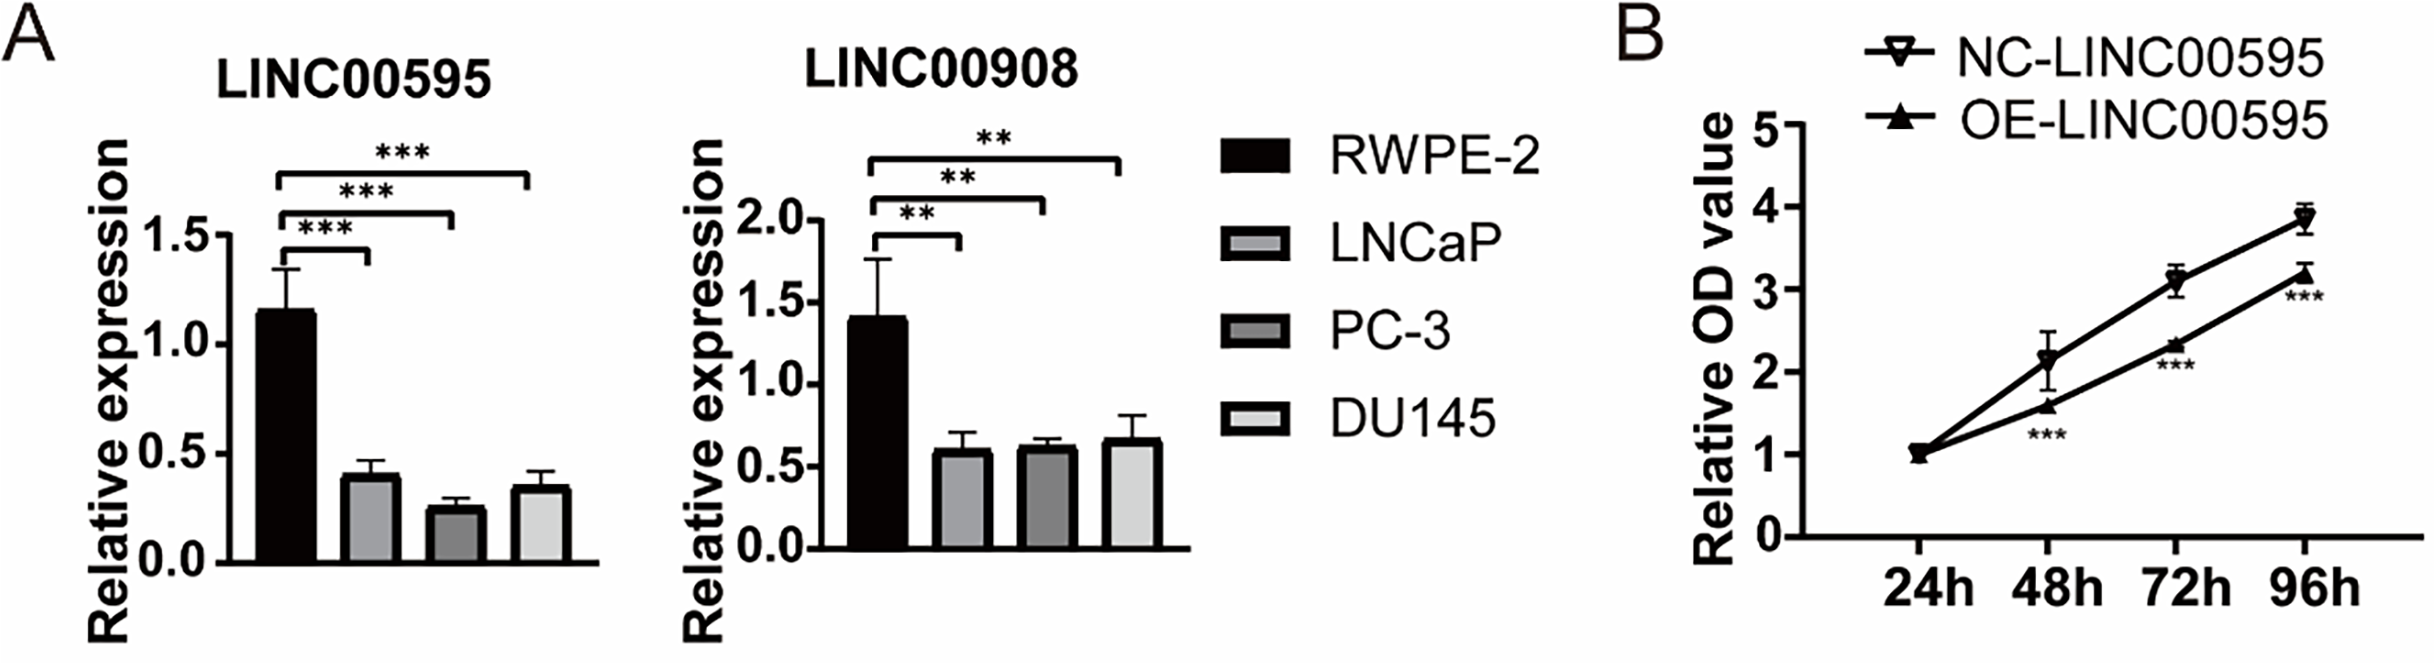
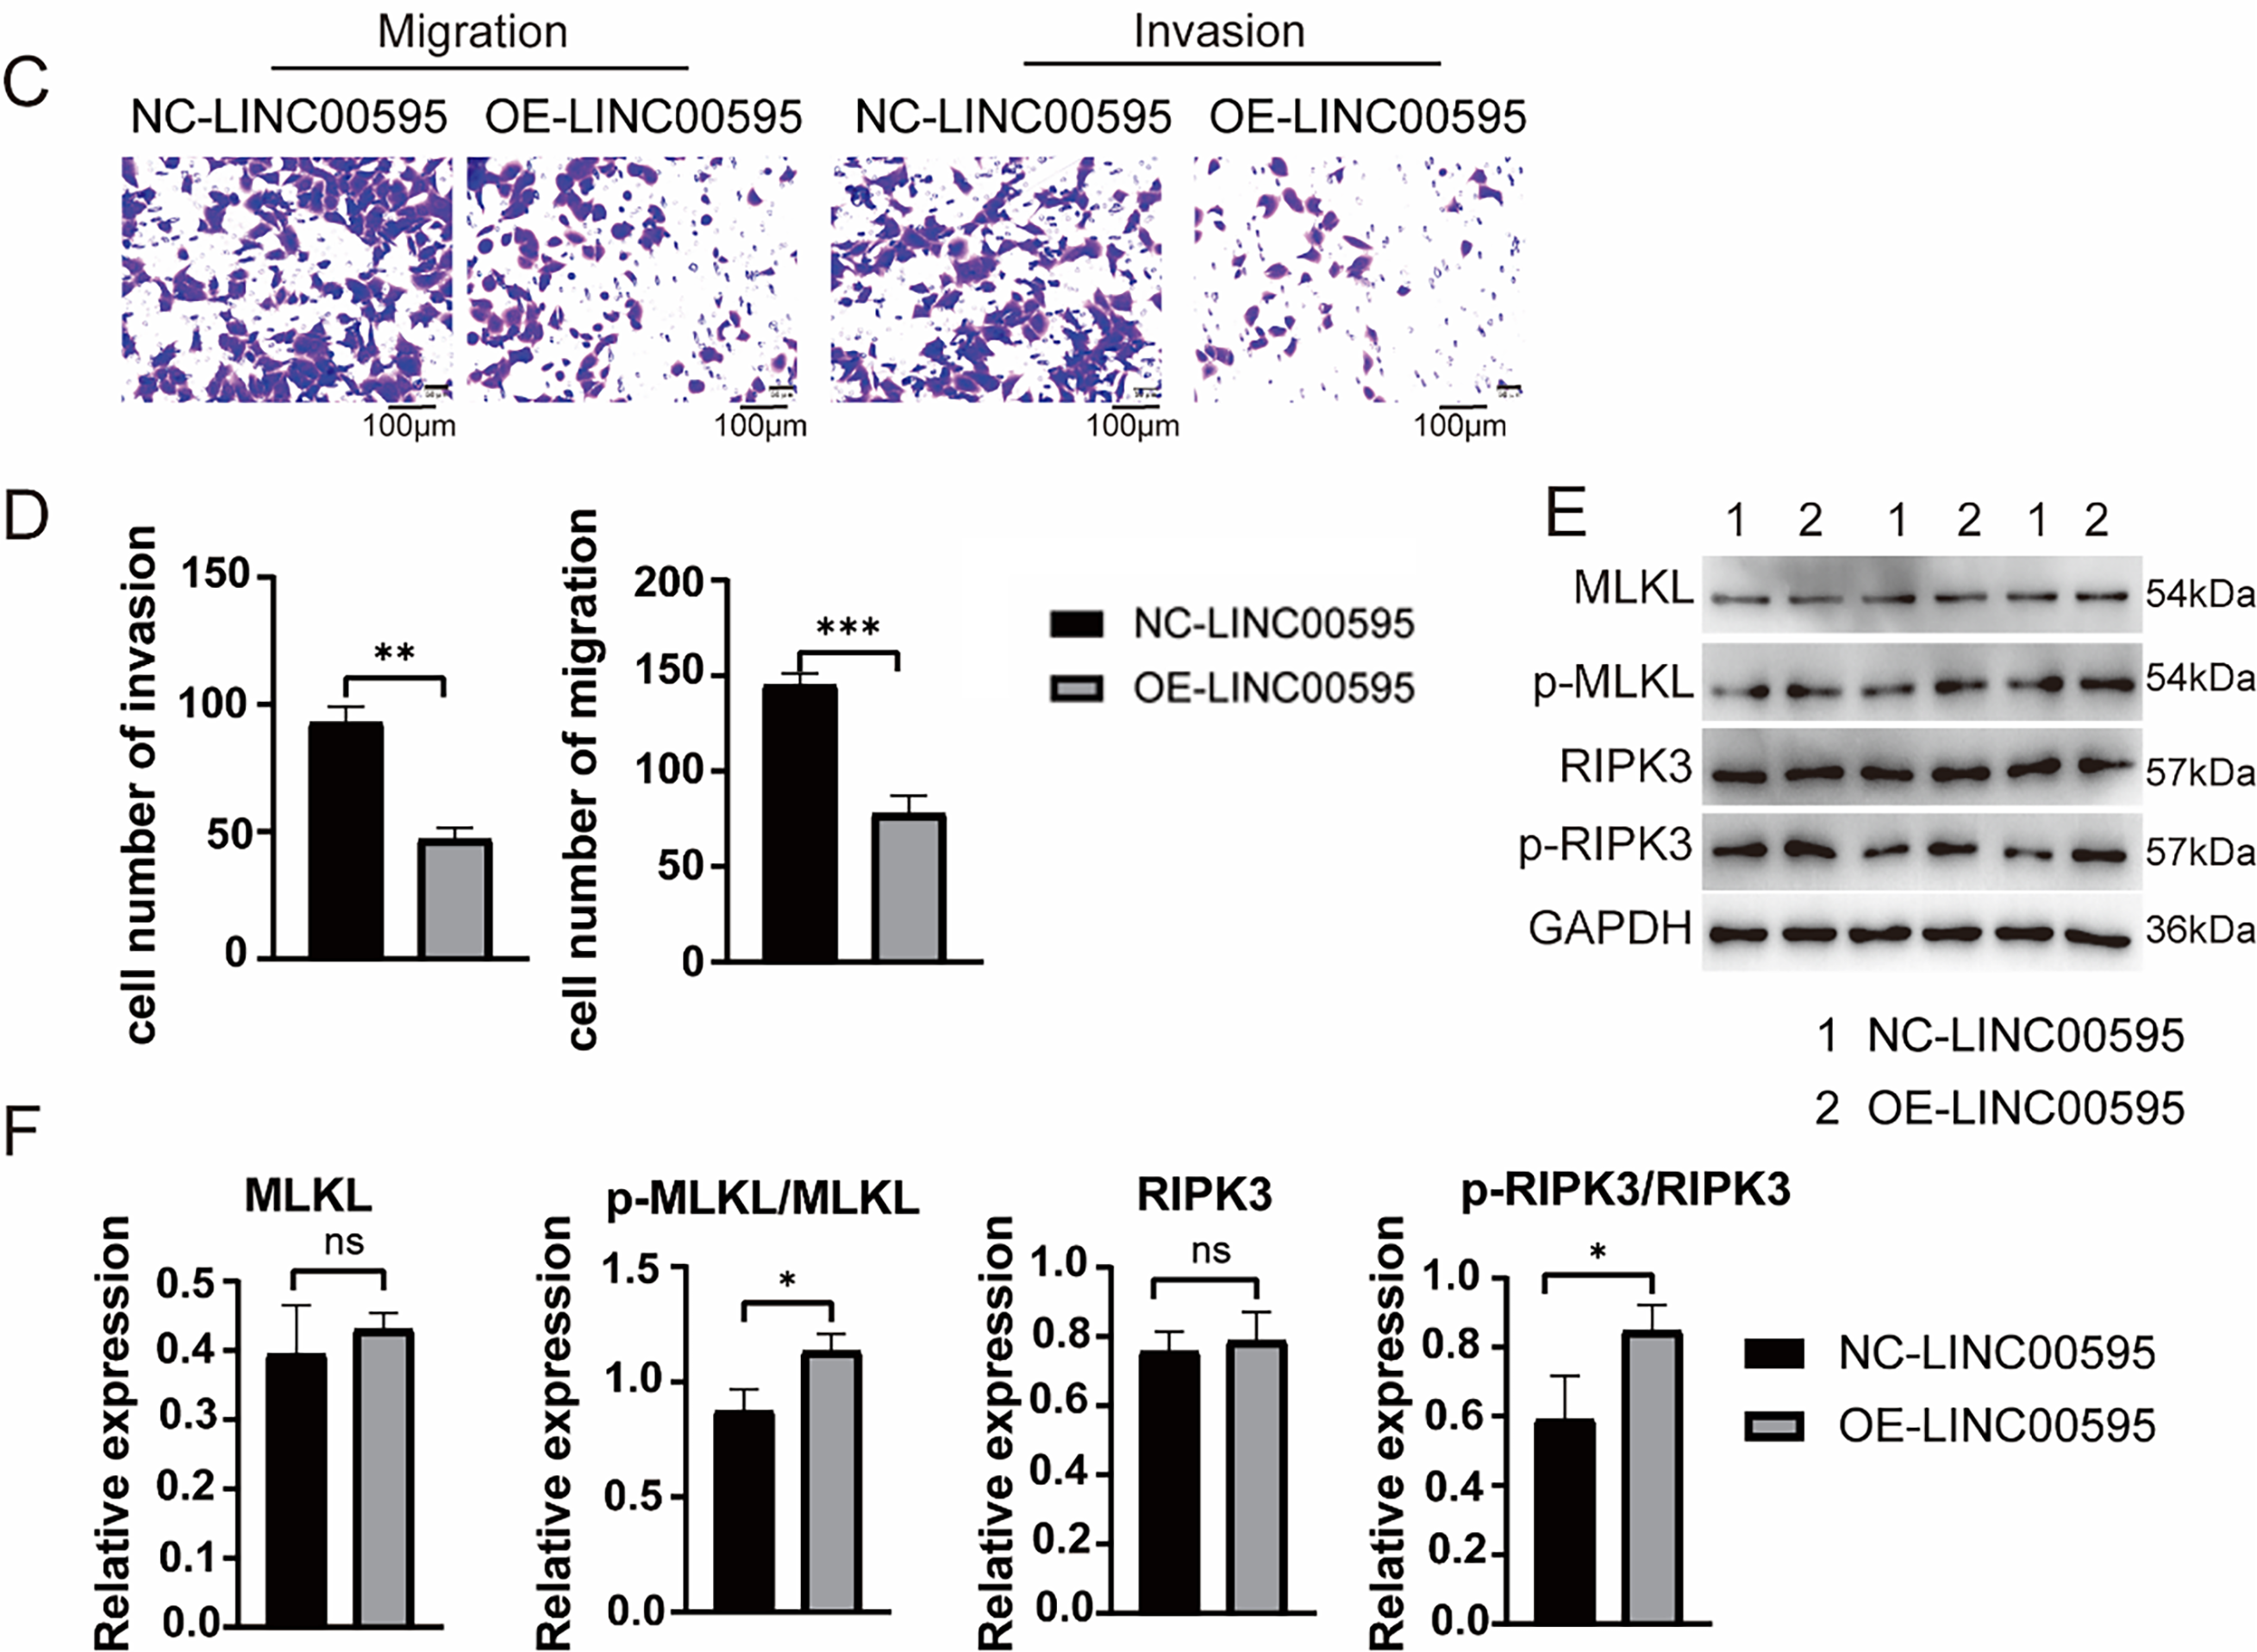
Figure 5: Functional validation of LINC00595 in PCa cells. (A) qRT-PCR analysis showing reduced expression of LINC00595 and LINC00908 in PCa cell lines (LNCaP, PC-3, DU145) compared to normal prostate epithelial cells (RWPE-2) (p < 0.05). (B) CCK-8 assay demonstrating inhibited proliferation of LNCap cells after LINC00595 overexpression (oe-LINC00595) compared to controls (p < 0.05). (C,D) Transwell assays showing reduced migration and invasion of LNCap cells in the oe-LINC00595 group (p < 0.05; scale bar: 100 μm). (E,F) Western blot analysis reveals increased phosphorylation of RIPK3 (p-RIPK3) and MLKL (p-MLKL) in oe-LINC00595-transfected LNCap cells, indicating enhanced necroptosis. ns: no significant, *p < 0.05, **p < 0.01, ***p < 0.001.
PCa remains a global health burden, with advanced and castration-resistant forms posing significant therapeutic challenges [28]. This study aimed to dissect the role of lncRNAs in regulating necroptosis to identify novel biomarkers and therapeutic targets for PCa. Through integrative bioinformatics and experimental validation, we uncovered a key necroptosis-associated lncRNA, LINC00595, and elucidated its functional contributions to PCa progression.
Our transcriptional profiling revealed coordinated dysregulation of NRGs in PCa, with pro-necroptotic factors such as RIPK3 and CYLD downregulated, and anti-necroptotic regulators like PLK were upregulated. This expression profile aligned well with the findings from ssGSEA analysis, showing reduced activity of the necroptosis pathway in tumor tissues. This suggested that PCa cells may actively evade necroptosis-mediated cell death to create favorable conditions for tumor survival and proliferation. These findings aligned with emerging evidence suggesting that necroptosis suppression was a common adaptive mechanism in cancers, including PCa, allowing malignant cells to evade cell death and survive under stress conditions [29–31]. For instance, Wang et al. [32] reported that reduced RIPK3 expression correlates with poor prognosis in prostate cancer, while MLKL deficiency enhances PCa cell survival under nutrient deprivation [11]. Together, our data supported the hypothesis that impaired necroptosis contributes to PCa initiation and progression, highlighting the need to identify upstream regulators of this pathway for therapeutic targeting.
Using WGCNA, we identified three modules (MEgreen, MEred, MEyellow) strongly associated with necroptosis scores, leading to the discovery of 13 core lncRNAs. Among these lncRNAs, LINC00595 and LINC00908 were identified as key molecules associated with necroptosis through Cox regression analysis. Clinical correlation analysis further confirmed the significance of LINC00595 and LINC00908 in prostate cancer. Compared with normal tissues, both lncRNAs showed a significant decrease in expression in tumor tissues, and their low expressions were associated with advanced T stage, lymph node metastasis, and dismal outcomes. Several studies have reported the downregulation of LINC00908 in various cancers, including prostate, gastric, and breast cancers [33–35]. For example, LINC00908, which was downregulated, inhibited the progression of lung cancer via DEAD-box helicase 54 [36]. LINC00908, which was downregulated, negatively associated with disease development and overall survival of gastric patients [33]. In PCa specifically, prior work has demonstrated that LINC00908 suppresses cancer stemness via the GSK3B/FBXW2 signaling axis [37] and hinders cell proliferation and invasion through the miR-483-5p/TSPYL5 pathway [34]. Notably, our study extends these observations by uncovering a novel functional dimension of LINC00908: its association with necroptosis regulation in PCa. While existing studies have focused on its role in modulating signaling pathways related to stemness or miRNA sponging, our WGCNA and clinical correlation analysis first link it to reduced necroptosis activity in PCa tissues, suggesting that its tumor-suppressive effects may partially rely on activating necroptotic cell death.
In contrast to LINC00908, LINC00595 represents a previously uncharacterized lncRNA in cancer biology. To our knowledge, no studies have explored its functional role in any malignancy prior to this work. Our clinical correlation analysis revealed that LINC00595 was significantly downregulated in PCa tissues, and its low expression is associated with advanced disease stages and poor prognosis. Further, our in vitro experiments revealed that LINC00595 overexpression enhanced phosphorylation of RIPK3 and MLKL, core effectors of necroptosis. To our knowledge, this is the first study to implicate LINC00908 and LINC00595 in necroptosis regulation.
This study has several limitations. First, the bioinformatics analysis mainly relied on TCGA data. It should be specifically noted that internal cross-validation or external validation with independent cohorts was not performed for the ROC curves. This is because the core objective of this study was to “identify novel necroptosis-associated lncRNAs and validate their functions” rather than to develop a clinical-grade prognostic prediction tool, and thus, the aforementioned validation experiments were not conducted. Second, although we demonstrated the role of LINC00595 in promoting necroptosis and inhibiting the malignant phenotype of prostate cancer cells, the precise molecular mechanisms, such as direct interaction with NRGs or ceRNA activity, remain to be elucidated. Third, in vivo studies are required to confirm the therapeutic potential of targeting the two lncRNAs in preclinical models.
In conclusion, our study systematically identified LINC00595 and LINC00908 as critical lncRNAs regulating necroptosis in prostate cancer. These lncRNAs can serve as prognostic biomarkers and potential therapeutic targets, among which LINC00595 inhibits prostate cancer progression by directly promoting necroptosis. By revealing the link between lncRNA-mediated regulation and necroptosis in prostate cancer, our findings deepen the understanding of disease pathogenesis and lay a foundation for the development of lncRNA-based strategies to improve the diagnosis and treatment of PCa.
Acknowledgement: None.
Funding Statement: The authors received no specific funding.
Author Contributions: Study conception and design: Kai Tang and Ruozeng Rong. Data collection: Kai Tang and Shengxing Lu. Analysis and interpretation of results: Cuie He. Draft manuscript preparation: Kai Tang and Ruozeng Rong. All authors reviewed and approved the final version of the manuscript.
Availability of Data and Materials: The data that support the findings of this study are available from the corresponding author [Ruozeng Rong] upon reasonable request.
Ethics Approval: Not applicable.
Conflicts of Interest: The authors declare no conflicts of interest.
Supplementary Materials: The supplementary material is available online at https://www.techscience.com/doi/10.32604/biocell.2026.072154/s1. Fig. S1: The flow diagram of the work. Fig. S2: Functional validation of LINC00595 in DU145 cells. Table S1 Univariate Cox Regression Analysis of the prognostic value of risk score.
References
1. Wang L, Lu B, He M, Wang Y, Wang Z, Du L. Prostate cancer incidence and mortality: global status and temporal trends in 89 countries from 2000 to 2019. Front Public Health. 2022;10:811044. doi:10.3389/fpubh.2022.811044. [Google Scholar] [PubMed] [CrossRef]
2. Liu X, Jiang H. The global, regional, and national prostate cancer burden and trends from 1990 to 2021, results from the global burden of disease study 2021. Front Public Health. 2025;13:1553747. doi:10.3389/fpubh.2025.1553747. [Google Scholar] [PubMed] [CrossRef]
3. Liu J, Dong L, Zhu Y, Dong B, Sha J, Zhu HH, et al. Prostate cancer treatment—China’s perspective. Cancer Lett. 2022;550(3):215927. doi:10.1016/j.canlet.2022.215927. [Google Scholar] [PubMed] [CrossRef]
4. Miller DR, Ingersoll MA, Teply BA, Lin MF. Targeting treatment options for castration-resistant prostate cancer. Am J Clin Exp Urol. 2021;9(1):101–20. doi:10.36255/exonpublications.prostatecancer.combinationtreatment.2021. [Google Scholar] [PubMed] [CrossRef]
5. Ceci F, Airo Farulla LS, Bonatto E, Evangelista L, Aliprandi M, Cecchi LG, et al. New target therapies in prostate cancer: from radioligand therapy, to PARP-inhibitors and immunotherapy. Q J Nucl Med Mol Imaging Off Publ Ital Assoc Nucl Med. 2024;68(2):101–15. doi:10.23736/S1824-4785.24.03575-1. [Google Scholar] [PubMed] [CrossRef]
6. Qian S, Long Y, Tan G, Li X, Xiang B, Tao Y, et al. Programmed cell death: molecular mechanisms, biological functions, diseases, and therapeutic targets. Med Comm. 2024;5(12):e70024. doi:10.1002/mco2.70024. [Google Scholar] [PubMed] [CrossRef]
7. Li Z, Li D, Chen R, Gao S, Xu Z, Li N. Cell death regulation: a new way for natural products to treat osteoporosis. Pharmacol Res. 2023;187:106635. doi:10.1016/j.phrs.2022.106635. [Google Scholar] [PubMed] [CrossRef]
8. Yuan J, Amin P, Ofengeim D. Necroptosis and RIPK1-mediated neuroinflammation in CNS diseases. Nat Rev Neurosci. 2019;20(1):19–33. doi:10.1038/s41583-018-0093-1. [Google Scholar] [PubMed] [CrossRef]
9. Tong X, Tang R, Xiao M, Xu J, Wang W, Zhang B, et al. Targeting cell death pathways for cancer therapy: recent developments in necroptosis, pyroptosis, ferroptosis, and cuproptosis research. J Hematol Oncol. 2022;15(1):174. doi:10.1186/s13045-022-01392-3. [Google Scholar] [PubMed] [CrossRef]
10. Niu X, Chen L, Li Y, Hu Z, He F. Ferroptosis, necroptosis, and pyroptosis in the tumor microenvironment: perspectives for immunotherapy of SCLC. Semin Cancer Biol. 2022;86(Pt 3):273–85. doi:10.1016/j.semcancer.2022.03.009. [Google Scholar] [PubMed] [CrossRef]
11. Beretta GL, Zaffaroni N. Necroptosis and prostate cancer: molecular mechanisms and therapeutic potential. Cells. 2022;11(7):1221. doi:10.3390/cells11071221. [Google Scholar] [PubMed] [CrossRef]
12. Zhu M, Liu D, Liu G, Zhang M, Pan F. Caspase-linked programmed cell death in prostate cancer: from apoptosis, necroptosis, and pyroptosis to PANoptosis. Biomolecules. 2023;13(12):1715. doi:10.3390/biom13121715. [Google Scholar] [PubMed] [CrossRef]
13. Heidaryan F, Bamehr H, Babaabasi B, Emamvirdizadeh A, Mohammadzadeh N, Khalili A. The trend of ripk1/ripk3 and mlkl mediated necroptosis pathway in patients with different stages of prostate cancer as promising progression biomarkers. Clin Lab. 2020;66(3):190439. doi:10.7754/Clin.Lab.2019.190439. [Google Scholar] [PubMed] [CrossRef]
14. Fu W, Li H, Fu H, Zhao S, Shi W, Sun M, et al. The SIRT3 and SIRT6 promote prostate cancer progression by inhibiting necroptosis-mediated innate immune response. J Immunol Res. 2020;2020(1):8820355. doi:10.1155/2020/8820355. [Google Scholar] [PubMed] [CrossRef]
15. Mattick JS, Amaral PP, Carninci P, Carpenter S, Chang HY, Chen LL, et al. Long non-coding RNAs: definitions, functions, challenges and recommendations. Nat Rev Mol Cell Biol. 2023;24(6):430–47. doi:10.1038/s41580-022-00566-8. [Google Scholar] [PubMed] [CrossRef]
16. Huang Y, Mo W, Ding X, Ding Y. Long non-coding RNAs in breast cancer stem cells. Med Oncol. 2023;40(6):177. doi:10.1007/s12032-023-02046-1. [Google Scholar] [PubMed] [CrossRef]
17. Liu H, Niu T, Qiu G, Cui S, Zhang D. Taurine promotes insulin synthesis by enhancing Isl-1 expression through miR-7a/RAF1/ERK1/2 pathway. In Vitro Cell Develop Biol Anim. 2024;60(1):23–35. doi:10.1007/s11626-023-00835-6. [Google Scholar] [PubMed] [CrossRef]
18. Syed RU, Afsar S, Aboshouk NAM, Salem Alanzi S, Abdalla RAH, Khalifa AAS, et al. LncRNAs in necroptosis: deciphering their role in cancer pathogenesis and therapy. Pathol Res Pract. 2024;256(1):155252. doi:10.1016/j.prp.2024.155252. [Google Scholar] [PubMed] [CrossRef]
19. Luo Z, Ding E, Yu L, Wang W, Guo Q, Li X, et al. Identification of hub necroptosis-related lncRNAs for prognosis prediction of esophageal carcinoma. Aging. 2023;15(11):4794–819. doi:10.18632/aging.204763. [Google Scholar] [PubMed] [CrossRef]
20. Wu YD, Huang XX, Zhang HX, Pan HX, Xie Y, Li CK, et al. TRAF3IP2-AS1 deficiency induces necroptosis to promote pancreatic cancer liver metastasis. Cancer Res. 2025;85(17):3292–312. doi:10.1158/0008-5472.CAN-24-4784. [Google Scholar] [PubMed] [CrossRef]
21. Duan X, Shi J, Hou R, Huang Y, Wang C, Du H. The necroptosis-related lncRNA ENSG00000253385.1 promotes the progression of esophageal squamous cell carcinoma by targeting the miR-16-2-3p/VDAC1 axis. Sci Rep. 2025;15(1):2650. doi:10.1038/s41598-025-85646-3. [Google Scholar] [PubMed] [CrossRef]
22. Yin H, Duo H, Li S, Qin D, Xie L, Xiao Y, et al. Unlocking biological insights from differentially expressed genes: concepts, methods, and future perspectives. J Adv Res. 2024;76(1):135–57. doi:10.1016/j.jare.2024.12.004. [Google Scholar] [PubMed] [CrossRef]
23. Langfelder P, Horvath S. WGCNA: an R package for weighted correlation network analysis. BMC Bioinform. 2008;9(1):559. doi:10.1186/1471-2105-9-559. [Google Scholar] [PubMed] [CrossRef]
24. Chen G, Gou B, Du Y, Zhou Z, Bai Y, Yang Y, et al. Predicting the molecular mechanism of ginger targeting PRMT1/BTG2 axis to inhibit gastric cancer based on WGCNA and machine algorithms. Phytomedicine Int J Phytother Phytopharm. 2025;143:156892. doi:10.1016/j.phymed.2025.156892. [Google Scholar] [PubMed] [CrossRef]
25. Mu T, Hu H, Ma Y, Yang C, Feng X, Wang Y, et al. Identification of critical lncRNAs for milk fat metabolism in dairy cows using WGCNA and the construction of a ceRNAs network. Anim Genet. 2022;53(6):740–60. doi:10.1111/age.13249. [Google Scholar] [PubMed] [CrossRef]
26. Wu Z, Huang X, Cai M, Huang P, Guan Z. Novel necroptosis-related gene signature for predicting the prognosis of pancreatic adenocarcinoma. Aging. 2022;14(2):869–91. doi:10.18632/aging.203846. [Google Scholar] [PubMed] [CrossRef]
27. Hu B, Gao J, Shi J, Zhang F, Shi C, Wen P, et al. Necroptosis throws novel insights on patient classification and treatment strategies for hepatocellular carcinoma. Front Immunol. 2022;13:970117. doi:10.3389/fimmu.2022.970117. [Google Scholar] [PubMed] [CrossRef]
28. Chu F, Chen L, Guan Q, Chen Z, Ji Q, Ma Y, et al. Global burden of prostate cancer: age-period-cohort analysis from 1990 to 2021 and projections until 2040. World J Surg Oncol. 2025;23(1):98. doi:10.1186/s12957-025-03733-1. [Google Scholar] [PubMed] [CrossRef]
29. Yang L, Ruan Y, Xu H. HIST3H2A promotes the progression of prostate cancer through inhibiting cell necroptosis. BMC Cancer. 2024;24(1):544. doi:10.1186/s12885-024-12308-4. [Google Scholar] [PubMed] [CrossRef]
30. Lu Z, Wu C, Zhu M, Song W, Wang H, Wang J, et al. Ophiopogonin D’ induces RIPK1-dependent necroptosis in androgen-dependent LNCaP prostate cancer cells. Int J Oncol. 2020;56(2):439–47. doi:10.3892/ijo.2019.4945. [Google Scholar] [PubMed] [CrossRef]
31. Martens S, Bridelance J, Roelandt R, Vandenabeele P, Takahashi N. MLKL in cancer: more than a necroptosis regulator. Cell Death Differ. 2021;28(6):1757–72. doi:10.1038/s41418-021-00785-0. [Google Scholar] [PubMed] [CrossRef]
32. Wang KJ, Wang KY, Zhang HZ, Meng XY, Chen JF, Wang P, et al. Up-regulation of RIP3 alleviates prostate cancer progression by activation of RIP3/MLKL signaling pathway and induction of necroptosis. Front Oncol. 2020;10:1720. doi:10.3389/fonc.2020.01720. [Google Scholar] [PubMed] [CrossRef]
33. Zhang C, Zhang Y, Wang Y. Downregulated lncRNA LINC00908 correlates with a poor prognosis and increasing malignancy of gastric cancer. Pol J Pathol. 2024;75(2):157–65. doi:10.5114/pjp.2024.141283. [Google Scholar] [PubMed] [CrossRef]
34. Fan L, Li H, Zhang Y. LINC00908 negatively regulates microRNA-483-5p to increase TSPYL5 expression and inhibit the development of prostate cancer. Cancer Cell Int. 2020;20(1):10. doi:10.1186/s12935-019-1073-x. [Google Scholar] [CrossRef]
35. Wang Y, Wu S, Zhu X, Zhang L, Deng J, Li F, et al. LncRNA-encoded polypeptide ASRPS inhibits triple-negative breast cancer angiogenesis. J Exp Med. 2020;217(3):595. doi:10.1084/jem.20190950. [Google Scholar] [PubMed] [CrossRef]
36. Zhao J, Yang X, Gong W, Zhang L, Li C, Han X, et al. LINC00908 attenuates LUAD tumorigenesis through DEAD-box helicase 54. Am J Cancer Res. 2024;14(5):2371–89. doi:10.62347/HXZM6394. [Google Scholar] [PubMed] [CrossRef]
37. Guan H, Hu Q, Wan L, Wang C, Xue Y, Feng N, et al. LINC00908 inactivates wnt/beta-catenin signaling pathway to inhibit prostate cancer cell stemness via upregulating GSK3B and FBXW2. Cancer Med. 2025;14(9):e70887. doi:10.1002/cam4.70887. [Google Scholar] [PubMed] [CrossRef]
Cite This Article
 Copyright © 2026 The Author(s). Published by Tech Science Press.
This work is licensed under a Creative Commons Attribution 4.0 International License , which permits unrestricted use, distribution, and reproduction in any medium, provided the original work is properly cited.
 Downloads
 Citation Tools