
 Submit a Paper
 Propose a Special lssue
 Open Access
ARTICLE

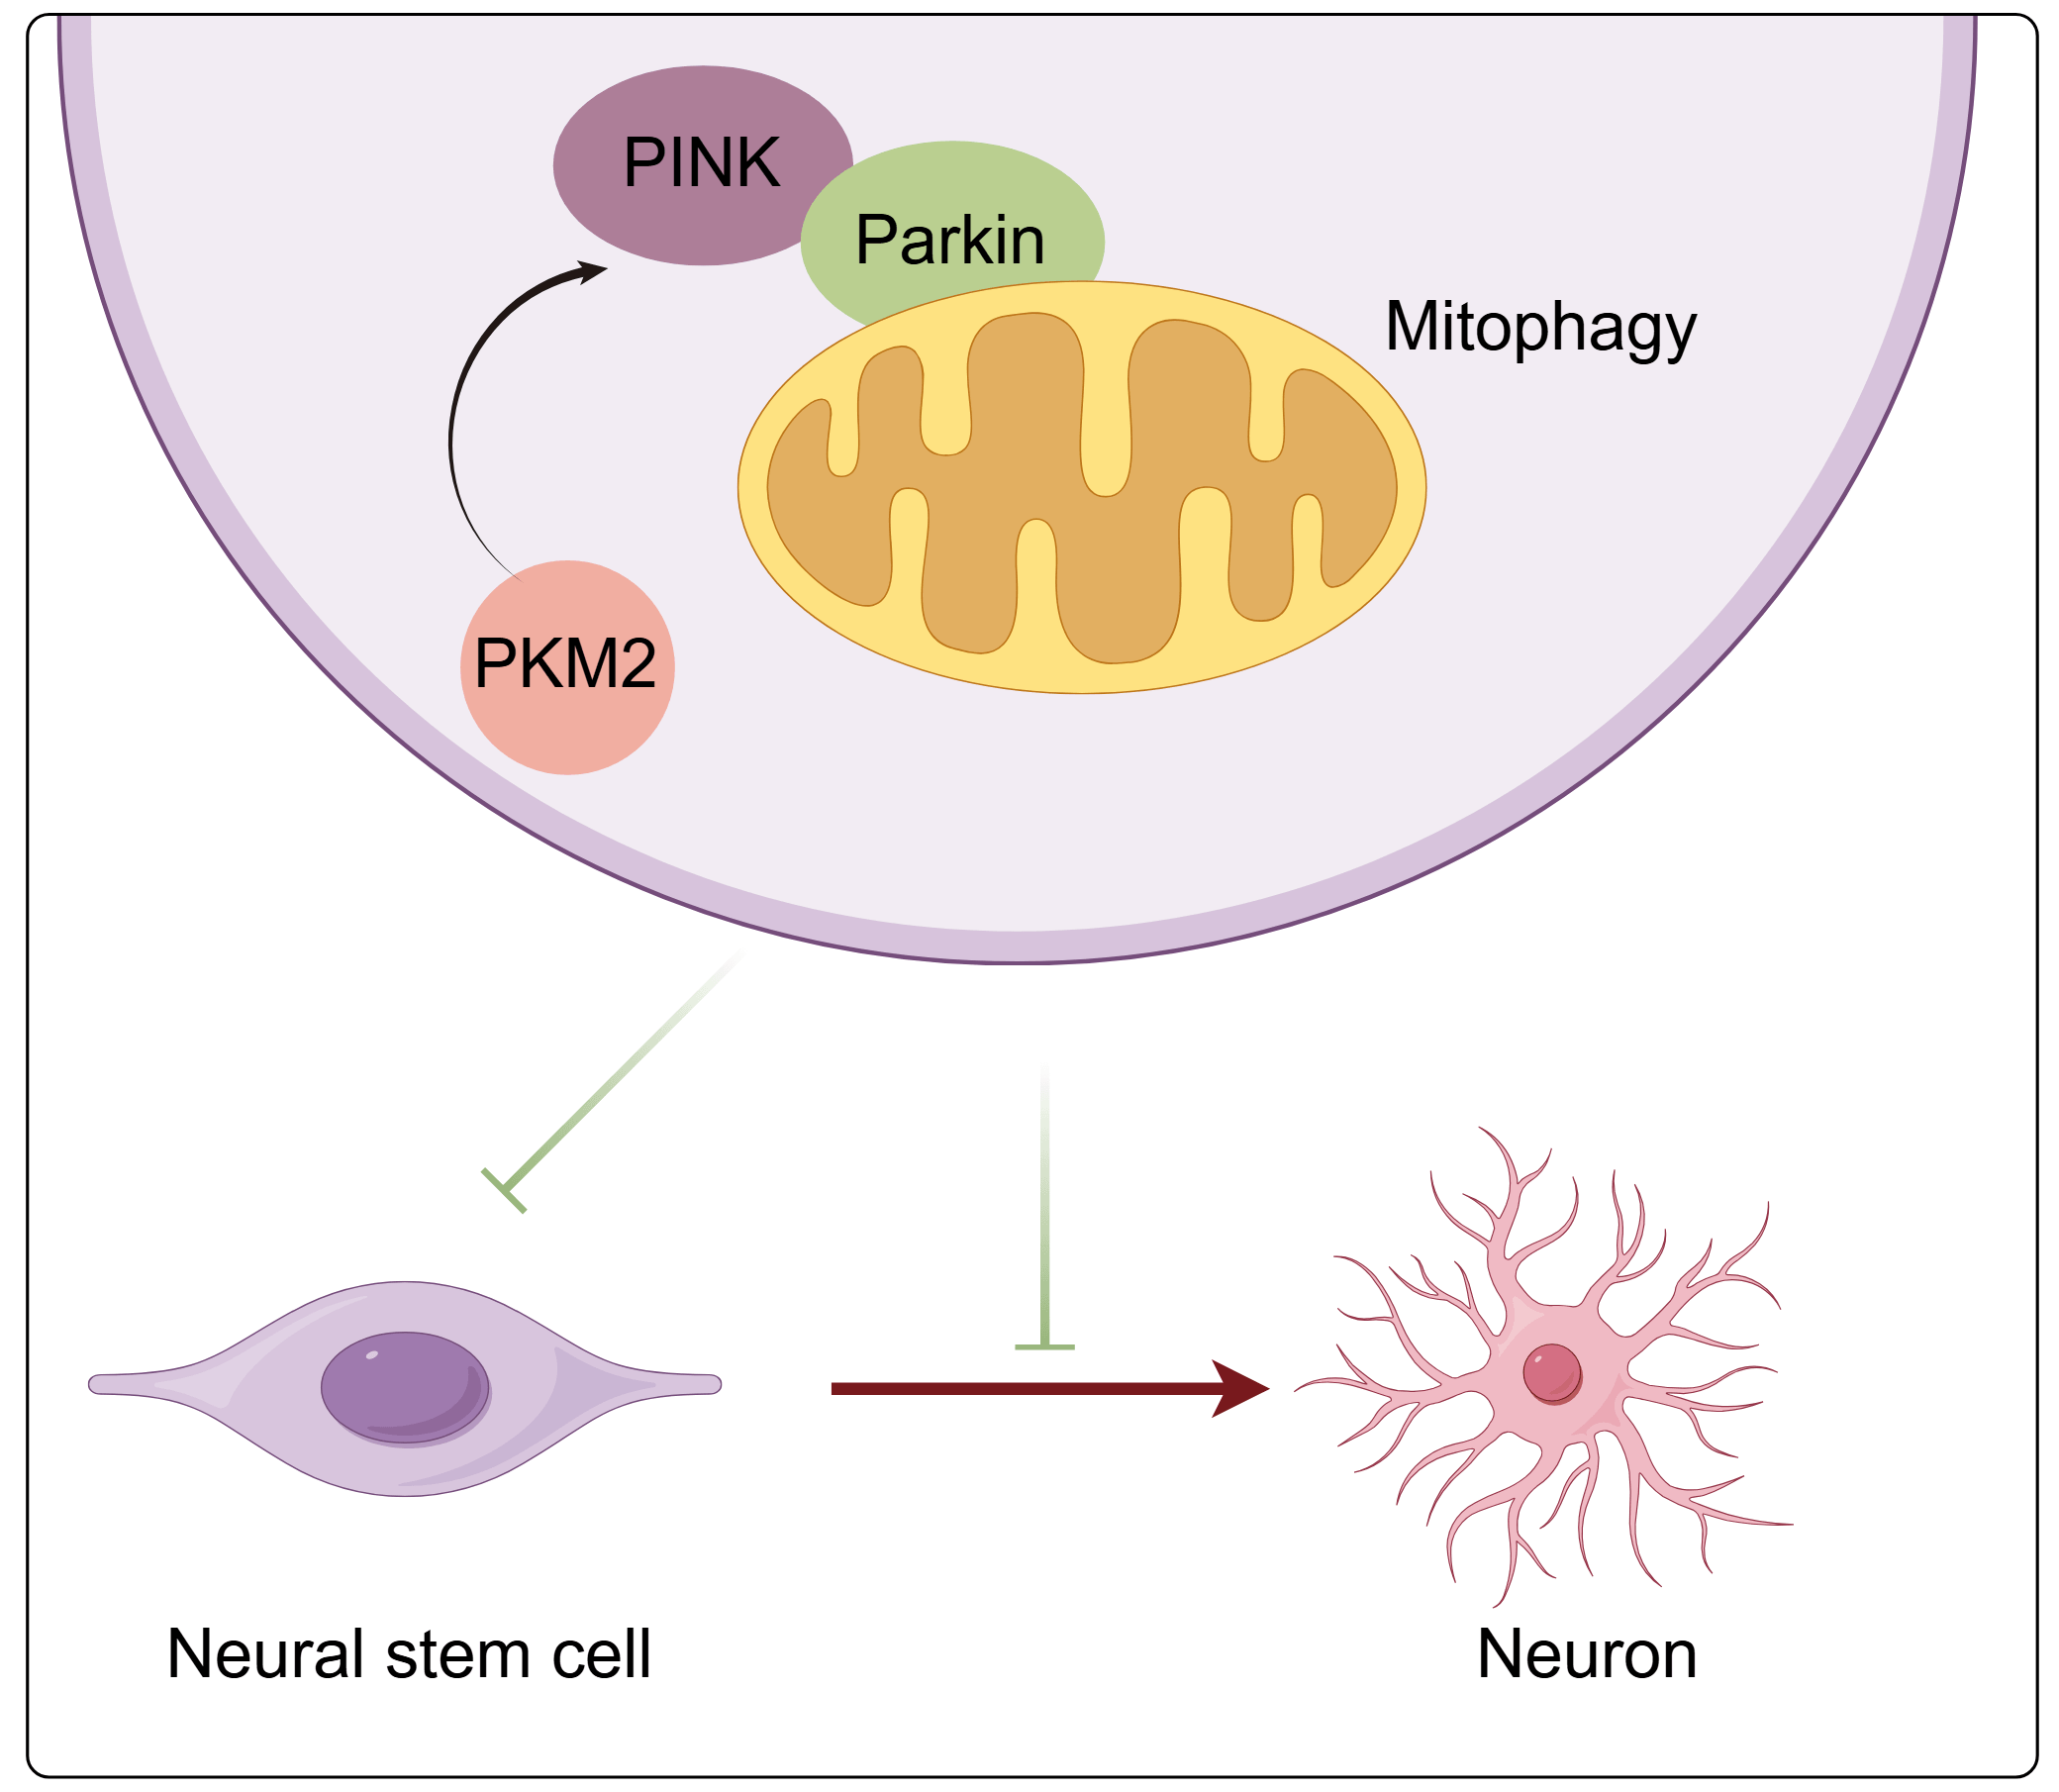
Knockdown of PKM2 Promotes Proliferation and Neuronal Differentiation of Neural Stem Cells by Inhibiting PINK1/Parkin-Mediated Excessive Mitophagy
Department of Neurosurgery, Xiangxi Tujia and Miao Autonomous Prefecture People’s Hospital, Xiangxi, China
* Corresponding Author: Yingjie Zhu. Email:
(This article belongs to the Special Issue: Homeostasis of Mitochondria: Unraveling its Multifaceted Role in Health and Disease)
BIOCELL 2026, 50(6), 7 https://doi.org/10.32604/biocell.2026.075319
Received 29 October 2025; Accepted 27 February 2026; Issue published 09 June 2026
 View Full Text
 Download PDF
Abstract
Objective: Neural stem cells (NSCs) are essential for replenishing nerve cells, providing neuroprotection, and repairing damaged brain function, while mitophagy is critical for maintaining NSCs’ homeostasis. The study investigated whether pyruvate kinase M2 (PKM2) regulates NSCs’ proliferation and differentiation by modulating mitophagy. Method: This study established a model of excessive autophagy in neural stem cell mitochondria induced by cobalt chloride (CoCl2) and used plasmid transfection technology to knock down PKM2 expression, examining its effects on NSCs proliferation and differentiation. Additionally, potential mechanisms were explored by overexpressing phosphatase and tensin homolog-induced putative kinase 1 (PINK1) and adding the mitophagy inducer carbonyl cyanide m-chlorophenyl hydrazone (CCCP). Result: Treatment with CoCl2 significantly inhibited the proliferation of NSCs and their differentiation into neurons, induced excessive mitophagy, and activated the PKM2/PINK1/Parkin pathway. Knockdown of PKM2 markedly enhanced cell viability, promoted NSCs’ proliferation, and neuronal differentiation. Mechanistically, PKM2 knockdown not only decreased the protein levels of PINK1, Parkin, p-Parkin, Beclin1, and LC3 II/I but also increased p62 expression, thereby mitigating excessive mitophagy. Overexpression of PINK1 attenuated the inhibitory effect of PKM2 knockdown on CoCl2-induced mitophagy in NSCs. Moreover, PKM2 knockdown significantly reversed the detrimental effects of CCCP on mitochondrial function, cell survival, and neuronal differentiation, further confirming that PKM2 promotes NSC proliferation and neuronal differentiation by inhibiting mitophagy. Conclusion: Knocking down PKM2 could inhibit PINK1/Parkin-mediated excessive mitophagy, thereby promoting NSCs proliferation and neuronal differentiation.Graphic Abstract
Keywords
Neural stem cells (NSCs) are undifferentiated cells with the dual potential for self-renewal and multilineage differentiation, capable of generating various neural cell types such as neurons, astrocytes, and oligodendrocytes [1,2]. NSCs play a crucial role in replenishing neural cells, providing neuroprotection [3], and repairing impaired brain function [4]. Previous studies have shown that NSC transplantation significantly improves cerebral infarction and neurological deficits in a middle cerebral artery occlusion model [5]. Therefore, exploring methods to enhance the activity of NSCs may hold great potential for neuroprotection.
Autophagy, as a cell-autonomous degradation mechanism, plays a pivotal role in the generation, maintenance, and self-renewal of both new neurons and NSCs [6]. It can finely regulate the homeostasis of NSCs and ensure their programmed cell death under long-term injury stimulation [7]. Relevant studies have revealed that in ischemic brain environments, pharmacologically activated autophagy can impair the functions of NSCs and produce a delayed effect on the recovery process of the ischemic brain [8]. Mitophagy, a special form of cellular autophagy, constitutes one of the core mechanisms of mitochondrial quality control and is closely linked to physiological activities such as cell proliferation, differentiation, and migration [9]. Damaged or dysfunctional mitochondria are often selectively degraded via mitophagy pathways mediated by phosphatase and tensin homolog-induced putative kinase 1 (PINK1)/Parkin [10]. The degradation of mitochondria and the induction of programmed cell apoptosis are crucial for the physiological processes of cell differentiation and proliferation [11]. Therefore, key molecules that regulate the process of mitophagy may become potential targets for improving the proliferation and differentiation of NSCs.
Pyruvate kinase M2 (PKM2), a crucial glycolytic enzyme, plays a significant role in regulating cellular metabolism and growth [12]. It is found in embryonic cells, adult stem cells, and cancer cells [13]. Typically, PKM2 expression is low in neural progenitor cells of the subventricular zone, hippocampus, and cerebellum under normal conditions [14]. However, its levels increase under pathological conditions [15]. Inhibition of PKM2 can lead to cell death in tumor cells through the disruption of protein kinase B (AKT) signaling [16]. In non-cancerous contexts, PKM2 contributes to hypoxia-ischemia-induced neuronal apoptosis [17]. Its reduction can decrease the levels of pro-apoptotic proteins and increase phosphorylated AKT levels, suggesting that PKM2 influences cellular function by regulating apoptosis- and survival-related signaling pathways [17]. Moreover, silencing PKM2 inhibits PINK1/Parkin-mediated mitophagy [18]. However, whether PKM2 can influence NSCs’ proliferation and differentiation by regulating mitophagy in NSCs remains unclear.
Based on the background mentioned above, we hypothesize that the knockdown of PKM2 could inhibit PINK1/Parkin-mediated excessive mitophagy in NSCs, thereby promoting the proliferation and differentiation of NSCs into neurons. To test this hypothesis, we established a model of excessive mitophagy in NSCs induced by cobalt chloride (CoCl2). The potential mechanism was explored by knocking down PKM2, overexpressing PINK1, and adding mitochondrial autophagy inducer carbonyl cyanide m-chlorophenyl hydrazone (CCCP). Our study aims to shed light on the regulatory processes governing neural stem cell (NSC) activity and could potentially uncover novel therapeutic targets for neurological disorders.
2.1 Isolation and Cultivation of NSCs [19]
A total of 60 C57BL/6 mice (8 weeks old, weighing 20–25 g) were purchased from Hunan Slake Jingda Experimental Animal Co., Ltd. (Changsha, China) and used to generate timed-pregnant dams in our facility. Primary cultures of NSCs were then isolated from the cerebral cortex of embryonic day 14 (E14) mice. To obtain embryos at this precise developmental stage, female mice (n = 30) were subjected to timed mating. The presence of a vaginal plug was designated as E0.5. Pregnant dams were acclimatized until E14. On the day of isolation, the pregnant female mice were anesthetized using 5% isoflurane in 100% O2, and the abdominal surface was sanitized with 70% ethanol prior to the surgical procedure. The uterus was excised and placed in Leibowitz L-15 dissection medium (cat.no.11415-09, Invitrogen, Carlsbad, CA, USA) on ice. Embryos were removed from the uterus and placed in Leibowitz L-15 dissection medium. Under a dissection microscope (Leica MZ6, Leica Microsystems GmbH, Wetzlar, Hesse, Germany), the skull and meninges were carefully removed to expose the brain. The cerebral cortex was cut longitudinally to expose the ganglionic eminences. The lateral and medial ganglionic eminences were washed and incubated in DMEM/F12 medium (iCell-0005, MiracleCell, Shanghai, China) supplemented with N2 (17502-048, Invitrogen), 0.6% glucose (G8769, Sigma-Aldrich, St. Louis, MO, USA), 2 mM glutamax (35050-038, Invitrogen), 1.125% sodium bicarbonate (25080-060, Invitrogen), 15 mM HEPES (15630-056, Invitrogen), and 0.05 mg/mL gentamicin (15710-080, Invitrogen) at 37°C for 15 min. The tissue was then triturated to create a single cell suspension, which was counted and plated in uncoated culture flasks at a density of 10–50 cells/μL in DMEM/F12 medium supplemented with 2% B27 supplement (HY-K3013, MCE, Monmouth Junction, NJ, USA), 20 ng/mL basic fibroblast growth factor (HY-P5321, MCE), 20 ng/mL epidermal growth factor (HY-P7067, MCE), and 1% penicillin/streptomycin. Cells were cultured at 37°C with 5% CO2, and the medium was changed twice a week. After 7 days of culture, the cells were passaged at a 1:2 ratio using Accutase (A6964, Sigma-Aldrich).
All experimental procedures and animal handling were performed with the approval of the Animal Care and Use Committee of the Xiangxi Tujia and Miao Autonomous Prefecture People’s Hospital (No. EC-LCKY2025055), in accordance with the National Institutes of Health Guide for the Care and Use of Laboratory Animals, and studies involving laboratory animals follow the ARRIVE guidelines.
The plasmids si-NC, si-PKM2 (HG-Si206796), oe-NC, and oe-PINK (HG-HO032409) were obtained from HonorGene (Changsha, China). The si-PKM2#1 sequence was 5′-GTTCGGAGGTTTGATGAAATC-3′. The si-PKM2#2 sequence was 5′-GCCCGAGGCTTCTTCAAGAAG-3′. The siRNA NC sequence was 5′-ACGTGACACGTTCGGAGAATT-3′. 5 μg of each plasmid and 5 μL of Lipofectamine 2000 (11668019, Invitrogen) were separately added to two sterile centrifuge tubes containing 95 μL of serum-free medium. The mixtures were gently vortexed and allowed to incubate at room temperature for 20 min. Subsequently, the contents of the two tubes were combined and incubated at room temperature for an additional 20 min to form the transfection complexes. These complexes were then transferred to the wells containing the cells and incubated for 6 h to facilitate transfection. Following this incubation period, the cells were maintained in a complete growth medium for further culture.
2.3 Cell Grouping and Processing
NSCs were divided into seven groups: control group, CoCl2 group, CoCl2+si-NC group, CoCl2+si-PKM2 group, CoCl2+si-PKM2+oe-NC group, CoCl2+si-PKM2+oe-PINK group, and CoCl2+si-PKM2+CCCP group. Cells in the control group were cultured under normal conditions. In the CoCl2 group, to simulate the effects of hypoxic conditions on NSCs, NSCs were cultured in a medium containing 200 μM CoCl2 (cat. no. 618519, Sigma-Aldrich) for 24 h [20]. In the CoCl2+si-NC, CoCl2+si-PKM2, CoCl2+si-PKM2+oe-NC, and CoCl2+si-PKM2+oe-PINK groups, cells were transfected with the corresponding plasmids and then treated with 200 μM CoCl2 for 24 h. In the CoCl2+si-PKM2+CCCP group, after transfection with si-PKM2, NSCs were treated with 200 μM CoCl2 for 24 h, followed by treatment with 10 μM CCCP for an additional 6 h [21].
2.4 Immunofluorescence Staining
NSCs were initially identified by immunostaining with Nestin, a specific marker for NSCs. To further evaluate the proliferative capacity of NSCs, individual NSCs were seeded onto poly-d-lysine-coated culture plates. After 24 h, the culture medium was replaced with a solution containing 10 μM 5-bromo-2′-deoxyuridine (BrdU), and the cells were cultured for an additional 48 h. Subsequently, cells were subjected to dual immunostaining for Nestin and BrdU to determine the proliferative status of NSCs.
For spontaneous differentiation, cells were cultured in DMEM/F12 medium supplemented with 1% fetal bovine serum for 7 days. Cells were fixed with 4% paraformaldehyde (BL539A, Biosharp, Hefei, China) for 30 min and permeabilized with 0.3% Triton X-100 (P0096, Beyotime, Shanghai, China) at 37°C for 30 min. Cells were then blocked with 5% phosphate-buffered saline (PBS)-bovine serum albumin (BSA) solution at 37°C for 60 min. Specific primary antibodies targeting neuronal nuclei (NeuN, a neuronal-specific marker), glial fibrillary acidic protein (GFAP, an astrocyte-specific marker), and oligodendrocyte transcription factor 2 (Olig2, an oligodendrocyte-specific marker) were added and incubated overnight at 4°C. Secondary antibodies were incubated at 37°C for 60 min. The details of the related antibodies are presented in Table 1. Nuclei were stained with DAPI staining solution (AWC0293a, Abiowell, Changsha, China). Each step was followed by washing with PBS. Images were captured using a Motic BA210T microscope (Xiamen, China).
Table 1: The information about antibodies used for immunofluorescence.
| Name | Dilution Rate | Cat Number | Company | Country |
|---|---|---|---|---|
| Nestin | 1:100 | ab6142 | Abcam | UK |
| BrdU | 1:150 | 66241-1-Ig | Proteintech | USA |
| NeuN | 1:100 | AWA10318 | Abiowell | China |
| GFAP | 1:100 | 60190-1-Ig | Proteintech | USA |
| Olig2 | 1:250 | AWA10396 | Proteintech | USA |
| CoraLite488-goat anti-rabbit IgG | 1:1000 | SA00013-2 | Proteintech | USA |
| CoraLite488-goat anti-mouse IgG | 1:1000 | SA00013-3 | Proteintech | USA |
2.5 Cell Counting Kit-8 (CCK-8)
NSCs were seeded into 24-well plates at 5 × 10³ cells per well. A 20% CCK-8 solution (NU679, Dojindo, Kumamoto, Japan) was added, and cells were incubated for 4 h. Cell viability was determined by measuring the absorbance (OD) at 450 nm using a multifunctional microplate reader (MB-530, HuiSong, Shenzhen, China). To determine the optimal concentration of CoCl2 for inducing hypoxia in NSCs, we treated NSCs with a series of concentrations of CoCl2 at 2.3437, 4.6875, 9.375, 18.75, 37.5, 75, 150, 300, 600, and 1200 μM. The IC50 value was calculated using nonlinear regression analysis with GraphPad Prism software (version 8.0, GraphPad Software, San Diego, CA, USA).
2.6 5-Ethynyl-2′-Deoxyuridine (EdU) Detection
The proliferative capacity of NSCs was assessed using the EdU detection kit (C10310, RiboBio, Guangzhou, China). EdU solution (50 μM) was added to cells for overnight incubation. Cells were then fixed with 4% paraformaldehyde, treated with permeabilizing agents, and stained with 1× Apollo® solution for 30 min in the dark. Finally, cells were stained with 1× Hoechst 33342 for 30 min in the dark, and imaged under a fluorescence microscope.
Cells were lysed using a lysis buffer (P0013B, Beyotime) to extract total protein. Using the BCA method (P0012, Beyotime), we quantified protein levels according to the standard protocol. Aliquots containing 20 μg of protein were loaded onto 10% polyacrylamide gels. The protein samples were then separated by SDS-PAGE and transferred onto a nitrocellulose membrane. The membrane was blocked with a TBST solution containing 5% skim milk at room temperature for 1 h, followed by incubation with specific primary antibodies overnight at 4°C. The next day, the corresponding secondary antibodies were applied and incubated at room temperature for 1.5 h. After each step, the membrane was washed three times with TBST for 5 min each time. Table 2 provides relevant information regarding the antibodies. Finally, the membrane was developed using an ECL substrate (K-12045-D50, Advansta, San Jose, CA, USA), and the protein bands were analyzed using a chemiluminescence imaging system and ImageJ software (Version 1.53t; National Institutes of Health, Bethesda, MD, USA) to quantify the band intensity. Western blot analyses were performed with at least three independent experiments. Each experiment was conducted using protein extracts from cells that were cultured, treated, and harvested independently.
Table 2: The information about the antibodies used for the Western blot.
| Name | Dilution Rate | Cat Number | Company | Country |
|---|---|---|---|---|
| HIF-1α | 1:2000 | AWA03079 | Abiowell | China |
| NeuN | 1:5000 | AWA10318 | Abiowell | China |
| GFAP | 1:10,000 | ab7260 | Abcam | UK |
| p62 | 1:10,000 | 66184-1-Ig | Proteintech | USA |
| PKM2 | 1:2000 | 15822-1-AP | Proteintech | USA |
| PKM1 | 1:2000 | 10078-2-AP | Proteintech | USA |
| PINK1 | 1:1000 | ab216144 | Abcam | UK |
| Parkin | 1:1000 | AWA41194 | Abiowell | China |
| p-Parkin | 1:1000 | PA1-4735 | Thermo Fisher | USA |
| Beclin1 | 1:2000 | 11306-1-AP | Proteintech | USA |
| LC3 | 1:3000 | 14600-1-AP | Proteintech | USA |
| β-actin | 1:5000 | 66009-1-Ig | Proteintech | USA |
| HRP goat anti-mouse IgG | 1:5000 | SA00001-1 | Proteintech | USA |
| HRP goat anti-rabbit IgG | 1:6000 | SA00001-2 | Proteintech | USA |
2.8 Mitochondrial Reactive Oxygen Species (ROS) Detection
The 1.1 mM Mito-Tracker Green stock solution (C1048, Beyotime) was diluted at a ratio of 1:5000 in the cell culture medium to achieve a final concentration of 200 nM. After removing the cell culture medium, the 37°C pre-warmed Mito-Tracker Green staining working solution was added and co-incubated with the cells for 15 min. Subsequently, the staining solution was removed, and the cells were washed once with 0.01M PBS (pH 7.4). Finally, the cells were analyzed using a flow cytometer (A00-1-1102, Beckman, Suzhou, China).
2.9 Evaluation of Mitochondrial Membrane Potential (MMP) by 5,5′,6,6′-Tetrachloro-1,1′,3,3′-Tetraethylbenzimidazolylcarbocyanine Iodide (JC-1) Staining
The MMP detection kit was purchased from Beyotime (C2006). The JC-1 staining stock solution (200×) was diluted to prepare the working solution. Cells were collected and washed twice with 0.01M PBS (pH 7.4), followed by the addition of the JC-1 staining working solution. The cells were then incubated in the dark at 37°C in a cell culture incubator for 20 min. Subsequently, the cells were washed 2–3 times with JC-1 staining buffer. The fluorescence signals of JC-1 were detected using a flow cytometer. The ratio of red fluorescence (aggregates) to green fluorescence (monomers) reflects the changes in MMP.
2.10 Determination of Cellular Adenosine Triphosphate (ATP) Levels
The ATP levels in cells were measured using an ATP assay kit (A095-1-1, Nanjing Jiancheng Bioengineering Institute, China) according to the manufacturer’s instructions. The OD was measured at 636 nm using a multifunctional microplate reader.
2.11 Transmission Electron Microscopy (TEM)
NSCs were initially fixed with 2.5% glutaraldehyde (AWI0097, Abiowell) and subsequently post-fixed with 1% osmium tetroxide (AWI0136, Abiowell). Dehydration was carried out using a graded series of acetone solutions with the following concentration gradient: 30%, 50%, 70%, 80%, 90%, 95%, 100%. The dehydrated samples were then infiltrated with Epon-812 embedding medium (Beijing Zhongjing Keyi Technology Co., Ltd., GS02659) in a stepwise manner at ratios of 3:1, 1:1, and 1:3 (dehydrating agent to embedding agent), followed by embedding in pure Epon-812. Ultrathin sections (60–90 nm) were prepared using an ultramicrotome (Leica UC-7, Leica Microsystems GmbH) and mounted on copper grids. Finally, images were captured using a transmission electron microscope (JEM-1400FLASH, JEOL, Tokyo, Japan).
2.12 Quantitative PCR (qPCR) Detection
Cells were lysed with 1 mL Trizol reagent (15596026, Invitrogen) and incubated for 3 min at room temperature. After adding 200 μL chloroform and shaking for 15 s, the mixture was centrifuged at 12,000 rpm for 15 min at 4°C using a benchtop refrigerated centrifuge (H1650R, Hunan Xiangyi Laboratory Instrument Development Co., Ltd., Changsha, China). The upper aqueous phase was transferred to a new RNase-free tube, and an equal volume of isopropanol was added, followed by incubation for 10 min at room temperature. The RNA pellet was collected by centrifugation at 12,000 rpm for 10 min at 4°C, washed with 75% ethanol, and dried before resuspension in 20–30 μL RNase-free water. RNA concentration and purity were determined by UV spectrophotometry (UV-6100S, Mapada, Shanghai, China) at 260 nm and 280 nm.
For reverse transcription, RNA (1 μg) was processed following the protocol of the mRNA Reverse Transcription Kit (CW2569, Cowin Biotech, Taizhou, China) to remove genomic DNA and synthesize first-strand cDNA. The synthesized cDNA was amplified quantitatively via PCR with UltraSYBR Master Mix (CW2601, CWBIO). Amplification was carried out under the following cycling protocol: 95°C for 10 min; 40 cycles of 95°C for 15 s and 60°C for 30 s. The primers (Table 3) were synthesized by Beijing Tsingke Biotech Co., Ltd. (China), and quantitative detection was performed using a fluorescent quantitative PCR instrument (QuantStudio 1, ABI, Thermo Fisher, Foster City, CA, USA). β-Actin was used as a reference gene, and the expression levels of target genes were calculated using the 2−ΔΔCt method. The mRNA level of COX1 was used as an indicator of mitochondrial DNA (mtDNA) copy number.
Table 3: Primer sequences for qPCR amplification.
| Gene | Sequence (5′-3′) |
|---|---|
| PKM2-F | GGCTCCTATCATTGCCGTGAC |
| PKM2-R | ATTCAGCACGGCATCCTTACACA |
| COX1-F | CCACTTCGCCATCATATTCGTAGG |
| COX1-R | TCTGAGTAGCGTCGTGGTATTCC |
| β-actin-F | ACATCCGTAAAGACCTCTATGCC |
| β-actin-R | TACTCCTGCTTGCTGATCCAC |
2.13 Immunofluorescence Co-Localization of Microtubule-Associated Protein 1A/1B-Light Chain 3 (LC3) and Translocase of Outer Mitochondrial Membrane 20 (TOM20)
NSCs grown on coverslips were fixed with 4% paraformaldehyde for 30 min and permeabilized with 0.3% Triton X-100 for 30 min at 37°C. After blocking with 5% BSA for 1 h at 37°C, samples were incubated overnight at 4°C with primary antibodies against TOM20 (AWA10405, Abiowell; 1:300) and LC3 (AWA10125, Abiowell; 1:300). Following incubation with an HRP-conjugated secondary antibody for 30 min at 37°C, tyramide signal amplification (TSA) was performed using the TSA-520 reagent (AWI0693a, Abiowell) for 10 min to label TOM20 with green fluorescence. To enable sequential staining for LC3, the primary-secondary antibody complexes were removed by treating the coverslips with antibody elution buffer twice (10 min each at 37°C). Residual HRP activity was quenched with 3% H2O2 for 15 min. After re-blocking with 5% BSA, samples were incubated overnight at 4°C with the LC3 antibody, followed by incubation with HRP-conjugated secondary antibody and the TSA-620 reagent (AWI0693a, Abiowell) for 10 min to label LC3 with red fluorescence. Finally, nuclei were stained with DAPI for 10 min at 37°C. The coverslips were mounted and imaged using a Motic BA210T microscope.
2.14 Mitochondrial Autophagy Analysis by Mitochondria-Targeted Keima (mt-Keima) Transfection [22]
NSCs were seeded onto coverslips placed in 6-well plates at a density of 2 × 10⁵ cells per well and cultured overnight to reach 30–50% confluence prior to transfection. The mt-Keima-COX8 lentivirus (LV01230-2a, Public Protein/Plasmid Library, Nanjing, China) was thawed on ice and diluted in serum-free medium supplemented with 8 μg/mL Polybrene (P1501912, Aladdin, Shanghai, China). The multiplicity of infection was optimized for NSCs based on preliminary titration experiments. After removing the culture medium, cells were gently washed with PBS and incubated with 1 mL of the virus-Polybrene mixture per well for 5 h at 37°C in a 5% CO2 incubator. Subsequently, Cells were cultured for 48 h with fresh complete medium. Following experimental treatments as per the designated groups, cells were imaged live using a Motic BA210T microscope. Green fluorescence (ex485 nm) indicates mt-Keima within normal mitochondria, while red fluorescence (ex561 nm) indicates mt-Keima within acidic lysosomes.
Data analysis was performed using GraphPad Prism software with results presented as mean ± standard deviation (SD). Before statistical analysis, all data were tested for normality and confirmed to follow a normal distribution. Comparisons between two groups were performed using unpaired Student’s t-tests. For comparisons involving multiple groups, one-way analysis of variance (ANOVA) was conducted, followed by Tukey’s post hoc test. A p-value of less than 0.05 was considered to indicate statistical significance.
3.1 CoCl2 Inhibited NSCs’ Proliferation and Neuronal Differentiation
This study first identified NSCs and evaluated their activity. The identification of NSCs was achieved through immunofluorescence detection of the marker Nestin, with results showing positive expression of Nestin, indicating that the cultured cells possessed the characteristics of NSCs (Fig. A1A). Subsequently, the proliferative capacity of NSCs was evaluated using the BrdU labeling method, revealing a high proportion of BrdU-positive cells, which demonstrated that the isolated NSCs had robust proliferative activity (Fig. A1B). Furthermore, immunofluorescence detection revealed positive expression of NeuN, GFAP, and Olig2 in NSCs after 7 days of spontaneous differentiation, indicating that our isolated and cultured NSCs have the normal potential to differentiate into neurons, astrocytes, and oligodendrocytes (Fig. A1C).
To determine the optimal concentration of CoCl2 for inducing pseudo-hypoxia in NSCs, a dose-response experiment was conducted. Cells were treated with a range of CoCl2 concentrations. Cell viability was assessed using the CCK-8 assay to determine the IC50 value. The results indicated that the IC50 value was approximately 215.6 μM (Fig. 1A). Then, cells were treated with varying concentrations of CoCl2, and HIF-1α expression was assessed using Western blot analysis. The results demonstrated a dose-dependent increase in HIF-1α expression, indicating that CoCl2 simulates pseudo-hypoxic stress by stabilizing HIF-1α protein levels (Fig. 1B). Based on these findings, a concentration of 200 μM CoCl2 was selected for subsequent experiments. Subsequently, we investigated the effects of CoCl2 induction on the activity, proliferation, and differentiation of NSCs. The results of the CCK-8 assay indicated that CoCl2 treatment significantly reduced cell viability, suggesting that CoCl2 had an inhibitory effect on the proliferation of NSCs (Fig. 1C). The EdU assay further confirmed the inhibitory effect of CoCl2 on NSC proliferation, with a significantly lower proportion of EdU-positive cells in the CoCl2 group compared to the control group (Fig. 1D). Dual-immunofluorescence staining demonstrated that the proportion of NeuN-positive cells decreased while the proportion of GFAP-positive cells increased in the CoCl2 group (Fig. 1E). This suggested that CoCl2 inhibited the differentiation of NSCs into neurons and instead promoted their differentiation into astrocytes. Western blot analysis showed that the expression of NeuN was significantly lower in the CoCl2 group than in the control group, whereas the expression of GFAP was significantly higher, further confirming the influence of CoCl2 on the differentiation direction of NSCs (Fig. 1F). In summary, CoCl2 inhibited the proliferation and neuronal differentiation of NSCs and promoted their differentiation into astrocytes.

Figure 1: CoCl2 inhibited NSCs’ proliferation and neuronal differentiation. (A) Viability of NSCs treated with various concentrations of CoCl2 for 24 h was measured using the CCK-8 assay. (B) HIF-1α protein expression in NSCs treated with increasing concentrations of CoCl2 (50, 100, 150, and 200 μM) for 24 h. (C) Viability of NSCs treated with 200 μM CoCl2 for 24 h was measured using the CCK-8 assay. (D) The proliferative activity of NSCs was measured using the EdU assay. Scale bar: 50 μm. (E) The expression of NeuN and GFAP was measured by dual immunofluorescence staining. Scale bar: 25 μm. (F) Protein levels of NeuN and GFAP in NSCs. Data are presented as the mean ± SD from three independent samples (n = 3). ***p < 0.001, ****p < 0.0001.
3.2 CoCl2 Induced Excessive Mitophagy in NSCs
Subsequently, we investigated the effects of CoCl2 on mitophagy in NSCs, aiming to establish a cellular model that simulates excessive mitophagy in NSCs under hypoxic conditions and to elucidate the underlying molecular mechanisms. Flow cytometry analysis revealed a marked elevation in mitochondrial ROS levels in the CoCl2 group, indicating that CoCl2 induced the accumulation of mitochondrial reactive oxygen species (Fig. 2A). JC-1 staining further confirmed the decrease in MMP in the CoCl2 group, suggesting that CoCl2 induced mitochondrial dysfunction (Fig. 2B). Additionally, the significant reduction in ATP levels within the CoCl2-treated cells indicated the inhibition of mitochondrial energy metabolism (Fig. 2C). Transmission electron microscope observations revealed mitochondrial membranes swelling, a reduced number of mitochondrial cristae, and an increased number of autophagosomes in the CoCl2 group, providing ultrastructural evidence for CoCl2-induced mitophagy (Fig. 2D). qPCR results showed that the mtDNA copy number in the CoCl2 group was significantly lower than that in the control group, indicating that excessive activation of mitophagy led to mitochondrial degradation exceeding its self-replication capacity (Fig. 2E). Additionally, immunofluorescence staining showed a significant increase in the co-localization of LC3 with the mitochondrial marker TOM20 in the CoCl2 group (Fig. 2F). This indicated that LC3 is recruited to the mitochondria during CoCl2-induced mitophagy. Meanwhile, we transfected the mt-Keima plasmid into NSCs and measured mitophagic flux under CoCl2 treatment. Results showed that CoCl2 treatment significantly increased the ratio of red to green areas representing mitophagy (Fig. 2G).
Moreover, Western blot analysis (Fig. 2H) demonstrated that CoCl2 treatment significantly upregulated the expression of PKM2 and activated the PINK1/Parkin signaling pathway, recruiting downstream autophagy-related proteins Beclin1 and microtubule-associated protein 1 light chain 3 beta isoform II (LC3II), thereby initiating the mitophagy process. Meanwhile, the expression of sequestosome 1 (p62) was downregulated. In summary, CoCl2 induced excessive mitophagy in NSCs, accompanied by upregulation of PKM2 expression and activation of the PINK1/Parkin signaling pathway, successfully establishing a model of excessive mitophagy in NSCs.

Figure 2: CoCl2 induced excessive mitophagy in NSCs. (A) Mitochondrial ROS levels in NSCs. (B) MMP in NSCs. (C) ATP levels in NSCs. (D) TEM was used to observe mitochondrial morphology and relatively quantify the number of autophagosomes. Red arrows indicate autophagosomes. Scale bar: 2 μm (100×); 500 nm (400×). (E) The mtDNA copy number was quantified by qPCR. (F) Co-localization of LC3 and TOM20 was measured by dual immunofluorescence staining. Scale bar: 25 μm. (G) Mitophagy as determined by mt-Keima transfection. The mitophagy ratios were calculated as the ratio of red to green fluorescence intensity. Scale bar: 25 μm. (H) Levels of PKM2 and autophagy-related proteins (p62, PINK1, Parkin, p-Parkin, Beclin1, LC3II/I) in NSCs. Data are presented as the mean ± SD from three independent samples (n = 3). *p < 0.05, **p < 0.01, ***p < 0.001, ****p < 0.0001.
3.3 Downregulation of PKM2 Promoted NSCs Proliferation and Neuronal Differentiation
This study utilized siRNA to suppress PKM2 expression in NSCs to investigate its impact on proliferation and neural differentiation. Subsequent analysis revealed a marked decrease in PKM2 levels in both si-PKM2#1 and si-PKM2#2 groups relative to the control, indicating effective gene knockdown (Fig. 3A). qPCR and Western blot analyses demonstrated that, compared to the CoCl2+si-NC group, both the mRNA and protein levels of PKM2 were significantly reduced in the CoCl2+si-PKM2 group (Fig. 3B). In contrast, the expression of PKM1, another pyruvate kinase isoform, did not differ significantly between the two groups (Fig. 3B). Additionally, HIF-1α expression was upregulated in the CoCl2 group but was significantly reduced in the CoCl2+si-PKM2 group (Fig. 3B). Together, these data demonstrated efficient and specific knockdown of PKM2 without compensatory PKM1 upregulation. A concomitant reduction in HIF-1α protein level was also confirmed.
In the experiments examining the effects of PKM2 knockdown on the proliferation and differentiation of NSCs, the CCK-8 assay revealed a significant increase in cell viability in the CoCl2+si-PKM2 group (Fig. 3C). The EdU assay observed an increased proportion of EdU-positive cells (Fig. 3D). These results demonstrated the promoting effect of PKM2 knockdown on the proliferation of NSCs. Immunofluorescence detection showed that the proportion of NeuN-positive cells decreased while the proportion of GFAP-positive cells increased in the CoCl2 group (Fig. 3E). After PKM2 knockdown, the proportion of NeuN-positive cells increased, and the proportion of GFAP-positive cells decreased (Fig. 3E). Western blot analysis also revealed that compared to the CoCl2+si-NC group, the expression of NeuN increased and the expression of GFAP decreased in the CoCl2+si-PKM2 group (Fig. 3F). These findings confirmed that PKM2 knockdown promoted the differentiation of NSCs into neurons and inhibited their differentiation into astrocytes.
Western blot further examined the expression of autophagy-related proteins (Fig. 3G). Compared to the CoCl2+si-NC group, the expression levels of PINK1, Parkin, p-Parkin, Beclin1, and LC3II/I were decreased, while the expression level of p62 was increased in the CoCl2+si-PKM2 group. This indicated that PKM2 knockdown inhibited the expression of autophagy-related proteins induced by CoCl2. In summary, the knockdown of PKM2 promoted the proliferation and neuronal differentiation of NSCs, inhibited astrocytic differentiation, and downregulated the expression of autophagy-related proteins. Its effects on NSCs may be associated with the regulation of the PINK1/Parkin signaling pathway.

Figure 3: Downregulation of PKM2 promoted NSCs’ proliferation and neuronal differentiation. (A) The expression of PKM2 in NSCs was analyzed by qPCR and Western blot. (B) The expression of PKM2, PKM1, and HIF-1α in NSCs was analyzed by qPCR and Western blot. (C) Viability of NSCs was measured using the CCK-8 assay. (D) The proliferative activity of NSCs was measured using the EdU assay. Scale bar: 50 μm. (E) The expression of NeuN and GFAP was measured by dual immunofluorescence staining. Scale bar: 25 μm. (F) Protein levels of NeuN and GFAP in NSCs. (G) Levels of autophagy-related proteins (p62, PINK1, Parkin, p-Parkin, Beclin1, LC3II/I) in NSCs. Data are presented as the mean ± SD from three independent samples (n = 3). **p < 0.01, ***p < 0.001, ****p < 0.0001.
3.4 Downregulation of PKM2 Alleviated CoCl2-Induced Mitophagy in NSCs by Inhibiting the PINK1/Parkin Pathway
In order to investigate the mechanism of PKM2 in CoCl2-induced mitophagy in NSCs, we added an experimental group overexpressing PINK1 and its negative control on the basis of PKM2 knockdown. Western blot analysis (Fig. 4A) revealed that CoCl2 treatment significantly upregulated the expression of PKM2, while PKM2 knockdown effectively reduced its expression. Overexpression of PINK1 and its negative control had minimal impact on the expression levels of PKM2. Meanwhile, PKM2 knockdown significantly decreased the expression levels of autophagy-related proteins PINK1, Parkin, p-Parkin, Beclin1, and LC3II/I, while upregulating the expression of p62. Overexpression of PINK1 partially reversed these changes in protein expression.
Further mechanistic studies found that PKM2 knockdown significantly reduced CoCl2-induced mitochondrial ROS levels, restored MMP, and increased intracellular ATP levels (Fig. 4B–D). Overexpression of PINK1 reversed these changes. The TEM results (Fig. 4E) showed that PKM2 knockdown alleviated CoCl2-induced mitochondrial membrane swelling, reduction in mitochondrial cristae, and the increased number of autophagosomes, while overexpression of PINK1 could inhibit these effects. Additionally, qPCR analysis revealed that CoCl2 treatment decreased mtDNA copy number, which increased upon PKM2 knockdown and decreased again with overexpression of PINK1 (Fig. 4F). Immunofluorescence staining demonstrated co-localization of LC3 and TOM20, indicating recruitment of LC3 to mitochondria (Fig. 4G). The co-localization index was highest in the CoCl2 group, suggesting enhanced mitophagy. PKM2 knockdown reduced co-localization, while PINK1 overexpression partially restored it. CoCl2 treatment significantly increased the red/green fluorescence ratio of the mt-Keima probe in NSCs, indicating an enhancement of mitophagic flux (Fig. 4H). PKM2 knockdown reduced this ratio, while PINK1 overexpression partially reversed the effect. In summary, the knockdown of PKM2 effectively mitigated CoCl2-induced mitophagy in NSCs, with this protective effect partially achieved through the inhibition of the PINK1/Parkin pathway.

Figure 4: Downregulation of PKM2 alleviated CoCl2-induced mitophagy in NSCs by inhibiting the PINK1/Parkin pathway. (A) Levels of PKM2 and autophagy-related proteins (p62, PINK1, Parkin, p-Parkin, Beclin1, LC3II/I) in NSCs. (B) Mitochondrial ROS levels in NSCs. (C) MMP in NSCs. (D) ATP levels in NSCs. (E) TEM was used to observe mitochondrial morphology and relatively quantify the number of autophagosomes. Red arrows indicate autophagosomes. The 400× image is a higher-magnification view of the region outlined by the black box in the 100× image. Scale bar: 2 μm (100×); 500 nm (400×). (F) The mtDNA copy number was quantified by qPCR. (G) Co-localization of LC3 and TOM20 was measured by dual immunofluorescence staining. Scale bar: 25 μm. (H) Mitophagy as determined by mt-Keima transfection. The mitophagy ratios were calculated as the ratio of red to green fluorescence intensity. Scale bar: 25 μm. Data are presented as the mean ± SD from three independent samples (n = 3). *p < 0.05, **p < 0.01, ****p < 0.0001.
3.5 Downregulation of PKM2 Promoted NSCs Proliferation and Neuronal Differentiation by Inhibiting Mitophagy
To verify whether mitophagy was the key mechanism by which PKM2 exerted its neuroprotective effects, we conducted experiments involving the knockdown of PKM2 in combination with the mitophagy inducer CCCP. Western blot analysis (Fig. 5A) revealed that PKM2 knockdown significantly reduced the expression level of PKM2, while the addition of CCCP did not affect PKM2 expression. Moreover, CCCP significantly increased the expression levels of PINK1, Parkin, Beclin1, and LC3II/I, while decreasing the expression level of p62. Importantly, PKM2 knockdown markedly reversed these CCCP-induced changes in autophagy-related proteins. Consistently, CCCP treatment led to a marked increase in mitochondrial ROS (Fig. 5B), a severe reduction in MMP (Fig. 5C), and significant decreases in cellular ATP (Fig. 5D) and mtDNA copy number (Fig. 5E). PKM2 knockdown markedly reversed these CCCP-exacerbated mitochondrial impairments. TEM revealed that the CoCl2+CCCP group exhibited substantial mitochondrial swelling, cristae loss, and an increased number of autophagosomes, all of which were significantly alleviated by PKM2 knockdown (Fig. 5F). Direct assessments of mitophagic flux via LC3-TOM20 co-localization (Fig. 5G) and the mt-Keima assay (Fig. 5H) confirmed that CCCP treatment strongly induced mitophagy, and this induction was substantially attenuated by PKM2 knockdown. Functionally, compared to the CoCl2 group, CoCl2+CCCP treatment further reduced the already impaired cell viability (Fig. 5I) and EdU incorporation (Fig. 5J). PKM2 knockdown significantly reversed these CoCl2+CCCP-induced detrimental effects, enhancing proliferation and survival. Regarding differentiation, CoCl2+CCCP treatment decreased NeuN and increased GFAP expression, compared to the CoCl2 group (Fig. 5K,L). PKM2 knockdown promoted a neuronal differentiation bias, as evidenced by increased NeuN and decreased GFAP levels. These findings confirmed that PKM2 promoted the proliferation and neuronal differentiation of NSCs primarily by inhibiting mitophagy.

Figure 5: Downregulation of PKM2 promoted NSCs’ proliferation and neuronal differentiation by inhibiting mitophagy. (A) Levels of PKM2 and autophagy-related proteins (p62, PINK1, Parkin, p-Parkin, Beclin1, LC3II/I) in NSCs. (B) Mitochondrial ROS levels in NSCs. (C) MMP in NSCs. (D) ATP levels in NSCs. (E) The mtDNA copy number was quantified by qPCR. (F) TEM was used to observe mitochondrial morphology and relatively quantify the number of autophagosomes. Red arrows indicate autophagosomes. The 400× image is a higher-magnification view of the region outlined by the black box in the 100× image. Scale bar: 2 μm (100×); 500 nm (400×). (G) Co-localization of LC3 and TOM20 was measured by dual immunofluorescence staining. Scale bar: 25 μm. (H) Mitophagy as determined by mt-Keima transfection. The mitophagy ratios were calculated as the ratio of red to green fluorescence intensity. Scale bar: 25 μm. (I) Viability of NSCs was measured using the CCK-8 assay. (J) The proliferative activity of NSCs was measured using the EdU assay. Scale bar: 50 μm. (K) The expression of NeuN and GFAP was measured by dual immunofluorescence staining. Scale bar: 25 μm. (L) Protein levels of NeuN and GFAP in NSCs. Data are presented as the mean ± SD from three independent samples (n = 3). *p < 0.05, **p < 0.01, ***p < 0.001, ****p < 0.0001.
NSCs are essential for maintaining the homeostasis of the nervous system and repairing neural damage. Our research underscores the possibility of using mitophagy modulation as a therapeutic strategy to enhance NSC performance. The study elucidates the mechanism by which PKM2 promotes NSCs proliferation and their transformation into neurons by inhibiting the PINK1/Parkin-mediated mitophagy pathway, providing a novel theoretical basis for the treatment of nervous system disorders.
Mitophagy is a protective mechanism by which cells respond to hypoxic and other stressful environments. However, excessive mitophagy leads to neuronal death, accompanied by disruption of intracellular homeostasis [23,24]. Recently, it has been reported that insufficient activation of mitophagy can result in abnormal homeostasis in some stem cells [25,26]. Moreover, the maturation of mitophagy increases the utilization of fatty acids while decreasing glucose utilization, which typically implies reduced proliferation. This is particularly significant for NSCs, as they heavily rely on glycolysis to maintain growth and homeostasis [27,28]. In fact, mitophagy has been associated with the inhibition of proliferation in certain stem cells and malignant cells [29,30,31]. In this study, the hypoxic environment induced by CoCl2 significantly inhibited the proliferation and neuronal differentiation of NSCs while simultaneously triggering excessive mitophagy and upregulating the expression of PKM2. PKM2, a metabolic enzyme predominantly present in proliferating cells (including neural precursor cells) [32], regulates glycolysis and energy metabolism [33] and is also involved in neurogenesis [34]. Our study confirmed that under hypoxia, the upregulated PKM2 activates the PINK1/Parkin signaling pathway, which recruits autophagy-related proteins Beclin1 and LC3II and downregulates the expression of p62, ultimately driving the excessive mitophagy process [35]. Studies have shown that PINK1 activates mitophagy through the Parkin-mediated mitochondrial ubiquitination pathway [36]. p62 can bind to ubiquitinated protein aggregates and transport them to autophagosomes for degradation [37]. The downregulation of p62 is usually associated with enhanced degradation of substrates by autophagosomes.
Key evidence indicates that the knockdown of PKM2 significantly reduces mitochondrial ROS levels, restores MMP, and increases intracellular ATP levels. Additionally, PKM2 knockdown alleviates CoCl2-induced mitochondrial membrane swelling, a reduced number of mitochondrial cristae, and an increased number of autophagosomes. Mechanistically, PKM2 acts upstream of the PINK1/Parkin pathway, modulating the expression of key autophagy proteins. siRNA-mediated PKM2 knockdown not only decreases the expression of PINK1, Parkin, p-Parkin, Beclin1, and LC3II proteins but also increases p62 expression, thereby mitigating excessive mitophagy. Previous studies have shown that PKM2 knockdown in airway epithelial cells inhibits PINK1/Parkin-mediated mitophagy [18], highlighting PKM2′s crucial role in regulating mitophagy. This is supported by rescue experiments, where overexpression of PINK1 or induction of mitophagy by CCCP counteracts the protective effects of PKM2 knockdown on NSCs. In summary, our study definitively establishes PKM2 as a key regulator of mitophagy in NSCs, providing new insights into how metabolic enzymes influence the fate and function of these cells. It is worth noting that PKM2 primarily regulates the relatively “controlled” mitophagy mediated by the PINK1/Parkin pathway under specific stress conditions, such as hypoxia simulated by CoCl2. CCCP, as a potent chemical uncoupler, can trigger a “maximized” mitophagy program. The intensity of this program is sufficient to override the effects of PKM2 deficiency and may also activate alternative pathways that are independent of PKM2. Studies have reported that mitophagy is a highly regulated process that can be influenced by multiple signaling cascades [9]. For instance, AMP-activated protein kinase (AMPK) can directly phosphorylate Unc-51-like kinase 1, a key initiator of autophagy, thereby promoting mitophagy independently of the PKM2/PINK1/Parkin pathway [38].
Previous studies have reported that PKM2 exacerbates neuroinflammation-driven neurological disorders by regulating the metabolic reprogramming of microglia [39,40]. It can also worsen neuroinflammation induced by cerebral ischemia-reperfusion through the toll-like receptor 4/myeloid differentiation primary response 88/tumor necrosis factor receptor-associated factor 6 signaling pathway [41]. Compared to the normal group, mice with myeloid-specific PKM2 deficiency showed improved local cerebral blood flow after ischemic stroke, along with reduced intracerebral deposition of fibrinogen, platelets, and neutrophil-derived inflammatory factors [42]. The phosphorylation of signal transducer and activator of transcription 3 is closely related to the regulation of inflammation by PKM2 [42]. PKM2 can also affect neurogenesis and cognitive function by regulating lactate homeostasis [43]. These findings collectively suggest that targeting PKM2 holds promise as a novel treatment strategy for neurological diseases associated with inflammation, stroke, and cognition. Additionally, the composition and activity of PKM2 are regulated by amino acids, fatty acids, glucose, and bypass metabolites [44]. Its unique advantage lies in modulating the “metabolism-autophagy axis” thereby providing a complementary approach to traditional neurotrophic factor therapies. Based on the therapeutic effects of NSC transplantation in neurological diseases such as stroke [45,46], our study reveals the potential synergistic effect of PKM2-targeted therapy and NSC transplantation, providing a preliminary theoretical basis for exploring the combination strategy of “cell therapy + metabolic regulation” in stroke treatment.
Despite these advancements, our study has its limitations. The CoCl2-induced hypoxia model cannot fully replicate the complexity of the ischemic microenvironment in vivo, and future validation of our conclusions in more comprehensive in vivo systems (such as stroke animal models) is necessary. Additionally, the precise molecular mechanisms by which PKM2 regulates the PINK1/Parkin pathway, as well as whether it modulates NSCs proliferation and differentiation through metabolic regulation, epigenetic modifications [47], or interactions with other signaling molecules (such as hypoxia-inducible factor 1-α and mammalian target of rapamycin) [48,49], remain to be determined. Future studies could employ techniques such as chromatin immunoprecipitation followed by sequencing and metabolomics to uncover its direct target sites and transcriptional regulatory networks. Furthermore, the reliance on PINK1 overexpression rather than knockout models limits our ability to completely rule out mitophagy-independent effects of PKM2, a point that should be addressed in future genetic loss-of-function studies. The long-term efficacy of PKM2 knockdown in vivo models and its universality across different neurological diseases (such as neurodegenerative diseases and traumatic brain injury) require further evaluation. Finally, a key future direction will be to elucidate how mitophagy, through the modulation of cellular energy metabolism, influences NSC fate under hypoxic stress.
We have discovered that the knockdown of PKM2 inhibits excessive mitophagy mediated by the PINK1/Parkin pathway, thereby promoting the proliferation and neuronal differentiation of NSCs. Modulating the process of mitophagy represents a promising therapeutic approach to enhance NSC function. Our research highlights the potential of targeting PKM2 as a novel treatment strategy for ischemic brain injury and other neurodegenerative conditions.
Acknowledgement:
Funding Statement: This work was supported by the Natural Science Foundation of Hunan Provincial (No. 2024JJ7561).
Author Contributions: The authors confirm contribution to the paper as follows: study conception and design: Junming Yan, Yingjie Zhu; data collection: Junming Yan; analysis and interpretation of results: Junming Yan, Boran Xiong, Yingjie Zhu; draft manuscript preparation: Junming Yan, Yingjie Zhu. All authors reviewed and approved the final version of the manuscript.
Availability of Data and Materials: The data that support the findings of this study are available from the corresponding author [Yingjie Zhu], upon reasonable request.
Ethics Approval: All experimental procedures and animal handling were performed with the approval of the Animal Care and Use Committee of the Xiangxi Tujia and Miao Autonomous Prefecture People’s Hospital (No. EC-LCKY2025055), in accordance with the National Institutes of Health Guide for the Care and Use of Laboratory Animals, and studies involving laboratory animals follow the ARRIVE guidelines.
Conflicts of Interest: The authors declare no conflicts of interest.
Abbreviations
| NSCs | neural stem cells |
| PKM2 | pyruvate kinase M2 |
| PINK1 | phosphatase and tensin homolog-induced putative kinase 1 |
| CCCP | carbonyl cyanide m-chlorophenyl hydrazone |
| AKT | protein kinase B |
| CCK-8 | Cell Counting Kit-8 |
| EdU | 5-Ethynyl-2′-deoxyuridine |
| ROS | reactive oxygen species |
| MMP | mitochondrial membrane potential |
| ATP | adenosine triphosphate |
| TEM | Transmission electron microscopy |
| qPCR | Quantitative PCR |
| SD | standard deviation |
| LC3II | light chain 3 beta isoform II |

Figure A1: Identification and functional testing of NSCs. (A) Immunofluorescence staining of Nestin was performed to identify NSCs. Scale bar: 25 μm. (B) BrdU and Nestin co-staining showed proliferating NSCs. Scale bar: 25 μm. (C) Immunofluorescence staining for neuronal (NeuN), astrocytic (GFAP), and oligodendroglial (Olig2) markers was conducted to evaluate the differentiation potential of NSCs. Scale bar: 25 μm. Data are presented as the mean ± SD from three independent samples (n = 3).
References
1. Kriegstein A , Alvarez-Buylla A . The glial nature of embryonic and adult neural stem cells. Annu Rev Neurosci. 2009; 32: 149– 84. doi:10.1146/annurev.neuro.051508.135600. [Google Scholar] [CrossRef]
2. Elkin AM , Robbins S , Barros CS , Bossing T . The critical balance between quiescence and reactivation of neural stem cells. Biomolecules. 2025; 15( 5): 672. doi:10.3390/biom15050672. [Google Scholar] [CrossRef]
3. Dooley D , Vidal P , Hendrix S . Immunopharmacological intervention for successful neural stem cell therapy: new perspectives in CNS neurogenesis and repair. Pharmacol Ther. 2014; 141( 1): 21– 31. doi:10.1016/j.pharmthera.2013.08.001. [Google Scholar] [CrossRef]
4. Stenudd M , Sabelström H , Frisén J . Role of endogenous neural stem cells in spinal cord injury and repair. JAMA Neurol. 2015; 72( 2): 235– 7. doi:10.1001/jamaneurol.2014.2927. [Google Scholar] [CrossRef]
5. Gao J , Bai P , Li Y , Li J , Jia C , Wang T , et al. Metabolomic profiling of the synergistic effects of ginsenoside Rg1 in combination with neural stem cell transplantation in ischemic stroke rats. J Proteome Res. 2020; 19( 7): 2676– 88. doi:10.1021/acs.jproteome.9b00639. [Google Scholar] [CrossRef]
6. Liu H , Wang C , Yi F , Yeo S , Haas M , Tang X , et al. Non-canonical function of FIP200 is required for neural stem cell maintenance and differentiation by limiting TBK1 activation and p62 aggregate formation. Sci Rep. 2021; 11( 1): 23907. doi:10.1038/s41598-021-03404-7. [Google Scholar] [CrossRef]
7. Jung S , Choe S , Woo H , Jeong H , An HK , Moon H , et al. Autophagic death of neural stem cells mediates chronic stress-induced decline of adult hippocampal neurogenesis and cognitive deficits. Autophagy. 2020; 16( 3): 512– 30. doi:10.1080/15548627.2019.1630222. [Google Scholar] [CrossRef]
8. Wang M , Liang X , Cheng M , Yang L , Liu H , Wang X , et al. Homocysteine enhances neural stem cell autophagy in in vivo and in vitro model of ischemic stroke. Cell Death Dis. 2019; 10( 8): 561. doi:10.1038/s41419-019-1798-4. [Google Scholar] [CrossRef]
9. Gustafsson ÅB , Dorn GW 2nd . Evolving and expanding the roles of mitophagy as a homeostatic and pathogenic process. Physiol Rev. 2019; 99( 1): 853– 92. doi:10.1152/physrev.00005.2018. [Google Scholar] [CrossRef]
10. Zuo Z , Jing K , Wu H , Wang S , Ye L , Li Z , et al. Mechanisms and functions of mitophagy and potential roles in renal disease. Front Physiol. 2020; 11: 935. doi:10.3389/fphys.2020.00935. [Google Scholar] [CrossRef]
11. Esteban-Martínez L , Sierra-Filardi E , Boya P . Mitophagy, metabolism, and cell fate. Mol Cell Oncol. 2017; 4( 5): e1353854. doi:10.1080/23723556.2017.1353854. [Google Scholar] [CrossRef]
12. Li D , Liu L , Qin J , Shen C , Wang B . Roles of pyruvate kinase M2 in pulmonary diseases: what do we know so far? Lung. 2025; 203( 1): 67. doi:10.1007/s00408-025-00821-7. [Google Scholar] [CrossRef]
13. Clower CV , Chatterjee D , Wang Z , Cantley LC , Vander Heiden MG , Krainer AR . The alternative splicing repressors hnRNP A1/A2 and PTB influence pyruvate kinase isoform expression and cell metabolism. Proc Natl Acad Sci U S A. 2010; 107( 5): 1894– 9. doi:10.1073/pnas.0914845107. [Google Scholar] [CrossRef]
14. Tech K , Tikunov AP , Farooq H , Morrissy AS , Meidinger J , Fish T , et al. Pyruvate kinase inhibits proliferation during postnatal cerebellar neurogenesis and suppresses medulloblastoma formation. Cancer Res. 2017; 77( 12): 3217– 30. doi:10.1158/0008-5472.CAN-16-3304. [Google Scholar] [CrossRef]
15. Yang W , Lu Z . Regulation and function of pyruvate kinase M2 in cancer. Cancer Lett. 2013; 339( 2): 153– 8. doi:10.1016/j.canlet.2013.06.008. [Google Scholar] [CrossRef]
16. Qin X , Du Y , Chen X , Li W , Zhang J , Yang J . Activation of Akt protects cancer cells from growth inhibition induced by PKM2 knockdown. Cell Biosci. 2014; 4: 20. doi:10.1186/2045-3701-4-20. [Google Scholar] [CrossRef]
17. Wu Q , Ge W , Chen Y , Kong X , Xian H . PKM2 involved in neuronal apoptosis on hypoxic-ischemic encephalopathy in neonatal rats. Neurochem Res. 2019; 44( 7): 1602– 12. doi:10.1007/s11064-019-02784-7. [Google Scholar] [CrossRef]
18. Li D , Shen C , Liu L , Hu J , Qin J , Dai L , et al. PKM2 regulates cigarette smoke-induced airway inflammation and epithelial-to-mesenchymal transition via modulating PINK1/Parkin-mediated mitophagy. Toxicology. 2022; 477: 153251. doi:10.1016/j.tox.2022.153251. [Google Scholar] [CrossRef]
19. Jin HQ , Jiang WF , Zheng XT , Li L , Fang Y , Yang Y , et al. miR-199a-5p enhances neuronal differentiation of neural stem cells and promotes neurogenesis by targeting Cav-1 after cerebral ischemia. CNS Neurosci Ther. 2023; 29( 12): 3967– 79. doi:10.1111/cns.14323. [Google Scholar] [CrossRef]
20. Ren HW , Gu B , Zhang YZ , Guo T , Wang Q , Shen YQ , et al. microRNA-424 alleviates neurocyte injury by targeting PDCD4 in a cellular model of cerebral ischemic stroke. Exp Ther Med. 2021; 22( 6): 1453. doi:10.3892/etm.2021.10888. [Google Scholar] [CrossRef]
21. Yu Z , Wang H , Tang W , Wang S , Tian X , Zhu Y , et al. Mitochondrial Ca2+ oscillation induces mitophagy initiation through the PINK1-Parkin pathway. Cell Death Dis. 2021; 12( 7): 632. doi:10.1038/s41419-021-03913-3. [Google Scholar] [CrossRef]
22. Wang W , Zhang Y , Huang W , Yuan Y , Hong Q , Xie Z , et al. Alamandine/MrgD axis prevents TGF-β1-mediated fibroblast activation via regulation of aerobic glycolysis and mitophagy. J Transl Med. 2023; 21( 1): 24. doi:10.1186/s12967-022-03837-2. [Google Scholar] [CrossRef]
23. Shi R , Weng J , Zhao L , Li XM , Gao TM , Kong J . Excessive autophagy contributes to neuron death in cerebral ischemia. CNS Neurosci Ther. 2012; 18( 3): 250– 60. doi:10.1111/j.1755-5949.2012.00295.x. [Google Scholar] [CrossRef]
24. Yu EPK , Reinhold J , Yu H , Starks L , Uryga AK , Foote K , et al. Mitochondrial respiration is reduced in atherosclerosis, promoting necrotic core formation and reducing relative fibrous cap thickness. Arterioscler Thromb Vasc Biol. 2017; 37( 12): 2322– 32. doi:10.1161/ATVBAHA.117.310042. [Google Scholar] [CrossRef]
25. Jin G , Xu C , Zhang X , Long J , Rezaeian AH , Liu C , et al. Atad3a suppresses Pink1-dependent mitophagy to maintain homeostasis of hematopoietic progenitor cells. Nat Immunol. 2018; 19( 1): 29– 40. doi:10.1038/s41590-017-0002-1. [Google Scholar] [CrossRef]
26. Yang C , Suda T . Hyperactivated mitophagy in hematopoietic stem cells. Nat Immunol. 2018; 19( 1): 2– 3. doi:10.1038/s41590-017-0008-8. [Google Scholar] [CrossRef]
27. Zhang H , Menzies KJ , Auwerx J . The role of mitochondria in stem cell fate and aging. Development. 2018; 145( 8): dev143420. doi:10.1242/dev.143420. [Google Scholar] [CrossRef]
28. Lange C , Turrero Garcia M , Decimo I , Bifari F , Eelen G , Quaegebeur A , et al. Relief of hypoxia by angiogenesis promotes neural stem cell differentiation by targeting glycolysis. EMBO J. 2016; 35( 9): 924– 41. doi:10.15252/embj.201592372. [Google Scholar] [CrossRef]
29. Lv D , Gimple RC , Zhong C , Wu Q , Yang K , Prager BC , et al. PDGF signaling inhibits mitophagy in glioblastoma stem cells through N6-methyladenosine. Dev Cell. 2022; 57( 12): 1466– 81.e6. doi:10.1016/j.devcel.2022.05.007. [Google Scholar] [CrossRef]
30. Xiang K , Ren M , Liu F , Li Y , He P , Gong X , et al. Tobacco toxins trigger bone marrow mesenchymal stem cells aging by inhibiting mitophagy. Ecotoxicol Environ Saf. 2024; 277: 116392. doi:10.1016/j.ecoenv.2024.116392. [Google Scholar] [CrossRef]
31. Chu T , Huang Z , Ma W . Mitophagy: a double-edged sword in tumor cell death regulation and therapeutic response. Biochem Biophys Res Commun. 2025; 777: 152254. doi:10.1016/j.bbrc.2025.152254. [Google Scholar] [CrossRef]
32. Romero-Ramírez L , García-Rama C , Wu S , Mey J . Bile acids attenuate PKM2 pathway activation in proinflammatory microglia. Sci Rep. 2022; 12( 1): 1459. doi:10.1038/s41598-022-05408-3. [Google Scholar] [CrossRef]
33. Zheng H , Tan J , Qin F , Zheng Y , Yang X , Liu Z , et al. PKM2 modulates chemotherapy sensitivity by regulating autophagy and predicts the prognosis and immunity in pancancer. Sci Rep. 2025; 15( 1): 14626. doi:10.1038/s41598-025-96562-x. [Google Scholar] [CrossRef]
34. Kang BS , Choi BY , Kho AR , Lee SH , Hong DK , Park MK , et al. Effects of pyruvate kinase M2 (PKM2) gene deletion on astrocyte-specific glycolysis and global cerebral ischemia-induced neuronal death. Antioxidants. 2023; 12( 2): 491. doi:10.3390/antiox12020491. [Google Scholar] [CrossRef]
35. Michiorri S , Gelmetti V , Giarda E , Lombardi F , Romano F , Marongiu R , et al. The Parkinson-associated protein PINK1 interacts with Beclin1 and promotes autophagy. Cell Death Differ. 2010; 17( 6): 962– 74. doi:10.1038/cdd.2009.200. [Google Scholar] [CrossRef]
36. Abudureyimu M , Yu W , Cao RY , Zhang Y , Liu H , Zheng H . Berberine promotes cardiac function by upregulating PINK1/parkin-mediated mitophagy in heart failure. Front Physiol. 2020; 11: 565751. doi:10.3389/fphys.2020.565751. [Google Scholar] [CrossRef]
37. Ivankovic D , Chau KY , Schapira AHV , Gegg ME . Mitochondrial and lysosomal biogenesis are activated following PINK1/parkin-mediated mitophagy. J Neurochem. 2016; 136( 2): 388– 402. doi:10.1111/jnc.13412. [Google Scholar] [CrossRef]
38. Egan DF , Shackelford DB , Mihaylova MM , Gelino S , Kohnz RA , Mair W , et al. Phosphorylation of ULK1 (hATG1) by AMP-activated protein kinase connects energy sensing to mitophagy. Science. 2011; 331( 6016): 456– 61. doi:10.1126/science.1196371. [Google Scholar] [CrossRef]
39. Zhang Q , Wang SS , Zhang Z , Chu SF . PKM2-mediated metabolic reprogramming of microglia in neuroinflammation. Cell Death Discov. 2025; 11( 1): 149. doi:10.1038/s41420-025-02453-5. [Google Scholar] [CrossRef]
40. Liu Z , Le Y , Chen H , Zhu J , Lu D . Role of PKM2-mediated immunometabolic reprogramming on development of cytokine storm. Front Immunol. 2021; 12: 748573. doi:10.3389/fimmu.2021.748573. [Google Scholar] [CrossRef]
41. Zhang B , Shen J , Zhong Z , Zhang L . PKM2 aggravates cerebral ischemia reperfusion-induced neuroinflammation via TLR4/MyD88/TRAF6 signaling pathway. Neuroimmunomodulation. 2021; 28( 1): 29– 37. doi:10.1159/000509710. [Google Scholar] [CrossRef]
42. Dhanesha N , Patel RB , Doddapattar P , Ghatge M , Flora GD , Jain M , et al. PKM2 promotes neutrophil activation and cerebral thromboinflammation: therapeutic implications for ischemic stroke. Blood. 2022; 139( 8): 1234– 45. doi:10.1182/blood.2021012322. [Google Scholar] [CrossRef]
43. He P , Zhang B , Jiang W , Zhu F , Liang Z , Gao L , et al. PKM2 is a key factor to regulate neurogenesis and cognition by controlling lactate homeostasis. Stem Cell Reports. 2025; 20( 1): 102381. doi:10.1016/j.stemcr.2024.11.011. [Google Scholar] [CrossRef]
44. Mazurek S . Pyruvate kinase type M2: a key regulator of the metabolic budget system in tumor cells. Int J Biochem Cell Biol. 2011; 43( 7): 969– 80. doi:10.1016/j.biocel.2010.02.005. [Google Scholar] [CrossRef]
45. Abati E , Bresolin N , Comi GP , Corti S . Preconditioning and cellular engineering to increase the survival of transplanted neural stem cells for motor neuron disease therapy. Mol Neurobiol. 2019; 56( 5): 3356– 67. doi:10.1007/s12035-018-1305-4. [Google Scholar] [CrossRef]
46. Baker EW , Kinder HA , West FD . Neural stem cell therapy for stroke: a multimechanistic approach to restoring neurological function. Brain Behav. 2019; 9( 3): e01214. doi:10.1002/brb3.1214. [Google Scholar] [CrossRef]
47. Chen L , Shi Y , Liu S , Cao Y , Wang X , Tao Y . PKM2: the thread linking energy metabolism reprogramming with epigenetics in cancer. Int J Mol Sci. 2014; 15( 7): 11435– 45. doi:10.3390/ijms150711435. [Google Scholar] [CrossRef]
48. Gao Y , Fan S , Sun X , Li J , Dai Y , Li H , et al. Oncometabolite fumarate facilitates PD-L1 expression and immune evasion in clear cell renal cell carcinoma. Cell Death Dis. 2025; 16( 1): 432. doi:10.1038/s41419-025-07752-4. [Google Scholar] [CrossRef]
49. Fan H , Wu Y , Yu S , Li X , Wang A , Wang S , et al. Critical role of mTOR in regulating aerobic glycolysis in carcinogenesis (Review). Int J Oncol. 2021; 58( 1): 9– 19. doi:10.3892/ijo.2020.5152. [Google Scholar] [CrossRef]
Cite This Article
 Copyright © 2026 The Author(s). Published by Tech Science Press.
This work is licensed under a Creative Commons Attribution 4.0 International License , which permits unrestricted use, distribution, and reproduction in any medium, provided the original work is properly cited.
 Downloads
 Citation Tools