
 Login
Login Register
 Submit a Paper
 Propose a Special lssue
 Open Access
ARTICLE
Opioids Promote Autophagy and Attenuate LPS-Induced Cellular Senescence-Associated Changes in Microglia
1 Department of Physiology, Faculty of Science, Charles University, Prague, Czechia
2 Department of Pharmacology, First Faculty of Medicine, Charles University and General University Hospital, Prague, Czechia
* Corresponding Author: Jiri Novotny. Email:
BIOCELL 2026, 50(9), 9 https://doi.org/10.32604/biocell.2026.080886
Received 17 February 2026; Accepted 11 June 2026; Issue published 26 August 2026
 View Full Text
 Download PDF
Abstract
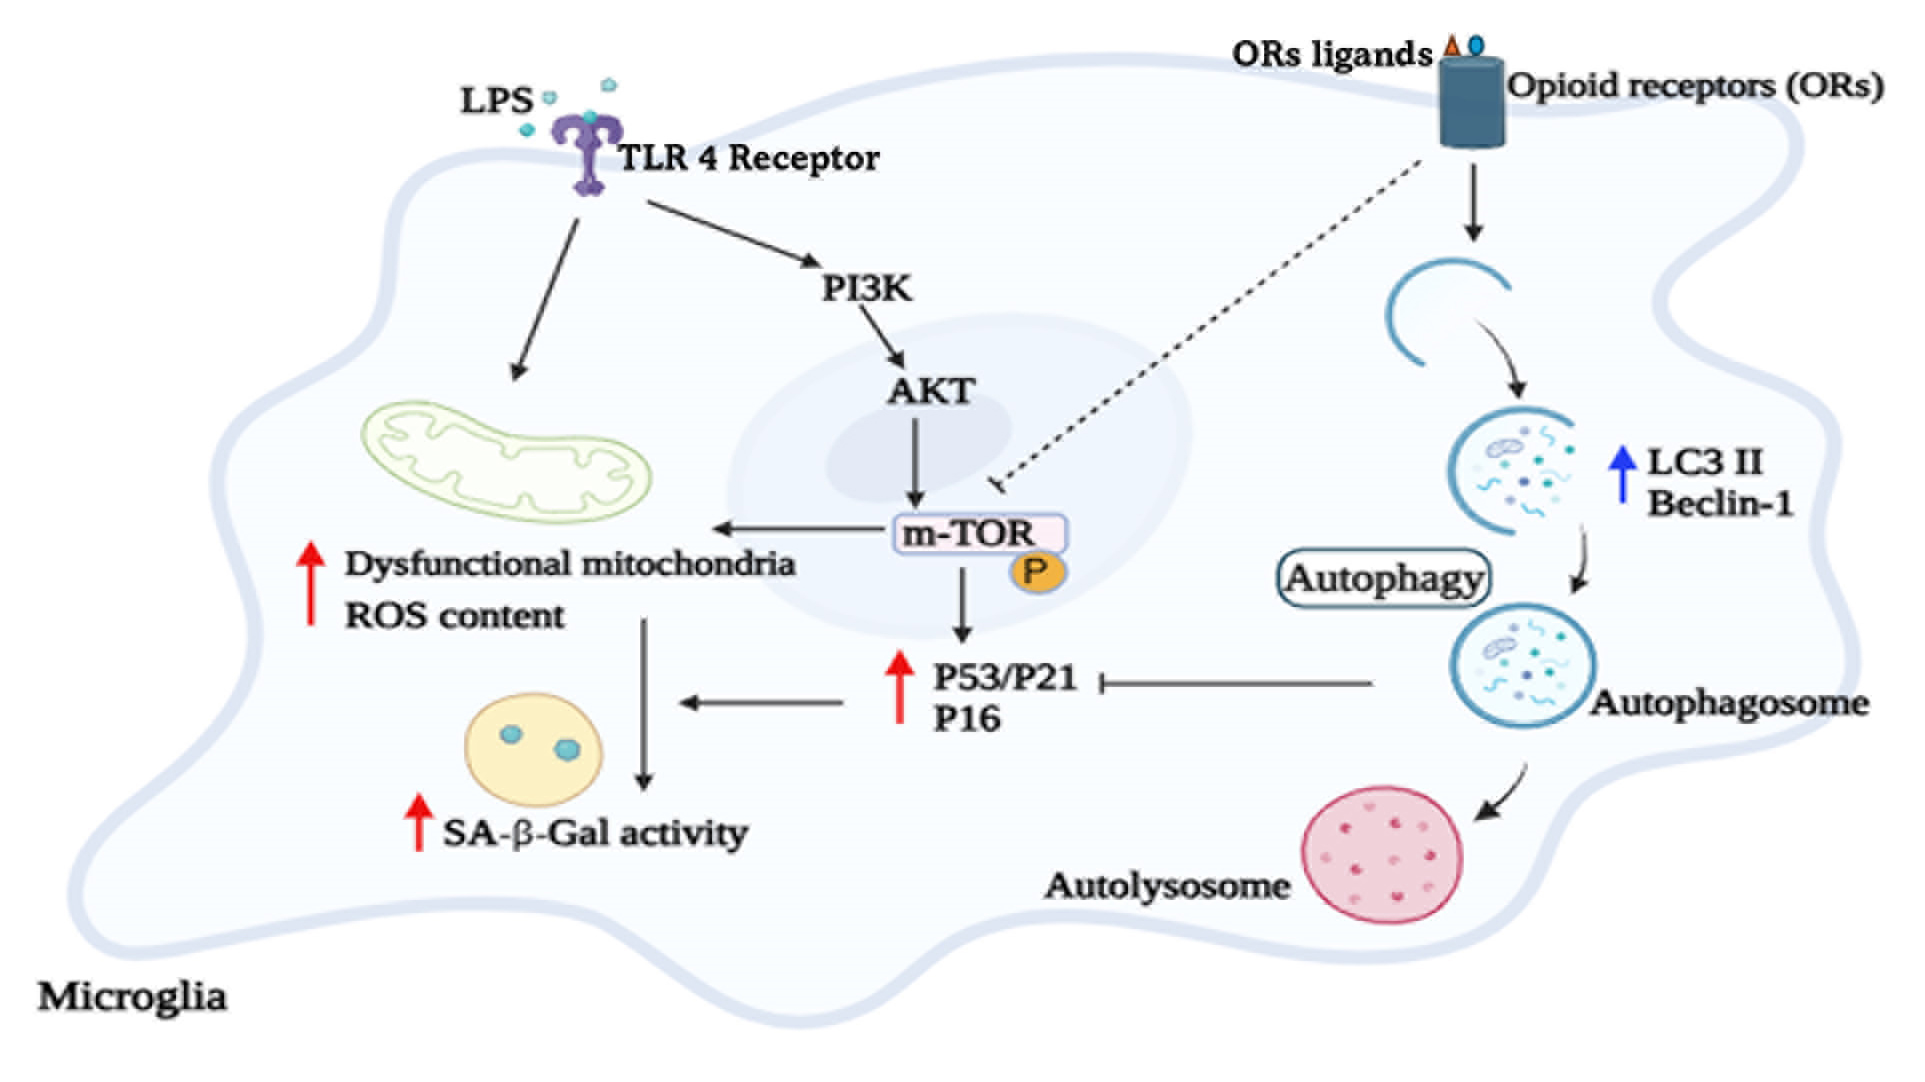
Background: Opioids can modulate mitochondrial redox homeostasis and autophagy and are implicated in the regulation of key physiological and pathological processes, including aging, cellular metabolism, and tumorigenesis. The study aimed to investigate how opioid receptor agonists influence lipopolysaccharide-induced senescence in microglia. Methods: C8-B4 microglial cells were either left untreated or pretreated with different opioid agonists and subsequently exposed to lipopolysaccharide (LPS). Colorimetric assays, fluorescence microscopy, flow cytometry, and Western blotting were used to assess cellular senescence, autophagy-associated changes, reactive oxygen species, and calcium levels, as well as the expression of selected marker proteins and signaling molecules. Results: Treatment with DAMGO, DADLE, and U-50488 significantly attenuated LPS-induced increases in intracellular calcium levels and reduced the expression of cellular senescence markers, including p53, p16, p21, SA-β-Gal activity, and mitochondrial ROS (mtROS), while enhancing total antioxidant capacity (p < 0.05). Notably, opioid treatment was associated with changes consistent with increased autophagy-related activity, as demonstrated by the upregulation of autophagy-related markers Autophagy-related proteins 5 and 7, beclin-1, and microtubule-associated proteins 1A/1B light chain 3B (MAP-LC3). It reversed LPS-induced impairment of autophagy-related activity, evidenced by increased degradation of p62 (p < 0.05). Furthermore, opioids inhibited LPS-induced activation of the phosphatidylinositol 3-kinase/Protein Kinase B/mechanistic Target of Rapamycin signaling pathway (p < 0.05), thereby promoting autophagy. Conclusions: Taken together, these findings suggest that opioids may support cell survival, attenuate LPS-associated senescence markers, and be accompanied by changes consistent with increased autophagy-related activity.Graphic Abstract
Keywords
Supplementary Material
Supplementary Material FileMicroglia, the mononuclear phagocytes of the central nervous system (CNS), serve as the primary immune cells responsible for maintaining brain homeostasis and protecting neuronal functions [1]. Various pathological conditions or insults to the CNS cause microglia to transition from a resting state to an activated state, promoting the development of an inflamed environment at the site of injury [2]. Classical activation of microglia, triggered by lipopolysaccharide (LPS) and interferon-γ, induces a proinflammatory M1 phenotype, whereas stimulation by Interleukin-4 (IL-4) or Interleukin-13(IL-13) promotes an anti-inflammatory M2 phenotype [3]. The switch between M1 and M2 phenotypes can be modulated by various chemical stimuli, such as antioxidants [4,5,6]. Increasing evidence suggests that opioids can also influence microglial function [7] and behavior [8,9,10].
There is evidence that opioids can stimulate autophagy under certain experimental conditions [11,12,13]. Conversely, opioid-mediated inhibition of autophagy has also been reported [14,15,16]. Interestingly, autophagy plays an important role in microglia, helping prevent microglial senescence [17,18]. Autophagy is a physiological process that facilitates the degradation of dysfunctional cytoplasmic components and organelles via the lysosome, thereby contributing to the maintenance of cellular homeostasis [19]. The expression of autophagy-related genes, including autophagy-related (ATG) protein 5 (ATG5), ATG7, and Beclin1, declines in the human brain during normal aging [20], suggesting that impaired autophagy may negatively impact longevity and contribute to age-related diseases [19,21]. Calcium signaling plays a crucial role in the activation of autophagy. Various stimuli can increase intracellular Ca2+ levels in microglial cells. For instance, acute neuronal injury or exposure to LPS has been shown to raise the proportion of microglial cells exhibiting spontaneous Ca2+ transients [22,23]. As a result of aberrant calcium signaling, microglia become activated and can release proinflammatory cytokines such as IL-1β, IL-6, and TNF-α, as well as chemokines and reactive oxygen species (ROS), thereby exacerbating neuroinflammation and oxidative stress. Moreover, calcium dysregulation impairs microglial autophagy, leading to the accumulation of protein aggregates that can initiate neurodegenerative processes [17,24,25]. In addition, our previous work demonstrated expression of μ-, δ-, and κ-opioid receptors in C8-B4 microglia under resting and inflammatory conditions, supporting the use of DAMGO, DADLE, and U-50488 in this model. Broader phenotype analysis in that study also showed reduced pro-inflammatory markers together with increased anti-inflammatory markers after opioid treatment.
The phosphatidylinositol 3-kinase/Protein Kinase B (PI3K/AKT) signaling pathway, known for its profound effects on numerous key aspects of cell growth, metabolism, and cell death, has also been found to play a role in the regulation of autophagy and cellular senescence [26,27,28]. This pathway regulates the neuroinflammatory responses of microglia. Various molecules, such as growth factors, LPS, and insulin, that bind to microglial Toll-like receptors can activate the PI3K/AKT pathway. Once activated, microglial cells adopt a neurotoxic phenotype characterized by the production of ROS, nitric oxide, proteases, and proinflammatory cytokines, which recruit additional glial cells and exacerbate neuronal damage [29,30]. Demonstrated that activation of microglia by LPS stimulates the PI3K/AKT pathway, promoting glycolysis and inflammation associated with neurodegeneration. Importantly, the release of proinflammatory cytokines from LPS-activated microglia can be inhibited by opioids [31,32]. Consistent with these findings, we have previously shown that the opioid agonists DAMGO, DADLE, and U-50488 exert anti-inflammatory and antioxidant effects by modulating Nrf2/HO-1 signaling in LPS-activated microglia [9].
It is well established that microglial cells can undergo an aging process and enter a senescent state in response to neuropathological conditions as well as during normal aging [33]. Senescent microglia are characterized by increased production of ROS, reduced phagocytic capacity, and elevated release of proinflammatory cytokines [34]. Moreover, an in vitro model of microglial senescence has demonstrated that aged microglial cells exhibit increased endoplasmic reticulum stress and impaired autophagy in response to iron accumulation [35]. These age-associated dysfunctions can negatively impact surrounding cells, thereby accelerating cellular senescence and contributing to the progression of neurodegenerative conditions. Elucidating previously unexplored mechanisms regulating autophagy in microglia may therefore reveal novel therapeutic targets for the treatment of age-related neurological disorders.
In the present study, we employed C8-B4 microglial cells to examine the effects of selected opioid agonists (DAMGO, DADLE, and U-50488) on autophagy and cellular senescence. Additionally, we investigated the potential role of the PI3K/AKT signaling pathway in modulating autophagic flux in the LPS-induced senescence phenotype.
The murine microglial cell line C8-B4 was obtained from the American Type Culture Collection (ATCC®, CRL-2540™, Manassas, VA, USA). These cells underwent STR testing and were confirmed to be mycoplasma-free. Agonists of the μ-, δ-, and κ-opioid receptors (DAMGO (E7384), DADLE (E7131), and U-50488 (U111)), as well as lipopolysaccharide (LPS; Escherichia coli 055:B5 (L4524)), were purchased from Sigma-Aldrich (St. Louis, MO, USA). Fetal bovine serum (FBS) was obtained from Gibco (ThermoFisher Scientific, Waltham, MA, USA). Protran nitrocellulose membranes (BA83, BA85) were purchased from Schleicher & Schuell BioScience (Dassel, Germany), and disposable plasticware was supplied by ThermoFisher Scientific (Waltham, MA, USA). All remaining chemicals were purchased from Merck KGaA (Darmstadt, Germany) and were of the highest available purity grade.
2.2 Cell Culture and Treatment
C8-B4 microglial cells were cultured in Dulbecco’s Modified Eagle Medium (DMEM) supplemented with 10% fetal bovine serum (FBS), 100 U/mL penicillin, 10 μg/mL streptomycin, and 25 μg/mL amphotericin B. Cells were maintained at 37°C in a humidified incubator with 5% CO2 in air. For all experiments, cells were either left untreated (control) or pretreated with 1 μM concentrations of the selected opioid agonists (DAMGO, DADLE, and U-50488) for 1 h, followed by incubation with the inflammagen LPS (1 μg/mL) for 24 h. The 1 μM working concentration was selected on the basis of our previous studies in the same C8-B4 model, in which DAMGO, DADLE, and U-50488 showed no detectable cytotoxicity and reproducible protective responses across the tested concentration ranges. This condition was used to model acute inflammatory activation, and all experiments, except the senescence assays, were conducted under this acute treatment paradigm. Because cellular senescence cannot be robustly induced by a single acute exposure to LPS, a modified chronic stimulation protocol was employed. In this approach, cells were repeatedly treated with LPS (250 ng/mL every 24 h) over several days to generate a sustained inflammatory stimulus, resulting in a cumulative effect comparable to prolonged exposure while minimizing excessive cytotoxicity associated with continuous high-dose treatment. This approach is consistent with previously described models of microglial senescence [36]. In addition, to mimic long-term low-grade inflammatory conditions, cells were exposed to a lower concentration of LPS (100 ng/mL) over an extended period (up to 9–10 days), allowing the development of a chronic senescence-like phenotype. These experimental paradigms enabled differentiation between acute inflammatory responses and prolonged microglial dysfunction under controlled conditions. For senescence experiments involving prolonged LPS exposure, cells were seeded at a defined density (approximately 1 × 10⁵ cells per well in 12-well plates) to ensure consistent growth conditions and to avoid overconfluency during the course of the experiment.
The percentage of cells undergoing apoptosis was determined by flow cytometric analysis using Annexin V and Hoechst 33258 staining. C8-B4 cells were seeded in 12-well plates at a density of 1 × 10⁵ cells per well and incubated for 48 h before experimental treatments. Following drug treatment, cells were harvested by trypsinization with 2% trypsin, washed twice with 0.01 M phosphate-buffered saline (PBS, pH 7.4), and resuspended in Annexin Binding Buffer (ABB; Apronex, Vestec, Czechia). Subsequently, 2.5 μL of Dyomics 647-labeled Annexin V (EXB0023; Exbio, Vestec, Czechia) was added to each sample, and the cells were incubated on ice in the dark for 30 min. After incubation, the cells were washed once with ABB and stained with Hoechst 33258 (94403; Sigma-Aldrich (St. Louis, MO, USA) at a final concentration of 1 μg/mL. Fluorescence was measured using a BD LSR II flow cytometer (BD Biosciences, Franklin Lakes, NJ, USA), and data were analyzed using FlowJo software (version 10.3; Waters Corporation, Oregon, USA).
2.4 Measurement of Mitochondrial Membrane Potential and Mitochondrial Mass
Mitochondrial membrane potential (MMP, ΔΨm) and mitochondrial mass were assessed using the fluorescent dyes MitoTracker Red CMX (M7512; ThermoFisher Scientific (Waltham, MA, USA) and MitoTracker Green (M7514; ThermoFisher Scientific (Waltham, MA, USA), respectively. MitoTracker Red fluorescence is dependent on membrane potential, while MitoTracker Green accumulates in mitochondria independently of MMP, making it suitable for evaluating mitochondrial mass. Approximately 1 × 10⁵ cells, previously subjected to the respective experimental treatments, were seeded into 12-well plates. Both MitoTracker dyes were added to the cells at a final concentration of 40 nM, and the plate was incubated at 37°C in the dark for 30 min. Following incubation, cells were harvested by trypsinization (0.25% trypsin), washed with phosphate-buffered saline (PBS), and analyzed using a BD LSR II flow cytometer (BD Biosciences, Franklin Lakes, NJ, USA). Data analysis was performed using FlowJo software (version 10.3). As part of the additional revised analysis, MMP was assessed exclusively in the apoptotic cell population (Annexin V+/Hoechst+) using Kaluza 2.2 software (Beckman Coulter, Brea, CA, USA).
2.5 Measurement of Mitochondrial ROS Production
C8-B4 cells were seeded onto glass-bottom dishes and maintained in DMEM supplemented with 10% FBS. Mitochondrial ROS levels were assessed in live cells using MitoSOX Red (M36008; ThermoFisher Scientific (Waltham, MA, USA) and an inverted Zeiss LSM 880 confocal laser scanning microscope (Carl Zeiss AG, Oberkochen, Germany), equipped with a 20×/1.2 WDICIII C Apochromat objective lens and a back-thinned CCD camera (Zeiss Axio Cam). Cells were pretreated with opioid ligands as described above, followed by LPS treatment for 24 h. Subsequently, cells were incubated with MitoSOX (5 μg/mL) for 30 min in the dark, washed twice with 1x PBS (pH 7.4), and fixed with 4% paraformaldehyde. Fluorescence was then visualized using confocal microscopy. Image analysis was carried out using ImageJ software (version 1.6v; NIH, Bethesda, MD, USA).
2.6 Measurement of Intracellular Calcium Levels
Intracellular Ca2+ levels were measured using the fluorescent calcium indicator Fluo-4 AM. C8-B4 cells were incubated with 5 μM Fluo-4 AM (F14201; Invitrogen/Thermo Fisher Scientific, Waltham, MA, USA) for 30 min at 37°C, followed by a minimum of 20 min in Hanks’ Balanced Salt Solution (HBSS) to allow complete de-esterification of the dye. Nifedipine (N7634; Sigma-Aldrich (St. Louis, MO, USA) was used as a calcium channel blocker at a concentration of 1 μM. Fluo-4 was excited at 481 nm, and fluorescence emission was measured at 530 nm using a BD LSR II flow cytometer (BD Biosciences, Franklin Lakes, NJ, USA). Data were analyzed using FlowJo software (version 10.3).
2.7 Flow Cytometric Analysis of CD-86 Surface Marker Expression
Cells were washed with PBS (0.01 M; pH 7.4) and resuspended to a concentration of 1 × 10⁶ cells/mL. They were then incubated with a PE-conjugated antibody against the proinflammatory marker CD86 (MCA2874A488, Biorad, Life Technologies Corporation, Carlsbad, CA, USA) at 37°C for 30 min. After staining, cells were washed twice with PBS and analyzed using a BD LSR II flow cytometer (BD Biosciences, Franklin Lakes, NJ, USA). Data were analyzed using FlowJo software (version 10.3).
Nitric oxide (NO) production was quantified using the Griess assay. C8-B4 cells were treated with LPS (250 ng/mL) every 24 h for 3 days, followed by incubation with opioid ligands for an additional 24 h. Subsequently, 50 μL of the cell culture medium was collected and combined with an equal volume of Griess reagent (0.1% N-1-naphthylethylenediamine dihydrochloride and 1% sulfanilamide in 5% phosphoric acid) in a 96-well plate. The mixture was incubated for 10 min at room temperature, and absorbance was measured at 540 nm using a microplate reader (BioTek Synergy HT, Winooski, VA, USA).
2.9 Assessment of Total Antioxidant Capacity
The total antioxidant capacity was determined in cell homogenates using a commercially available antioxidant assay kit (709001; Cayman Chemical Company, Ann Arbor, MI, USA), according to the manufacturer’s instructions. This assay is based on the ability of antioxidants present in the sample to inhibit the oxidation of ABTS (2,2′-azino-bis(3-ethylbenzothiazoline-6-sulfonic acid) by metmyoglobin. The resulting decrease in absorbance at 405 nm is proportional to the antioxidant concentration. The assay was calibrated using Trolox, and results are expressed as micromoles of Trolox equivalents per liter (μmol Trolox Equiv/L).
2.10 Assessment of Cellular Senescence
For the assessment of cellular senescence, β-galactosidase activity was measured as a classical marker. The substrate 5-bromo-4-chloro-3-indolyl β-D-galactopyranoside (X-gal), an analog of lactose, is cleaved by β-galactosidase to produce 5-bromo-4-chloro-indoxyl, which forms an insoluble bright blue precipitate within the cells, visible under a light microscope. Cells were stained using the Senescence Cells Histochemical Staining Kit (CS0030; Sigma-Aldrich) following the manufacturer’s protocol. Briefly, cells were washed with PBS (0.01 M; pH 7.4), fixed with the provided fixation buffer, and incubated with 2 mL of staining solution. The plates were then incubated overnight at 26°C, and staining was evaluated the following day by light microscopy (AIF 5114i-T, Arsenal, Prague, Czechia).
Western blot experiments were performed following established protocols [37]. Briefly, cells were lysed using RIPA buffer supplemented with protease inhibitors (04693116001; cOmplete protease inhibitor cocktail; Sigma-Aldrich). Protein concentration was determined using the BCA assay (BCA1-1KT; Merck, Darmstadt, Germany). Equal amounts of protein lysates were mixed with Laemmli sample buffer and heated at 95°C for 2 min before loading onto polyacrylamide gels. Electrophoresis was carried out using a Mini-Protean II system (Bio-Rad, Hercules, CA, USA) at a constant voltage of 200 V for approximately 60 min, until the dye front reached the bottom of the gel. Proteins were then transferred onto nitrocellulose membranes (0.45 μm or 0.2 μm pore size). Membranes were blocked for 1 h at room temperature in 5% skim milk dissolved in TBS-T buffer (10 mM Tris, 150 mM NaCl, 1% Tween 20, pH 8.0), followed by overnight incubation at 4°C with primary antibodies. The following primary antibodies from Santa Cruz Biotechnology (Dallas, TX, USA) were used: anti-SQSTM1 (sc-48402), anti-beclin-1 (sc-48341), anti-ATG5 (sc-133158), anti-ATG7 (sc-376212), anti-PI3-kinase (sc-293115), anti-β-actin (sc-47778), anti-AKT (sc-8312), anti-phospho-AKT (sc-33437), and anti-MAP-LC3B (sc-27162). Antibodies against PI3-kinase (4257S), mTOR (2983S), and phospho-mTOR (2971S) were purchased from Cell Signaling Technology (Danvers, MA, USA). Anti-p53 (A19585) antibody was obtained from Abclonal (Düsseldorf, Germany), and anti-p21 (ab109520) and anti-p16 (ab51243) antibodies were from Abcam (Cambridge, UK). All antibodies were diluted 1:2000 except β-actin (1:5000). After washing with TBS-T, membranes were incubated for 1 h at room temperature with species-specific horseradish peroxidase-conjugated secondary antibodies: anti-mouse (NA931; Amersham, Buckinghamshire, UK), anti-rabbit (NA934; Amersham, Buckinghamshire, UK), or anti-goat (sc-2354; Santa Cruz Biotechnology, Dallas, TX, USA) diluted 1:10,000. Following washes to remove unbound antibodies, membranes were incubated with SuperSignal chemiluminescent substrate (34075; Pierce Biotechnology, Rockford, IL, USA) for 1 min. Chemiluminescent signals were detected and quantitatively analyzed using ImageJ software. Data were normalized to β-actin protein expression. Some proteins were analyzed on the same nitrocellulose membranes following a stripping procedure; therefore, proteins examined on the same membrane shared the same β-actin loading control for normalization. Membranes were stripped by incubation in a mild stripping buffer containing 1.5% (w/v) glycine, 1% (w/v) sodium dodecyl sulfate, and 1% (v/v) Tween-20 (pH 2.2) for 45 min at room temperature. Following stripping, membranes were washed with TBS–T buffer for 30 min at room temperature before blocking and subsequent incubation with primary antibodies.
All experiments were conducted with at least three independent biological replicates (n = 3), unless otherwise stated. Data plotting, calculations, and statistical analyses were performed using GraphPad Prism software (version 10.1.0; GraphPad Software, San Diego, CA, USA). All results are presented as mean ± standard error of the mean (SEM) from at least three independent experiments. Statistical differences between experimental groups were assessed using one-way analysis of variance (ANOVA) followed by Tukey’s multiple comparisons post hoc test. Where applicable, two-way ANOVA was conducted to evaluate the effects of LPS treatment and opioid receptor agonists, as well as their interaction. The results of the two-way ANOVA were consistent with those obtained using one-way ANOVA, and no significant interaction effects altered the overall interpretation of the data. A p-value of less than 0.05 was considered statistically significant.
3.1 Opioid Agonists Prevent Apoptosis and LPS-Induced Increases in Cellular Calcium Levels
First, we investigated the effects of LPS and opioid receptor (OR) agonists on apoptotic signaling in C8-B4 cells. Cells were divided into different treatment groups, either pretreated with opioid ligands or left untreated, followed by stimulation with LPS for 24 h in selected groups. Apoptotic changes were assessed by flow cytometry. LPS stimulation significantly decreases the percentage of surviving cells (Fig. 1A,B). However, this reduction was markedly attenuated by pretreatment with DAMGO, DADLE, and U-50488. At a concentration of 1 μM, these ligands substantially prevented or significantly reduced LPS-induced apoptosis in C8-B4 cells, indicating a protective effect. The pro-apoptotic effect of LPS was even more pronounced after 72 h of incubation, and the protective effects of OR agonists were maintained under these conditions (Supplementary Fig. S1). We have previously demonstrated under the same experimental conditions that C8-B4 cells exhibit stable proliferation and viability for up to 72 h in the presence of the tested OR agonists [36].
Additionally, LPS treatment caused a significant (~50%) increase in fluorescence intensity in cells loaded with the calcium-sensitive dye Fluo-4 AM, indicating elevated intracellular Ca2+ levels. Importantly, pretreatment with OR agonists effectively blocked the LPS-induced calcium influx (Fig. 1C,D). Treatment with DAMGO, DADLE, or U-50488 alone did not affect basal Ca2+ levels (Supplementary Fig. S2A,B). Moreover, the LPS-induced Ca2+ influx was abolished in the presence of the calcium channel blocker nifedipine, indicating that these channels play a critical role in mediating Ca2+ entry.

Figure 1: Effects of LPS and opioid agonists on apoptosis and intracellular calcium levels in C8-B4 microglial cells. Cells were pretreated with 1 μM of DAMGO, DADLE, or U-50488 for 1 h, followed by incubation with LPS (1 μg/mL) for an additional 24 h. Apoptosis was assessed using Annexin V and Hoechst 33258 staining (A,B). Intracellular Ca2+ levels were measured using Fluo-4 dye in cells pretreated with opioid agonists at 1 μM concentration ((C,D); 1 μM Nifedipine (ND) used as positive control). Data represent the mean ± SEM from three independent experiments. Statistical significance: *p < 0.05, **p < 0.01, ***p < 0.001 versus control; #p < 0.05, ##p < 0.01, ###p < 0.001 versus LPS-treated group.
3.2 Opioid Agonists Prevent Excessive Mitochondrial ROS Production Induced by LPS
The mitochondrial ROS generation was assessed by confocal microscopy using the MitoSOX Red probe (Fig. 2A). Exposure of C8-B4 cells to LPS caused a significant (6-fold) increase in MitoSOX fluorescence intensity, indicating elevated mitochondrial ROS production. Opioid agonist treatment reduced this signal by approximately 40–50%, although the magnitude of the effect differed among ligands and endpoints (Fig. 2B). We further evaluated the effect of these OR agonists on the total antioxidant capacity of C8-B4 cells using the ABTS decolorization assay. While DAMGO and U-50488 treatments had no significant effect, DADLE treatment markedly increased the total antioxidant capacity. On the other hand, LPS exposure caused a significant reduction (approximately 40%) in total antioxidant capacity, an effect that was strongly attenuated by pretreatment with all tested OR agonists (Fig. 2C). In addition, DAMGO, DADLE, and U-50488 decreased the expression of the proinflammatory marker CD86, which was markedly upregulated in LPS-stimulated cells (Supplementary Fig. S2C,D). This indicates that these opioid agonists effectively counteracted the inflammatory effects of LPS.
Mitochondrial membrane potential and mitochondrial mass were measured by flow cytometry after staining C8-B4 cells with MitoTracker Red and MitoTracker Green, respectively. LPS treatment significantly reduced the fluorescence intensities of both dyes by approximately 50–70%, reflecting decreased mitochondrial membrane potential and mitochondrial mass (Fig. 2D,E). Importantly, these LPS-induced adverse effects were significantly ameliorated by pretreatment with opioid agonists (Fig. 2F,G). Treatment with opioid agonists alone did not alter mitochondrial mass or membrane potential (Supplementary Fig. S2E–H). Additional assessment of MMP and ROS in the apoptotic cell population revealed a marked reduction in MMP and an increase in ROS, both of which were partially prevented by pretreatment with opioids (Supplementary Fig. S3).

Figure 2: Effects of opioid agonists on mitochondrial ROS, mitochondrial mass, mitochondrial membrane potential, and antioxidant capacity in the presence of LPS in C8-B4 microglial cells. Cells were pretreated with 1 μM of DAMGO, DADLE, or U-50488 for 1 h, followed by incubation with LPS (1 μg/mL) for an additional 24 h. Mitochondrial ROS levels were assessed using MitoSOX Red dye via confocal microscopy (A,B). Total antioxidant capacity was determined using a commercial antioxidant assay kit (C). Mitochondrial mass and membrane potential were measured by flow cytometry using MitoTracker Green (D,E) and MitoTracker Red (F,G), respectively. Data represent the mean ± SEM of three independent experiments. Statistical significance: *p < 0.05, **p < 0.01 versus control; #p < 0.05, ##p < 0.01, ###p < 0.001 versus LPS-treated group. Scale bar: 50 μm (2A).
3.3 Opioid Agonists Suppress LPS-Induced Cellular Senescence and Nitric Oxide Production
Microglial senescence was assessed using β-galactosidase (SA-β-Gal) staining. LPS stimulation significantly (4-fold) increased the number of β-Gal-positive cells, indicating enhanced senescence. Treatment with DAMGO, DADLE, or U-50488 alone did not induce senescence; however, treatment with these OR agonists significantly attenuated LPS-induced senescence by approximately 50% (Fig. 3A,B). Moreover, treatment with opioid agonists markedly decreased the LPS-induced elevation in NO production by approximately 30–50% (Fig. 3C). Consistently, LPS upregulated the expression of senescence markers p16, p21, and p53 by approximately 50–70% (Fig. 3D). Notably, pretreatment with OR ligands significantly prevented this upregulation of senescence-associated proteins (Fig. 3E–G). The strong ability of OR agonists to reduce cellular senescence was confirmed in an additional experiment in which C8-B4 cells were treated with LPS (100 ng/mL) for 9 days. All tested OR agonists suppressed the number of senescent cells by about 50% (Supplementary Fig. S4).

Figure 3: Effects of LPS and opioid agonists on cellular senescence in C8-B4 microglial cells. Cells were treated with LPS (250 ng/mL) every 24 h for 72 h to induce senescence, followed by incubation with opioid ligands (DAMGO, DADLE, U-50488; 1 μM) for 24 h. This extended protocol was necessary because senescence cannot be reliably induced within 24 h. Senescent cells were detected by β-galactosidase (β-Gal) staining (A,B). NO production was measured using the Griess reagent assay (C). Protein expression levels of senescence markers p16, p21, and p53 were analyzed by Western blotting (D), with quantification of relative protein levels expressed as fold change compared to control for p16 (E), p21 (F), and p53 (G). Data represent the mean ± SEM from three independent experiments. Statistical significance: *p < 0.05, **p < 0.01, ****p < 0.0001 versus control; #p < 0.05, ##p < 0.01, ####p < 0.0001 versus LPS-treated group. Scale bar: 100 μm (3A).
3.4 Opioid Agonists Promote Autophagy in Microglia
Autophagy plays a crucial role in regulating microglial function [22]. To determine whether opioids modulate autophagy in microglial cells, we investigated the effects of OR agonists on autophagy-related protein expression in C8-B4 microglial cells. Cells were treated with the tested OR agonists and LPS for 24 h. The expression levels of autophagy-associated proteins, including p62/SQSTM1, beclin-1, ATG5, ATG7, and MAP-LC3, were assessed by Western blotting. (Fig. 4A). While p62 levels were decreased (by approximately 25%) in response to DAMGO and DADLE pretreatment, indicating suppression of LPS-induced accumulation of this autophagy-related substrate (Fig. 4B), opioid pretreatment significantly upregulated the expression of beclin-1, ATG5, ATG7, and MAP-LC3 by approximately 1,5-3,5-fold compared to cells treated with LPS alone (Fig. 4C–F). These findings suggest that opioids promote autophagy-related activity in microglial cells, potentially contributing to the modulation of LPS-induced inflammatory responses.

Figure 4: Effect of opioid agonists on the expression of autophagy markers in C8-B4 microglial cells. Cells were pretreated with opioid ligands (DAMGO, DADLE, U-50488) at a concentration of 1 μM for 1 h, then incubated with or without LPS (1 μg/mL) for an additional 24 h. Protein levels of autophagy markers p62, beclin-1, MAP-LC3, ATG5, and ATG7 were analyzed by Western blotting (A). Quantification of relative protein expression is shown as fold changes compared to control for p62 (B), beclin-1 (C), MAP-LC3 (D), ATG5 (E), and ATG7 (F). Data represent the mean ± SEM from three independent experiments. Statistical significance: *p < 0.05, **p < 0.01 versus control; #p < 0.05, ##p < 0.01, ###p < 0.001 versus LPS-treated group.
3.5 Opioid Agonists Inhibit the PI3K/AKT/mTOR Pathway
To better understand the mechanism by which opioid agonists regulate autophagy, we analyzed the levels of phosphorylated PI3K (p-PI3K), total PI3K, phosphorylated AKT (p-AKT), total AKT, phosphorylated mTOR (p-mTOR), and total mTOR by Western blotting. Whereas LPS treatment of C8-B4 cells significantly increased the levels of p-PI3K, p-AKT, and p-mTOR, pretreatment with OR ligands markedly reduced the levels of these phosphorylated proteins (Fig. 5A). No significant changes were observed in total expression levels of PI3K, AKT, or mTOR. Therefore, the observed differences in the ratios of phosphorylated to total proteins (Fig. 5B–D) reflect alterations in phosphorylation levels rather than changes in overall protein abundance. These findings suggest that opioid agonists may promote autophagy by inhibiting the PI3K/AKT/mTOR signaling pathway.

Figure 5: Effects of LPS and opioid agonists on activation of the AKT/PI3K/mTOR pathway in C8-B4 microglial cells. Cells were pretreated with opioid ligands (DAMGO, DADLE, U-50488) at a concentration of 1 μM for 1 h, then incubated with or without LPS (1 μg/mL) for an additional 24 h. Protein levels of p-mTOR/mTOR, p-PI3K/PI3K, and p-AKT/AKT were analyzed by Western blotting (A). Quantitative data on relative protein expressions are presented as the ratios of p-mTOR/mTOR (B), p-PI3K/PI3K (C), and p-AKT/AKT (D). Data represent the mean ± SEM from three independent experiments. Statistical significance: **p < 0.01, ***p < 0.001 versus control; #p < 0.05, ##p < 0.01 versus LPS-treated group.
One of the primary objectives of this study was to investigate the effects of the OR agonists DAMGO, DADLE, and U-50488 on mitochondrial function, autophagy-related signaling, and cellular senescence-associated changes in C8-B4 microglial cells challenged with LPS. Our findings demonstrate that LPS induces apoptosis in microglial cells, whereas pretreatment with opioid ligands significantly attenuates this effect. Furthermore, opioid treatment inhibited the LPS-induced phosphorylation of PI3K, AKT, and mTOR, suggesting that OR activation interferes with key proinflammatory signaling pathways. The present results provide further insight into the mechanisms by which opioids modulate LPS-induced elevations in intracellular Ca2+ levels and NO production—both recognized contributors to neurotoxicity. In addition, our data indicate that OR activation enhances autophagic-related activity and reduces mitochondrial ROS production, thereby promoting cellular protection. These findings are consistent with our previous observations that OR ligands possess immunomodulatory and antioxidant properties [32].
We demonstrated the cytoprotective effects of the tested opioid agonists by showing their ability to prevent LPS-induced apoptosis. The observed increase in intracellular Ca2+ levels following LPS stimulation is consistent with the activation of the cAMP response element-binding protein (CREB) signaling pathway, which is initiated through CREB phosphorylation by kinases such as PKA, PKC, and Ca2+/calmodulin-dependent kinases [38,39]. This phosphorylation event plays a critical role in driving inflammatory responses, including the upregulation of interleukin-6 (IL-6) expression. Our results demonstrate that pretreatment with opioid agonists significantly attenuates the LPS-induced rise in intracellular Ca2+ levels in C8-B4 microglial cells, underscoring a key regulatory role of opioid signaling in modulating calcium-dependent inflammatory pathways. LPS-driven microglial activation is known to disrupt intracellular calcium homeostasis, subsequently impairing mitochondrial function [24,40]. To further investigate this connection, we assessed mitochondrial mass and membrane potential following LPS exposure. LPS stimulation led to a pronounced increase in intracellular Ca2+, accompanied by a marked reduction in both mitochondrial mass and membrane potential, indicative of mitochondrial dysfunction. Importantly, opioid pretreatment preserved mitochondrial integrity by preventing the loss of membrane potential and mitigating ROS production—findings that align with earlier reports [41,42,43]. These data collectively highlight the central role of calcium regulation and mitochondrial dynamics in modulating the microglial inflammatory response to LPS and further support the potential of opioid agonists as modulators of neuroinflammation.
Chronic microgliosis, commonly observed in neuropathic pain, drives microglia toward a senescent phenotype, thereby impairing their physiological functions [44]. Notably, senescent microglia have been implicated in the pathogenesis of various neurodegenerative disorders [45]. Emerging evidence suggests that opioids may counteract cellular senescence [46,47,48]. Importantly, senescence develops more slowly than acute inflammatory responses such as apoptosis, ROS production, or autophagic changes, which can be detected within 24 h. To capture this chronic phenotype, we applied repeated low-dose LPS stimulation over 72 h, a well-established approach to induce senescence in microglia. Only after this induction period were cells treated with opioid agonists. Using this model, we observed a significant upregulation of senescence-associated markers (p21, p16, p53), increased β-galactosidase activity, and elevated NO production. Remarkably, opioid agonist treatment attenuated the expression of these senescence markers and reduced β-galactosidase activity, consistent with a partial reversal of the senescence-associated phenotype under the present in vitro conditions for opioids under chronic inflammatory conditions. This approach, therefore, allowed us to clearly distinguish acute inflammatory changes from more persistent, senescence-associated alterations and to evaluate how opioids modulate the latter. Although senescence-associated markers were monitored under these conditions, detailed validation of autophagy and PI3K/AKT/mTOR signaling in chronically senescent microglia was not performed in the present study. Future investigations will be required to determine whether the same molecular mechanisms underlie the protective effects of opioids against cell damage induced by acute and chronic inflammatory conditions.
Our findings suggest that opioid agonists may counteract LPS-induced microglial senescence by enhancing autophagic processes. Supporting this idea, recent studies have underscored the importance of microglial autophagy in maintaining amyloid plaque homeostasis and mitigating cellular senescence [18]. As a fundamental cellular mechanism, autophagy plays a dual role in health and disease, contributing to the pathogenesis or resolution of conditions such as neurodegeneration, aging, and inflammatory disorders [19,49,50]. Although autophagy may lead to cell death under certain conditions, it more commonly serves a cytoprotective function—suppressing apoptosis and enhancing cellular resilience during stress or therapeutic intervention [51]. Autophagy is characterized by the lysosomal degradation of cytoplasmic constituents [52], and growing evidence indicates that it can be stimulated by opioid receptor activation [12,13]. However, its role in modulating LPS-induced inflammation in microglial C8-B4 cells has not been clearly defined. Here, opioid agonist exposure was associated with increased MAP-LC3-related signal and reduced p62 accumulation, as indicated by increased MAP-LC3 puncta formation, an elevated LC3-II/LC3-I ratio, and reduced expression of p62/SQSTM1. These observations are consistent with previous reports of opioid-induced autophagy across various cell types, including SH-SY5Y neuroblastoma cells, hippocampal neurons, brain endothelial cells, and lung cancer cells [11,53,54]. By promoting the clearance of dysfunctional mitochondria and misfolded proteins, autophagy limits the generation of ROS and prevents activation of the NF-κB signaling cascade, which drives the release of proinflammatory and senescence-associated cytokines such as IL-1β and IL-6 [55]. This mechanism is consistent with our findings showing that OR activation attenuated the LPS-induced expression of p21, p16, and p53 and reduced β-galactosidase activity.
Autophagy serves as a fundamental mechanism through which microglia preserve cellular integrity and resist the onset of LPS-induced senescence [18]. In the present study, LPS stimulation impaired autophagic flux, as evidenced by p62 accumulation and reduced expression of ATG5, ATG7, and beclin-1, whereas OR restored these markers and increased LC3-II formation, indicating autophagy reactivation. By facilitating the clearance of dysfunctional mitochondria and protein aggregates, enhanced autophagy reduces ROS production and prevents DNA damage, two major inducers of the senescent phenotype. These findings align with recent reports showing that loss of microglial autophagy promotes a pro-inflammatory, senescent state and accelerates amyloid-β accumulation in neurodegenerative contexts [18,56]. Functionally, restored autophagy mitigates NF-κB pathway activation, limits IL-1β and IL-6 secretion, and suppresses the expression of p16, p21, and p53 [57]. Thus, autophagy enhancement by OR agonists interrupts the self-reinforcing cycle of inflammation, oxidative stress, and mitochondrial dysfunction that drives LPS-induced microglial senescence, thereby contributing to sustained cellular and neuroimmune homeostasis.
Autophagy and senescence are distinct yet closely interconnected processes in microglia [58]. Autophagy functions as a protective, energy-dependent mechanism that maintains cellular homeostasis by clearing damaged mitochondria and misfolded proteins, thereby limiting oxidative stress and inflammation. In contrast, senescence represents a permanent state of growth arrest characterized by elevated p16, p21, and p53 expression and secretion of proinflammatory cytokines [18,56,59]. Impaired autophagic flux promotes the accumulation of cellular damage and triggers senescence-associated pathways. Consistent with recent findings [18], our data suggest that enhanced autophagy-related changes through OR activation prevent microglial senescence by preserving mitochondrial function and suppressing chronic inflammatory signaling.
LPS exposure suppressed autophagic activity in C8-B4 microglia, as evidenced by p62 accumulation and reduced LC3-II expression, which is consistent with reports that TLR4 activation inhibits FOXO3-mediated autophagy initiation [60,61,62]. Whether opioids stimulate or inhibit autophagy appears to depend on multiple factors, including cell type, receptor repertoire, duration of exposure, and the inflammatory or metabolic context. In the present C8-B4/LPS model, opioid receptor activation was associated with a protective autophagy-related response rather than suppression. This is consistent with previous reports demonstrating both stimulatory and inhibitory effects of opioids on autophagy, highlighting the context-dependent nature of this process [13,63]. Under LPS-induced inflammatory and oxidative stress conditions, microglial cells activate adaptive mechanisms to maintain cellular homeostasis, and autophagy plays a key role in the removal of damaged mitochondria and other cellular components. In this setting, opioid receptor activation may promote cytoprotective signaling pathways that favor autophagy-associated processes. Variability across studies may therefore reflect differences in receptor subtype engagement, downstream signaling pathways, and cell-type-specific responses. An additional important aspect of the present study is the use of distinct treatment sequences across experimental paradigms. In acute experiments, opioid receptor agonists were administered before LPS stimulation to assess their effects on early inflammatory responses. In contrast, in the senescence model, opioid agonists were applied after prolonged LPS exposure, following the establishment of a senescence-like phenotype. This post-treatment design was intentionally employed to evaluate the ability of opioid receptor activation to attenuate established microglial dysfunction. Importantly, this approach enhances the translational relevance of the findings, as it more closely reflects a therapeutic intervention strategy rather than a purely preventive model.
We also observed a reduction in AKT and mTOR phosphorylation following opioid treatment. Given that the PI3K/AKT/mTOR axis is a central negative regulator of autophagy [64,65], these findings support the notion that the observed autophagy-related changes are consistent with inhibition of this pathway. Pharmacological mTOR inhibitors like rapamycin similarly induce autophagy and reduce downstream signaling [66,67]. Autophagy inhibition, conversely, can enhance LPS-induced inflammasome activation through the NLRP3 pathway [68]. Our results suggest that opioids promote autophagy and suppress mTOR activity, which may protect microglia from LPS-induced toxicity in part by modulating NO production. It is worth noting that autophagy plays an essential role in eliminating dysfunctional mitochondria, aggregated proteins, and excessive ROS, which are key drivers of DNA damage and neurodegeneration. Impaired autophagy exacerbates the pathology of many neurodegenerative diseases. Thus, the interplay between microglial inflammation, OR signaling, and autophagy emerges as an important mechanism that can play a role in CNS injury, chronic neurodegeneration, and repair. Further research into how opioids regulate these processes could provide valuable therapeutic insights for conditions marked by excessive microglial activation.
A key consideration in interpreting the present findings is the use of distinct experimental paradigms to model acute inflammatory responses and chronic senescence. In this study, autophagy-related signaling and early cellular responses were assessed under acute LPS stimulation, whereas cellular senescence was induced using repeated or prolonged LPS exposure to better reflect chronic inflammatory conditions. While these approaches are well established for modeling different aspects of microglial activation, they do not allow for a direct mechanistic linkage between autophagy induction and senescence attenuation within the same experimental framework. Therefore, although the observed modulation of autophagy-related markers and PI3K/AKT/mTOR signaling is consistent with a protective role of autophagy in mitigating microglial dysfunction, the relationship between these processes should be interpreted as correlative rather than causal. Future studies employing matched chronic paradigms and additional mechanistic approaches will be required to establish a direct causal link between opioid-mediated autophagy regulation and the suppression of microglial senescence.
Notably, the effects of OR agonists observed in this study partially varied among ligands and molecular endpoints. While DAMGO, DADLE, and U-50488 each attenuated LPS-induced oxidative stress, apoptosis, and senescence, the magnitude of these effects differed across markers. DADLE showed the strongest antioxidant response, whereas U-50488 was more effective in preserving MMP. Such variability likely reflects receptor subtype–specific coupling to distinct intracellular signaling cascades, as previously reported in microglial models [32,69,70]. These findings highlight the complexity of OR signaling and suggest ligand-selective regulation of microglial function. While these findings highlight the potential of opioid receptor modulation as a strategy to regulate microglial function under inflammatory conditions, several important limitations should be considered when interpreting their translational relevance. The present study was conducted in an in vitro microglial model, which may not fully capture the complexity of the in vivo neuroimmune environment. Furthermore, the clinical application of opioids is constrained by well-documented adverse effects, including tolerance, dependence, and risk of misuse. Therefore, although the modulation of autophagy- and senescence-associated pathways by opioid receptor signaling represents an intriguing therapeutic concept, further studies in primary microglia and in vivo models are required to evaluate both efficacy and safety in a physiological context.
The present study has several limitations. First, receptor antagonist experiments were not performed, so receptor-specific causality cannot be directly confirmed. Second, late-stage autophagic flux was not assessed using lysosomal inhibitors such as bafilomycin A1 or chloroquine; therefore, the autophagy-related findings should be interpreted as changes consistent with increased autophagy-related activity rather than definitive measurements of autophagic flux. Third, autophagy and senescence endpoints were evaluated in different experimental paradigms, which limits a direct causal linkage between these processes. Finally, the study was performed in an immortalized microglial cell line with a limited phenotypic panel and therefore requires validation in primary microglia and in vivo models.
Collectively, our findings demonstrate that LPS-induced cellular senescence in microglia can be attenuated by opioid receptor (OR) activation. The protective effects mediated by ORs involve modulation of the PI3K/AKT/mTOR signaling pathway and are associated with increased autophagy-related activity, thereby mitigating cellular senescence, mitochondrial dysfunction, and oxidative stress while promoting neuroprotective outcomes. These results provide novel mechanistic insights into how selective OR agonists regulate microglial responses under inflammatory conditions. Notably, the observed ability of OR agonists to suppress mitochondrial damage and maintain autophagic balance extends the current understanding of the neuroprotective potential of opioids beyond their classical analgesic roles. Importantly, our findings suggest that OR activation may contribute to preserving microglial homeostasis and promoting cellular resilience in neuroinflammatory environments. From a translational perspective, modulation of autophagy- and senescence-associated pathways by opioids may represent a promising therapeutic avenue for neurodegenerative disorders such as Alzheimer’s and Parkinson’s diseases, where chronic microglial activation and impaired cellular clearance mechanisms are central pathological features.
However, these conclusions should be interpreted with caution. The study was conducted in an immortalized C8-B4 microglial cell line, which may not fully recapitulate the complexity of primary microglia or in vivo systems. In addition, although changes in p62, beclin-1, ATG5, ATG7, MAP-LC3, and PI3K/AKT/mTOR signaling are consistent with enhanced autophagy-related activity, direct confirmation of late-stage autophagic flux using lysosomal inhibitors was not performed, and receptor-specific antagonist validation was not included. Furthermore, autophagy and senescence were assessed under distinct experimental paradigms (acute versus chronic LPS exposure), limiting direct causal interpretation of their relationship. Importantly, the well-documented adverse effects and abuse potential of opioids should also be considered when interpreting their therapeutic applicability. Therefore, the present findings represent preliminary in vitro evidence that requires further validation in primary microglial cultures and in vivo models, along with more rigorous mechanistic approaches, before definitive therapeutic implications can be established.
Acknowledgement:
Funding Statement: This work was supported by the Charles University institutional project SVV-260790.
Author Contributions: The authors confirm contribution to the paper as follows: conceptualization: Jiri Novotny; investigation: Akash S. Mali, Debanjan Das, Denise Greco; analysis and interpretation of results: Akash S. Mali, Debanjan Das, Denise Greco; visualization: Akash S. Mali, Denise Greco; writing—original draft preparation: Akash S. Mali, Debanjan Das; writing—review and editing: Petr Telensky, Jiri Novotny. All authors reviewed and approved the final version of the manuscript.
Availability of Data and Materials: All data supporting the results of this study are included within the article and/or its Supplementary Materials. Further inquiries can be directed to the corresponding author.
Ethics Approval: Not applicable.
Conflicts of Interest: The authors declare no conflicts of interest.
Supplementary Materials: The supplementary material is available online at https://www.techscience.com/doi/10.32604/biocell.2026.080886/s1.
References
1. Hughes V . Microglia: the constant gardeners. Nature. 2012; 485( 7400): 570– 2. doi:10.1038/485570a. [Google Scholar] [CrossRef]
2. Butovsky O , Weiner HL . Microglial signatures and their role in health and disease. Nat Rev Neurosci. 2018; 19( 10): 622– 35. doi:10.1038/s41583-018-0057-5. [Google Scholar] [CrossRef]
3. Orihuela R , McPherson CA , Harry GJ . Microglial M1/M2 polarization and metabolic states. Br J Pharmacol. 2016; 173( 4): 649– 65. doi:10.1111/bph.13139. [Google Scholar] [CrossRef]
4. Du Y , Luo M , Du Y , Xu M , Yao Q , Wang K , et al. Liquiritigenin decreases aβ levels and ameliorates cognitive decline by regulating microglia M1/M2 transformation in AD mice. Neurotox Res. 2021; 39( 2): 349– 58. doi:10.1007/s12640-020-00284-z. [Google Scholar] [CrossRef]
5. Gong Q , Wang Y , Wang X , Pan H , Yan C . Baicalein promotes the microglia M2 polarization and suppresses apoptosis by targeting HMOX1/PDE4D to alleviate Alzheimer’s disease. Immunobiology. 2023; 228( 6): 152761. doi:10.1016/j.imbio.2023.152761. [Google Scholar] [CrossRef]
6. Sanjay , Shin JH , Park M , Lee HJ . Cyanidin-3-O-glucoside regulates the M1/M2 polarization of microglia via PPARγ and Aβ42 phagocytosis through TREM2 in an Alzheimer’s disease model. Mol Neurobiol. 2022; 59( 8): 5135– 48. doi:10.1007/s12035-022-02873-9. [Google Scholar] [CrossRef]
7. Green JM , Sundman MH , Chou YH . Opioid-induced microglia reactivity modulates opioid reward, analgesia, and behavior. Neurosci Biobehav Rev. 2022; 135: 104544. doi:10.1016/j.neubiorev.2022.104544. [Google Scholar] [CrossRef]
8. Terminel MN , Bassil C , Rau J , Trevino A , Ruiz C , Alaniz R , et al. Morphine-induced changes in the function of microglia and macrophages after acute spinal cord injury. BMC Neurosci. 2022; 23( 1): 58. doi:10.1186/s12868-022-00739-3. [Google Scholar] [CrossRef]
9. Shivling Mali A , Honc O , Hejnova L , Novotny J . Opioids alleviate oxidative stress via the Nrf2/HO-1 pathway in LPS-stimulated microglia. Int J Mol Sci. 2023; 24( 13): 11089. doi:10.3390/ijms241311089. [Google Scholar] [CrossRef]
10. Zhou Y , Lu X , Zhang Y , Li C , Bai Y , Zhang Z . Investigation of the effects of opioids on microglial nitrite and nitric oxide synthase (iNOS) production and phagocytosis during inflammation. Comb Chem High Throughput Screen. 2023; 26( 10): 1900– 6. doi:10.2174/1386207326666221111093915. [Google Scholar] [CrossRef]
11. Zhao L , Zhu Y , Wang D , Chen M , Gao P , Xiao W , et al. Morphine induces Beclin 1- and ATG5-dependent autophagy in human neuroblastoma SH-SY5Y cells and in the rat hippocampus. Autophagy. 2010; 6( 3): 386– 94. doi:10.4161/auto.6.3.11289. [Google Scholar] [CrossRef]
12. Liu LT , Song YQ , Chen XS , Liu Y , Zhu JJ , Zhou LM , et al. Morphine-induced RACK1-dependent autophagy in immortalized neuronal cell lines. Br J Pharmacol. 2020; 177( 7): 1609– 21. doi:10.1111/bph.14922. [Google Scholar] [CrossRef]
13. Karoussiotis C , Sotiriou A , Polissidis A , Symeonof A , Papavranoussi-Daponte D , Nikoletopoulou V , et al. The κ-opioid receptor-induced autophagy is implicated in stress-driven synaptic alterations. Front Mol Neurosci. 2022; 15: 1039135. doi:10.3389/fnmol.2022.1039135. [Google Scholar] [CrossRef]
14. Zhou Y , Wang Y , Wang X , Tian X , Zhang S , Yang F , et al. The protective effects of K-opioid receptor stimulation in hypoxic pulmonary hypertension involve inhibition of autophagy through the AMPK-MTOR pathway. Cell Physiol Biochem. 2017; 44( 5): 1965– 79. doi:10.1159/000485886. [Google Scholar] [CrossRef]
15. Kong H , Jiang CY , Hu L , Teng P , Zhang Y , Pan XX , et al. Morphine induces dysfunction of PINK1/Parkin-mediated mitophagy in spinal cord neurons implying involvement in antinociceptive tolerance. J Mol Cell Biol. 2019; 11( 12): 1056– 68. doi:10.1093/jmcb/mjz002. [Google Scholar] [CrossRef]
16. Liu L , Liu Z , Zeng C , Xu Y , He L , Fang Q , et al. Dynorphin/KOR inhibits neuronal autophagy by activating mTOR signaling pathway to prevent acute seizure epilepsy. Cell Biol Int. 2022; 46( 11): 1814– 24. doi:10.1002/cbin.11874. [Google Scholar] [CrossRef]
17. Plaza-Zabala A , Sierra-Torre V , Sierra A . Autophagy and microglia: novel partners in neurodegeneration and aging. Int J Mol Sci. 2017; 18( 3): 598. doi:10.3390/ijms18030598. [Google Scholar] [CrossRef]
18. Choi I , Wang M , Yoo S , Xu P , Seegobin SP , Li X , et al. Autophagy enables microglia to engage amyloid plaques and prevents microglial senescence. Nat Cell Biol. 2023; 25( 7): 963– 74. doi:10.1038/s41556-023-01158-0. [Google Scholar] [CrossRef]
19. Cheon SY , Kim H , Rubinsztein DC , Lee JE . Autophagy, cellular aging and age-related human diseases. Exp Neurobiol. 2019; 28( 6): 643– 57. doi:10.5607/en.2019.28.6.643. [Google Scholar] [CrossRef]
20. Lipinski MM , Zheng B , Lu T , Yan Z , Py BF , Ng A , et al. Genome-wide analysis reveals mechanisms modulating autophagy in normal brain aging and in Alzheimer’s disease. Proc Natl Acad Sci U S A. 2010; 107( 32): 14164– 9. doi:10.1073/pnas.1009485107. [Google Scholar] [CrossRef]
21. Menzies FM , Fleming A , Rubinsztein DC . Compromised autophagy and neurodegenerative diseases. Nat Rev Neurosci. 2015; 16( 6): 345– 57. doi:10.1038/nrn3961. [Google Scholar] [CrossRef]
22. Eichhoff G , Brawek B , Garaschuk O . Microglial calcium signal acts as a rapid sensor of single neuron damage in vivo. Biochim Biophys Acta BBA Mol Cell Res. 2011; 1813( 5): 1014– 24. doi:10.1016/j.bbamcr.2010.10.018. [Google Scholar] [CrossRef]
23. Olmedillas Del Moral M , Asavapanumas N , Uzcátegui NL , Garaschuk O . Healthy brain aging modifies microglial calcium signaling in vivo. Int J Mol Sci. 2019; 20( 3): 589. doi:10.3390/ijms20030589. [Google Scholar] [CrossRef]
24. Mustaly-Kalimi S , Littlefield AM , Stutzmann GE . Calcium signaling deficits in Glia and autophagic pathways contributing to neurodegenerative disease. Antioxid Redox Signal. 2018; 29( 12): 1158– 75. doi:10.1089/ars.2017.7266. [Google Scholar] [CrossRef]
25. Wang Z , Wang Q , Li S , Li XJ , Yang W , He D . Microglial autophagy in Alzheimer’s disease and Parkinson’s disease. Front Aging Neurosci. 2023; 14: 1065183. doi:10.3389/fnagi.2022.1065183. [Google Scholar] [CrossRef]
26. Kma L , Baruah TJ . The interplay of ROS and the PI3K/Akt pathway in autophagy regulation. Biotechnol Appl Biochem. 2022; 69( 1): 248– 64. doi:10.1002/bab.2104. [Google Scholar] [CrossRef]
27. Fan X , He Y , Wu G , Chen H , Cheng X , Zhan Y , et al. Sirt3 activates autophagy to prevent DOX-induced senescence by inactivating PI3K/AKT/mTOR pathway in A549 cells. Biochim Biophys Acta BBA Mol Cell Res. 2023; 1870( 2): 119411. doi:10.1016/j.bbamcr.2022.119411. [Google Scholar] [CrossRef]
28. Liu G , Li X , Yang F , Qi J , Shang L , Zhang H , et al. C-phycocyanin ameliorates the senescence of mesenchymal stem cells through ZDHHC5-mediated autophagy via PI3K/AKT/mTOR pathway. Aging Dis. 2023; 14( 4): 1425– 40. doi:10.14336/AD.2023.0121. [Google Scholar] [CrossRef]
29. Cianciulli A , Porro C , Calvello R , Trotta T , Lofrumento DD , Panaro MA . Microglia mediated neuroinflammation: focus on PI3K modulation. Biomolecules. 2020; 10( 1): 137. doi:10.3390/biom10010137. [Google Scholar] [CrossRef]
30. Liu B , Zhang Y , Yang Z , Liu M , Zhang C , Zhao Y , et al. ω-3 DPA protected neurons from neuroinflammation by balancing microglia M1/M2 polarizations through inhibiting NF-κB/MAPK p38 signaling and activating neuron-BDNF-PI3K/AKT pathways. Mar Drugs. 2021; 19( 11): 587. doi:10.3390/md19110587. [Google Scholar] [CrossRef]
31. Cheng M , Geng Y , Chen Y , Zhang Y , Guo R , Xu H , et al. δ-Opioid receptor activation ameliorates lipopolysaccharide-induced inflammation and apoptosis by inhibiting the MAPK/caspase-3 pathway in BV2 microglial cells. Exp Brain Res. 2021; 239( 2): 401– 12. doi:10.1007/s00221-020-05983-9. [Google Scholar] [CrossRef]
32. Mali AS , Novotny J . Opioid receptor activation suppresses the neuroinflammatory response by promoting microglial M2 polarization. Mol Cell Neurosci. 2022; 121: 103744. doi:10.1016/j.mcn.2022.103744. [Google Scholar] [CrossRef]
33. Greenwood EK , Brown DR . Senescent microglia: the key to the ageing brain? Int J Mol Sci. 2021; 22( 9): 4402. doi:10.3390/ijms22094402. [Google Scholar] [CrossRef]
34. Koellhoffer EC , McCullough LD , Ritzel RM . Old maids: aging and its impact on microglia function. Int J Mol Sci. 2017; 18( 4): 769. doi:10.3390/ijms18040769. [Google Scholar] [CrossRef]
35. Angelova D , Brown DR . Altered processing of β-amyloid in SH-SY5Y cells induced by model senescent microglia. ACS Chem Neurosci. 2018; 9( 12): 3137– 52. doi:10.1021/acschemneuro.8b00334. [Google Scholar] [CrossRef]
36. Yu HM , Zhao YM , Luo XG , Feng Y , Ren Y , Shang H , et al. Repeated lipopolysaccharide stimulation induces cellular senescence in BV2 cells. Neuroimmunomodulation. 2012; 19( 2): 131– 6. doi:10.1159/000330254. [Google Scholar] [CrossRef]
37. Mahmood T , Yang PC . Western blot: technique, theory, and trouble shooting. N Am J Med Sci. 2012; 4( 9): 429– 34. doi:10.4103/1947-2714.100998. [Google Scholar] [CrossRef]
38. Bhat SA , Henry RJ , Blanchard AC , Stoica BA , Loane DJ , Faden AI . Enhanced Akt/GSK-3β/CREB signaling mediates the anti-inflammatory actions of mGluR5 positive allosteric modulators in microglia and following traumatic brain injury in male mice. J Neurochem. 2021; 156( 2): 225– 48. doi:10.1111/jnc.14954. [Google Scholar] [CrossRef]
39. Gao Y , Liu EJ , Wang WJ , Wang YL , Li XG , Wang X , et al. Microglia CREB-phosphorylation mediates amyloid-β-induced neuronal toxicity. J Alzheimers Dis. 2018; 66( 1): 333– 45. doi:10.3233/JAD-180286. [Google Scholar] [CrossRef]
40. Pan K , Garaschuk O . The role of intracellular calcium-store-mediated calcium signals in in vivo sensor and effector functions of microglia. J Physiol. 2023; 601( 19): 4203– 15. doi:10.1113/JP279521. [Google Scholar] [CrossRef]
41. Skrabalova J , Karlovska I , Hejnova L , Novotny J . Protective effect of morphine against the oxidant-induced injury in H9c2 cells. Cardiovasc Toxicol. 2018; 18( 4): 374– 85. doi:10.1007/s12012-018-9448-0. [Google Scholar] [CrossRef]
42. Xu Y , Zhi F , Mao J , Peng Y , Shao N , Balboni G , et al. δ-opioid receptor activation protects against Parkinson’s disease-related mitochondrial dysfunction by enhancing PINK1/Parkin-dependent mitophagy. Aging. 2020; 12( 24): 25035– 59. doi:10.18632/aging.103970. [Google Scholar] [CrossRef]
43. Xu Y , Chen R , Zhi F , Sheng S , Khiati L , Yang Y , et al. δ-opioid receptor, microglia and neuroinflammation. Aging Dis. 2023; 14( 3): 778– 93. doi:10.14336/AD.2022.0912. [Google Scholar] [CrossRef]
44. Inoue K , Tsuda M . Microglia in neuropathic pain: cellular and molecular mechanisms and therapeutic potential. Nat Rev Neurosci. 2018; 19( 3): 138– 52. doi:10.1038/nrn.2018.2. [Google Scholar] [CrossRef]
45. Rim C , You MJ , Nahm M , Kwon MS . Emerging role of senescent microglia in brain aging-related neurodegenerative diseases. Transl Neurodegener. 2024; 13( 1): 10. doi:10.1186/s40035-024-00402-3. [Google Scholar] [CrossRef]
46. Lewinska A , Adamczyk-Grochala J , Bloniarz D , Horeczy B , Zurek S , Kurowicki A , et al. Remifentanil preconditioning protects against hypoxia-induced senescence and necroptosis in human cardiac myocytes in vitro. Aging. 2020; 12( 14): 13924– 38. doi:10.18632/aging.103604. [Google Scholar] [CrossRef]
47. Raffaele M , Kovacovicova K , Biagini T , Lo Re O , Frohlich J , Giallongo S , et al. Nociceptin/orphanin FQ opioid receptor (NOP) selective ligand MCOPPB links anxiolytic and senolytic effects. Geroscience. 2022; 44( 1): 463– 83. doi:10.1007/s11357-021-00487-y. [Google Scholar] [CrossRef]
48. Zhang C , Jiang S , Lu Y , Yuan F . Butorphanol tartrate mitigates cellular senescence against tumor necrosis factor-α (TNF-α) in human HC-A chondrocytes. Bioengineered. 2022; 13( 3): 5434– 42. doi:10.1080/21655979.2021.2024651. [Google Scholar] [CrossRef]
49. Guo F , Liu X , Cai H , Le W . Autophagy in neurodegenerative diseases: pathogenesis and therapy. Brain Pathol. 2018; 28( 1): 3– 13. doi:10.1111/bpa.12545. [Google Scholar] [CrossRef]
50. Metaxakis A , Ploumi C , Tavernarakis N . Autophagy in age-associated neurodegeneration. Cells. 2018; 7( 5): 37. doi:10.3390/cells7050037. [Google Scholar] [CrossRef]
51. Lei Y , Zhang E , Bai L , Li Y . Autophagy in cancer immunotherapy. Cells. 2022; 11( 19): 2996. doi:10.3390/cells11192996. [Google Scholar] [CrossRef]
52. Xue J , Gruber F , Tschachler E , Zhao Y . Crosstalk between oxidative stress, autophagy and apoptosis in hemoporfin photodynamic therapy treated human umbilical vein endothelial cells. Photodiagnosis Photodyn Ther. 2021; 33: 102137. doi:10.1016/j.pdpdt.2020.102137. [Google Scholar] [CrossRef]
53. Ma J , Wan J , Meng J , Banerjee S , Ramakrishnan S , Roy S . Methamphetamine induces autophagy as a pro-survival response against apoptotic endothelial cell death through the Kappa opioid receptor. Cell Death Dis. 2014; 5( 3): e1099. doi:10.1038/cddis.2014.64. [Google Scholar] [CrossRef]
54. Yao J , Ma C , Gao W , Liang J , Liu C , Yang H , et al. Fentanyl induces autophagy via activation of the ROS/MAPK pathway and reduces the sensitivity of cisplatin in lung cancer cells. Oncol Rep. 2016; 36( 6): 3363– 70. doi:10.3892/or.2016.5183. [Google Scholar] [CrossRef]
55. Onishi M , Okamoto K . Mitochondrial clearance: mechanisms and roles in cellular fitness. FEBS Lett. 2021; 595( 8): 1239– 63. doi:10.1002/1873-3468.14060. [Google Scholar] [CrossRef]
56. Amin S , Liu B , Gan L . Autophagy prevents microglial senescence. Nat Cell Biol. 2023; 25( 7): 923– 5. doi:10.1038/s41556-023-01168-y. [Google Scholar] [CrossRef]
57. Guo J , Li Y , Ma K , Su G . Enhancing autophagy mitigates LPS-induced neuroinflammation by inhibiting microglial M1 polarization and neuronophagocytosis. Front Cell Neurosci. 2025; 19: 1546848. doi:10.3389/fncel.2025.1546848. [Google Scholar] [CrossRef]
58. Rajendran P , Alzahrani AM , Hanieh HN , Kumar SA , Ben Ammar R , Rengarajan T , et al. Autophagy and senescence: a new insight in selected human diseases. J Cell Physiol. 2019; 234( 12): 21485– 92. doi:10.1002/jcp.28895. [Google Scholar] [CrossRef]
59. Ryter SW , Cloonan SM , Choi AMK . Autophagy: a critical regulator of cellular metabolism and homeostasis. Mol Cells. 2013; 36( 1): 7– 16. doi:10.1007/s10059-013-0140-8. [Google Scholar] [CrossRef]
60. Guo C , Ruan J , Li Z , Fu H , Li K , Gong X , et al. Cadmium promoted LPS-induced inflammation through TLR4/IκBα/NFκ-B signaling by increasing ROS-mediated incomplete autophagy. Ecotoxicol Environ Saf. 2024; 278: 116405. doi:10.1016/j.ecoenv.2024.116405. [Google Scholar] [CrossRef]
61. Ye X , Zhu M , Che X , Wang H , Liang XJ , Wu C , et al. Lipopolysaccharide induces neuroinflammation in microglia by activating the MTOR pathway and downregulating Vps34 to inhibit autophagosome formation. J Neuroinflamm. 2020; 17( 1): 18. doi:10.1186/s12974-019-1644-8. [Google Scholar] [CrossRef]
62. Lee JW , Nam H , Kim LE , Jeon Y , Min H , Ha S , et al. TLR4 (toll-like receptor 4) activation suppresses autophagy through inhibition of FOXO3 and impairs phagocytic capacity of microglia. Autophagy. 2019; 15( 5): 753– 70. doi:10.1080/15548627.2018.1556946. [Google Scholar] [CrossRef]
63. Ahmad Malik J , Agrewala JN . Assessing the implications of morphine-induced dysregulation of autophagy on brain health. Mol Neurobiol. 2025; 62( 11): 14706– 16. doi:10.1007/s12035-025-05039-5. [Google Scholar] [CrossRef]
64. Yarmohammadi F , Hayes AW , Karimi G . Natural compounds against cytotoxic drug-induced cardiotoxicity: a review on the involvement of PI3K/Akt signaling pathway. J Biochem Mol Toxicol. 2021; 35( 3): e22683. doi:10.1002/jbt.22683. [Google Scholar] [CrossRef]
65. Yu Y , Hou L , Song H , Xu P , Sun Y , Wu K . Akt/AMPK/mTOR pathway was involved in the autophagy induced by vitamin E succinate in human gastric cancer SGC-7901 cells. Mol Cell Biochem. 2017; 424( 1): 173– 83. doi:10.1007/s11010-016-2853-4. [Google Scholar] [CrossRef]
66. Querfurth H , Lee HK . Mammalian/mechanistic target of rapamycin (mTOR) complexes in neurodegeneration. Mol Neurodegener. 2021; 16( 1): 44. doi:10.1186/s13024-021-00428-5. [Google Scholar] [CrossRef]
67. Sarkar S , Ravikumar B , Floto RA , Rubinsztein DC . Rapamycin and mTOR-independent autophagy inducers ameliorate toxicity of polyglutamine-expanded huntingtin and related proteinopathies. Cell Death Differ. 2009; 16( 1): 46– 56. doi:10.1038/cdd.2008.110. [Google Scholar] [CrossRef]
68. Bussi C , Peralta Ramos JM , Arroyo DS , Gaviglio EA , Gallea JI , Wang JM , et al. Autophagy down regulates pro-inflammatory mediators in BV2 microglial cells and rescues both LPS and alpha-synuclein induced neuronal cell death. Sci Rep. 2017; 7: 43153. doi:10.1038/srep43153. [Google Scholar] [CrossRef]
69. Singh A , Khan H , Grewal AK , Dua K , Singh SK , Singh TG . Pharmacological perspective on the neurobiology of PI3K-Akt-mTOR signalling in opioid dependence. CNS Neurol Disord Drug Targets. 2025; 24( 9): 652– 68. doi:10.2174/0118715273377530250408212447. [Google Scholar] [CrossRef]
70. Shrivastava P , Cabrera MA , Chastain LG , Boyadjieva NI , Jabbar S , Franklin T , et al. Mu-opioid receptor and delta-opioid receptor differentially regulate microglial inflammatory response to control proopiomelanocortin neuronal apoptosis in the hypothalamus: effects of neonatal alcohol. J Neuroinflamm. 2017; 14( 1): 83. doi:10.1186/s12974-017-0844-3. [Google Scholar] [CrossRef]
Cite This Article
 Copyright © 2026 The Author(s). Published by Tech Science Press.
This work is licensed under a Creative Commons Attribution 4.0 International License , which permits unrestricted use, distribution, and reproduction in any medium, provided the original work is properly cited.
 Downloads
 Citation Tools
