
 Login
Login Register
 Submit a Paper
 Propose a Special lssue
 Open Access
ARTICLE
Oridonin Ameliorates Nonalcoholic Steatohepatitis by Regulating Pyroptosis through the NF-κB/NLRP3 Axis
Department of Gastroenterology, The Third Affiliated Hospital of Southern Medical University, Guangzhou, China
* Corresponding Author: Yinghua Ou. Email:
BIOCELL 2026, 50(9), 12 https://doi.org/10.32604/biocell.2026.081188
Received 25 February 2026; Accepted 26 May 2026; Issue published 26 August 2026
 View Full Text
 Download PDF
Abstract
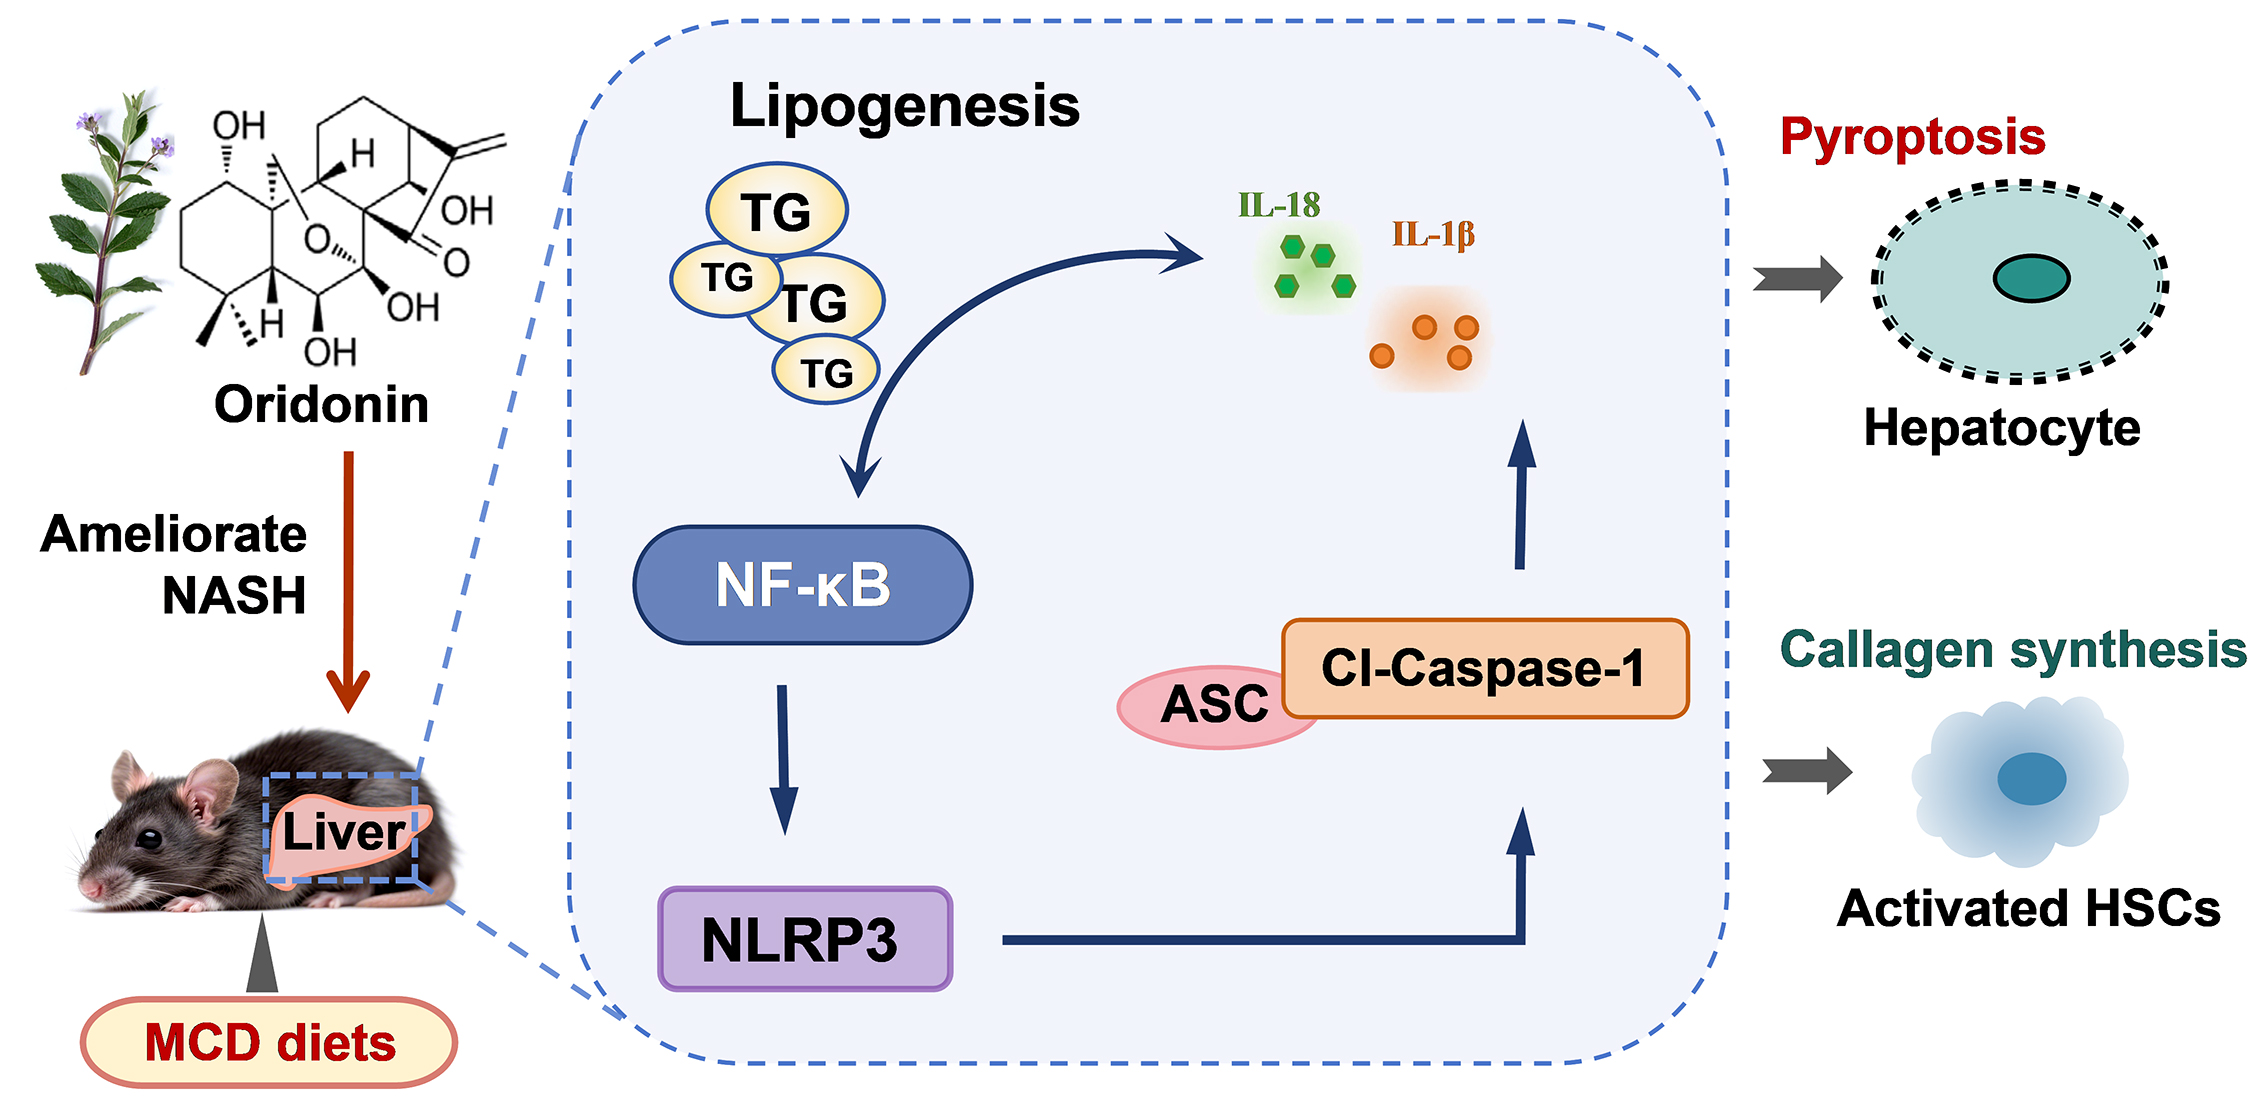
Background: Nonalcoholic steatohepatitis (NASH) is a liver disease characterized by inflammation and fibrosis. Oridonin (Ori) exhibits anti-inflammatory and anti-fibrotic properties, but its role in NASH remains unclear. The study aimed to investigate whether Ori alleviates NASH injury by regulating pyroptosis through the nuclear factor-κB (NF-κB)/nucleotide-binding oligomerization domain-like receptor protein 3 (NLRP3) axis. Methods: An in vitro NASH model was established in HepG2 cells using free fatty acids (FFA), and an in vivo model was induced in mice using a methionine-choline-deficient (MCD) diet. Biochemical assays, staining, flow cytometry, Western blot, and immunofluorescence assessed lipid accumulation, oxidative stress, inflammation, pyroptosis, and fibrosis. Results: Ori treatment (2.5–10 μM) dose-dependently reduced FFA-induced cell injury, lipid accumulation, reactive oxygen species (ROS) production, and release of interleukin (IL)-1β and IL-18, while decreasing PI and Caspase-1-positive cells and expression of N-GSDMD (p < 0.05). Ori also suppressed the expression of fibrosis markers alpha smooth muscle actin (α-SMA), Collagen III, and fibronectin (p < 0.05). In MCD-fed mice, Ori significantly attenuated hepatic steatosis, oxidative stress, inflammation, pyroptosis, and fibrosis, and alleviated liver enzyme levels and stiffness (p < 0.05). Mechanistically, Ori inhibited NF-κB activation (p-p65 and p-IκBα) and NLRP3 inflammasome assembly, as confirmed by lipopolysaccharide (LPS)/adenosine triphosphate (ATP) experiments. Conclusion: Ori can delay NASH progression via suppressing the NF-κB/NLRP3 pathway, reducing liver cell damage, lipid deposition, inflammation, pyroptosis, and fibrosis.Graphic Abstract
Keywords
Nonalcoholic fatty liver disease (NAFLD) is projected to become a leading indication for liver transplantation in the coming decades, posing a major burden on global health [1]. Nonalcoholic steatohepatitis (NASH), a more serious subtype of NAFLD, is characterized by abnormal lipid metabolism, hepatic steatosis, inflammation, and fibrosis, which can gradually progress to liver fibrosis, cirrhosis, and even hepatocellular carcinoma [2,3]. In recent decades, urbanization and lifestyle changes have driven a rising incidence of NASH, with liver disease mortality more than doubling due to population aging [4,5]. The etiology and pathological mechanisms of NASH are complex. Since the failure of the obeticholic acid phase III trial, no specific therapeutic drugs have been approved worldwide. Although existing candidate drugs partially improve metabolic disorders, their reversal effect on liver fibrosis is limited, underscoring the limitations of single-target interventions and raising concerns about long-term medication safety [6,7]. Thus, exploring NASH pathogenesis and identifying effective therapeutic targets and preventive measures to block or reverse NASH progression are of major importance.
Nucleotide-binding oligomerization domain-like receptor protein 3 (NLRP3) inflammasome and pyroptosis are key drivers of NASH development [8,9,10]. Pyroptosis is primarily triggered through inflammasome activation, among which the NLRP3 inflammasome is the most extensively studied. NLRP3, a key pattern recognition receptor, recognizes diverse abnormal signals, such as a high-fat diet and metabolic stress, and assembles into inflammasomes for activation [11]. Activated NLRP3 further activates cysteinyl aspartate-specific proteinase-1 (Caspase-1), which hydrolyzes the pro-inflammatory cytokines interleukin (IL)-1β (pro-IL-1β) and IL-18 (pro-IL-18), and Gasdermin D (GSDMD), thereby forming and releasing active IL-1β, IL-18, and N-GSDMD. This triggers inflammatory cascades and induces pyroptosis [12,13], exacerbating liver inflammation and tissue damage. NLRP3 levels are markedly up-regulated in NASH patients and mouse models, accompanied by increased Caspase-1 and IL-1β expression [14]. Inhibiting the NLRP3 inflammasome improves liver injury, pyroptosis, and lipid accumulation in NASH [15,16]. NLRP3 inflammasome activation is precisely regulated by nuclear factor-κB (NF-κB) signaling, which initiates pro-IL-1β and pro-IL-18 transcription, driving inflammatory disease progression in association with NLRP3 activity [17]. Inhibiting the NF-κB/NLRP3 pathway effectively reduces liver inflammation and lipid accumulation in NASH [18]. Therefore, targeting the NF-κB/NLRP3 signaling axis to regulate pyroptosis represents a promising strategy for NASH treatment.
Compared with traditional drugs, herbal medicines offer multi-target and multi-pathway advantages for NASH treatment, comprehensively intervening in complex pathogenesis across hepatocyte steatosis, liver inflammation, and fibrosis [19]. Oridonin (Ori), a tetracyclic diterpenoid isolated from Rabdosia rubescens, exhibits anti-inflammatory, antioxidant, and other pharmacological effects [20,21]. Ori specifically inhibits NLRP3 inflammasome assembly and interferes with NF-κB signal transduction [20,22], suggesting potential therapeutic value in inflammation-related diseases. Ori also regulates pyroptosis: it inhibits GSDMD-mediated pyroptosis and reduces myocardial injury through the NF-κB/NLRP3 axis [23] and suppresses the NLRP3 inflammasome to alleviate pyroptosis and inflammation in diabetic retinopathy [24]. However, whether Ori improves NASH liver injury via the modulation of the NF-κB/NLRP3-mediated pyroptosis pathway remains unclear.
Accordingly, free fatty acid (FFA)-induced HepG2 cells and methionine-choline-deficient (MCD) diet-induced NASH served as models. We systematically investigated Ori’s effects on hepatocyte injury, lipid accumulation, inflammation, and fibrosis, focusing on NF-κB/NLRP3 axis regulation and pyroptosis. These findings provide an experimental basis for developing natural medicines for NASH therapy and identifying molecular targets.
2.1 Cell Culture and Treatments
Human hepatoblastoma cell line HepG2 was purchased from Procell (CL-0103, Wuhan, China). The cell line was authenticated by short tandem repeat (STR) profiling and tested negative for mycoplasma contamination (MycoBlue Mycoplasma Detector, Vazyme, D101-01, Nanjing, China) before use in all experiments. Thawed HepG2 cells were cultured in high-glucose Dulbecco’s Modified Eagle Medium (DMEM, 11965092, Gibco, Grand Island, NY, USA) supplemented with 10% fetal bovine serum (FBS, 10091148, Gibco) and 1% penicillin-streptomycin (15140122, Gibco) at 37°C in a humidified atmosphere with 5% CO2. At 80% confluence, cells were seeded into plates and stimulated with 0, 0.5, 1, 1.5, and 2 mM free fatty acid (FFA, 1‰ DMSO) (a mixture of oleic acid and palmitic acid at a 2:1 ratio; oleic acid: O1008, Sigma-Aldrich, St. Louis, MO, USA; palmitic acid: P0500, Sigma-Aldrich) for 24 h to establish an in vitro NASH model [25]. Cell proliferation was assessed using an MTT assay kit (C0009S, Beyotime, Shanghai, China). Optical density (OD) was measured at 570 nm using a microplate reader (Infinite M200, TECAN, Männedorf, Switzerland), and cell viability was calculated to determine the optimal FFA induction dose (1 mM).
HepG2 cells were then treated with Ori (C20H28O6, purity 99.89%, chemical structure shown in Fig. A1A, HY-N0004, MedChemExpress, Shanghai, China) for 24 h, and cell viability was evaluated by MTT assay to identify an appropriate intervention dose. Accordingly, cells were exposed to 1 mM FFA plus 2.5, 5, or 10 μM Ori for 24 h and assigned to the following groups: Control, FFA, FFA + Ori-L (low-dose), FFA + Ori-M (medium-dose), and FFA + Ori-H (high-dose). Additional groups (LPS/ATP and FFA + Ori-H + LPS/ATP) were incubated with 1 μg/mL lipopolysaccharide (LPS; S1732, Beyotime) for 24 h, followed by 1 mM adenosine triphosphate (ATP; C10H16N5O13P3, purity 99.88%, HY-B2176, MedChemExpress) for 1 h. Cell viability was then reassessed by MTT assay.
2.2 Lactate Dehydrogenase (LDH) Release Assay
After modeling and drug administration, the cell culture supernatant of each group was collected and assayed for LDH release using the LDH detection kit (C0018S, Beyotime) according to the manufacturer’s instructions. Briefly, 60 μL supernatant was mixed with 30 μL LDH detection working solution, incubated in the dark for 30 min with gentle shaking, and the OD490 nm was measured. LDH release rate = OD sample-OD control well/OD standard-OD control well × 100%.
For calcein AM/PI staining, HepG2 cells were detached using 0.25% trypsin-EDTA (25200056, Gibco) for 2 min at 37°C, and digestion was terminated by adding complete DMEM containing 10% FBS. Cells were then seeded at 2 × 10⁵ cells/well in 24-well plates and cultured under the above-mentioned conditions. 1 mL of live/dead staining reagent (containing 1 μL Calcein AM and 1 μL PI, C2015M, Beyotime) was added to each well and incubated for 30 min. The staining solution was then removed, and wells were washed once with phosphate-buffered saline (PBS, pH 7.4, 0.01 M, 10010023, Gibco), and slides were observed and photographed under a fluorescence microscope (IX71, OLYMPUS, Tokyo, Japan). Cell survival rates were quantified using ImageJ software (version 1.53, National Institutes of Health, Bethesda, MD, USA).
HepG2 cells were seeded in 6-well plates at a density of 2 × 10⁶ cells/well and cultured for 24 h. Each well received 5 μL Annexin V-APC and PI staining solution (C1062M, Beyotime, Shanghai, China), followed by 15-min incubation. Apoptosis was immediately quantified by flow cytometry (Attune NxT, Thermo Fisher, Waltham, MA, USA).
Caspase-1+/PI+ cells are generally considered to be pyroptotic. Pyroptosis was detected using the FAM-FLICA Caspase-1 YVAD Kit (ICT-97, AmyJet Scientific Inc., Wuhan, China). HepG2 cells were incubated with FLICA Caspase-1 probe for 30 min before the culture endpoint, protected from light during a further 30-min incubation. Cells were then washed with ice-cold PBS (pH 7.4, 0.01 M) to remove unbound probe. PI solution was added, and samples were analyzed immediately by flow cytometry.
2.5 Oil Red O Staining of Cells
After culture, the cells were fixed with 4% paraformaldehyde for 15 min. After washing with PBS, the cells were stained with 0.5% oil red O (O1391, Sigma-Aldrich, St. Louis, MO, USA) at room temperature for 20 min to clearly show the lipid droplets in the cells. Images were collected under a light microscope (CKX1, OLYMPUS).
HepG2 cells were washed after intervention, and the Hoechst33342/PI double-staining working solution (CA1120, Solarbio, Beijing, China) was added. The staining solution was prepared with a ratio of cell staining buffer: Hoechst33342: PI = 1 mL:5 μL:5 μL. The cells were incubated on ice at 4°C for 20 min. The stained cells were observed and photographed under a fluorescence microscope.
HepG2 cells were seeded (5 × 10⁵ cells/well). When the cell confluence reached more than 80%, a uniform straight line was drawn in each well with a 100 μL tip, and the cells under the tip were washed. Then, HepG2 cells were grouped for administration. The cells were photographed under a microscope at 0, 24, and 48 h, and the cell migration ability was evaluated using ImageJ software.
2.8 Animal Grouping and Processing
All animal experiments were approved by the Third Affiliated Hospital of Southern Medical University Ethics Committee (Approval No.: 202409-007). Forty-five specific pathogen-free (SPF) C57BL/6J male mice (8 weeks old; weighing 18–22 g) were purchased from Jicui Yaokang Biotechnology Co., Ltd. (Jiangsu, China). Mice were housed in an SPF animal facility maintained at 22°C and 50% relative humidity under a normal circadian rhythm, with free access to food and water, regular bedding changes, and routine cage cleaning. All procedures adhered strictly to the 3R principles. The health status of the animals was monitored daily, and no unexpected deaths occurred during the study.
Mice were randomly divided into 5 groups (n = 9/group) based on body weights using a random number generator: Sham group, methionine-choline-deficient (MCD) diet model, MCD + Ori-L (Ori-L), MCD + Ori-M (Ori-M), and MCD + Ori-H (Ori-H). Sample size was calculated using G*Power software (version 3.1, Heinrich Heine University Düsseldorf, Düsseldorf, Germany). Based on preliminary experiment data on key indicators such as liver inflammation-related cytokines, the required sample size was estimated with a significance level (α) of 0.05 and a power (1 − β) of 0.8 to detect a large effect size (Cohen’s d > 0.8). The calculation indicated that n = 9 mice per group was sufficient to achieve statistically significant differences between treatment groups and controls. The Sham group received standard chow, while the remaining mice were fed an MCD diet (XSYT-020111, Xiaoshu Youtai Biotechnology Co., Ltd., Beijing, China) to induce NASH. Ori groups received daily intraperitoneal injections of 2, 4, or 6 mg/kg Ori [26,27], while control groups received equivalent volumes of normal saline. Treatment continued for 4 weeks, followed by a 24-h fast. The person administering the injections and those conducting the outcome assessments (e.g., histological analysis, biochemical assays) were blinded to the group allocation.
At the end of the treatment period, mice were fasted for 24 h and then anesthetized via intraperitoneal injection of sodium pentobarbital (50 mg/kg, P3761, Sigma-Aldrich). The adequacy of anesthesia was confirmed by the absence of a pedal withdrawal reflex. Mice were then weighed using an electronic balance. Blood was collected by retro-orbital puncture and allowed to clot at 4°C for 1.5 h. Serum was separated by centrifugation and stored at −20°C. Following blood collection, mice were euthanized by cervical dislocation while still under deep anesthesia. Death was confirmed by cessation of respiration, absence of heartbeat (via digital palpation of the thorax), and lack of pedal and corneal reflexes. The livers were harvested. Liver tissues were rinsed repeatedly in ice-cold normal saline to remove residual blood, blotted dry with filter paper, and weighed to calculate the liver index (liver weight/body weight). Each liver was divided into two parts: one was fixed in 4% paraformaldehyde, and the other was stored at −80°C.
2.9 Histopathological Staining of Liver Tissue
Mouse liver tissue was fixed in 4% paraformaldehyde, embedded in paraffin, sectioned at 4 μm thickness, and mounted on slides. Sections were deparaffinized in xylene (twice, 10 min each) and rehydrated through a graded ethanol series (100%, 95%, 85%, and 75% ethanol, 5 min each), followed by washing in running tap water for 5 min. The sections were stained with hematoxylin (H3136, Sigma-Aldrich) at a concentration of 0.5% (w/v) for 5 min at room temperature, then rinsed in tap water for 5 min. Differentiation was performed using 0.3% acid-alcohol (0.3% HCl in 70% ethanol) for 3 s. The sections were then stained with eosin (E4009, Sigma-Aldrich) at a concentration of 0.5% (w/v) for 3 min at room temperature. After dehydration, the sections were imaged under a microscope to observe the nuclear staining, hepatic lobule structure, and liver cell arrangement. The results of HE staining were evaluated by the NAFLD activity score (NAS) (Table 1).
Table 1: NAS score for HE staining.
| Score | Hepatocyte Steatosis (%) | Intralobular Inflammation | Hepatocyte Ballooning |
|---|---|---|---|
| 0 | <5 | No lesions | No |
| 1 | 5–33 | <2 | A small number of ballooning changes |
| 2 | 34–66 | 2–4 | Significant ballooning change |
| 3 | >66 | >4 | — |
For Masson staining (G1006, Servicebio, Wuhan, China), the liver sections were mordanted in Bouin’s solution at room temperature for 1 h, then washed in running tap water until the yellow color disappeared. Nuclei were stained with Weigert’s iron hematoxylin for 10 min, followed by washing in tap water. Sections were then stained with ponceau-acid fuchsin solution for 10 min, rinsed in distilled water, and differentiated in 1% phosphomolybdic acid for 5 min. Collagen fibers were stained with aniline blue solution for 5 min. After differentiation in 0.2% acetic acid, sections were mounted with neutral resin. Collagen fibers appeared blue, while cytoplasm and muscle fibers appeared red. Images were captured using a light microscope (CKX1, OLYMPUS, Tokyo, Japan).
Fresh liver tissues were embedded in optimal cutting temperature (OCT) compound (G6059, Servicebio) and frozen at −20°C. Sections were cut at 8 μm thickness using a cryostat (CM1950, Leica Biosystems, Wetzlar, Germany), mounted on slides, and air-dried at room temperature for 10 min. Sections were fixed in 4% paraformaldehyde for 10 min, rinsed with distilled water, and then incubated in 60% isopropanol for 5 min. Sections were stained with 0.5% oil red O solution (O1391, Sigma-Aldrich) for 10 min at room temperature, then differentiated in 60% isopropanol for 2–3 s, and rinsed with distilled water. Nuclei were counterstained with hematoxylin (H3136, Sigma-Aldrich) for 2 min. Oil red O staining was used to visualize liver lipid deposition. The deposition of orange lipid droplets in liver tissue was observed under the light microscope (CKX1, OLYMPUS) to reflect liver lipid deposition.
2.10 Bodipy Fluorescence Staining
For cell staining, HepG2 cells were incubated with C11 Bodipy probe (10 μmol/L, HY-D1301, MedChemExpress) in DMEM medium for 1 h. Diluted C11 Bodipy working solution (5 μmol/L) was added to the frozen liver sections and incubated for 30 min. The cells were stained with 1 μg/mL 4′,6-diamidino-2-phenylindole (DAPI, D9542, Sigma-Aldrich) at room temperature for 10 min in the dark to show the nucleus. Fluorescence intensity was quantified using ImageJ software.
2.11 Detection of Biochemical Indicators
Triglyceride (TG), total cholesterol (TC), superoxide dismutase (SOD), malondialdehyde (MDA), aspartate aminotransferase (AST), and alanine aminotransferase (ALT) kits were purchased from Solarbio (BC0625, BC1985, BC0175, BC0025, BC6435, BC6425, Beijing, China). The supernatant of HepG2 cells was discarded by centrifugation at 1000× g for 5 min at 4°C (Centrifuge 5424R, Eppendorf, Hamburg, Germany). The supernatant was removed, and 1 mL of extraction buffer was added. Cells were resuspended and subjected to ultrasonic disruption using an ultrasonic cell crusher (JY92-IIN, Scientz Biotechnology, Ningbo, China) under the following conditions: power 20%, ultrasonic pulse of 2 s on and 1 s off, total duration 1 min, performed in an ice bath. The homogenate was then centrifuged at 8000× g for 10 min at 4°C, and the supernatant was collected. 0.1 g of mouse liver tissue was homogenized in 1 mL of extract, homogenized in an ice bath, and the supernatant was taken by centrifugation at 8000× g for 10 min at 4°C. At the same time, the serum of mice in each group was collected. The OD values were detected using a microplate reader. A standard curve was constructed using standard concentrations, and sample concentrations were calculated based on the OD values of each group.
IL-1β, IL-18, and tumor necrosis factor-α (TNF-α) enzyme-linked immunosorbent assay (ELISA) kits were purchased from MEIMIAN (MM-0181H2 (human kit for IL-1β), MM-0040M1 (mouse kit for IL-1β), MM-0139H2 (human kit for IL-18), MM-0169M1 (mouse kit for IL-18), MM-0122H2 (human kit for TNF-α), MM-0132M2 (mouse kit for TNF-α), Jiangsu, China). The culture medium of HepG2 cells in each group was collected, and the supernatant was collected after centrifugation (1000× g, 4°C) for 5 min. 0.1 g of mouse liver was homogenized in 0.9 mL PBS and thoroughly ground on ice, and the supernatant was taken after centrifugation (3000× g, 4°C) for 10 min. The experimental procedure was strictly followed according to the ELISA kit instructions. The standard curve was obtained by taking the standard concentration as the abscissa and the OD value as the ordinate, and the sample concentrations were calculated by taking the OD value of each group.
2.12 Detection of Reactive Oxygen Species (ROS) Content
HepG2 cells from each treatment group were incubated with 1 mL of pre-diluted 2,7-dichlorofluorescein diacetate (DCFH-DA, S1105S, Beyotime) probe solution (final concentration 10 μmol/L) to fully cover the cells. Cells were incubated for 30 min in the dark. At the same time, frozen liver sections were immersed in diluted DCFH-DA working solution and incubated under the same conditions. Cells were then washed thoroughly with PBS to remove the extracellular probe. Images were analyzed by ImageJ software, and the relative fluorescence intensity of ROS was calculated to evaluate the level of ROS.
Apoptosis was detected using a TUNEL assay kit (G1501, Servicebio, Wuhan, China). Liver tissue sections were dewaxed, treated with proteinase K solution, and permeabilized with membrane-breaking solution. Reagent 1 (TdT), reagent 2 (FITC-12-dUTP), and equilibrium buffer were mixed at a ratio of 2:5:50 and incubated with the sections for 1 h at 37°C. 1 μg/mL DAPI working solution was added, and samples were incubated in the dark for 8 min. Then, the sections were sealed with an anti-fluorescence quencher, and the staining results were observed with a fluorescence microscope (Nikon Eclipse C1, Nikon, Tokyo, Japan). Nuclei appeared blue with DAPI staining, while apoptotic cells showed green fluorescence due to FITC labeling.
2.14 Ultrasonic Shear Wave Elastography
Liver stiffness was measured by a liver shear wave quantitative ultrasound diagnostic instrument (FibroScan 502, Echosens, Paris, France). Of note, this device is originally designed for clinical use in humans, and its application in mice is exploratory without a well-established standardized protocol. Mice were anesthetized with sodium pentobarbital (50 mg/kg, intraperitoneal injection) and placed in the supine position on a heated platform (37°C). The abdomen was shaved, and ultrasound coupling gel was applied to the skin. The M-type probe (3.5 MHz) was placed on the right upper abdomen over the liver area. For each mouse, 10 consecutive valid measurements were acquired. Measurements with a success rate > 60% and an interquartile range (IQR)/median stiffness ratio ≤ 30% were considered valid, and the median liver stiffness value was calculated for each mouse.
HepG2 cells and mouse liver were fixed with 4% paraformaldehyde and blocked with 10% goat serum for 30 min. Alpha smooth muscle actin (α-SMA, BF9212, 1:200, Affinity, Jiangsu, China), Collagen III (Col-III, AF5457, 1:500, Affinity), NF-κB p65 (p65, AF5006, 1:200, Affinity), NLRP3 (DF7438, 1:500, Affinity) antibodies were added and incubated overnight at 4°C. After that, fluorescent antibody IgG (Goat Anti-Rabbit IgG H&L, ab150077, 1:500, Abcam, Cambridge, UK) was added and incubated for 2 h. Finally, 1 μg/mL DAPI staining solution was added for nuclear staining. The slides were dried and sealed with an anti-fluorescence quencher. Finally, the slides were observed under a fluorescence microscope, and the images were collected.
Mouse liver tissue was quickly thawed, and HepG2 cells were collected. RIPA lysis buffer (G2002, Servicebio) containing a protease inhibitor was added for homogenization. After lysis and centrifugation, the supernatant containing total protein was collected. Protein concentrations were quantified using BCA assay kits (G2026, Servicebio), and equal amounts of protein were prepared for analysis. Samples were denatured, resolved by SDS-PAGE, and transferred to PVDF membranes at constant current (250 mA) for 60 min at 4°C. The membranes were blocked with 5% skim milk in TBST for 90 min, then incubated overnight at 4°C with gentle shaking with primary antibodies (Table 2). Membranes were washed three times with TBST and incubated with HRP-conjugated Goat Anti-Rabbit IgG (H + L) (ab205718, 1:50,000, Abcam) for rabbit-derived primary antibodies, or HRP-conjugated Goat Anti-Mouse IgG (H + L) (ab6789, 1:10,000, Abcam) for mouse-derived primary antibodies for 2 h at room temperature. Enhanced chemiluminescence (ECL) substrate (G2161, Servicebio) was applied, and protein bands were visualized using a ChemiDoc XRS+ imaging system (Bio-Rad, Hercules, CA, USA). Band intensities were quantified by densitometry.
Table 2: The primary antibodies used for the Western blot.
| Protein Name | Dilution Ratio | Catalog Number | Producer |
|---|---|---|---|
| α-SMA | 1: 1000 | BF9212 | Affinity |
| Col-III | 1: 2000 | AF5457 | Affinity |
| Fibronectin | 1: 1000 | AF5335 | Affinity |
| p65 | 1: 2000 | AF5006 | Affinity |
| NLRP3 | 1: 2000 | DF7438 | Affinity |
| p-p65 | 1: 2000 | AF2006 | Affinity |
| IκBα | 1: 2000 | AF6239 | Affinity |
| p-IκBα | 1: 2000 | AF2002 | Affinity |
| Sterol regulatory element-binding protein-1c (SREBP-1c) | 1: 2000 | AF6283 | Affinity |
| Fatty acid synthase (FASN) | 1: 2000 | DF6106 | Affinity |
| Cluster of differentiation 36 (CD36) | 1: 1000 | ab252923 | Abcam |
| Carnitine palmitoyltransferase 1A (CPT1A) | 1: 1000 | ab128568 | Abcam |
| apoptosis-associated speck-like protein containing CARD (ASC) | 1: 1000 | ab309497 | Abcam |
| F-GSDMD | 1: 1000 | ab219800 | Abcam |
| N-GSDMD | 1: 1000 | ab215203 | Abcam |
| Caspase-3 | 1: 1000 | ab13585 | Abcam |
| Caspase-1 | 1: 2000 | DF6148 | Affinity |
| Cl-Caspase-3 | 1: 2000 | AF7022 | Affinity |
| Cl-Caspase-1 | 1: 2000 | AF4005 | Affinity |
| B-cell lymphoma 2 (Bcl-2) | 1: 2000 | AF6139 | Affinity |
| Bcl-2-associated X protein (Bax) | 1: 3000 | AF0120 | Abcam |
| GAPDH | 1: 50000 | AF0911 | Affinity |
Statistical analysis was conducted using SPSS version 27.0 (IBM Corp., Armonk, NY, USA). Normality of data distribution was assessed using the Shapiro-Wilk test, and homogeneity of variances was evaluated using Levene’s test. All data met the assumptions of normality and homogeneity of variance before parametric analysis. For in vitro experiments, each independent experiment was repeated six times (biological replicates, n = 6), and each treatment group within an experiment contained three technical replicates. For in vivo experiments, n represents the number of mice per group (n = 9). One-way ANOVA was utilized, followed by Dunnett’s post hoc test for group comparisons. Data for each group were presented as mean ± standard deviation, with p < 0.05 deemed statistically significant.
3.1 Ori Treatment Alleviated FFA-Induced HepG2 Cell Injury
HepG2 cells share homology with primary human hepatocytes and exhibit similar metabolic phenotypes, making them a widely used model for studying energy metabolism and drug effects. Prior studies confirm that FFA induces steatosis in HepG2 cells, comparable to fatty liver hepatocytes [28]; thus, this strategy was used here to construct an FFA-induced liver injury model. HepG2 cells were exposed to FFA (0–2 mM) for 24 h. MTT results showed that 0.5, 1, 1.5, and 2 mM FFA significantly reduced cell viability, and the cell viability of 1, 1.5, and 2 mM FFA groups was not significantly different (Fig. 1A). Balancing modeling efficiency and cell condition, 1 mM FFA was selected as the induction concentration. The cells were co-cultured with 1 mM FFA and different concentrations of Ori (0–20 μM). Ori reversed the decrease in HepG2 cell viability induced by FFA (Fig. 1B), and 2.5 μM (Ori-L), 5 μM (Ori-M), and 10 μM (Ori-H) were selected as the low, medium, and high dose groups for subsequent experiments. FFA significantly reduced the viability of HepG2 cells, while it was significantly increased after Ori treatment (Fig. 1C). After FFA induction, the LDH release rate was significantly enhanced (Fig. 1D), the number of green living cells in Calcein AM/PI staining was markedly reduced, and the number of red dead cells was significantly raised (Fig. 1E,F), and the apoptosis rate in flow cytometry was also significantly increased (Fig. 1G,H). The expression levels of Bax and Cl-Caspase-3 proteins were markedly enhanced, and the level of Bcl-2 protein was notably lessened (Fig. 1I–L), indicating that FFA successfully induced the injury and apoptosis of liver cells. After Ori treatment, the above indices were significantly reversed (Fig. 1D–L). Ori effectively reduced FFA-induced HepG2 cell damage.

Figure 1: Ori treatment alleviated FFA-induced HepG2 cell injury. (A) HepG2 cells were exposed to FFA for 24 h. The viability of HepG2 cells was detected through the MTT experiment. (B) HepG2 cells were co-cultured with 1 mM FFA and different concentrations of Ori for 24 h. The viability of HepG2 cells was assessed by the MTT experiment. (C) HepG2 cells were exposed to FFA and Ori. The MTT assay assessed the viability of HepG2 cells. (D) The LDH release rate of HepG2 cells was detected using a kit. (E,F) Calcein AM/PI staining detected cell death (×40, 50 μm). (G,H) Flow cytometry assessed the apoptosis rate. (I–L) WB detected the expression levels of apoptosis proteins Bcl-2, Bax, and Cl-Caspase-3. n = 6, ns p > 0.05, *p < 0.05, **p < 0.01, ***p < 0.001.
3.2 Ori Treatment Alleviated FFA-Induced Lipid Accumulation
Excessive intracellular lipid accumulation impairs cell function. Oil Red O staining revealed increased orange lipid droplets and deposition in FFA-treated HepG2 cells, which were significantly reduced following Ori intervention (Fig. 2A,B). To elucidate the lipid-lowering and antioxidant effects of Ori, we measured key lipid components and oxidative stress markers. Quantitative analysis showed that FFA significantly elevated the levels of TG, TC, and MDA while suppressing the activity of SOD; Ori treatment reversed these changes in a dose-dependent manner, boosting SOD and lowering TG, TC, and MDA (Fig. 2C–F). Bodipy staining further confirmed these findings: FFA markedly enhanced green fluorescence indicative of neutral lipid accumulation, which Ori attenuated (Fig. 2G,H). Subsequently, we further examined the expression of lipid metabolism-related proteins. WB results showed that FFA treatment significantly up-regulated the expression of lipid synthesis key proteins SREBP-1c and FASN, up-regulated the expression of fatty acid transporter CD36, and down-regulated the expression of fatty acid oxidation key protein CPT1A. After Ori intervention, the protein levels of SREBP-1c, FASN, and CD36 decreased in a concentration-dependent manner, and the expression of CPT1A increased significantly (Fig. 2I–M). The above results suggested that Ori might attenuate FFA-induced lipid deposition in HepG2 cells. Hepatocyte damage was further assessed via ALT and AST levels—established biomarkers released extracellularly upon injury [29]. Both enzymes increased significantly post-FFA induction but decreased markedly with Ori treatment (Fig. 2N,O). Thus, Ori effectively alleviated FFA-induced lipid accumulation, oxidative damage, and liver cell damage.

Figure 2: Ori treatment alleviated FFA-induced lipid accumulation. (A,B): Oil red O staining of HepG2 cells representative images and histograms (×20, 100 μm). (C–F): The levels of lipid compositions (TG and TC) and oxidative stress indicators (SOD and MDA) were detected by the kits. (G,H): Bodipy fluorescence staining of HepG2 cells representative images and quantitative analysis (×40, 50 μm). (I–M): WB was used to detect the expression levels of lipid metabolism-related proteins SREBP-1c, FASN, CPT1A, and CD36. (N,O): The contents of ALT and AST were detected by the kit, which were significantly decreased after Ori treatment. n = 6, ns p > 0.05, *p < 0.05, **p < 0.01, ***p < 0.001.
3.3 Ori Treatment Alleviated FFA-Induced Inflammation and Pyroptosis in HepG2 Cells
The uncontrolled inflammatory response and abnormal activation of pyroptosis are the core pathological mechanisms of NASH [30,31]. After FFA induction, the DCFH-DA fluorescence intensity of HepG2 cells was notably enhanced, and the ROS level was markedly raised, while Ori reduced the ROS level (Fig. 3A,B). The results of ELISA showed that the contents of IL-18, IL-1β, and TNF-α were markedly increased after FFA stimulation. Ori intervention effectively inhibited the release of these inflammatory factors (Fig. 3C–E). Pyroptosis was accompanied by the destruction of cell membrane integrity. PI/Hoechst 33342 immunofluorescence staining showed that a large number of PI red-positive cells appeared in the FFA group. Ori significantly reduced PI-positive cells (Fig. 3F,G), indicating that Ori could protect cell membrane integrity and reduce FFA-induced cell death. The specific detection of pyroptosis further confirmed that the proportion of Caspase-1+ cells was markedly enhanced after FFA induction, while Ori treatment significantly reduced the proportion of Caspase-1+ pyroptosis cells (Fig. 3H,I). Consistent with the WB results, FFA promoted the activation of pyroptosis execution protein GSDMD (increased N-GSDMD expression) and Caspase-1 (increased Cl-Caspase-1 expression). Ori treatment inhibited the production of N-GSDMD and Cl-Caspase-1 (Fig. 3J–L). In conclusion, Ori could effectively alleviate FFA-induced hepatocyte inflammation and pyroptosis.

Figure 3: Ori treatment alleviated FFA-induced inflammation and pyroptosis. (A,B) DCFH-DA fluorescence staining was used to evaluate ROS levels (×20, 100 μm). (C–E): The contents of IL-18, IL-1β, and TNF-α were detected using ELISA. (F,G): PI/Hoechst 33342 immunofluorescence staining representative images and quantitative analysis (×40, 50 μm). (H,I) The proportion of Caspase-1+ pyroptosis cells was assessed through flow cytometry. (J–L) The expression of the pyroptosis proteins N-GSDMD, F-GSDMD, Cl-Caspase-1, and Caspase-1 was assessed through WB. n = 6, ns p > 0.05, *p < 0.05, **p < 0.01, ***p < 0.001.
3.4 Ori Treatment Ameliorated FFA-Induced Upregulation of Fibrosis-Related Markers in HepG2 Cells
We therefore examined the effect of Ori on the expression of fibrosis-related markers in FFA-treated HepG2 cells. Immunofluorescence revealed significantly enhanced α-SMA and Col-III fluorescence intensity in FFA-treated HepG2 cells. Ori treatment dose-dependently reduced α-SMA and Col-III fluorescence (Fig. 4A–D). WB results further confirmed that FFA stimulation significantly up-regulated the expression of fibrosis key proteins α-SMA, Col-III, and Fibronectin, while Ori intervention effectively reversed this abnormal up-regulation trend, and the inhibitory effect of the high-dose group on fibrosis-related proteins was particularly significant (Fig. 4E–H). Scratch assay further demonstrated that FFA treatment enhanced the migration rate of HepG2 cells, while Ori markedly inhibited this migration ability in a dose-dependent manner (Fig. 4I,J). To confirm that the Ori concentrations used in the scratch assay were non-cytotoxic over the 24–48 h observation period, MTT assays were performed. Ori treatment did not compromise cell viability; instead, it significantly increased cell viability at both 24 h and 48 h (Fig. A1B,C). These results supported that the effects observed in the scratch assay reflected genuine regulation of cell migration by Ori rather than off-target cytotoxicity. In conclusion, Ori could effectively inhibit fibrosis-related proteins and reduce hepatocyte migration activity. It should be noted that these observations are limited to cell-based molecular marker expression and migratory behavior; no direct evidence of fibrosis phenotype was demonstrated in this in vitro setting.

Figure 4: Ori treatment ameliorated FFA-induced upregulation of fibrosis-related markers in HepG2 cells. (A–D): Immunofluorescence assessment of α-SMA and Col-III levels (×40, 50 μm). (E–H) WB detected the expression levels of α-SMA, Col-III, and Fibronectin proteins. (I,J) The cell migration rate was detected by scratch healing assay (×10, 200 μm). n = 6, **p < 0.01, ***p < 0.001.
3.5 Ori Inhibited the Expressions of NF-κB and NLRP3 and Alleviated FFA-Induced HepG2 Cell Injury
The NF-κB/NLRP3 axis represents a central pathway mediating pyroptosis and inflammatory responses. To further elucidate the mechanisms by which Ori ameliorates FFA-induced HepG2 cell injury, we specifically examined the activation of the NF-κB/NLRP3 axis. Immunofluorescence results showed that FFA induction significantly promoted the nuclear translocation of the p65 subunit and enhanced the fluorescence intensity of NLRP3 (Fig. 5A–D). Ori treatment inhibited the nuclear translocation of p65 and the fluorescence intensity of NLRP3. WB experiments further confirmed that FFA induction could significantly increase the expression levels of NF-κB activation markers p-p65, p-IκBα, and NLRP3 inflammasome-related proteins NLRP3 and ASC (Fig. 5E–I). Ori intervention effectively reversed the abnormal activation of these key proteins, indicating that Ori could simultaneously inhibit NF-κB and NLRP3 activation.
To validate this mechanism, LPS/ATP was used to robustly activate NLRP3, partially reversing the protective effects of Ori against FFA-induced damage. Compared to Control and FFA + Ori-H groups, LPS/ATP treatment markedly increased PI-positive (red) cells in PI/Hoechst 33342 immunofluorescence staining (Fig. 6A,B) and reactivated the NF-κB/NLRP3 pathway (Fig. 6C–G), while significantly reducing the viability of HepG2 cells (Fig. 6H). Notably, LPS/ATP had no significant effect on the number of intracellular lipid droplets and orange-red positive area in oil red O staining (Fig. 6I,J), suggesting that Ori’s regulation of lipid metabolism may be independent of the NF-κB/NLRP3 axis. Additionally, LPS/ATP notably promoted the release of IL-18, IL-1β, and TNF-α (Fig. 6K–M) and increased the expression of α-SMA, Col-III, and Fibronectin (Fig. 6N–Q), which further confirmed that activating the NF-κB/NLRP3 axis was associated with inflammation and fibrosis processes. The results showed that Ori alleviated FFA-induced hepatocyte pyroptosis, inflammation, and fibrosis via suppressing the NF-κB/NLRP3 signaling.

Figure 5: Ori inhibited the expression of NF-κB and NLRP3. (A–D): p65 nuclear translocation and NLRP3 level were detected by immunofluorescence (×40, 50 μm). (E–I) WB was used to detect the expression levels of the NF-κB/NLRP3 marker proteins p65, p-p65, IκBα, p-IκBα, NLRP3, and ASC. n = 6, **p < 0.01, ***p < 0.001.

Figure 6: Ori inhibited the expressions of NF-κB and NLRP3 and alleviated FFA-induced HepG2 cell injury. (A,B): PI/Hoechst 33342 immunofluorescence staining representative images and quantitative analysis (×40, 50 μm). (C–G): WB detected the expression levels of the NF-κB/NLRP3 signaling pathway marker proteins p65, p-p65, IκBα, p-IκBα, NLRP3, and ASC. (H) The MTT assay detected the viability of HepG2 cells. (I,J) Oil red O staining representative images and histograms (×20, 100 μm). (K–M) The contents of IL-18, IL-1β, and TNF-α were detected using ELISA. (N–Q) WB detected the levels of α-SMA, Col-III, and Fibronectin proteins. n = 6, ns p > 0.05, *p < 0.05, **p < 0.01, ***p < 0.001.
3.6 Ori Alleviated Liver Injury and Steatosis in NASH Mice
Given Ori’s ability to ameliorate FFA-induced HepG2 cell injury in vitro, we next evaluated its therapeutic efficacy in MCD diet-induced NASH mice (in vivo). The NASH model was established via MCD feeding, with Ori administered by daily intraperitoneal injection for 4 weeks. The specific experimental procedure was shown in Fig. 7A. Macroscopic observation showed that the liver surface of normal mice was smooth, dark red in color, soft and elastic in texture, and the edge of the liver lobe was sharp. The liver volume of NASH mice increased, and the color became lighter, showing typical lesion characteristics. The liver color was slightly red, and the liver lesions were relieved to a certain extent in each dose group of Ori (Fig. 7B). The hepatic lobules of normal mice were intact, the hepatocytes were arranged neatly, and the liver plates were radially arranged with the central vein as the center, without obvious pathological changes. NASH mice showed extensive hepatocyte vacuolar degeneration, hepatocyte necrosis around the central vein and portal area, infiltration of inflammatory cells between lobules, destruction of hepatic lobule structure, balloon-like degeneration of more hepatocytes, and a significant increase in scores. Ori significantly reduced the degree of inflammatory cell infiltration and hepatocyte ballooning in the lobules and significantly reduced the HE staining score (Fig. 7C,D). No stained lipid droplets were observed in the liver tissue of normal mice. The orange-red lipid droplets in NASH mice increased significantly, and the lipid droplets were diffusely and granularly accumulated, fused into sheets, and the orange-red lipid deposition area increased significantly. Ori markedly reduced lipid droplets and orange lipid deposition area in hepatocytes, and the volume of lipid droplets was relatively small (Fig. 7E,F). The results of biochemical indicators were consistent with the pathological features. MCD diet feeding resulted in significant body weight loss and a reduction in absolute liver weight, consistent with the well-documented metabolic characteristics of the MCD-induced NASH model. Despite the decrease in absolute liver weight, the liver index was markedly elevated due to a proportionally greater reduction in body weight. Following Ori treatment, body weight was partially restored, while absolute liver weight showed no significant change compared to the MCD group. Consequently, the liver index was significantly reduced (Fig. 7G–I). Bodipy fluorescence staining found that green fluorescence intensity in liver tissue was markedly enhanced (Fig. 7J,K). The contents of TG and TC were significantly increased (Fig. 7L,M); the levels of lipid metabolism-related proteins SREBP-1c, FASN, and CD36 were significantly increased, the expression of CPT1A protein was significantly decreased (Fig. 7N–R), and the contents of AST and ALT were also markedly enhanced (Fig. 7S,T), indicating that the MCD diet successfully induced liver damage and abnormal lipid deposition in mice. After the Ori treatment, the above abnormal indicators were significantly alleviated, and the degree of lipid deposition and liver injury was reduced. These results indicated that Ori might partially alleviate MCD-induced liver steatosis and injury in the NASH.

Figure 7: Ori alleviated liver injury and steatosis. (A): Flow chart of NASH mouse model construction. (B): The representative image of the macroscopic morphology of the mouse liver. (C,D) HE staining of the liver representative images and scoring statistics (×20, 100 μm). (E,F) Liver oil red O staining represents the images and histograms (×40, 50 μm). (G–I) The body weight curve, absolute liver weight, and liver index of mice in each group were measured. (J,K): Liver Bodipy fluorescence staining represents the image and quantitative analysis (×40, 50 μm). (L,M) The contents of TG and TC were measured by the kits. (N–R) WB was used to detect the expression levels of lipid metabolism-related proteins SREBP-1c, FASN, CPT1A, and CD36 in liver tissue. (S,T) The contents of ALT and AST were detected by the kits. n = 9, ns p > 0.05, **p < 0.01, ***p < 0.001.
3.7 Ori Alleviated Oxidative Stress, Inflammation, Pyroptosis, and Fibrosis in the Liver Cells of NASH Mice
The detection of oxidative stress and inflammation markers showed that the activity of SOD of NASH mice was markedly decreased, while the content of MDA was significantly increased (Fig. 8A,B), and inflammatory factors were notably up-regulated (Fig. 8C–E). DCFH-DA fluorescence staining further confirmed that the ROS level of NASH mice was significantly increased (Fig. 8F,G). This suggested that liver inflammation and oxidative damage were serious, and oxidative stress and inflammatory response were synergistically activated. TUNEL staining revealed a remarkable increase in the number of TUNEL+ cells of NASH mice, suggesting an increase in cell apoptosis (Fig. 8H,I). Further histological analysis showed that blue collagen fibers proliferated in the lobules and around the portal area of NASH mice, and the area of collagen deposition increased significantly (Fig. 8J,K). The Fibroscan test showed that liver stiffness increased significantly (Fig. 8L), consistent with the aggravated liver fibrosis indicated by histological and protein analyses. Immunofluorescence revealed that the fluorescence intensities of α-SMA and Col-III were significantly enhanced (Fig. 8M–P). WB also found that the expression levels of N-GSDMD and Cl-Caspase-1 proteins in NASH mice increased, and the levels of fibrosis markers α-SMA, Col-III, and Fibronectin proteins also increased significantly (Fig. 8Q–V). These findings confirmed pyroptosis activation and fibrosis progression. Intervention with different Ori doses significantly alleviated the aforementioned pathological indices. These results fully demonstrated that Ori effectively alleviated liver oxidative damage, inflammatory response, pyroptosis, and fibrosis in NASH mice.

Figure 8: Ori alleviated oxidative stress, inflammation, pyroptosis, and fibrosis in the liver cells of NASH mice. (A,B) The oxidative stress indices SOD and MDA were detected by the kits. (C–E): The contents of IL-18, IL-1β, and TNF-α were detected using ELISA. (F,G): DCFH-DA fluorescence staining assessed the levels of ROS (×40, 50 μm). (H,I) TUNEL staining detected apoptosis in liver tissue (×40, 50 μm). (J,K): Liver Masson staining representative images and collagen area statistics (×20, 100 μm). (L) Liver stiffness was measured by the FibroScan instrument. (M–P): Immunofluorescence assessment of the levels of liver α-SMA and Col-III (×40, 50 μm). (Q–V): The expression levels of pyroptosis (N-GSDMD, F-GSDMD, Cl-Caspase-1, and Caspase-1) and fibrotic (α-SMA, Col-III, and Fibronectin) proteins were detected by WB. n = 9, ns p > 0.05, *p < 0.05, **p < 0.01, ***p < 0.001.
3.8 Ori Attenuates NASH Injury by Inhibiting the NF-κB/NLRP3 Pathway
The nuclear translocation of the p65 subunit and the fluorescence intensity of NLRP3 were also detected in the liver of NASH mice (Fig. 9A–D). Ori inhibited the nuclear translocation of p65 and the fluorescence intensity of NLRP3, indicating that Ori also suppressed the NF-κB/NLRP3 pathway in vivo. The expression levels of p-p65, p-IκBα, NLRP3, and ASC proteins were also significantly increased in NASH mice and significantly decreased after Ori intervention (Fig. 9E–I). In summary, Ori could inhibit the NF-κB/NLRP3 signaling and alleviate NASH injury.

Figure 9: Ori attenuated NASH injury via suppressing the NF-κB/NLRP3 pathway. (A–D): The nuclear translocation of p65 and the level of NLRP3 were detected by immunofluorescence (×40, 50 μm). (E–I) WB was used to detect the expression levels of the NF-κB/NLRP3 marker proteins p65, p-p65, IκBα, p-IκBα, NLRP3, and ASC. n = 9, *p < 0.05, **p < 0.01, ***p < 0.001.
The pathological process of NASH involves the dynamic imbalance of lipid metabolism disorders, oxidation, inflammation, pyroptosis, and fibrosis. Among them, NLRP3-mediated pyroptosis is a key node connecting inflammation and liver injury [6,14,32]. This study systematically confirmed that Ori can significantly attenuate hepatocyte injury, lipid accumulation, inflammatory response, and fibrosis in NASH. Its core mechanism is associated with inhibiting the NF-κB/NLRP3 axis and the mediated pyroptosis, which provides experimental support for its clinical transformation.
Abnormal lipid accumulation in liver tissue is a typical feature of the early stage of NASH. Widespread lipid deposition can further lead to excessive liver inflammation, induce liver fibrosis, and even cirrhosis. Modulating hepatic lipid metabolism represents a key strategy for ameliorating NASH-associated lipid accumulation and indirectly mitigating inflammation-induced hepatocyte damage [33]. TC and TG are components of blood lipids and important indicators of lipid metabolism [34]. At the same time, it has been reported that oxidation is a vital driver of lipid metabolism disorders. Oxidative stress promotes ROS overproduction, triggering lipid peroxidation and thereby exacerbating lipid metabolism disorders [35,36]. As a core biomarker of lipid peroxidation, the increase in MDA level directly reflects the degree of oxidative stress, and it is also positively correlated with the severity of NAFLD [36,37]. First, we observed that Ori treatment significantly increased cell viability, reduced LDH release, and inhibited apoptosis, indicating that Ori has a direct protective effect on hepatocytes. In addition, in vitro experiments showed that Ori reduced lipid droplet accumulation and the content of TG and TC, which was highly consistent with the intervention needs of early lipid metabolism disorders in NASH. At the same time, Ori can reduce the levels of ROS and MDA, restore SOD activity, and alleviate oxidative stress injury. Oxidative stress is a classic cause of NLRP3 inflammasome activation [38,39]; its inhibition may block pyroptosis initiation from upstream. Histopathological evaluation of MCD-fed mice is the gold standard for assessing NASH-related liver injury. In vivo experiments showed that Ori not only significantly reduced serum ALT and AST activity and liver hardness values but also improved pathological parameters, as assessed by HE staining and Oil Red O staining. The results showed that the ballooning degeneration, inflammatory infiltration, and lipid accumulation of hepatocytes were alleviated in a dose-dependent manner after Ori intervention, and the remission trend of histological damage was highly consistent with the downward trend of biochemical indexes such as ALT, AST, and liver hardness. This good ‘biochemical-pathological’ correspondence provides sufficient evidence for Ori to reverse NASH-related pathological damage, suggesting that the improvement of biochemical indicators does reflect substantial histological repair.
Inflammatory response is an important part of the development of NASH. Pro-inflammatory cytokines can activate liver cells, thereby promoting collagen deposition and ultimately leading to fiber formation [40]. Liver fibrosis is a key histopathological characteristic of patients with NASH, indicating significant and advancing liver damage in these individuals [41]. Ori could significantly reduce α-SMA and Col-III protein levels in HepG2 cells and the liver of NASH mice, and Ori also inhibited the proliferation of collagen fibers and the increase in liver hardness in liver tissue, suggesting that Ori may alleviate NASH by reducing liver fibrosis.
NASH is characterized by hepatic inflammatory responses. Certain inflammatory cytokines act directly on liver tissue to trigger local inflammation, thereby promoting hepatocyte apoptosis and liver fibrosis [42]. TNF-α is produced by immune cells such as macrophages, which can directly promote lipid increase, accelerate other inflammatory factor release, and ultimately cause liver tissue damage [43]. Pyroptosis is a form of cell death that amplifies inflammation. Pyroptosis is associated with NASH occurrence [31]. Pyroptosis is defined by the creation of pores in the cell membrane and the secretion of IL-1β and IL-18, which intensifies the inflammation [12,42]. Inhibition of hepatocyte pyroptosis can effectively reduce liver fat deposition and alleviate liver inflammation [44]. Our data showed similar results. Ori significantly reduced inflammatory factor levels, reduced FFA and MCD feed-induced Caspase-1 activation, N-GSDMD production, and pyroptosis key indicators, PI positive cell rate, and Caspase-1 positive cell rate. These results indicate that inhibiting hepatocyte pyroptosis and reducing inflammatory injury are important ways for Ori to alleviate NASH liver injury.
The activation of NLRP3 is an inflammatory link in the NASH process. After activation of NLRP3, Caspase-1 and GSDMD are further activated, leading to the formation of N-GSDMD, which inserts into the cell membrane, disrupting its integrity. Meanwhile, it can activate inflammatory factors IL-1β and IL-18, forming an amplified inflammation to accelerate NASH occurrence [45]. NF-κB is an important pathway engaged in inflammation, which can promote the expression of inflammatory factors and cause a series of inflammatory reactions. The NF-κB pathway is associated with NASH pathogenesis. Suppressing NF-κB effectively alleviates the production of inflammatory factors in mouse hepatocytes [46]. Studies have shown that hyperuricemia can induce NLRP3/Caspase-1/GSDMD-mediated pyroptosis in the liver of mice, thereby aggravating the inflammatory response of NASH [47]. Piperine can reduce NASH by inhibiting NF-κB-mediated hepatocyte pyroptosis, reducing NLRP3, Caspase-1, ASC, and GSDMD expressions, and reducing IL-1β and LDH contents [48]. Kinsenoside can inhibit the NF-κB/NLRP3 axis to alleviate inflammation and fibrosis in NASH mice [49]. In this study, FFA induction and MCD diet intervention significantly promoted p65 nuclear translocation, p-IκBα phosphorylation, and up-regulated NLRP3, ASC, and IL-1β expressions, confirming that the NF-κB/NLRP3 axis was continuously activated in the NASH model. Ori inhibited the NF-κB/NLRP3 axis. More importantly, the callback experiment confirmed that the reactivation of the NF-κB/NLRP3 axis by the exogenous agonist LPS/ATP could significantly reverse the protective effect of Ori on pyroptosis and liver injury, thus verifying that the NF-κB/NLRP3 axis was the core target for Ori to exert its effect.
Notably, this study observed that Ori significantly reduced ROS levels in FFA-induced HepG2 cells and MCD diet-induced mouse livers, while reducing lipid peroxidation product MDA content and restoring antioxidant enzyme SOD activity. This result suggests that in addition to the clarified inhibition of the NF-κB/NLRP3 inflammasome pathway, Ori may also exert a direct antioxidant effect through a pathway independent of the inflammasome. Oxidative stress is not only a classic upstream cause of NLRP3 inflammasome activation but also an independent driver of hepatocyte injury and lipid metabolism disorders. Therefore, the dual mechanism of Ori, that is, direct scavenging of ROS/enhancing antioxidant defense system and indirect inhibition of inflammasome activation, may synergistically exert hepatoprotective effects. It should be noted that this study has not yet systematically elucidated the specific molecular mechanism of Ori’s direct antioxidant effect. Existing studies have shown that natural terpenoids often enhance endogenous antioxidant capacity by regulating the nuclear factor E2-related factor 2 (Nrf2)/heme oxygenase-1 (HO-1) pathway [50,51]. Based on this, we speculate that Ori may reduce oxidative stress injury by activating the Nrf2/HO-1 signaling axis and up-regulating the expression of antioxidant enzymes such as SOD. Nevertheless, our study has not directly tested this pathway, and the observed effects on oxidative stress markers could also be secondary to the overall improvement in cellular health. Therefore, the possibility of a direct antioxidant effect should be considered preliminary and requires dedicated future investigation. Subsequent studies will verify this hypothesis by the following experiments: detecting the effect of Ori on the activation of the Nrf2/HO-1 pathway; using Nrf2 inhibitors or gene knockdown techniques to verify whether the antioxidant effect of Ori is dependent on Nrf2. The above research will help to elucidate the dual protection mechanism of Ori’s ‘anti-inflammatory + anti-oxidation’ and provide more comprehensive theoretical support for its clinical transformation.
Comparing Ori in a broader NASH therapeutic drug pattern will help to more clearly assess its clinical transformation potential. In recent years, a variety of inhibitors targeting the NLRP3 inflammasome pathway have shown therapeutic potential in NASH models. MCC950 (a selective NLRP3 inhibitor) can effectively improve liver inflammation and fibrosis induced by MCD diet [52]; CY-09 (NLRP3-specific inhibitor) attenuates NAFLD-related metabolic disorders by blocking NLRP3 ATPase activity [53]. In clinical research, FGF21 analogue Pegozafermin has shown a good anti-fibrotic effect in phase IIb clinical trials and can effectively alleviate NASH [54]. GLP-1 receptor agonist Semaglutide also showed significant efficacy in phase III clinical trials: at 72 weeks, 62.9% of patients achieved steatohepatitis remission without fibrosis deterioration, and 36.8% of patients achieved fibrosis improvement [55]. In addition, the thyroid hormone receptor-β agonist Resmetirom has been approved by the FDA for the treatment of NASH with fibrosis, which also achieved the dual primary endpoint of NASH remission and fibrosis improvement in the phase III MAESTRO-NASH study [56].
Existing studies have shown that the pharmacokinetic characteristics of Ori in mice are as follows: rapid absorption after intravenous injection, rapid distribution, rapid onset, and rapid elimination [57]. In addition, the oral bioavailability of Ori is low (about 5%-10%), which limits the convenience of its clinical application. In the future, its pharmacokinetic characteristics can be improved by structural modification or new preparations (such as nano-delivery systems) [58,59]. However, as a candidate drug for treatment, the long-term safety of Ori has not been confirmed by experiments, and the evaluation of chronic toxicity, organ damage, and genetic toxicity still needs to be carried out in the follow-up research system. We will focus on the above-mentioned experimental exploration in the follow-up study to improve the scientific basis of Ori’s clinical transformation.
Although this study has clarified the core mechanism of Ori’s anti-NASH, there are still some limitations. First, regarding the mechanistic depth of the NF-κB/NLRP3 pathway, the current evidence is mainly associative rather than definitive. Although LPS/ATP stimulation can partially reverse the protective effect of Ori, it is still necessary to specifically inhibit this pathway through genetics (such as NLRP3 or p65 siRNA/knockout) or pharmacology (such as MCC950 or BAY 11-7082) to further verify that it is the key mediating mechanism for Ori to play a protective role. Secondly, the HepG2 single-cell model was used for in vitro experiments. Although it can simulate the characteristics of lipid metabolism in hepatocytes, it lacks the participation of non-parenchymal cells (hepatic stellate cells and Kupffer cells), and it is difficult to fully reflect the complex intercellular interaction in the course of NASH. In the future, key results can be verified in models closer to physiological state, such as primary hepatocytes and hepatic stellate cells. In this study, only one animal model was involved, and the efficacy of the drug can be observed through different animal models and cell models in subsequent studies. Thirdly, regarding the dose-effect relationship of Ori in vivo, although three dose groups of low (2 mg/kg), medium (4 mg/kg), and high (6 mg/kg) were set up in this study, and dose-dependent protective effects were observed, it was not clear whether there was an optimal therapeutic range or plateau effect. Subsequent studies will further clarify the optimal therapeutic range and dose-effect characteristics of Ori in NASH mice through more detailed dose gradient experiments, providing a more reliable pharmacological basis for clinical transformation. Fourth, this study mainly focuses on NLRP3 inflammasome-mediated pyroptosis, but pyroptosis is a multifaceted process. AIM2, caspase-11, and other inflammasomes or non-classical pyroptosis pathways may also be involved in the pathogenesis of NASH [60,61]. This study did not systematically explore the role of the above pathways, so whether the AIM2 or caspase-11 pathway is involved in the protective effect of Ori remains to be further verified. In the future, through more comprehensive molecular screening and functional verification, the cross-regulation mechanism of multiple pyroptosis pathways will be systematically analyzed, which will provide a more sufficient basis for elucidating the complete network of Ori. In addition, the long-term safety and potential off-target effects of Ori have not been fully evaluated in this study. Ori has multi-target action characteristics, which may cause chronic toxicity to major organs such as the liver and kidney during long-term administration, or trigger off-target effects through non-specific target regulation. Therefore, it is of great significance to carry out systematic chronic drug administration research, long-term toxicity evaluation (including general toxicity, genetic toxicity, and reproductive toxicity), and off-target effect screening (such as kinase spectrum screening and safety pharmacology research) before clinical transformation in the future.
In summary, this study demonstrated that Ori ameliorated hepatocyte pyroptosis, inflammation, and fibrosis by suppressing the NF-κB/NLRP3 pathway, thereby improving NASH pathological injury through multiple mechanisms. These findings provide essential theoretical and experimental support for developing Ori as a potential novel NASH therapeutic agent. Future research should identify Ori’s direct molecular targets and evaluate its long-term efficacy and safety across diverse NASH models to facilitate its clinical translation.
Acknowledgement:
Funding Statement: The authors received no specific funding for this study.
Author Contributions: Methodology, Shumin Pan; validation, Qianqian Peng, Fengjian He; formal analysis, Yinghua Ou; data curation, Qianqian Peng; writing—original draft preparation, Qianqian Peng; writing—review and editing, Fengjian He; supervision, Qianqian Peng, Fengjian He; All authors reviewed and approved the final version of the manuscript.
Availability of Data and Materials: The data supporting the findings of this study can be obtained from the corresponding author upon request.
Ethics Approval: This study was approved by the Third Affiliated Hospital of Southern Medical University Ethics Committee (Approval No.: 202409-007).
Conflicts of Interest: The authors declare no conflicts of interest.
Abbreviations
| Ori | oridonin |
| NASH | nonalcoholic steatohepatitis |
| FFA | free fatty acid |
| MCD | methionine-choline-deficient |
| NAFLD | nonalcoholic fatty liver disease |
| NLRP3 | nucleotide-binding oligomerization domain-like receptor protein 3 |
| Caspase-1 | cysteinyl aspartate-specific proteinase-1 |
| pro-IL-1β | pro-inflammatory cytokine IL-1β |
| pro-IL-18 | pro-inflammatory cytokine IL-18 |
| GSDMD | gasdermin D |
| NF-κB | nuclear factor-κB |
| LDH | lactate dehydrogenase |
| TG | triglyceride |
| TC | total cholesterol |
| SOD | superoxide dismutase |
| MDA | malondialdehyde |
| AST | aspartate aminotransferase |
| ALT | alanine aminotransferase |
| TNF-α | tumor necrosis factor-α |
| IL | interleukin |
| ROS | reactive oxygen species |
| Col-III | collagen III |
| α-SMA | alpha smooth muscle actin |
| WB | western blot |
| ASC | apoptosis-associated speck-like protein containing CARD |
| Bcl-2 | B-cell lymphoma 2 |
| Bax | Bcl-2-associated X protein |

Figure A1: Ori treatment increased HepG2 cell viability at 24 h and 48 h. (A): The chemical structure of Ori. (B,C) HepG2 cells were cultured with different concentrations of Ori for 24 h and 48 h, respectively. The viability of HepG2 cells was assessed by the MTT experiment. n = 6, *p < 0.05, **p < 0.01, ***p < 0.001.
References
1. Katsiki N , Stoian AP , Rizzo M . Dietary patterns in non-alcoholic fatty liver disease (NAFLD): Stay on the straight and narrow path! Clin Res Arterioscler. 2022; 34( Suppl 1): S24– 31. doi:10.1016/j.arteri.2021.10.001. [Google Scholar] [CrossRef]
2. Engin A . Nonalcoholic fatty liver disease and staging of hepatic fibrosis. Adv Exp Med Biol. 2024; 1460: 539– 74. doi:10.1007/978-3-031-63657-8_18. [Google Scholar] [CrossRef]
3. Rong L , Zou J , Ran W , Qi X , Chen Y , Cui H , et al. Advancements in the treatment of non-alcoholic fatty liver disease (NAFLD). Front Endocrinol. 2023; 13: 1087260. doi:10.3389/fendo.2022.1087260. [Google Scholar] [CrossRef]
4. Man S , Deng Y , Ma Y , Fu J , Bao H , Yu C , et al. Prevalence of liver steatosis and fibrosis in the general population and various high-risk populations: A nationwide study with 5.7 million adults in China. Gastroenterology. 2023; 165( 4): 1025– 40. doi:10.1053/j.gastro.2023.05.053. [Google Scholar] [CrossRef]
5. Teng ML , Ng CH , Huang DQ , Chan KE , Tan DJ , Lim WH , et al. Global incidence and prevalence of nonalcoholic fatty liver disease. Clin Mol Hepatol. 2023; 29: S32– 42. doi:10.3350/cmh.2022.0365. [Google Scholar] [CrossRef]
6. Chen H , Zhou Y , Hao H , Xiong J . Emerging mechanisms of non-alcoholic steatohepatitis and novel drug therapies. Chin J Nat Med. 2024; 22( 8): 724– 45. doi:10.1016/S1875-5364(24)60690-4. [Google Scholar] [CrossRef]
7. Wei S , Wang L , Evans PC , Xu S . NAFLD and NASH: Etiology, targets and emerging therapies. Drug Discov Today. 2024; 29( 3): 103910. doi:10.1016/j.drudis.2024.103910. [Google Scholar] [CrossRef]
8. Torres S , Segalés P , García-Ruiz C , Fernández-Checa JC . Mitochondria and the NLRP3 inflammasome in alcoholic and nonalcoholic steatohepatitis. Cells. 2022; 11( 9): 1475. doi:10.3390/cells11091475. [Google Scholar] [CrossRef]
9. Yu L , Hong W , Lu S , Li Y , Guan Y , Weng X , et al. The NLRP3 inflammasome in non-alcoholic fatty liver disease and steatohepatitis: Therapeutic targets and treatment. Front Pharmacol. 2022; 13: 780496. doi:10.3389/fphar.2022.780496. [Google Scholar] [CrossRef]
10. Mai M , Wang Y , Luo M , Li Z , Wang D , Ruan Y , et al. Silibinin ameliorates deoxycholic acid-induced pyroptosis in steatotic HepG2 cells by inhibiting NLRP3 inflammasome activation. Biochem Biophys Rep. 2023; 35: 101545. doi:10.1016/j.bbrep.2023.101545. [Google Scholar] [CrossRef]
11. Liu Q , Niu C , Zhang Q , Sun S , Chen Y , Shi Y . Amitriptyline inhibits NLRP3 inflammasome activation via the ASM/CE pathway in a cell model of NAFLD. BIOCELL. 2024; 48( 5): 759– 69. doi:10.32604/biocell.2024.048551. [Google Scholar] [CrossRef]
12. Vasudevan SO , Behl B , Rathinam VA . Pyroptosis-induced inflammation and tissue damage. Semin Immunol. 2023; 69: 101781. doi:10.1016/j.smim.2023.101781. [Google Scholar] [CrossRef]
13. Ashrafizadeh M . Cell death mechanisms in human cancers: Molecular pathways, therapy resistance and therapeutic perspective. J Cancer Biomol Ther. 2024; 1( 1): 17– 40. doi:10.62382/jcbt.v1i1.13. [Google Scholar] [CrossRef]
14. Knorr J , Wree A , Tacke F , Feldstein AE . The NLRP3 inflammasome in alcoholic and nonalcoholic steatohepatitis. Semin Liver Dis. 2020; 40( 3): 298– 306. doi:10.1055/s-0040-1708540. [Google Scholar] [CrossRef]
15. Chen F , Liu Y , Li Q , Wang F . Inhibition of hepatic NLRP3 inflammasome ameliorates non-alcoholic steatohepatitis/hepatitis B—Induced hepatic injury. Clin Res Hepatol Gastroenterol. 2023; 47( 1): 102056. doi:10.1016/j.clinre.2022.102056. [Google Scholar] [CrossRef]
16. Yang G , Jang JH , Kim SW , Han SH , Ma KH , Jang JK , et al. Sweroside prevents non-alcoholic steatohepatitis by suppressing activation of the NLRP3 inflammasome. Int J Mol Sci. 2020; 21( 8): 2790. doi:10.3390/ijms21082790. [Google Scholar] [CrossRef]
17. Bae WJ , Shin D , Piao JJ , Kim S , Choi YS , Park BH , et al. Extracorporeal shockwave therapy alleviates inflammatory pain by down-regulating NLRP3 inflammasome in experimental chronic prostatitis and chronic pelvic pain syndrome. World J Mens Health. 2024; 42( 1): 157– 67. doi:10.5534/wjmh.220241. [Google Scholar] [CrossRef]
18. Wu Y , Zhou J , Zuo X , Kuang Y , Sun L , Zhang X . Yanggan Jiangmei Formula alleviates hepatic inflammation and lipid accumulation in non-alcoholic steatohepatitis by inhibiting the NF-κB/NLRP3 signaling pathway. Chin J Nat Med. 2024; 22( 3): 224– 34. doi:10.1016/S1875-5364(24)60595-9. [Google Scholar] [CrossRef]
19. Ding X , He X , Tang B , Lan T . Integrated traditional Chinese and Western medicine in the prevention and treatment of non-alcoholic fatty liver disease: Future directions and strategies. Chin Med. 2024; 19( 1): 21. doi:10.1186/s13020-024-00894-1. [Google Scholar] [CrossRef]
20. Jiang J , Zhang N , Song H , Yang Y , Li J , Hu X . Oridonin alleviates the inhibitory effect of lipopolysaccharide on the proliferation and osteogenic potential of periodontal ligament stem cells by inhibiting endoplasmic reticulum stress and NF-κB/NLRP3 inflammasome signaling. BMC Oral Health. 2023; 23( 1): 137. doi:10.1186/s12903-023-02827-0. [Google Scholar] [CrossRef]
21. Li X , Zhang CT , Ma W , Xie X , Huang Q . Oridonin: A review of its pharmacology, pharmacokinetics and toxicity. Front Pharmacol. 2021; 12: 645824. doi:10.3389/fphar.2021.645824. [Google Scholar] [CrossRef]
22. Du X , Que W , Hu X , Yu X , Guo WZ , Zhang S , et al. Oridonin prolongs the survival of mouse cardiac allografts by attenuating the NF-κB/NLRP3 pathway. Front Immunol. 2021; 12: 719574. doi:10.3389/fimmu.2021.719574. [Google Scholar] [CrossRef]
23. Lin J , Lai X , Fan X , Ye B , Zhong L , Zhang Y , et al. Oridonin protects against myocardial ischemia-reperfusion injury by inhibiting GSDMD-mediated pyroptosis. Genes. 2022; 13( 11): 2133. doi:10.3390/genes13112133. [Google Scholar] [CrossRef]
24. Zhang Y , Pan T , Yang Y , Xu X , Liu Y . Oridonin attenuates diabetic retinopathy progression by suppressing NLRP3 inflammasome pathway. Mol Cell Endocrinol. 2025; 596: 112419. doi:10.1016/j.mce.2024.112419. [Google Scholar] [CrossRef]
25. Chen X , Xue W , Zhang J , Peng J , Huang W . Ginsenoside Rg1 attenuates the NASH phenotype by regulating the miR-375-3p/ATG2B/PTEN-AKT axis to mediate autophagy and pyroptosis. Lipids Health Dis. 2023; 22( 1): 22. doi:10.1186/s12944-023-01787-2. [Google Scholar] [CrossRef]
26. Liu D , Qin H , Yang B , Du B , Yun X . Oridonin ameliorates carbon tetrachloride-induced liver fibrosis in mice through inhibition of the NLRP3 inflammasome. Drug Dev Res. 2020; 81( 4): 526– 33. doi:10.1002/ddr.21649. [Google Scholar] [CrossRef]
27. Shi M , Deng Y , Yu H , Xu L , Shi C , Chen J , et al. Protective effects of oridonin on acute liver injury via impeding posttranslational modifications of interleukin-1 receptor-associated kinase 4 (IRAK4) in the toll-like receptor 4 (TLR4) signaling pathway. Mediators Inflamm. 2019; 2019: 7634761. doi:10.1155/2019/7634761. [Google Scholar] [CrossRef]
28. Arruda VM , Azevedo GT , Granato MJMG , Matos ACP , Araújo TG , Guerra JFDC . Oxidative stress and annexin A2 differential expression in free fatty acids-induced non-alcoholic fatty liver disease in HepG2 cells. Int J Mol Sci. 2024; 25( 17): 9591. doi:10.3390/ijms25179591. [Google Scholar] [CrossRef]
29. Sherman MS , Goessling W . Discovery of biophysical rate laws from the electronic health record enables real-time liver injury estimation from transaminase dynamics. Cell Rep Med. 2024; 5( 11): 101828. doi:10.1016/j.xcrm.2024.101828. [Google Scholar] [CrossRef]
30. Cannito S , Dianzani U , Parola M , Albano E , Sutti S . Inflammatory processes involved in NASH-related hepatocellular carcinoma. Biosci Rep. 2023; 43( 1): BSR20221271. doi:10.1042/BSR20221271. [Google Scholar] [CrossRef]
31. Shang DF , Xu WQ , Zhao Q , Zhao CL , Wang SY , Han YL , et al. Molecular mechanisms of pyroptosis in non-alcoholic steatohepatitis and feasible diagnosis and treatment strategies. Pharmacol Res. 2025; 216: 107754. doi:10.1016/j.phrs.2025.107754. [Google Scholar] [CrossRef]
32. Zhu B , Chan SL , Li J , Li K , Wu H , Cui K , et al. Non-alcoholic steatohepatitis pathogenesis, diagnosis, and treatment. Front Cardiovasc Med. 2021; 8: 742382. doi:10.3389/fcvm.2021.742382. [Google Scholar] [CrossRef]
33. Israelsen M , Francque S , Tsochatzis EA , Krag A . Steatotic liver disease. Lancet. 2024; 404( 10464): 1761– 78. doi:10.1016/S0140-6736(24)01811-7. [Google Scholar] [CrossRef]
34. Song J , Qiu H , Du P , Mou F , Nie Z , Zheng Y , et al. Polyphenols extracted from Shanxi-aged vinegar exert hypolipidemic effects on OA-induced HepG2 cells via the PPARα-LXRα-ABCA1 pathway. J Food Biochem. 2022; 46( 2): e14029. doi:10.1111/jfbc.14029. [Google Scholar] [CrossRef]
35. Pedroza-Diaz J , Arroyave-Ospina JC , Serna Salas S , Moshage H . Modulation of oxidative stress-induced senescence during non-alcoholic fatty liver disease. Antioxidants. 2022; 11( 5): 975. doi:10.3390/antiox11050975. [Google Scholar] [CrossRef]
36. Arroyave-Ospina JC , Wu Z , Geng Y , Moshage H . Role of oxidative stress in the pathogenesis of non-alcoholic fatty liver disease: Implications for prevention and therapy. Antioxidants. 2021; 10( 2): 1– 25. doi:10.3390/antiox10020174. [Google Scholar] [CrossRef]
37. Zelber-Sagi S , Ivancovsky-Wajcman D , Fliss-Isakov N , Hahn M , Webb M , Shibolet O , et al. Serum malondialdehyde is associated with non-alcoholic fatty liver and related liver damage differentially in men and women. Antioxidants. 2020; 9( 7): 578. doi:10.3390/antiox9070578. [Google Scholar] [CrossRef]
38. Moustakli E , Stavros S , Katopodis P , Skentou C , Potiris A , Panagopoulos P , et al. Oxidative stress and the NLRP3 inflammasome: Focus on female fertility and reproductive health. Cells. 2025; 14( 1): 36. doi:10.3390/cells14010036. [Google Scholar] [CrossRef]
39. Chen N , Deng J , Zhang Z , Feng X , Wang H , Chen J , et al. Oxidative stress-triggered pyroptosis mediates Candida albicans susceptibility in diabetic foot. Microb Pathog. 2022; 172: 105765. doi:10.1016/j.micpath.2022.105765. [Google Scholar] [CrossRef]
40. Zhou J , Tripathi M , Ho JP , Widjaja AA , Shekeran SG , Camat MD , et al. Thyroid hormone decreases hepatic steatosis, inflammation, and fibrosis in a dietary mouse model of nonalcoholic steatohepatitis. Thyroid. 2022; 32( 6): 725– 38. doi:10.1089/thy.2021.0621. [Google Scholar] [CrossRef]
41. Ajmera V , Loomba R . Imaging biomarkers of NAFLD, NASH, and fibrosis. Mol Metab. 2021; 50: 101167. doi:10.1016/j.molmet.2021.101167. [Google Scholar] [CrossRef]
42. Duan Y , Pan X , Luo J , Xiao X , Li J , Bestman PL , et al. Association of inflammatory cytokines with non-alcoholic fatty liver disease. Front Immunol. 2022; 13: 880298. doi:10.3389/fimmu.2022.880298. [Google Scholar] [CrossRef]
43. Su T , He Y , Wang M , Zhou H , Huang Y , Ye M , et al. Macrophage-hepatocyte circuits mediated by grancalcin aggravate the progression of metabolic dysfunction associated steatohepatitis. Adv Sci. 2024; 11( 42): 2406500. doi:10.1002/advs.202406500. [Google Scholar] [CrossRef]
44. Li SJ , Liu AB , Yu YY , Ma JH . The role and mechanism of pyroptosis and potential therapeutic targets in non-alcoholic fatty liver disease (NAFLD). Front Cell Dev Biol. 2024; 12: 1407738. doi:10.3389/fcell.2024.1407738. [Google Scholar] [CrossRef]
45. Chen F , Li S , Liu M , Qian C , Shang Z , Song X , et al. Targeting BRD4 mitigates hepatocellular lipotoxicity by suppressing the NLRP3 inflammasome activation and GSDMD-mediated hepatocyte pyroptosis. Cell Mol Life Sci. 2024; 81( 1): 295. doi:10.1007/s00018-024-05328-7. [Google Scholar] [CrossRef]
46. Naiki-Ito A , Yeewa R , Kuang X , Taychaworaditsakul W , Naiki T , Kato H , et al. Hexane insoluble fraction from purple rice extract improves steatohepatitis and fibrosis via inhibition of NF-κB and JNK signaling. Food Funct. 2024; 15( 16): 8562– 71. doi:10.1039/D4FO00292J. [Google Scholar] [CrossRef]
47. Xu Z , Tang C , Song X , Liu Z , Zhou J , Shi Q , et al. High uric acid exacerbates nonalcoholic steatohepatitis through NLRP3 inflammasome and gasdermin D-mediated pyroptosis. J Biol Chem. 2025; 301( 6): 110249. doi:10.1016/j.jbc.2025.110249. [Google Scholar] [CrossRef]
48. Ran S , Song L , Yang H , Yu J , Zhen Y , Liu Q . Piperine alleviates nonalcoholic steatohepatitis by inhibiting NF-κB-mediated hepatocyte pyroptosis. PLoS One. 2024; 19( 3): e0301133. doi:10.1371/journal.pone.0301133. [Google Scholar] [CrossRef]
49. Deng YF , Xu QQ , Chen TQ , Ming JX , Wang YF , Mao LN , et al. Kinsenoside alleviates inflammation and fibrosis in experimental NASH mice by suppressing the NF-κB/NLRP3 signaling pathway. Phytomedicine. 2022; 104: 154241. doi:10.1016/j.phymed.2022.154241. [Google Scholar] [CrossRef]
50. Li B , Wang R , Wang L , Zhang G , Zhang Y . Capillin protects against non-alcoholic steatohepatitis through suppressing NLRP3 inflammasome activation and oxidative stress. Immunopharmacol Immunotoxicol. 2021; 43( 6): 778– 89. doi:10.1080/08923973.2021.1984520. [Google Scholar] [CrossRef]
51. El-Baz AM , El-Ganiny AM , Hellal D , Anwer HM , El-Aziz HAA , Tharwat IE , et al. Valuable effects of Lactobacillus and citicoline on steatohepatitis: Role of Nrf2/HO-1 and gut microbiota. AMB Express. 2023; 13( 1): 57. doi:10.1186/s13568-023-01561-8. [Google Scholar] [CrossRef]
52. Mridha AR , Wree A , Robertson AAB , Yeh MM , Johnson CD , Van Rooyen DM , et al. NLRP3 inflammasome blockade reduces liver inflammation and fibrosis in experimental NASH in mice. J Hepatol. 2017; 66( 5): 1037– 46. doi:10.1016/j.jhep.2017.01.022. [Google Scholar] [CrossRef]
53. Sun K , Wang J , Lan Z , Li L , Wang Y , Li A , et al. Sleeve gastroplasty combined with the NLRP3 inflammasome inhibitor CY-09 reduces body weight, improves insulin resistance and alleviates hepatic steatosis in mouse model. Obes Surg. 2020; 30( 9): 3435– 43. doi:10.1007/s11695-020-04571-8. [Google Scholar] [CrossRef]
54. Loomba R , Sanyal AJ , Kowdley KV , Bhatt DL , Alkhouri N , Frias JP , et al. Randomized, controlled trial of the FGF21 analogue pegozafermin in NASH. N Engl J Med. 2023; 389( 11): 998– 1008. doi:10.1056/NEJMoa2304286. [Google Scholar] [CrossRef]
55. Sanyal AJ , Newsome PN , Kliers I , Østergaard LH , Long MT , Kjær MS , et al. Phase 3 trial of semaglutide in metabolic dysfunction–associated steatohepatitis. N Engl J Med. 2025; 392( 21): 2089– 99. doi:10.1056/NEJMoa2413258. [Google Scholar] [CrossRef]
56. Schattenberg JM . Effect of resmetirom or placebo in NASH (MASH) fibrosis patients with <5% or ≥5% weight loss and/or on baseline GLP-1 therapy in the MAESTRO-NASH 52-week serial liver biopsy study. Diabetol Und Stoffwechs. 2025; 20( S01): S98. doi:10.1055/s-0045-1807552. [Google Scholar] [CrossRef]
57. Zheng H , Li J , Yao H . Study on pharmacokinetics of oridonin in mice. China J Chin Mater Medica. 2011; 36( 24): 3515– 8. doi:10.4268/cjcmm20112428. [Google Scholar] [CrossRef]
58. Liang F , Guang C , Ma X , Wang X , Han F , Li W , et al. From in vivo disposition to therapeutic action: Tracing the pharmacokinetic journey and unveiling the anti-UC potential of oridonin and its sulfonate-conjugate. Bioorg Chem. 2025; 164: 108811. doi:10.1016/j.bioorg.2025.108811. [Google Scholar] [CrossRef]
59. Zhang Y , Wang S , Dai M , Nai J , Zhu L , Sheng H . Solubility and bioavailability enhancement of oridonin: A review. Molecules. 2020; 25( 2): 332. doi:10.3390/molecules25020332. [Google Scholar] [CrossRef]
60. Xu J , Cheng X , Wang Q , Zhang F , Ren X , Huang K , et al. Artemether ameliorates non-alcoholic steatohepatitis by restraining cross-talk between lipotoxicity-induced hepatic hepatocytes and macrophages. Phytother Res. 2025; 39( 2): 604– 18. doi:10.1002/ptr.8393. [Google Scholar] [CrossRef]
61. Zhu Y , Zhao H , Lu J , Lin K , Ni J , Wu G , et al. Caspase-11-mediated hepatocytic pyroptosis promotes the progression of nonalcoholic steatohepatitis. Cell Mol Gastroenterol Hepatol. 2021; 12( 2): 653– 64. doi:10.1016/j.jcmgh.2021.04.009. [Google Scholar] [CrossRef]
Cite This Article
 Copyright © 2026 The Author(s). Published by Tech Science Press.
This work is licensed under a Creative Commons Attribution 4.0 International License , which permits unrestricted use, distribution, and reproduction in any medium, provided the original work is properly cited.
 Downloads
 Citation Tools
