
 Submit a Paper
 Propose a Special lssue
 Open Access
ARTICLE
Hybrid Multi-Scale 3D Segmentation Framework for Automated Stenosis Detection
1 Department of CSE, College of Engineering, Anna University, Chennai, 600025, India
2 Department of Information Technology, Saveetha Engineering College, Chennai, 602105, India
* Corresponding Author: Swedha Velraj. Email:
Congenital Heart Disease 2025, 20(6), 769-792. https://doi.org/10.32604/chd.2025.068879
Received 09 June 2025; Accepted 04 November 2025; Issue published 10 February 2026
 View Full Text
 Download PDF
Abstract
Background: Coronary artery disease (CAD) is a major global health concern requiring efficient and accurate diagnostic methods. Manual interpretation of coronary computed tomography angiography (CTA) images is time-consuming and prone to interobserver variability, underscoring the need for automated segmentation and stenosis detection tools. Methods: This study presents a hybrid multi-scale 3D segmentation framework utilizing both 3D U-Net and Enhanced 3D U-Net architectures, designed to balance computational efficiency and anatomical precision. Processed CTA images from the ImageCAS dataset underwent data standardization, normalization, and augmentation. The framework applies ensemble learning to merge coarse and fine segmentation masks, followed by advanced post-processing techniques, including connected component analysis and centerline extraction, to refine vessel delineation. Stenosis regions are detected using the Enhanced 3D U-Net and morphological operations for accurate localization. Results: The proposed pipeline achieved near-perfect segmentation accuracy (0.9993) and a Dice similarity coefficient of 0.8539 for coronary artery delineation. Precision, recall, and F1 scores for stenosis detection were 0.8418, 0.8289, and 0.8397, respectively. The dual-model approach demonstrated robust performance across varied anatomical structures and effectively localized stenotic regions, indicating clear superiority over conventional models. Conclusion: This hybrid framework enables highly reliable and automated coronary artery segmentation and stenosis detection from 3D CTA images. By reducing reliance on manual interpretation and enhancing diagnostic consistency, the proposed method holds strong potential to improve clinical workflows for CAD diagnosis and management.Keywords
Coronary artery disease (CAD) is a leading cause of global mortality, significantly impacting healthcare systems. Timely and accurate diagnosis is crucial to reduce CAD-related risks. Coronary computed tomography angiography (CTA) has emerged as a revolutionary non-invasive imaging modality that provides detailed volumetric visualizations of coronary artery structures. Though a great progress exists, still the CTA images’ interpretation has been full of interobserver variability and long analysis time, apart from human errors.
Motivation—CAD remains a leading cause of mortality worldwide. While coronary CTA offers detailed anatomical visualization, manual interpretation is time-intensive and prone to interobserver variability. These limitations hinder timely diagnosis and intervention.
Contributions—This paper proposes a novel hybrid multi-scale 3D segmentation and stenosis detection framework that:
- 1.Combines 3D U-Net and Enhanced 3D U-Net to balance efficiency and fine detail capture.
- 2.Employs an ensemble approach for improved segmentation robustness.
- 3.Integrates post-processing techniques for precise stenosis localization.
- 4.Achieves near-perfect segmentation accuracy (0.9993) on the ImageCAS CTA dataset.
Hence, added focus goes onto the precision, consistency, and efficiency on application into the analysis. This article presents an integrated system to detect stenosis and segment coronary arteries from 3D CTA images. It makes use of the advancement in present deep learning architectures to bridge the complexities in coronary artery morphology and bypass the problems of manual diagnostics [1,2]. It uses a hybrid approach which applies segmentation using a combination of models such as 3D UNet and Enhanced 3D UNet, after which it can detect stenosis using Enhanced 3D UNet. This multi-step pipeline will lead to robust and accurate analysis of coronary artery structures, paving the way toward improved diagnostic workflows and clinical outcomes.
The segmentation process is what anchors the proposed framework, allowing separation of coronary arteries from the complex anatomical structures within 3D CTA images. Two models were utilized: 3D UNet and Enhanced 3D UNet to ensure the highest possible accuracy of segmentation. The 3D UNet captures the broader context of anatomy with its low and efficient architecture. Its more streamlined architecture ensures that 3D UNet may work quite well on whatever datasets that are used such that this model is chosen as an initial segmentation process. Balancing the Enhanced 3D UNet with advanced architectural features refining segmentation, this model finds high resolution in segmentation while dealing with regions affected due to artifacts or noise occurring during the imaging process. The Enhanced 3D UNet provides a more accurate delineation of complex anatomical structures through deeper layers and mechanisms for improved feature extraction. An ensemble strategy is proposed to combine the outputs of the two models and improve the segmentation process further. It employs the merits of 3D UNet and Enhanced 3D UNet. It ensures that it provides both coarse and fine segmentation accuracies. This reduces the chance of overfitting and enhances robustness and reliability, critical factors in medical imaging applications. The segmentation module achieves an excellent accuracy of 0.9993, which again supports the effectiveness of this dual-model approach. Following this stage of segmentation, the work proceeds to the detection stage wherein stenosis within the segmented coronary arteries is detected. This stage uses the Enhanced 3D UNet as its performance is better in capturing fine structural details. Inputting segmentation mask to this model results in a narrowed focus on areas of narrowing arterial regions, which most stenosis cases tend to present in coronary arteries. The Enhanced 3D UNet has the strong features extraction capabilities along with a higher resolution; thus, it is apt for the job. Subtle anatomical variations in discernment are ensured for the identification of stenosis and does so in a reliable and reproducible manner. From the proposed system, a seamless workflow of diagnosis would be delivered by effective transitions from segmentation to the detection. It will give major clinical benefits from automating segmentation and detection, therefore rendering unnecessary dependence on a human eye for interpretation.
This automation minimizes diagnostic variability and helps ensure consistency and reliability across analyses. The system will enable clinicians to focus more on treatment planning and patient care by quickly diagnosing the problem, thus maintaining the efficiency of processing large datasets. Beyond the clinical considerations, the work contributes significantly to the broad area of medical image analysis. This innovative hybrid model, ensemble learning, and advanced deep learning techniques reflect the transformative nature of artificial intelligence in healthcare. This work overcomes all shortcomings of conventional approaches in achieving a new benchmark in scalability, accuracy, and robustness for automated diagnostics. The overview encapsulates the vision and impact of the proposed work, which aims to focus on two objectives: coronary artery segmentation and stenosis detection. 3D UNet and Enhanced 3D UNet models with an ensemble strategy ensure unparalleled segmentation accuracy. After the detection stage is the enhanced 3D UNet capable of accurately and reliably identifying stenosis. Since the work methodology is innovative and clinically of much value, it stands to be one very critical advance steps forward in applying artificial intelligence toward the betterment of CAD diagnostics. The primary objective of this research work is to develop an intelligent and automated pipeline to segment the segmentation and detect the coronary artery stenosis from a set of 3D coronary CTA images, using sophisticated architectures of deep learning approaches. The overall intention is for such improvement to enhance and assure accuracy and efficiency during consistent diagnosis, which supports earlier detection with timely interventions-the two prime factors resulting in better clinical outcomes.
Organization of the Paper—The remainder of this paper is organized as follows: Section 2 reviews related work on coronary artery segmentation and stenosis detection. Section 3 details the proposed hybrid multi-scale 3D segmentation and stenosis detection framework, including preprocessing, segmentation, and post-processing modules. Section 4 describes the implementation setup, dataset, and presents experimental results with performance analysis. Section 5 concludes the paper and discusses potential directions for future research.
This section introduces a summary of existing literature on coronary artery segmentation and stenosis detection, focusing particularly on the deep learning-based approach along with datasets for CAD detection.
Zeng et al. [3] introduced ImageCAS, a comprehensive large-scale dataset specifically designed for coronary artery segmentation based on CTA images. The study emphasized the critical role of precise coronary artery segmentation in diagnosing and evaluating CAD. Unlike earlier works limited to smaller or in-house datasets, ImageCAS is a publicly available dataset, greatly enhancing its utility for research in this area. The authors developed a strong baseline approach for coronary artery segmentation, utilizing multi-scale patch fusion and a two-stage processing method. Their experimental results showed that this baseline outperformed existing methods on the ImageCAS dataset, providing a more effective way to extract vessel details. The ImageCAS dataset, alongside the proposed baseline approach, has set a standard for future research in coronary artery segmentation and will be an invaluable resource for addressing the challenges in this domain.
Jin et al. [4] proposed a novel approach to classify coronary artery stenosis by integrating segmentation and classification techniques. Recognizing the challenges posed by the limited availability of coronary artery stenosis datasets and the complexity of feature extraction due to patient-specific variations and imaging noise, the authors introduced a joint segmentation method. This method employed maximum between-class variance and region growing to extract key regions from CTA images, enhancing the segmentation quality. A classification model incorporating the Convolutional Block Attention Module (CBAM) and transfer learning was developed following segmentation. This model demonstrated robust performance, effectively addressing the issue of limited training samples by leveraging the power of transfer learning. The study highlights the potential of combining advanced attention mechanisms, such as CBAM, with transfer learning to improve the diagnostic accuracy of cardiovascular diseases.
Wu et al. [5] introduced an automatic coronary artery stenosis detection method using a convolutional neural network (CNN) with temporal constraints to improve diagnostic accuracy in X-ray coronary angiography (XCA). The study addressed the challenges posed by low vessel contrast, complex overlapping structures, and inhomogeneous intensities, making manual stenosis detection difficult. To overcome these obstacles, the authors developed a deconvolutional single-shot multibox detector for candidate detection, which was applied to contrast-enhanced frames preselected using a U-Net model. To tackle the high false-positive rate of the static detection model, they proposed a sequence-based false positive suppression (seq-fps) module, which incorporates temporal consistency across angiographic frames. Based on 148 X-ray angiographic sequences, the experimental results demonstrated that the proposed method achieved a sensitivity of 87.2% and a positive predictive value of 79.5%, outperforming existing detection approaches. This work underscores the potential of combining CNNs with temporal constraints to enhance the accuracy of automated stenosis detection, thereby aiding in clinical decision-making.
Hong et al. [6] explored the feasibility of leveraging deep learning for quantitative analysis of CAD from coronary CTA images, a modality known for providing detailed anatomical and functional data. The study analysed 716 diseased segments from 156 patients, using convolutional neural networks (CNNs) to segment the CTA lumen and calcified plaques. The key measures, such as minimal luminal area (MLA), percent diameter stenosis (DS), and percent contrast density difference (CDD), were calculated through the deep learning-based approach and compared with expert reader annotations. The results showed an excellent correlation between the expert annotations and the deep learning model (DLM), with high agreement for MLA, DS, and CDD. This study highlights the potential of integrating deep learning models into clinical workflows, offering accurate, reproducible quantitative measures that could significantly enhance CAD diagnosis and reporting.
Ovalle-Magallanes et al. [7] proposed a novel approach for the automatic detection of coronary artery stenosis in XCA images by leveraging pre-trained CNNs via transfer learning. The study used network-cut and fine-tuning strategies on VGG16, ResNet50, and Inception-v3 networks, evaluating each across 20 different configurations to identify the optimal layers for fine-tuning. The research utilized both real and synthetic datasets, with the latter consisting of 10,000 images generated by a generative model. The best performance was observed using the Inception-v3 network, fine-tuned on early layers, yielding impressive results with an accuracy of 0.95, precision of 0.93, sensitivity of 0.98, specificity of 0.92, and an F1-score of 0.95. Additionally, class activation maps were applied to highlight regions with high attention, showcasing the effectiveness of combining transfer learning with synthetic data to improve stenosis detection in XCA images. This work demonstrates the promising potential of transfer learning and synthetic datasets for enhancing the accuracy and robustness of CAD detection.
Paul et al. [8] evaluated a DLM for the automatic detection of stenosis in coronary computed tomography angiography (CCTA) images. The DLM was trained on a dataset of 10,800 curved multiplanar reformatted (cMPR) CCTA images, classified by expert radiologists according to the Coronary Artery Disease-Reporting and Data System (CAD-RADS). The model analyzed nine cMPR images for each artery, using a majority vote to determine the likelihood of stenosis. The study validated the model on 159 arteries from 53 patients to assess its performance, comparing its results to those of human readers. The DLM achieved an impressive accuracy of 96%, sensitivity of 93%, and specificity of 97% in binary classification (CAD-RADS 0–1–2 vs. 3–4–5), with a Cohen’s kappa of 0.85. The results showed that the DLM performed comparably to experienced radiologists, suggesting that this model could be a valuable tool for stenosis detection in clinical practice.
Pang et al. [9] introduced Stenosis-DetNet, an innovative method for detecting coronary artery stenosis in XCA images, which tackles several challenges such as heartbeat, respiratory movements, and weak vascular features in single-frame contrast images. The method incorporates a Sequence Feature Fusion Module, which enhances candidate box features by utilizing temporal information from consecutive frames. Additionally, a Sequence Consistency Alignment Module refines the detections by considering coronary artery displacement and adjacent image features. Tested on 166 X-ray image sequences, Stenosis-DetNet outperformed three existing methods, achieving a precision of 94.87% and a sensitivity of 82.22%. The method effectively reduced false positives and negatives, demonstrating its superior performance in stenosis detection compared to other state-of-the-art techniques.
Zreik et al. [10] introduced a deep learning-based method for automatically detecting and classifying coronary artery plaque and stenosis using CCTA scans from 163 patients. The study utilized a multi-task recurrent CNN, with a 3D CNN for feature extraction and a recurrent network for multi-class classification tasks: detecting plaque type and determining the significance of stenosis. The model achieved an accuracy of 0.77 for plaque detection and 0.80 for stenosis classification, demonstrating the feasibility of automatic plaque and stenosis detection. This approach could enable automated triage for patients needing further cardiovascular evaluation, improving clinical decision-making and workflows.
Wang et al. [11] proposed a context-aware deep network (CADN) for the classification of coronary artery stenosis using CCTA. The method combines a 3D CNN with Transformer models to enhance the feature representation of stenosis in CCTA images. Evaluating the model on a multicenter dataset from the APOLLO study, the method achieved accuracy rates of 0.84, 0.83, and 0.86 for stenosis detection at the lesion, artery, and patient levels, respectively. This work highlights the effectiveness of integrating CNNs with Transformer models for more accurate and context-aware coronary artery stenosis classification.
Suboh et al. [12] investigated the association between common parameters from preliminary tests of CAD and the severity of stenosis in coronary arteries among newly diagnosed ischemic heart disease (IHD) patients. The study, which involved 80 CAD patients, analyzed demographic data, vital signs, blood tests, and ECG results before the patients underwent coronary angiography. The findings showed that 75% of participants were overweight, and those with severe stenosis (≥70%) had a higher prevalence of smoking, diabetes, and hypertension compared to the control group. The study found that fasting blood sugar levels were significantly higher (p = 0.002) in subjects with severe stenosis, with an average of 8.05 ± 3.60. While Framingham risk scores did not correlate with severe stenosis in many cases, the study emphasized the need for non-invasive techniques, such as electrocardiograms and photoplethysmograms, to assess stenosis levels more accurately.
Zhang et al. [13] proposed a hierarchical attentive multi-view learning model (HEAL) for the direct quantification of coronary artery stenosis from XRC images, bypassing the need for segmentation or reconstruction. The method utilizes a multi-view learning approach to capture complementary stenosis information from different perspectives. To enhance this, an intra-view hierarchical attentive block is introduced to extract discriminative features, while a stenosis representation learning module focuses on keyframe-based multi-scale feature extraction, aligning with clinical workflows. Evaluated on a multi-manufacturer clinical dataset of 228 subjects, the HEAL model outperformed nine existing methods, including both direct quantification and multi-view learning approaches. The results showed superior clinical agreement between the predicted and ground truth stenosis indices, demonstrating the potential of the HEAL model for efficient, intraoperative treatment of CAD.
Compas et al. [14] presented a robust, fully automatic method for detecting coronary artery stenosis in X-ray angiography sequences, addressing challenges such as low vessel contrast and large intensity gradients. The method leverages the spatiotemporal nature of angiography data, creating an arterial width surface for each artery segment by tracking its width across image frames. A persistent minima on this surface is then used to identify stenosis. Tested on 16 patients with 20 image runs, the approach achieved a sensitivity of 86% and specificity of 97%, outperforming single-frame analysis methods. This work represents the first fully automatic technique for detecting stenosis in X-ray angiography, demonstrating its potential for clinical applications in CAD diagnosis.
Chi et al. [15] proposed a method for detecting and quantifying coronary stenosis using panoramic maximum intensity workion of coronary arteries from CTCA. The method was evaluated against invasive coronary angiography (ICA) as the reference standard. Six anonymized CTCA datasets were tested, yielding a sensitivity of 82% and specificity of 95% for stenosis detection, with good reproducibility (Cohen’s kappa of 0.74 for intra-rater and 0.45 for inter-rater agreement). In stenosis quantification, the combination of image options achieved the best accuracy of 0.89, surpassing individual image modalities. This approach demonstrated fast and accurate stenosis detection, providing valuable support for radiologists in clinical practice.
Automatic detection and quantification of coronary artery stenosis still poses many challenges. One main problem is that subtle stenoses are inherently challenging to detect in medical images, especially when the contrast between the vessel lumen and the surrounding tissue is poor or large-intensity gradients occur. Several papers emphasize that dealing with complex datasets, variations in image quality prevent proper feature extraction and classification.
The coronary artery stenosis is a serious challenge in cardiovascular health that is still detected. Automated procedures have come out as a potential solution to enhance the accuracy of the diagnosis. A technique of the measurement of the coronary artery stenosis based on the cardiac CT angiography was introduced by Zhou et al. [16] and which is commonly followed because of its accuracy. The same researchers, Alexey et al. [17] went an extra mile to come up with a computational model to examine the stress-strain condition of stenosed coronary arteries and this will shed light on the mechanical response of such arteries in the physiological state.
Applied in the context of the X-ray angiography, Koroleva and Khapaev [18] examined the risk and prevalence factors related to the carotid artery stenosis among diabetic patients. Their research has some impacts on the prevention and treatment of vascular diseases among diabetic population. In the meantime, Caruso et al. [19] concentrated on geometry of stenosis on effects on the hemodynamics of the right coronary arteries, a field which is vital in determining the physiological effects of arterial constriction.
Integration of deep learning models in detection of stenosis has received major attention. According to Asakawa et al. [20], non-contrast CT images were estimated with the severity of coronary artery stenosis, and promising results were obtained with the use of CNNs. The use of AI-centered diagnostic systems will certainly increase in clinical settings as Ovalle-Magallanes et al. discuss in their review of deep learning-based coronary stenosis detection in their article [21].
X-ray angiographic images are noisy images with motion artifacts, reduced resolution, and stenosis regions that are hard to determine precisely. This is also partly due to the inability to reproducibly identify and report the different types and grades of stenosis, considering the different plaque compositions and degrees of vessel narrowing. Most of them are concerned with improving the representation about coronary artery features but are weak on the extraction of low-level features from traditional imaging modalities.
The methods that are available typically involve fault-prone preprocessing steps like segmentation or reconstruction that add complexity to the process. Conversely, there has been emphasis on improving the detection of stenosis using the concept of multi-view learning or temporal information of the image sequence. This also has its problems with regard to frame consistency and noisy frames caused by heart or any other type of movement that results in deformation of the images. For example, spatiotemporal methods can relax some of these challenges but would still require careful tuning for effective feature alignment and classification across time.
The actual concern is the generalizability of real world clinical conditions. While some models prove correct at controlled conditions, it still has a concern related to reproducibility, especially in variations of patient characteristics and co-morbidity as well as differences in image acquisition. Hence, generalization to other populations and imaging setups is often missing in prior approaches. Finally, implementing AI-assisted stenosis detection into the real world of clinical practice provides the challenges of real-time processing, large annotated training datasets, and the clinical acceptance of AI-based tools in clinical decision-making. A future direction is in further tuning deep learning techniques, just as other AI techniques need to be perfected in producing robust, scalable solutions deployable in a clinical practice workflow.
Building upon the findings from Section 2, which reviewed state-of-the-art approaches for coronary artery segmentation and stenosis detection, this section details the proposed methodology. Section 2 highlighted the strengths and limitations of existing deep learning models, dataset characteristics, and the role of preprocessing, segmentation strategies, and detection algorithms in improving diagnostic performance. Drawing on these insights, Section 3 introduces our hybrid multi-scale 3D segmentation and stenosis detection framework, outlining its architectural design, training process, and post-processing components to address the gaps identified in previous research.
The training of the proposed deep learning models relies on gradient descent optimization, a core technique for minimizing the loss function by iteratively updating model parameters in the direction of the negative gradient. In medical deep learning, gradient descent methods like stochastic gradient descent (SGD) and Adam are vital for optimizing high-dimensional models [1,2]. However, deep neural networks often face the vanishing gradient problem, which slows convergence and reduces performance. To address such issues, strategies like the oriented stochastic loss descent algorithm have been proposed, enabling more stable training of deep architectures. In this work, we adopt modern gradient descent–based optimizers to ensure efficient convergence while preserving the high accuracy required for coronary artery segmentation and stenosis detection.
This section outlines a proposed system for automatic coronary artery stenosis detection using deep learning-based segmentation and advanced post-processing techniques. The system architecture is described with respect to data preparation, segmentation using Simple and Enhanced 3D U-Net models, and post-processing steps for enhancing the accuracy of stenosis detection. This shall be helpful in improving the accuracy of diagnosis and clinical intervention planning for CAD.
This system is meant to identify stenosis through images from 3D coronary arteries. To this, deep learning-based image segmentation followed by appropriate post-processing techniques will be undertaken. Overall, it seeks to combine the best-in-class 3D U-Net segmentation models from the state-of-art in post-processing techniques and hence improve the accuracy or specificity of identification of potentially stenotic regions for clinical diagnosis or intervention planning.
The system starts with the data preparation module that pre-processes 3D medical images of the coronary arteries in terms of standardizing their dimensions and intensities so that they will be fit for input into the model. Then the models go through certain augmentations applied to the images like flip, rotate, and resizing for a more robust model. After preprocessing, they were fed into Simple 3D U-Net segmentation model, which gave the first segmentation of arteries. The outcome is a rather coarse anatomical segmentation not suitable for actual clinical evaluation because the area of interest, the stenotic area in this case, would have to be finer than that which this algorithm produces.
With improved segmentation accuracy, this proposed system is introducing an advanced 3D U-net segmentation model developed in a manner from simple architectures of U-Nets toward more complex feature extraction models while adopting attention mechanisms. Thus, the adopted model is in order to be able to capture much finer details in the delineation of structures that occur in the coronary area specially prone to stenosis. The model can be integrated by the system to produce a better and more accurate map for region segmentation, especially where a constriction or blockage may be present. The post-processing module then refines these segmented masks by performing connected component analysis to single out the largest connected component and filtering out small irrelevant noise.
The central path of the coronary artery is then identified using centerline extraction to guide the refinement of plaque segmentation, and finally, plaque segmentation refinement enhances the definition of stenotic regions by concentrating on these important regions to ensure that the final mask of segmentation is even more representative of the part of the artery that is stenotic and not.
This refined segmentation mask for stenosis module is used for either narrowing or plaque, as well as areas under suspicion for stenotic regions, using threshold and morphological operations and enhancements to analyze again to classify the amount of stenosis that will be. Also the critical areas where interventions could be significantly identified here as those highlight potential regions through where the flow might be blocked or narrowed through a coronary artery. In summary, this proposed system ensures integration in precise detection of stenosis through deep learning-based segmentation, advanced post-processing techniques, and precise methodologies of detection. It means that through combining these technologies, the system ensures achievement at high accuracy and robustness with valuable support for the clinician in diagnosing and treatment planning in patients with CAD.
Fig. 1 depicts the architecture for coronary artery segmentation and stenosis detection with the objective of analyzing 3D CTA images in phenomenal accuracy. The system initiates with preprocessing, which is one of the most important steps toward the preparation of the input images to be further processed. Images are fetched from the ImageCAS dataset, resized to the dimensions 512 × 512 × Z, and enhanced using multiple techniques. Normalization ensures the intensity levels are constant, resizing resizes the spatial dimensions to ensure data becomes compatible with models, zooming zooms in on areas of highest importance for the detection of stenosis, and Gaussian filter removes noise without disturbing the features that have significant anatomical relevance like the boundary of a vessel. Augmentation techniques such as random rotation and flipping make the models more robust, since they are exposed to a variety of orientations and configurations and thus generalize better to unseen data.
Coarse segmentation, fine segmentation, and post-processing are three steps associated with the segmentation process. The Simple 3D U-Net model is used for coarse segmentation of the coronary arteries. This model, although it may be efficient for the task of clinical evaluation as imprecise as it is, does a broad outline of the vessels. Toward optimization of output in this model for improvement, this system uses dilation, allowing vessel boundaries to be much more continuous and also skeleton extraction to find central artery axis. Using the Enhanced 3D U-Net, attention to smaller critical regions of interest is localized through patch extraction and fine segmentation. This model, having more layers and attention mechanisms, extracts more detailed features and gives a refined segmentation of the stenotic areas. For better accuracy, the results of Simple 3D U-Net and Enhanced 3D U-Net are ensembled where the strengths of both approaches are combined to produce a comprehensive segmentation mask. Connected component analysis is used to isolate the largest connected regions; thus, all the unwanted noise is removed. The extraction of centerlines in the coronary arteries enables further enhancement in the refinement of the segmentation regarding plaques and stenotic regions.
The focus on the concentration in the refinement of plaques segmentation remains on giving the definition to areas that are subject to narrowing or blockages for assurance that the resultant mask of segmentation has clinical importance and high accuracy. This output of the system deals with the final stage where stenosis is concerned. The improved segmentation mask gives out the regions of interest, more specifically focusing on the regions that have such stenosis in the arteries. Those focused areas are then scanned minutely by the Enhanced 3D U-Net to produce a probability mask that indicates all such stenotic areas and converts them into a binary image with the help of mask thresholding combined with a sigmoid activation function. This output provides the correct, readable stenosis detection mask. In short, Fig. 1 introduces an end-to-end architecture that smoothly integrates preprocessing, segmentation, and stenosis detection. This dual model approach helps thus in presenting robust and precise analysis in coronary arteries. Hence, it is one of the important tools in the very early diagnoses and planning of clinical interventions among the disease patients of the coronary arteries.
Raw CTA images and corresponding labels for coronary arteries in .nii.gz format sourced from the ImageCAS dataset are used. The original images are in the shape (512 × 512 × Z). The list of preprocessed and augmented images are made ready for segmentation. CTA images were preprocessed and augmented before training the DLM. Load all cta images: they might or might not be in NIfTI format. Some tools made with nibabel are utilised here. The first pipeline ensures resized images are standard shapes, like for example, 128 × 128 × 128. As such, all images will have a similar dimension.
The resizing is done with scaling factors. The image data gets resized by bilinear interpolation, and segmentation masks by nearest-neighbor interpolation without distortion of mask integrity. Then after resizing, the pixel intensity values of all are clipped in the range [0, 1], rejecting outliers, and then all are divided by the max pixel value, which will normalize them, and this brings the value of intensity in comparison for all images in this.
Data augmentation is used to increase variability in the dataset, which helps reduce the risk of overfitting. The most common augmentations include a random horizontal flip with 50% chance, a random rotation within a range, such as −30° to +30°, and zooming or translation optionally. All these represent realistic variations, such as patient positioning or scanning angles, and they can help a model generalize better on unseen data. All images are processed, augmented, resized, normalized, and transformed images ready for use in model training. This makes the augmented dataset much more diverse, which is quite beneficial for improving the model’s robustness and capacity for handling variations in real-world medical imaging data.
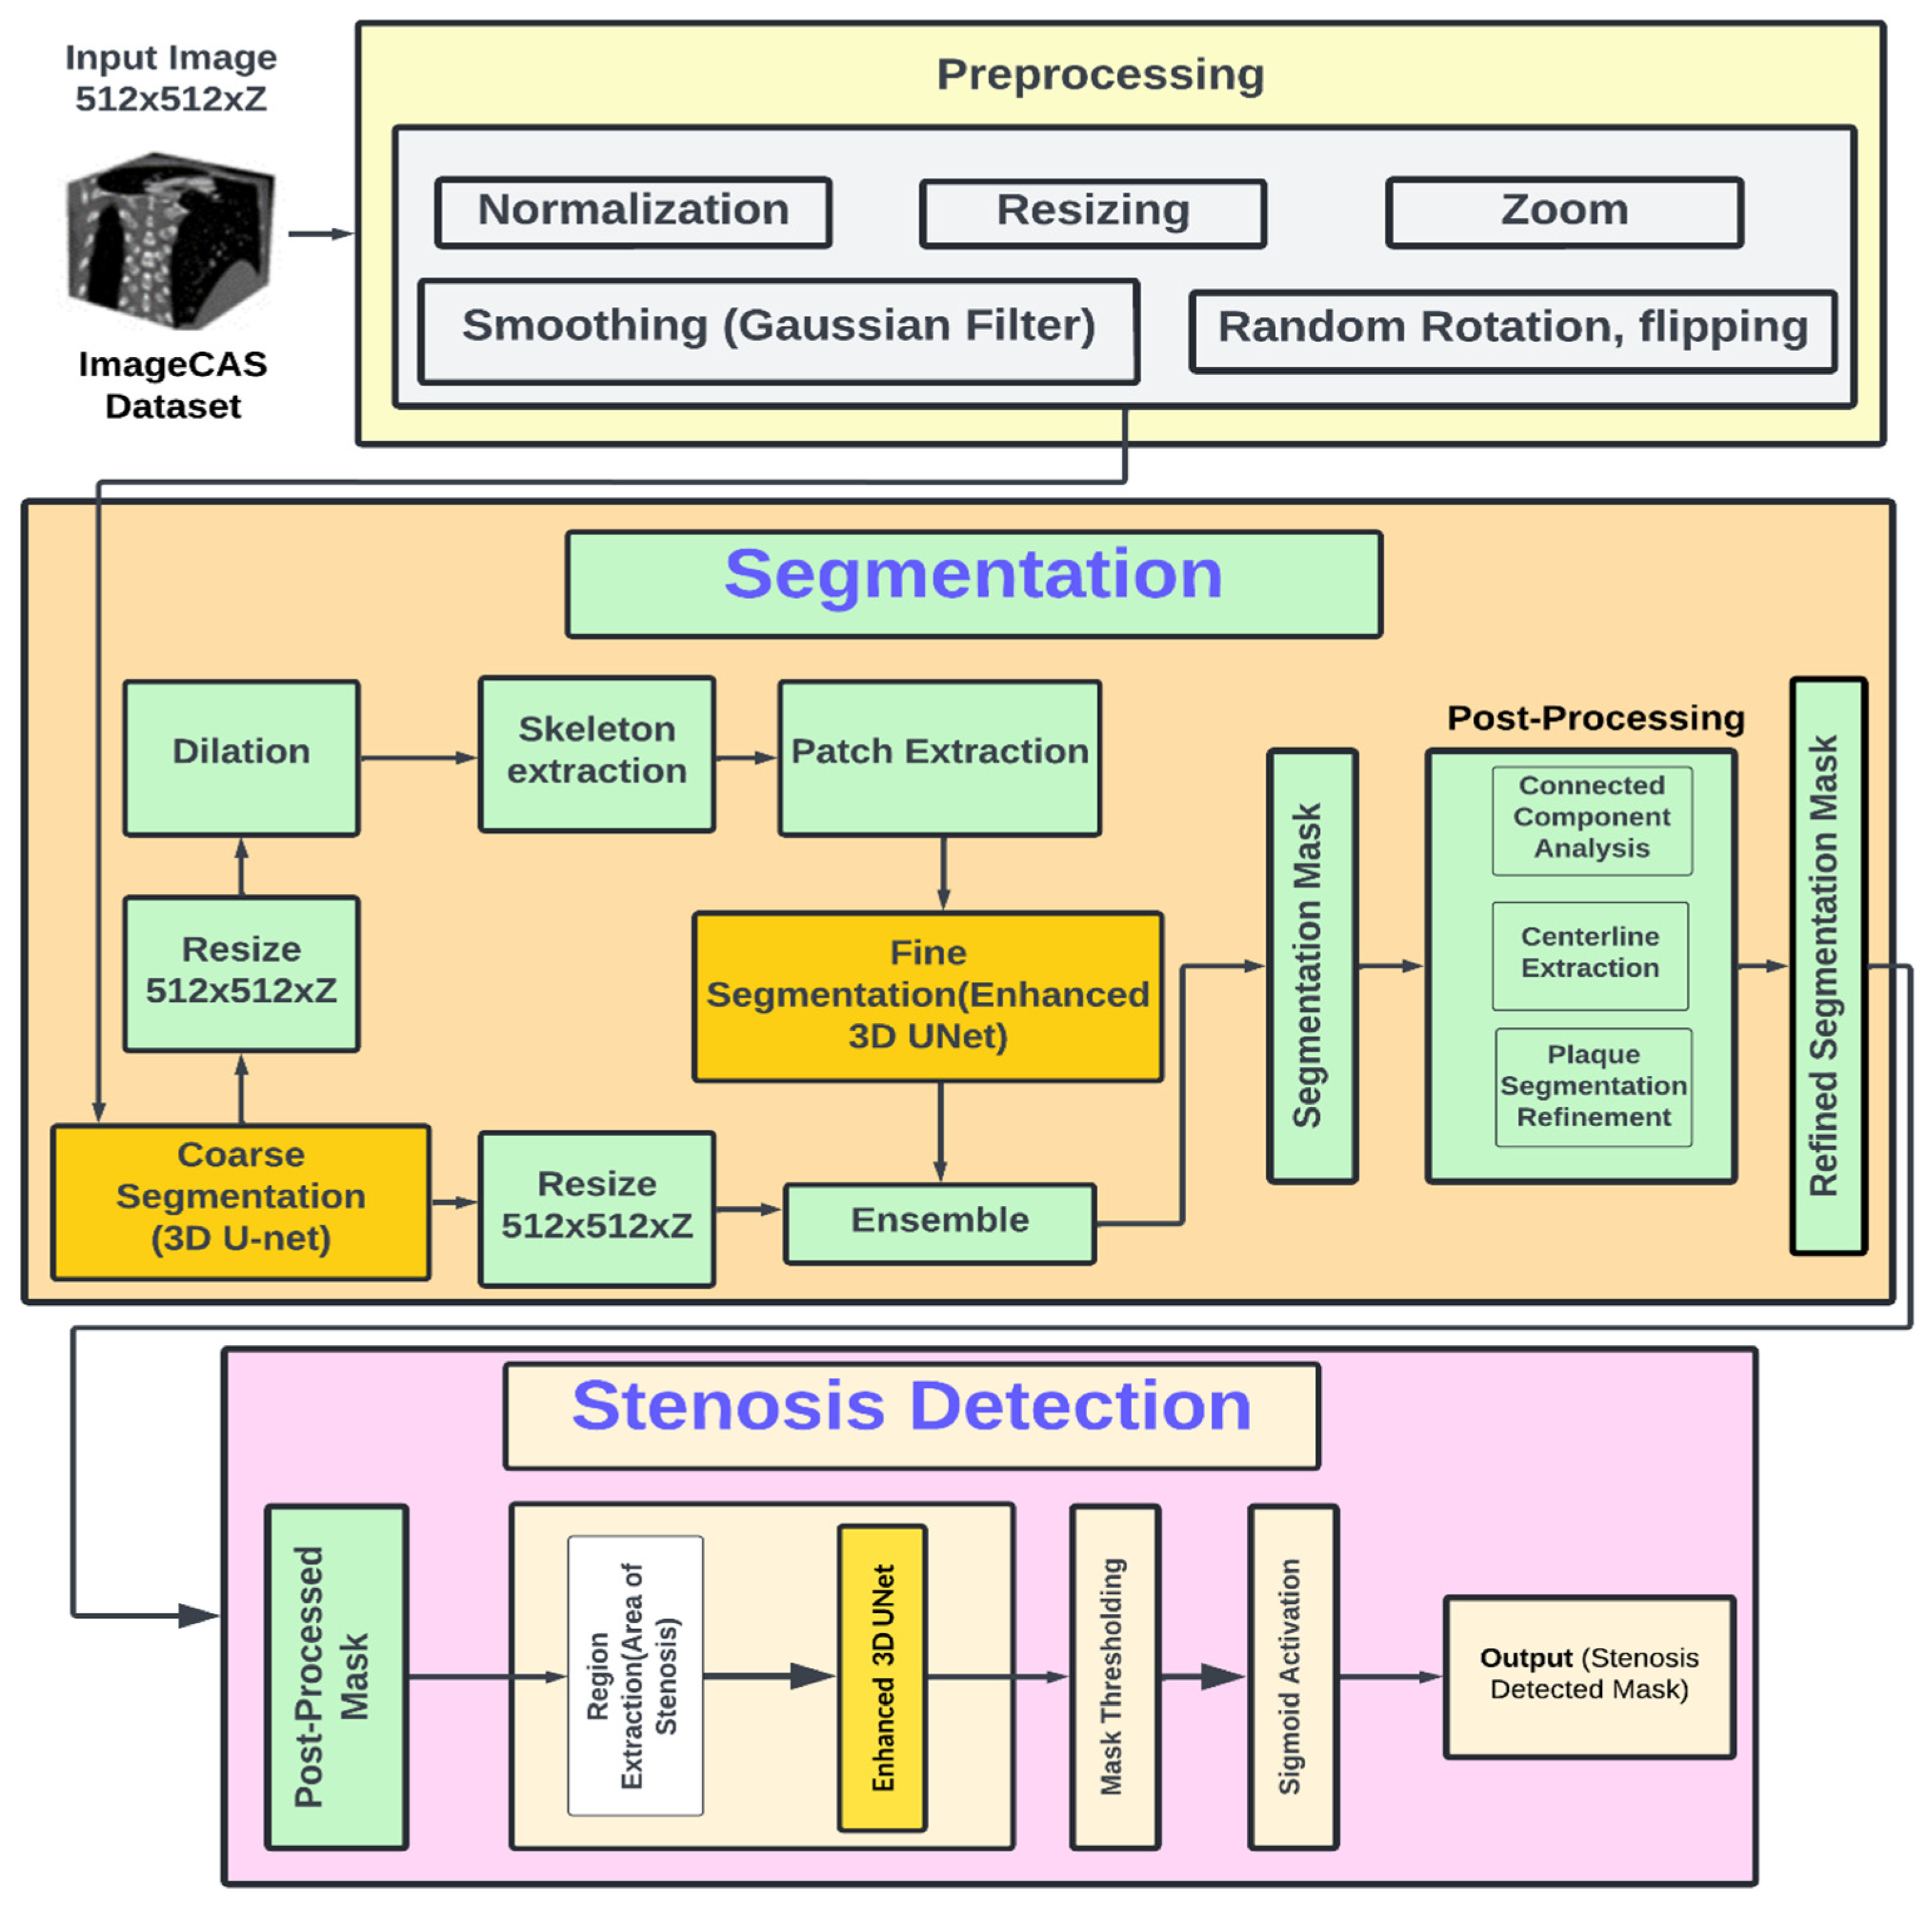
Figure 1: Architecture diagram.
Preprocessing prepares CTA images by standardizing dimensions, normalizing intensities, and augmenting data to enhance model robustness. This ensures consistent input quality, enabling the segmentation models to focus on anatomical structures while minimizing scan variability. The main components of this stage are summarized in Fig. 2. The detailed process is described in Algorithm 1.
Input: Preprocessed CTA images (from Data Preparation Module).
Output: Coarse segmentation mask of the coronary arteries with dimensions (512 × 512 × Z).
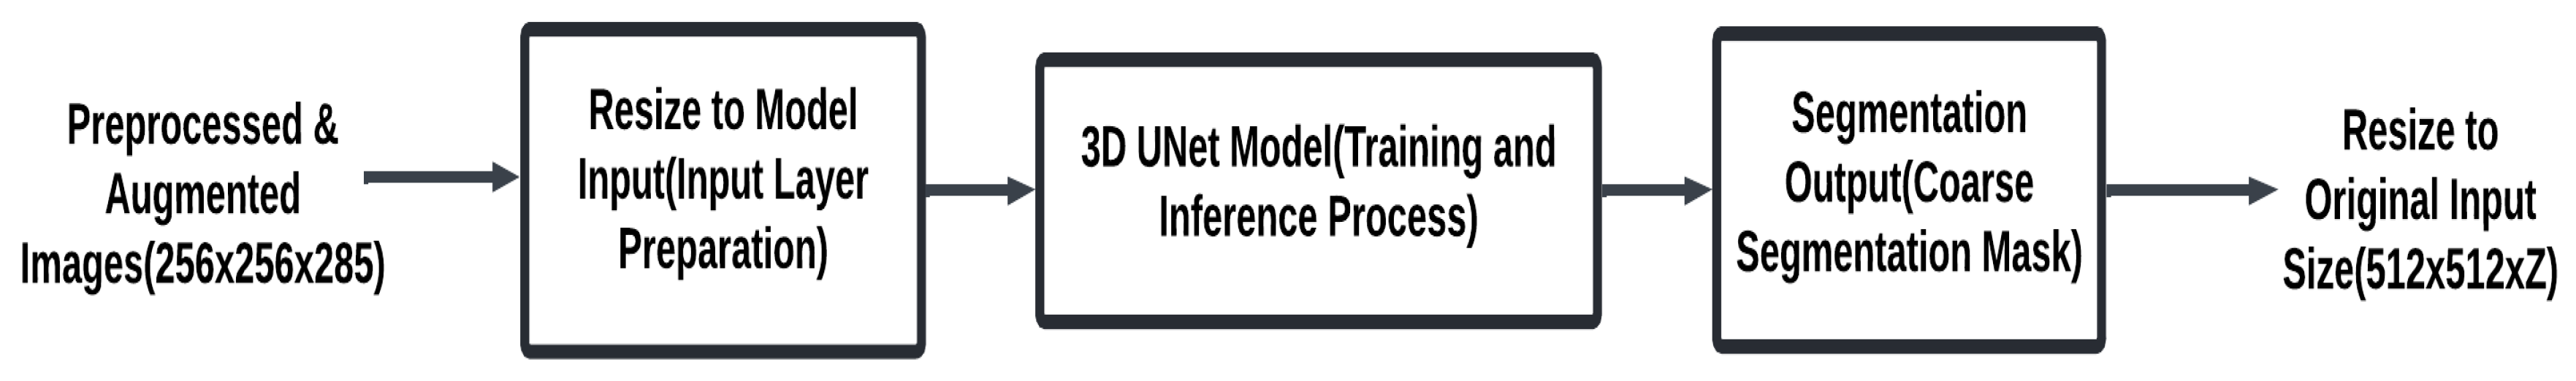
Figure 2: Simple 3D UNet segmentation module.
| Algorithm 1: Coarse segmentation pipeline using 3D U-Net |
| 1. Initialize coarse segmentation pipeline: Create an empty list coarse_masks to store the segmentation masks. 2. For each preprocessed image in the dataset (from processed_images): Ensure the input image is in the correct shape for the 3D U-Net model: 3. Reshape the input image to (batch_size, channels, depth, height, width) where channels = 1 for grayscale images. Example reshaping (if necessary): image = image.unsqueeze(0) to create a batch dimension. 4. Apply the 3D U-Net model for coarse segmentation: Forward pass through the model to obtain the predicted segmentation mask outputs = model (images) The model outputs a tensor of shape (batch_size, 1, D, H, W) representing the predicted mask. Resize the output mask if necessary: Ensure the predicted mask has the same dimensions as the original label. This can be done by resizing the output using F.interpolate (trilinear interpolation). outputs = F.interpolate(outputs, size = (original_depth, original_height, original_width), mode = ‘trilinear’, align_corners = True) Append the resulting segmentation mask to the list coarse_masks. 5. Return the list coarse_masks containing the coarse segmentation masks. |
- Description:
This pipeline should create preliminary masks for a given set of preprocessed images using a DLM, typically 3D U-Net. The first step would be to initialize an empty list called coarse_masks; this will hold the predicted masks for each processed image. The list will be used as a container for the outputs of coarse segmentation, which can then be refined at subsequent stages of the pipeline or even used for analysis.
Each of the preprocessed images is then reshaped to conform to the input format of 3D U-Net. The input format for 3D U-Net is a 5D tensor of the size: (batch_size, channels, depth, height, width). If it happens to be a grayscale image, the number of channels would be 1; if not so, then reshape by adding a batch dimension. This can be achieved by using the unsqueeze(0) function, where an additional dimension representing the batch size is added, even for the processing of only one image. This is a reshaping step so that the image is appropriately ready for the model’s operation and processed efficiently at inference time in batches.
In Fig. 2, it has been reshaped suitably; it gets input into the 3D U-Net for coarse segmentation. To make a forward pass through the layers of a U-Net architecture designed for biomedical image segmentation, it extracts features and iteratively refines the segmentation predictions. At the output, the model gives out a tensor of shape (batch_size, 1, D, H, W), meaning that D, H, and W are the respective predicted depth, height, and width of the mask generated for segmentation. It produces a binary segmentation mask that probably would correspond to the presence or absence of an anatomical structure in, for example, the image, such as a tumor or a vessel.
This size of the predicted segmentation mask could now be resized to size to be according to the size of the original input image. This is especially critical when input images were resized in preprocessing since the mask created needs to be exactly overlayed with the original for further analysis. This is usually done via trilinear interpolation, thus avoiding jagged scaling while trying to maintain spatial relationships. The interpolate function of PyTorch is commonly used to resize the mask appropriately to the depth, height, and width of the original image so that in the resized mask, everything aligns perfectly with what is seen in the anatomical features in the image.
The mask received is appended to coarse_masks-list that holds all masks generated for every input image. After processing the images using this 3D U-Net model, this list of coarse segmentation masks comes back. This is essentially the first result for the segmentation of the image; otherwise, this is the starting point that can be further processed for its refinement or analyzed in detail to get further evaluation. This coarse segmentation is very critical because it becomes the starting point for better, precise, and detailed segmentations through post-processing or by fine-tuning the models.
The segmentation pipeline refines coarse results to produce precise anatomical delineations of coronary arteries. It uses the Enhanced 3D U-Net with deeper layers and advanced features to capture fine details. Fig. 3 outlines the core steps involved in this stage.
In this step, the input is the coarse segmentation mask generated by the Simple 3D U-Net in the preceding stage. This mask is a binary tensor, where vessel voxels are assigned a value of 1 and background voxels a value of 0. For the purpose of patch extraction, this mask is aligned with the preprocessed CTA volume (not the raw image) to ensure consistent voxel resolution and intensity normalization. Patches are extracted from the regions corresponding to the coronary vessels in the coarse mask, effectively cropping vessel-centered sub-volumes from the preprocessed CTA image rather than simply overlaying the mask on the original image. This approach preserves the anatomical detail necessary for fine segmentation while avoiding redundant background information. The enhanced segmentation process is detailed in Algorithm 2.
Input: Coarse segmentation masks from Coarse Segmentation Module.
Output: Refined segmentation mask using Enhanced 3D U-Net segmentation (512 × 512 × Z).

Figure 3: Enhanced 3D UNet segmentation module.
| Algorithm 2: Segmentation pipeline using enhanced 3D U-Net |
| 1. Initialize segmentation pipeline: Create an empty list segmentation_masks to store the predicted segmentation masks. 2. For each preprocessed image in the dataset (from processed_images): Ensure the input image is in the correct shape for the Enhanced 3D U-Net model. Reshape the input image to (batch_size, channels, depth, height, width) where channels = 1 for grayscale images. Example reshaping: image = image.unsqueeze(0) # Adds batch dimension. 3. Apply the Enhanced 3D U-Net model for segmentation: Forward pass through the model to obtain the predicted segmentation mask: outputs = model(images) The model outputs a tensor of shape (batch_size, 1, D, H, W) representing the predicted segmentation mask, where D, H, and W are the depth, height, and width of the image, respectively. 4. Resize the output mask if necessary: Ensure the predicted mask has the same dimensions as the original image by resizing using trilinear interpolation if the output shape differs from the input: outputs = F.interpolate (outputs, size = (original_depth, original_height, original_width), mode = ‘trilinear’, align_corners = True) 5. Store the segmentation mask: Append the resized segmentation mask to the list segmentation_masks. Return the list of segmentation masks: 6. After processing all images, return the list segmentation_masks which contains the predicted segmentation masks. |
- Description:
This pipeline does segmentation on pre-processed medical images using an Enhanced 3D U-Net model. Pre-processing Before the process begins, the pipeline creates an empty list called segmentation_masks that carry along the predicted masks for all of the images. These masks will be stored during this process acting like middle outcomes that can be further elaborated or refined, based on the further possible steps in the pipeline.
In Fig. 3, every preprocessed image is reshaped according to the requirements of the model input in Enhanced 3D U-Net. The input for the model is a 5D tensor of size (batch_size, channels, depth, height, width). Since images here are grayscale (single channel), the batch dimension was added by using the unsqueeze(0) method so that the image has the right format for computation. The reshaping at this step is necessary for feeding data into the model efficiently as well as allowing for batch processing during inference.
Once they are appropriately reshaped, the images pass through the Enhanced 3D U-Net model to accomplish the segmentation task. This model incorporates deep architecture comprising down-sampling and up-sampling convolutions, coupled with skip connections.
Forward pass through the network: This will be passing to a tensor output in shape (batch_size, 1, D, H, W), where D, H, and W are the depth, height, and width of the mask prediction, respectively. Finally, the model outputs the mask that highlights the area of interest such as the area of stenosis, tumor, or vessel through learned features. Since the predicted mask is likely to be of possibly different sizes than the original image and especially if preprocessing included resize, the output mask must be resized to fit within the dimensions of the input image. This is done using trilinear interpolation, preserving spatial relationships as well as avoiding distortion caused by the segmentation. The function F.interpolate() from PyTorch is applied to rescale the predicted mask to match the original size, hence ensuring it properly aligns with anatomical features within the image for adequate analysis.
The resized mask is appended to the list of segmentation_masks. The segmentation_masks list contains all the results of the segmentation of the input images. Return the list after all the images have been processed. These are the preliminary segmentation masks results that may either be post-processing for further fine-tuning or directly applied to find some features like stenosis. The preliminary segmentation of the first kind is necessary to support the possibility of better downstream analysis and detection.
Post-processing further enhances the quality of the refined segmentation masks by removing noise, preserving the largest connected anatomical structures, and improving plaque region delineation. These steps increase the clinical relevance of the segmentation results, ensuring that only the most diagnostically important features are retained. Fig. 4 summarizes the post-processing procedure. The detail process described an Algorithm 3.
Input: Refined segmentation masks from Patch Segmentation Module.
Output: Final segmentation mask ready for stenosis detection.
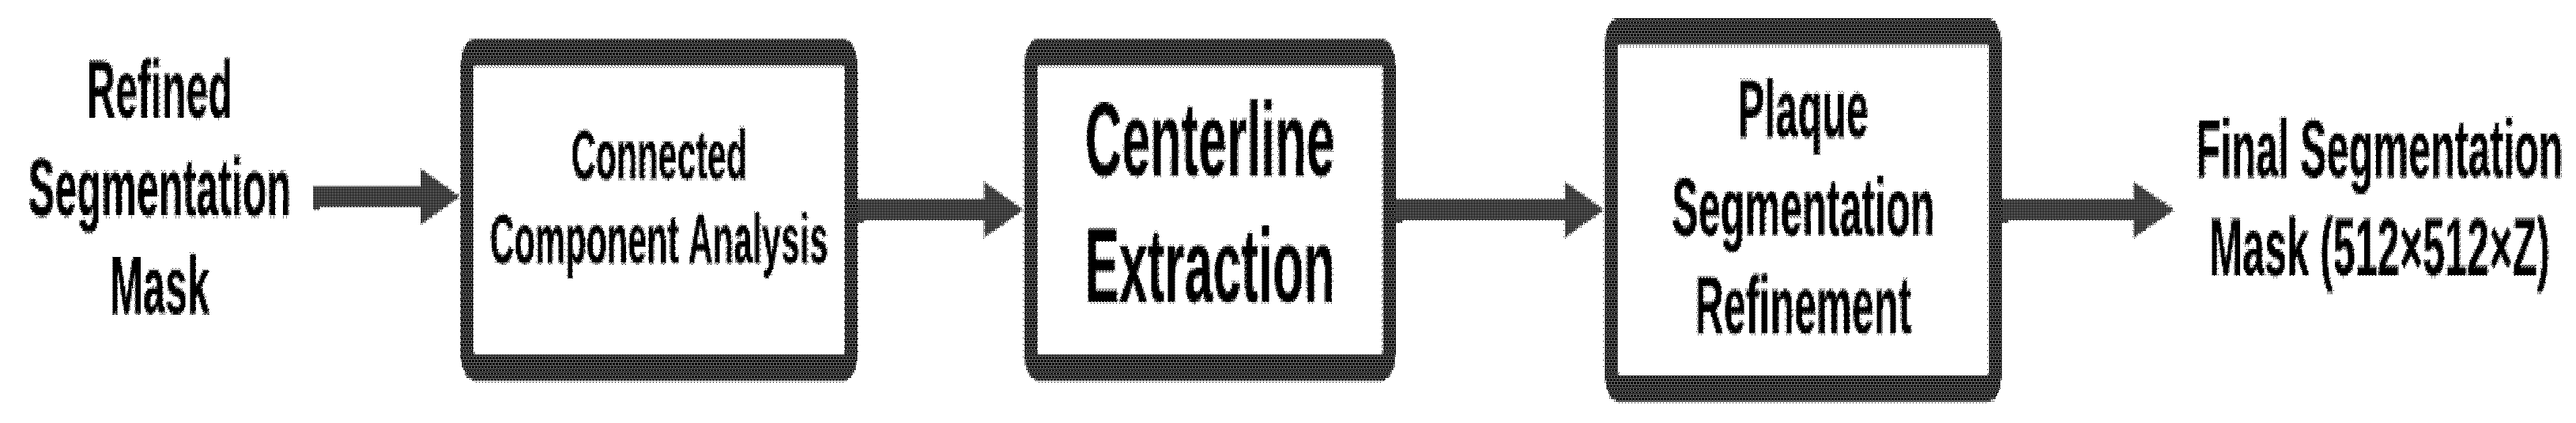
Figure 4: Post-processing module.
| Algorithm 3: Post-processing pipeline for refined coronary artery segmentation |
| 1. Initialize post-processing pipeline: Create an empty list, final_masks, to store the post-processed segmentation masks. 2. For each refined mask in the refined_masks list: Ensure the refined mask is in the correct shape and format before processing. 3. Apply connected component analysis: Perform connected component analysis to identify and retain the largest connected component in the mask. This helps eliminate small, irrelevant noise and ensures that the main structure of interest (e.g., the artery) is preserved. Use a function like get_largest_component (mask) to isolate the largest connected component. 4. Centerline extraction: Extract the centerline of the segmented coronary artery to use as a reference for further refinement. The centerline extraction will guide the segmentation of plaque regions. Use a centerline extraction algorithm (e.g., using distance transforms or skeletonization) to obtain the centerline. 5. Plaque segmentation refinement: Refine the plaque regions of the mask using the extracted centerline as a reference. This step focuses on accurately delineating the plaque regions, which are crucial for stenosis detection. Use techniques such as morphological operations or region-growing algorithms for plaque refinement. 6. Store the refined mask: Append the refined mask to the final_masks list. 7. Return the list of refined masks: Once all refined masks are processed, return the final_masks list, which contains the post-processed segmentation masks ready for stenosis detection or clinical evaluation. |
- Description:
The post-processing pipeline is required to fine-tune the raw masks generated by the Enhanced 3D U-Net model. This is done by initializing an empty list called final_masks, which stores the post-processed masks from the segmentation. This list contains the final refined segmentation masks, ready for stenosis detection. For each high-quality mask in the mask list, the pipeline conducts the following process aimed to further fine-tune the quality of the mask: For each segmentation mask, conduct connected component analysis in order to select and keep the largest connected component; this is typically the most relevant structure so that that is what one is usually interested in, for example, the coronary artery or the stenotic region. This decreases the small noise or irrelevant regions that might have been wrongly segmented, leaving only the most important features in the mask.
In Fig. 4 the process applies centerline extraction. In order to provide a better reference for further refinement of segmentation masks, the computation of the centerline of segmented coronary artery is done. It has been particularly effective in aligning masks on central axes of arteries during the further refinement of plaque regions. The centerline becomes then a guiding feature which ensures that segmentation happens correctly on the appropriate anatomy. After the extraction of centerline, there is the refinement of plaque segmentation. The process of refinement is to enhance the accuracy of the plaque regions in the segmentation mask using the centerline. This step focuses on areas near the centerline for better segmentation of plaque regions-these are critical for the detection of stenosis. In return, the quality of the final mask improves noticeably, particularly when searching for stenosis-related features such as the narrowing due to plaque buildup in the artery.
Add a mask to final_masks. After all images from the dataset were posted for processing, a list final_masks will be filled with all the refined masks of segmentation at the last step. Such masks of segmentation can be more useful for further steps for the detection of stenosis or clinical assessment, where outlining and plaques’ regions of coronary arteries shall be visually represented as an indispensable tool for diagnosis.
The stenosis detection stage identifies regions of arterial narrowing within the final segmentation masks. Using the Enhanced 3D U-Net, this stage focuses on detecting and localizing stenotic areas with high precision, ensuring accurate identification of clinically significant lesions. Fig. 5 provides an overview of the detection process. The stenosis detection process is detailed in Algorithm 4.
Input: Post-processed segmentation mask.
Output: Stenosis region mask, highlighting the stenosis area (narrowing of the artery).
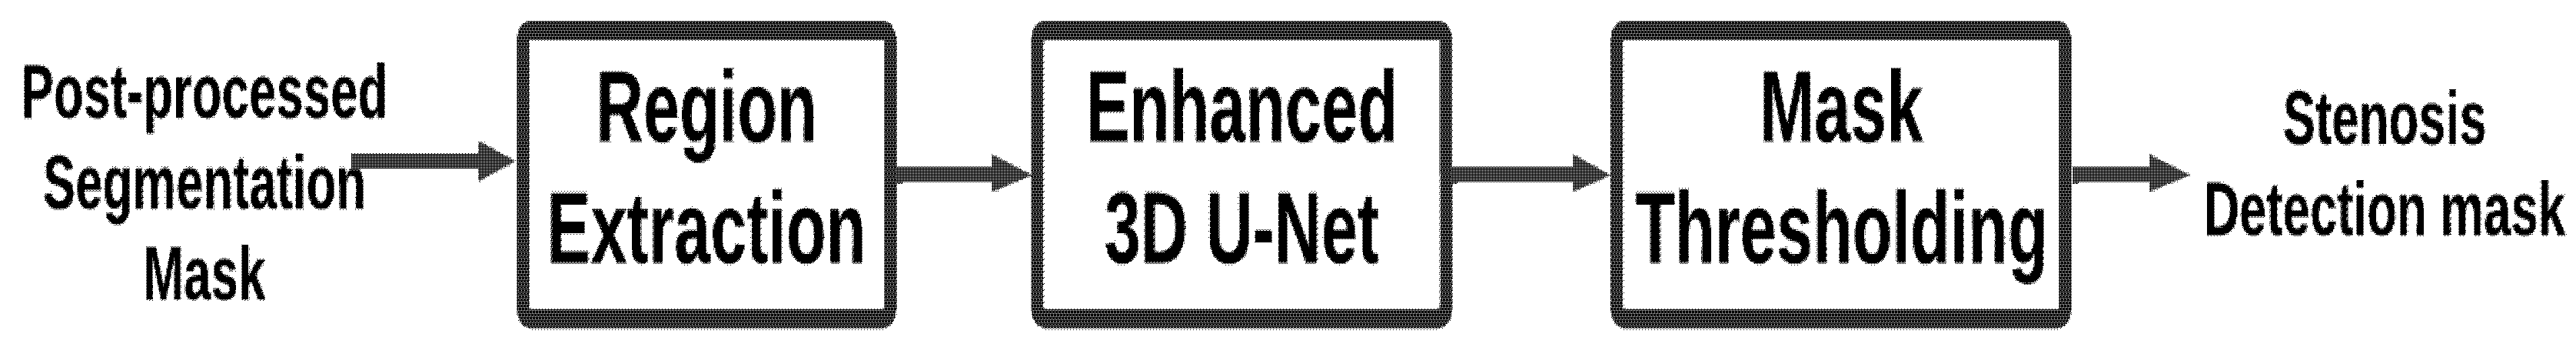
Figure 5: Stenosis detection module.
| Algorithm 4: Stenosis detection pipeline using enhanced 3D U-Net |
| 1. Initialize stenosis detection pipeline: I will prepare an empty list called stenosis_results to store the detected stenotic regions for each processed mask. 2. Post-process each mask in the list of inputs (from final_masks): Be certain that the mask is correctly sized for processing, such as for example, [batch_size, channels, depth, height, width]. 3. Potential stenotic areas extraction (ROI) The mask usually is determined by the plaques and narrowing of the arterial for regions most likely to become stenotic. Morphology operations or thresholding might be applied to the mask, then to select the region of interest. 4. Apply the Enhanced 3D U-Net model towards detecting the stenosis region: Input the postprocessed mask into the Enhanced 3D U-Net model. It will now be trained to locate stenosis regions based on the refined mask of the segmentation mask. The model produces then a probability map or even a binary mask indicating the likeliness of stenosis at each region of the mask. 5. Post-processing of output: The output from the model passes through a thresholding function, converting this into a binary mask in which 1 represents a stenotic region, and 0 represents a non-stenotic region. Optional operations include morphological cleanups: for instance, small artifacts can be removed and fragmented regions joined by closing or dilation. 6. Record the detection result of stenosis: Append the final stenosis detection result, that is, the binary stenosis region mask, to the list stenosis_results. Return the detection of stenosis results Return the list of binarized stenosis masks for each processed image in the stenosis_results when all the masks have been processed. |
- Description:
Module Stenosis Detection: This module identifies stenotic regions in coronaries using the refined post-processed segmentation masks. It starts by initializing an empty list called stenosis results to store results of stenosis detection for every processed mask. This must check if the mask is the correct format and also in a correct shape before this gets fed into the post-processing that is inside the input list called final_masks for an Enhanced 3D U-net model. It is, being trained for detection purposes for the stenosis region, accepts the mask with refined ones as the inputs, generating a probability map or even a binary mask that will contain all possible areas of potential stenotic regions within an artery.
This binary mask is subsequently the result of thresholding sigmoid applied on output of this model. In this mask, 1 accounts for the fact that given area is stenosed whilst a 0 refers to a non-steno area. On application of morphological operations, cleaning up small regions or small artefacts may be done, such that solidity and cohesiveness of detected stenosis areas are assured. The list stenosis_results includes the processed stenosis detection mask. In the algorithm 4 the algorithm returns all the masks in stenosis_results, which is a composition of the detected regions of stenosis for each one of the input images.
4 Implementation, Results and Discussion
This section explains the experimental setup and dataset used for the detection of coronary artery stenosis using deep learning models in segmenting coronary arteries. Here, hardware, tools, and libraries used along with the ImageCAS dataset annotated with high-resolution CTA images by radiologists are described. The results of the implementation show the performance of 3D UNet and Enhanced 3D UNet in terms of accuracy, loss, along with some performance measures such as the Dice score, precision, and recall, and finally compare the application of the models for clinical outcomes using different metrics of performances.
Based on a hardware setup of NVIDIA GPUs (P5000) equipped with CUDA acceleration for optimum training time, this work enables the handling of the complex operations involved in artery segmentation and stenosis detection. The programming language used is Python 3.10 to ensure compatibility with the latest machine learning libraries and tools.
The additional tools and libraries include, which is used integrated in the pipeline of the implementation. The problem of manipulation and visualization of the data is addressed by NumPy and Matplotlib while using advanced transformations.
The dataset comes from quite broad sources, primarily by the ImageCAS dataset, which consists of over 1000 Contrast-Enhanced CTA images of patients suffering from documented CAD. In Fig. 6 scans were performed using a Siemens 128-slice dual-source scanner to ensure that all images are consistent, high resolution and high-quality 3D reconstructions suitable for advanced coronary artery segmentation and stenosis detection.
Figure 6: Sample 3D CTA image.
It includes accurate delineation for major coronary arteries: This comprises the Left Main Coronary Artery LMCA, Left Anterior Descending Coronary Artery LAD, Left Circumflex Artery LCX, Right Coronary Artery RCA, and minute branches that include Diagonal and Marginal branches. Such annotation, in general, helps considerably to ensure that the segmentations have accurate delineations of the coronary structures themselves in order to provide advanced clinical assessment.
Every image in the database contains 512 × 512 × Z pixels and contains 206 to 275 slices per scan depending on a patient’s anatomy. Planar measurements’ resolution ranges within 0.29–0.43 mm. Slice thickness ranges within 0.25 and 0.45 mm. Such a density of details will be sufficient enough for analysis of conditions of arterial health and diseases of stenosis.
Annotations are performed by the expert radiologists, using segmentation guidelines from the American Heart Association (AHA), which ensures accuracy and consistency. Annotations are made not only for normal arterial regions but also for segments where stenosis has caused the narrowing, thereby allowing machine learning models that target CAD to obtain full ground truth data.
The major emphasis of manual annotations is on stenosis, showing plaques, narrowing of arteries, and occlusions. This focus is highly relevant for models developed to detect stenosis, allowing them to improve the detection and classification of abnormal segments in coronary arteries. The dataset is clinically very applicable, starting from applications as very essential as segmentation-delineation of the coronary artery-is necessary; classification-distinguishing normal from the stenosis-affected segments-for the help of diagnosis and the treatment strategy in patients with CAD.
The major strengths of this dataset are diversity and generalizability, such as a big number of cases, including almost all varieties of anatomical structures, patients, and different degrees of stenosis. Diversity leads to robust model training and greater generalization, which makes it pretty suitable for application in clinical practice. The dataset contains high-quality images and fine-grained annotations, making it suitable for training and testing models focused on coronary artery segmentation and stenosis detection. In addition, adherence to AHA guidelines allows this dataset to be a reliable benchmark for comparison and evaluation both in research and clinical practice. The data contains both major arteries and minor branches, ensuring that there are subtle anatomical variations and smaller stenotic lesions well-represented, thus providing a very comprehensive resource for model development.
Fig. 7 illustrates this view of the segmented coronary artery with three slices, Ground Truth, Predicted, and Original Image, gives a general overview of how well the model works. The Ground Truth is used as a gold standard and the Predicted image displays the model’s output so that one can very clearly compare the accuracy of this. Overlaying these slices with the Original Image helps to contextualize the segmentation within the anatomical structure. Such visualization emphasizes the accuracy of the model and helps in areas where the predictions match or differ with the actual ground truth. This approach promotes transparency, thus allowing further fine-tuning in segmentation techniques.
Figure 7: Segmentation using 3D UNet.
Fig. 8 illustrates Results obtained with the Enhanced 3D UNet in the coronary artery segmentation are just slightly better than those obtained with the 3D UNet. Visualization of slices of Ground Truth, Predicted, and Original Image gives better accuracy and finer details achieved by the Enhanced 3D UNet. The enhanced model seems to fit better with the Ground Truth, thus reducing the error in the segmentation process and improving the quality in general. This improvement underlines sophisticated architectural improvements that can potentially capture very complex anatomical structures. Such results justify Enhanced 3D UNet as a model for the purpose of accurate coronary artery segmentation.
Figure 8: Segmentation using enhanced 3D UNet.
Fig. 9 image illustrates how the Enhanced 3D UNet handles missing arteries. It also shows very clearly cases with no artery: Ground Truth, Predicted, and Original Image slice together demonstrate the fact that the model was correctly outputting a segmentation of a lack of when there was actually nothing present so the segmentation mask would line up precisely to the ground truth. This would, even in negative cases, point to a very strong generalization and avoidance of false positives within the model. This reliability is important in medical imaging to ensure accurate detection both when arteries are present and absent.
Figure 9: Image with no artery.
Fig. 10 Demonstrates an example of the output of postprocessed segmentation mask stenosis results. It is used to represent the processed region of interest, showing a possibly narrowed or obstructed section of the coronary artery. In this sense, the enhanced 3D U-Net model-based created segmentation mask shows well enough the various regions for clinical assessment, specifying the regions with stenosis. As shown in Fig. 10, the detection accuracy of stenosis is greatly enhanced after post-processing steps, such as plaque segmentation refinement and thresholding.
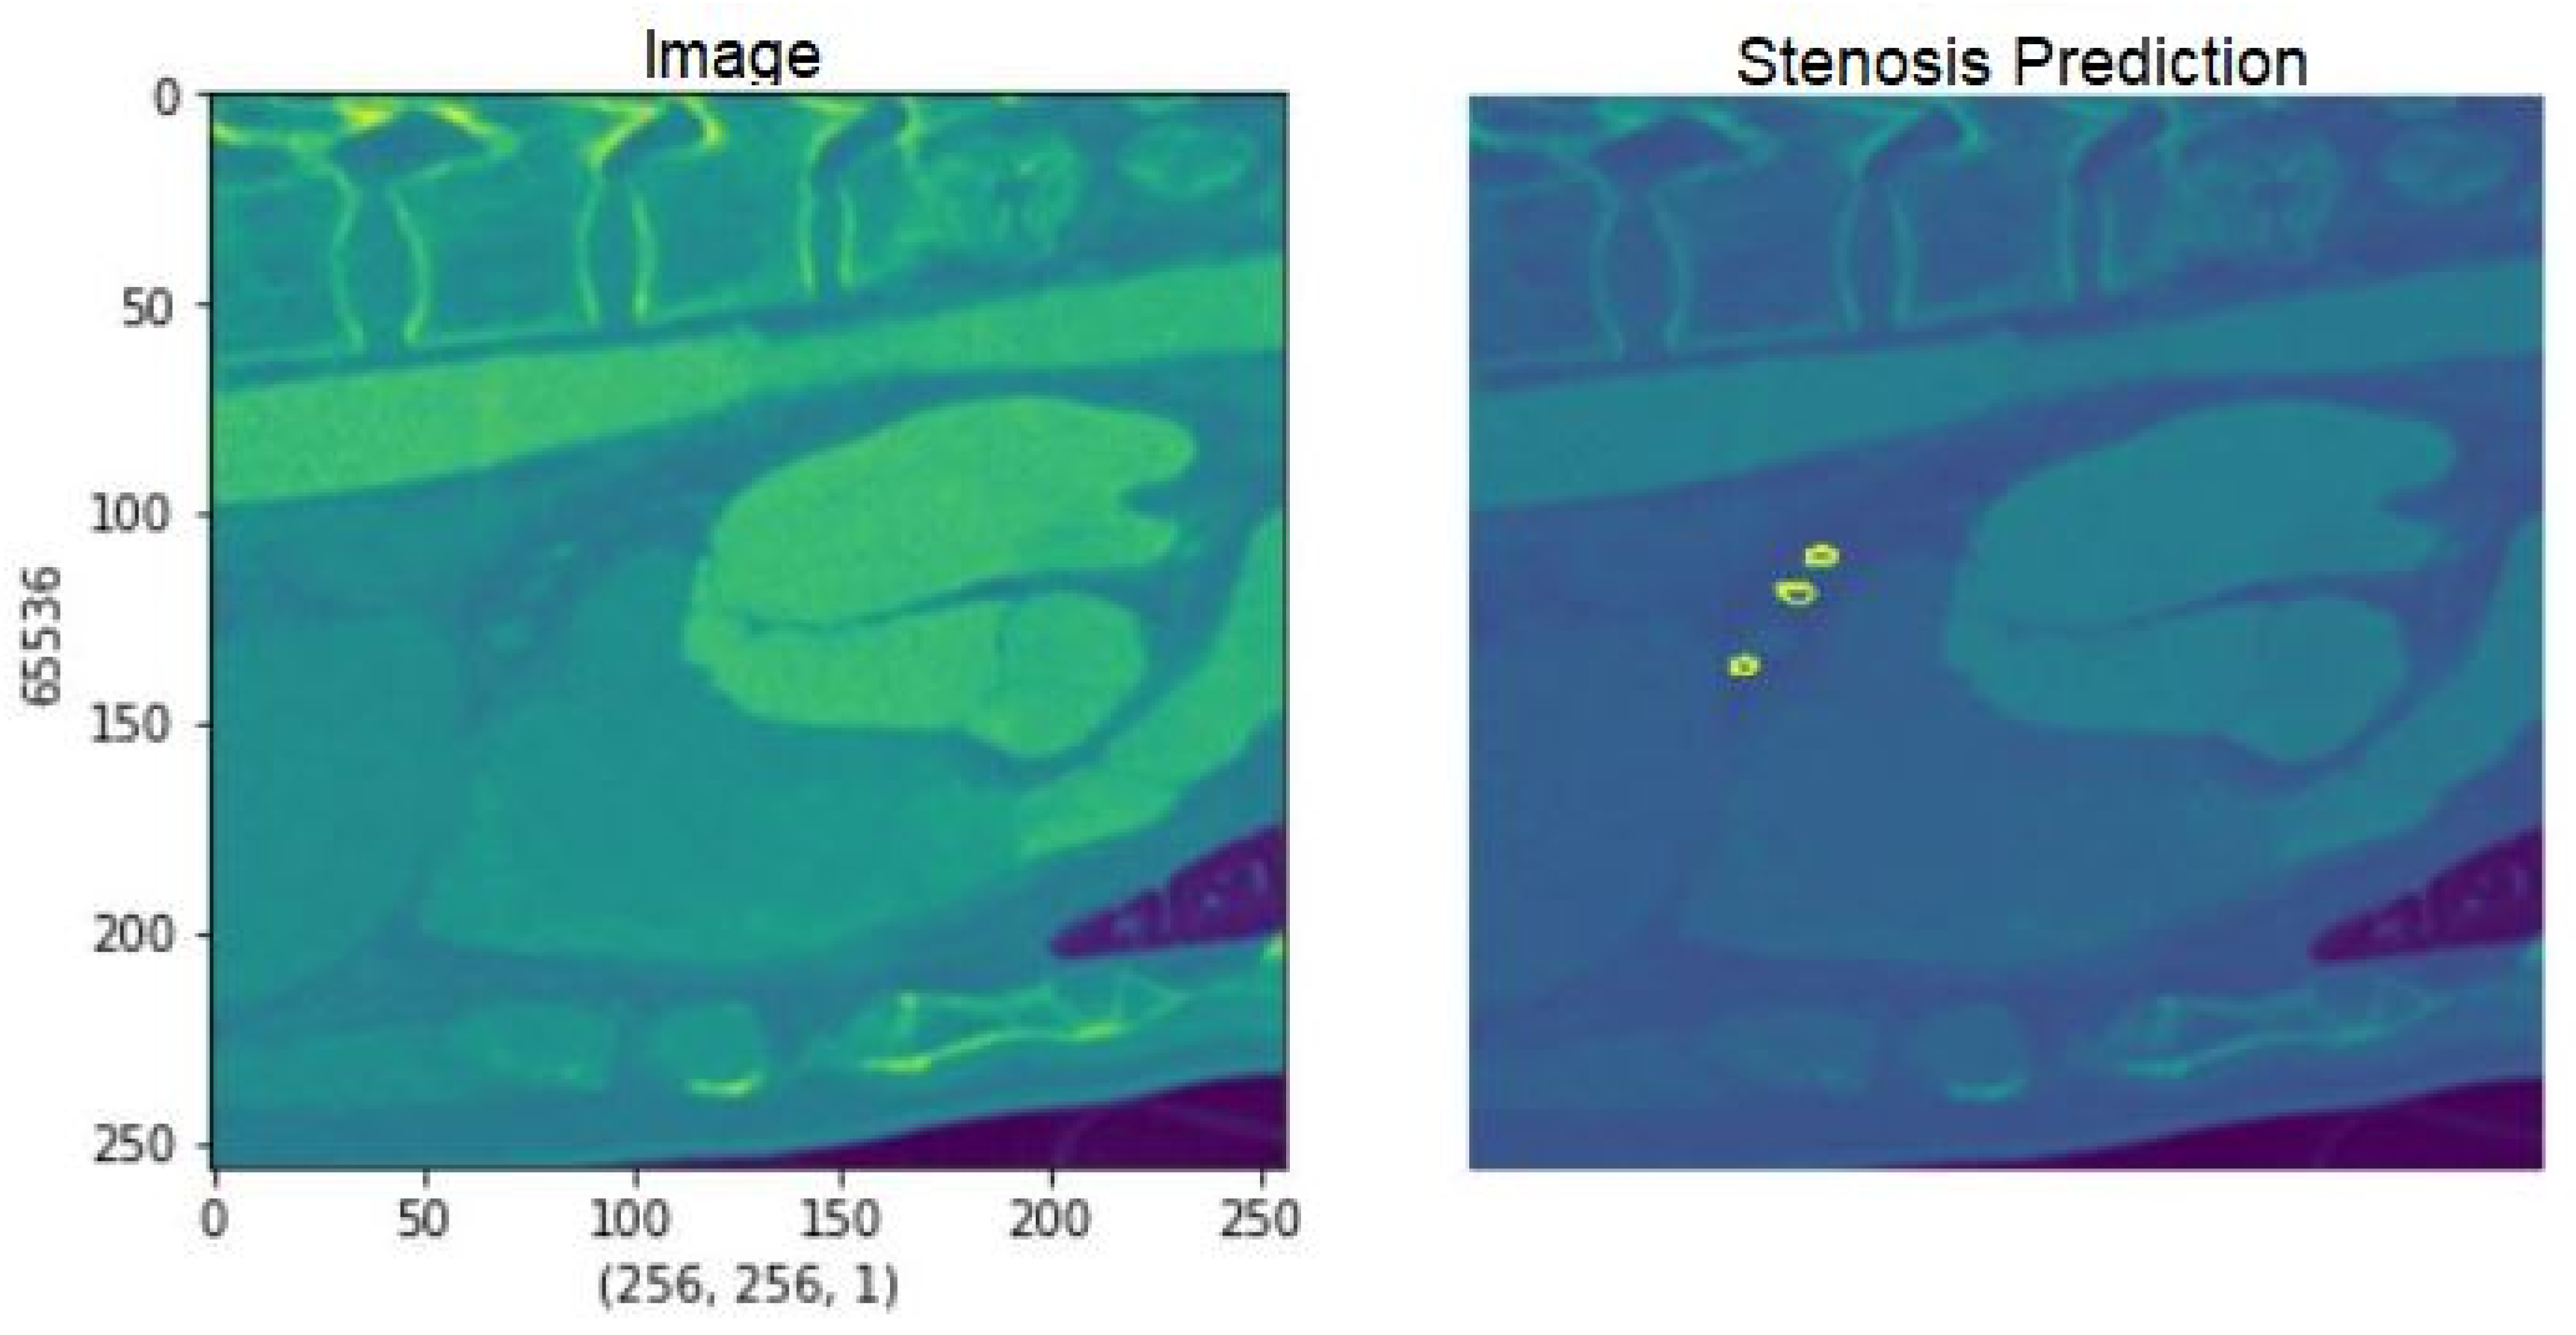
Figure 10: Detection of stenosis.
Fig. 11 illustrates accuracy comparison line chart for the 3D UNet and Enhanced 3D UNet models really shows that both have made great performances since they sustain remarkable accuracy up to their last epochs of training. It is seen that in the later epochs, slight improvements are shown by Enhanced 3D UNet, so it reflects a generalization ability on this dataset. The models provide an accuracy of more than 99.93% so these models are efficient for the task of the coronary artery segmentation. With respect to the stability in terms of accuracy progression, the advanced 3D UNet demonstrates smoother optimization. Comparing this type opens possibilities for new architectures like enhanced 3D UNet for higher precision imaging.
Fig. 12 illustrates the chart which further gives loss value comparisons of 3D UNet and Enhanced 3D UNet, which has proven for optimization superiority. Loss of the models is seen with consistent trends; however, losses in subsequent epochs of Enhanced 3D UNet are much lower. It thus enhances learning abilities during training time with minimum error. A smoother trend in the downward direction depicts that the Enhanced 3D UNet obtains strong results along with well-convergence results for coronary artery segmentation tasks.
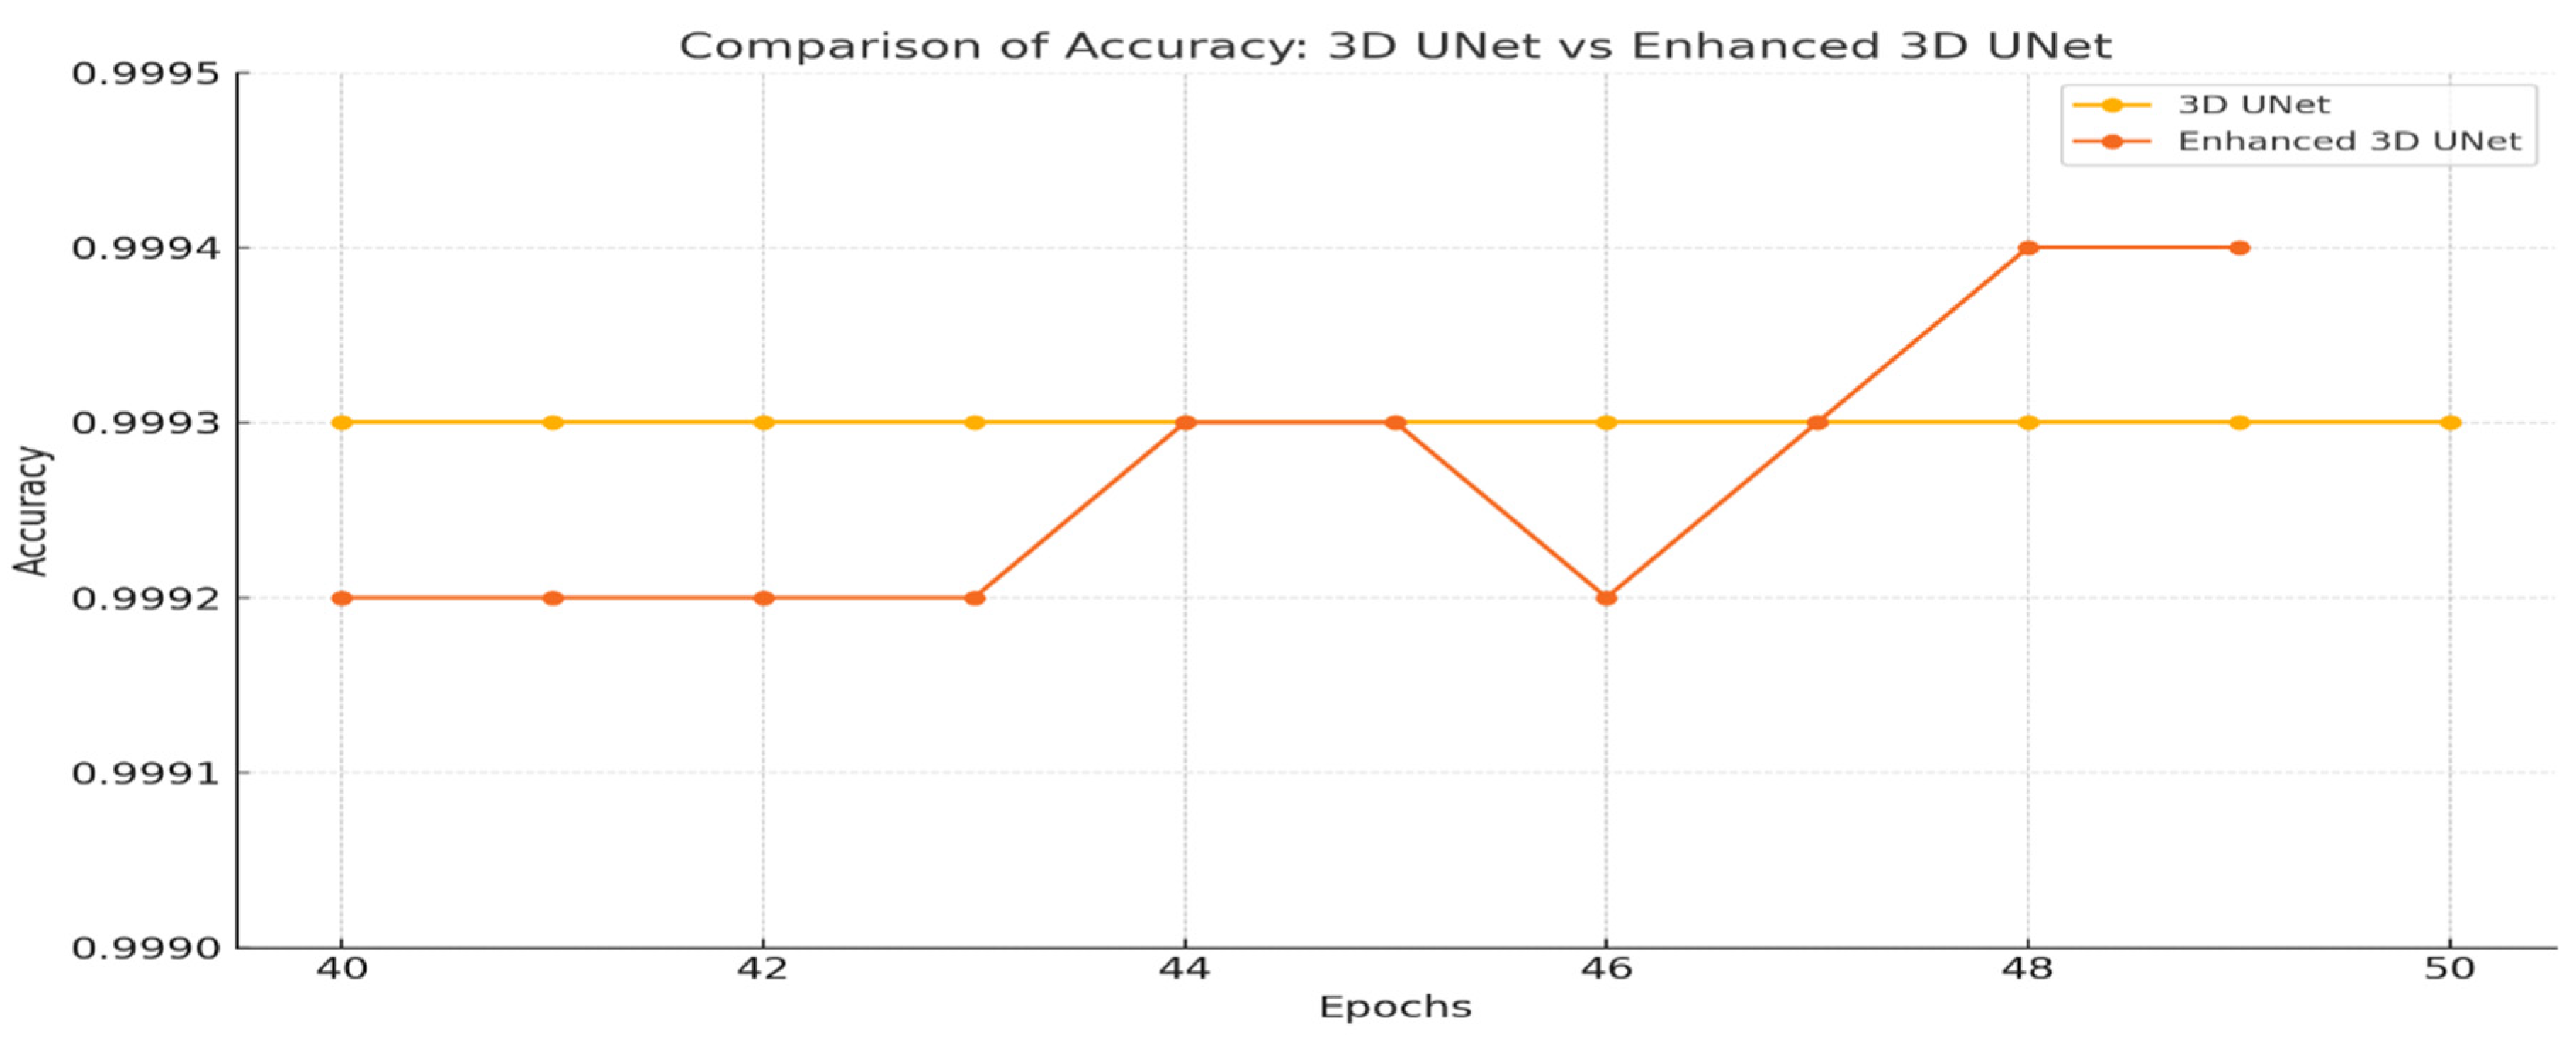
Figure 11: Comparison of accuracy—3D UNet vs. enhanced 3D UNet.
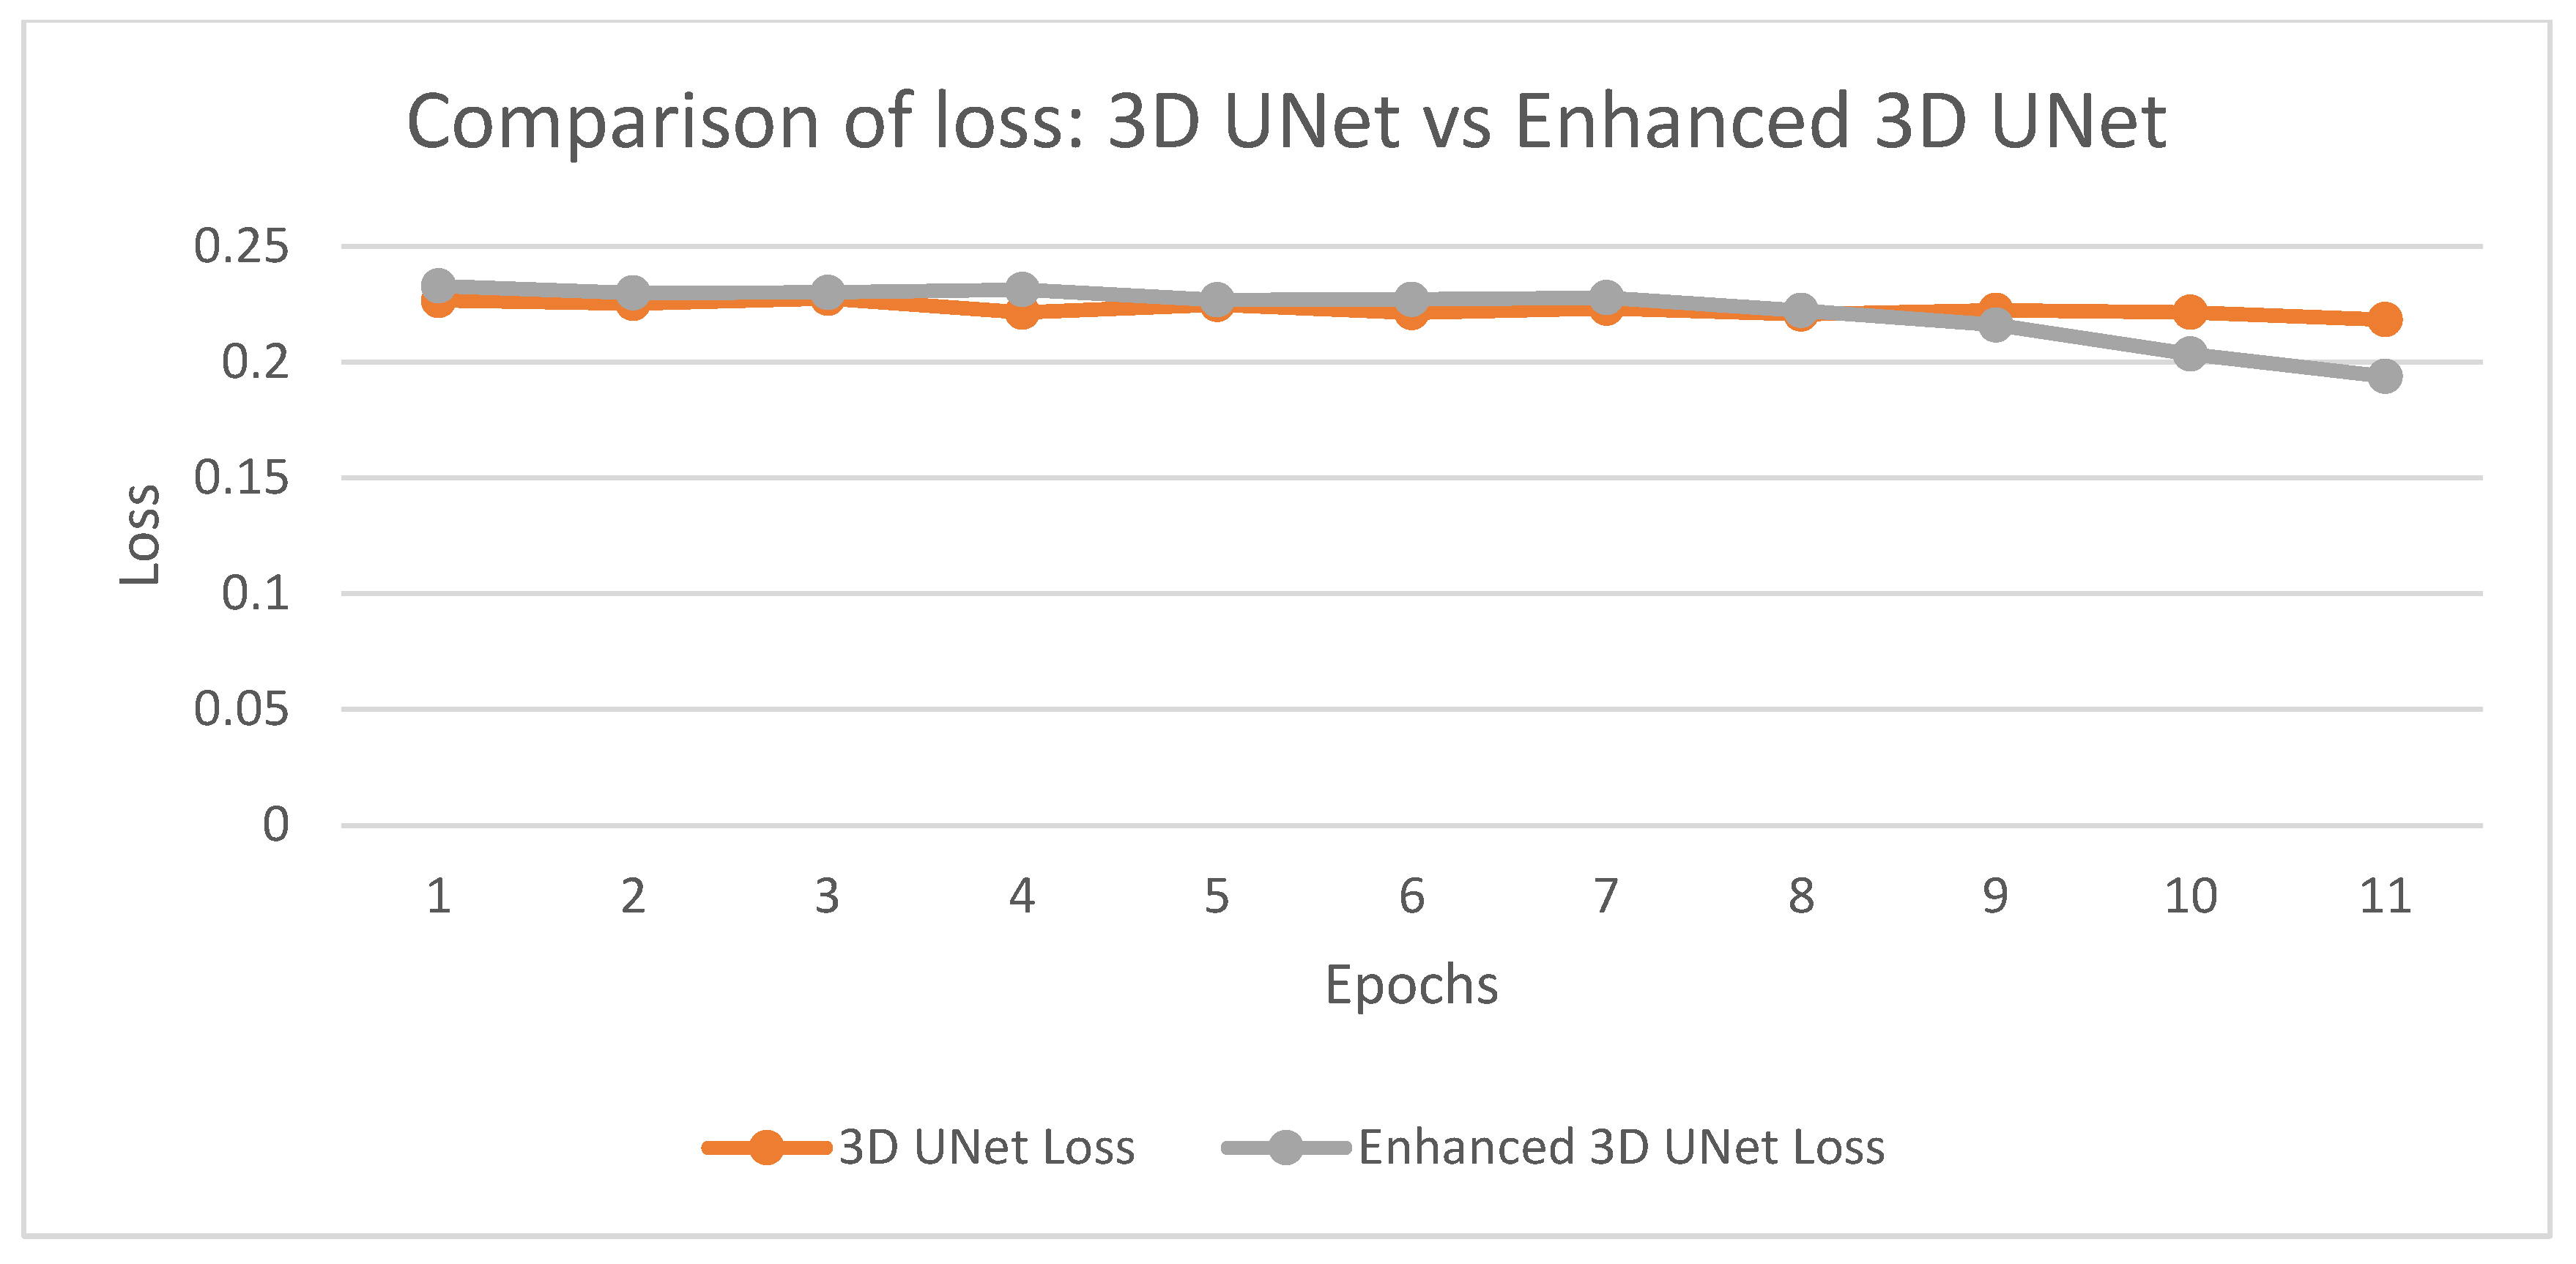
Figure 12: Comparison of loss: 3D UNet vs. enhanced 3D UNet.
4.2.1 Dice Similarity Coefficient (DSC)
Measures the overlap of the predicted segmentation with that of the ground truth. It measures the accuracy in the segmented regions. A higher DSC is, therefore, a better overlap between the predicted and that of the actual segmented region.
Predicted, and B is the ground truth. Its value of DSC being higher; then, it will be good overlap as well as perfectly 1 when completely matched. In the work, the DSC measure will be used while analyzing how well the model segmentates the coronary arteries of the CTA images especially about the regions with stenosis.
Precision measures the proportion of correctly predicted positive pixels, namely, the pixels correctly classed as belonging to the coronary arteries, out of the number of pixels predicted to belong to the class. Precisely, it can be calculated by the formula,
Recall, or Sensitivity, is the proportion of correctly classified pixels that are indeed positive. It is defined as:
This balances both of them. Being the harmonic mean of recall and precision, F1 measure can be derived as:
Very handy in a case where positive and negative pixels are almost out of balance, especially dealing with medical images like coronary arteries that would occupy a small percentage in the whole image. An F1 Score would really be high in cases with precision and recall which were balanced to lead up to an accurate segmentation with no important details left behind.
The accuracy measures exactly how well the classifier is performing while taking in the number of correctly labeled pixels as a proportion of total both for positive and negative pixels:
This measure is an average metric but may not well indicate where the classes are imbalanced, as they often are in the case of segmenting coronary arteries.
Table 1 shows that the Enhanced 3D U-Net outperforms the standard 3D U-Net on all evaluated metrics. The observed reduction in validation loss (11.69% lower) can be attributed to the deeper architecture and attention mechanisms of the Enhanced 3D U-Net, which improve feature extraction from complex coronary structures and reduce segmentation errors during training. The marginal gains in validation and test accuracy (0.01% improvement) reflect that both models achieve near-perfect classification of coronary artery pixels, but the Enhanced 3D U-Net provides slightly better generalization.
Table 1: Evaluation Metrics comparison of 3D UNet and Enhanced (3D UNet).
| Metric | Enhanced 3D UNet | 3D UNet | Improvement |
|---|---|---|---|
| Validation Loss | 0.1939 | 0.2196 | 11.69% |
| Validation Accuracy | 0.9994 | 0.9993 | 0.01% |
| Test Accuracy | 0.9994 | 0.9993 | 0.01% |
| Test Dice Score | 0.8539 | 0.8346 | 2.31% |
| Precision | 0.8418 | 0.8282 | 1.64% |
| Recall | 0.8289 | 0.8163 | 1.55% |
| F1 Score | 0.8397 | 0.8232 | 2.01% |
The improvement in the Dice score (2.32%) is particularly important, as it indicates better spatial overlap between predicted segmentations and ground truth. This is a direct result of the ensemble strategy, which combines the coarse anatomical context captured by the standard 3D U-Net with the fine detail extraction capabilities of the Enhanced 3D U-Net. Similarly, the gains in precision (1.64%) suggest that the proposed approach reduces false positives by focusing on vessel regions with high structural certainty, while the improvement in recall (1.55%) indicates that fewer relevant vessel pixels are missed, an essential factor for detecting stenosis in narrow or artifact-prone regions.
The higher F1 score (2.01%), balancing both precision and recall, reinforces the robustness of the proposed method, confirming that the combination of multi-scale segmentation, ensemble learning, and post-processing leads to more consistent and clinically reliable segmentation outputs. Overall, these results validate the design choices of the proposed hybrid framework, particularly the integration of dual-model segmentation, ensemble merging, and refinement stages, which together address the limitations identified in existing approaches.
In Fig. 13, the validation accuracy of the detection model is at 99.83% or implies a better general ability to make correct detections in most cases. Even though a low score was recorded on the Dice, F1 value, and other values-precision and recall of 0.8381 and 0.8023, respectively-by the value of 0.8502, 0.8157, respectively, all these imply the good performance of the model in correctly segmenting stenotic regions.
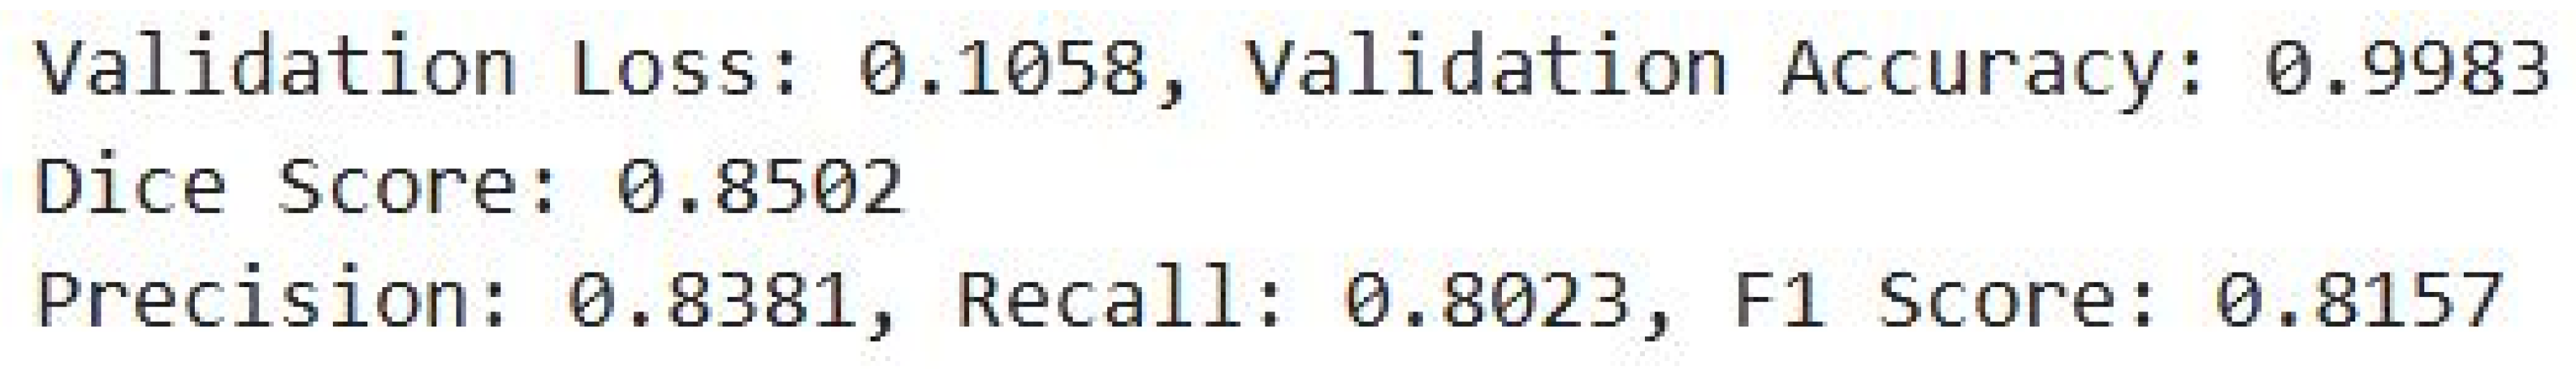
Figure 13: Evaluation metrics for stenosis detection.
This work presents a robust and innovative framework for the automated segmentation and stenosis detection of coronary arteries from 3D CTA images, integrating deep learning models and advanced post-processing techniques. The Simple 3D UNet provides efficient segmentation of the broader artery structures, while the Enhanced 3D UNet refines the segmentation, capturing finer anatomical details crucial for accurate diagnosis. The post-processing steps, including Connected Component Analysis, Centerline Extraction, and Plaque Segmentation Refinement, further enhance the segmented structures, enabling more precise and reliable stenosis detection. This combination of segmentation and post-processing techniques ensures that the system not only isolates coronary arteries effectively but also enhances the identification of regions of arterial narrowing, which is critical for assessing the severity of CAD.
The proposed approach achieved outstanding performance, with a test accuracy of 99.94%, a Dice similarity coefficient of 0.8539, a precision of 0.8418, a recall of 0.8289, and an F1 score of 0.8397 in coronary artery segmentation. For stenosis detection, the model attained a validation accuracy of 99.83%, precision of 0.8381, recall of 0.8023, and an F1 score of 0.8157. These results confirm that the ensemble of 3D U-Net and Enhanced 3D U-Net, combined with targeted post-processing, offers a highly reliable and clinically applicable solution.
The results underscore the potential of the system in improving the early diagnosis and management of CAD by reducing reliance on manual interpretation, improving diagnostic accuracy, and providing faster, more consistent results. Moreover, the system’s scalability, given its ability to process large datasets efficiently, highlights its utility in real-world clinical environments, making it a valuable tool for clinicians.
Despite strong performance, the proposed approach has several limitations. The models were trained and tested on specific datasets, and their generalizability across different imaging devices, patient populations, and clinical conditions requires further validation. Additionally, while post-processing improves result reliability, it increases computational complexity and processing time, which may affect real-time clinical applicability. Future work should validate the framework on more diverse clinical datasets and optimize the pipeline to improve efficiency and scalability.
This work demonstrates a reliable and clinically applicable AI solution for CAD diagnostics. It holds potential to improve early diagnosis, enhance workflow efficiency, and support real-world clinical decision-making.
Acknowledgement:
Funding Statement: The authors received no specific funding for this study.
Author Contributions: Conceptualization, methodology and supervision: Angelin Gladston; software and validation: Swedha Velraj; investigation, data curation and formal analysis: Harini Nadarajan; writing—original draft preparation: Swedha Velraj and Harini Nadarajan; writing—review and editing: Angelin Gladston, Swedha Velraj and Harini Nadarajan. All authors reviewed the results and approved the final version of the manuscript.
Availability of Data and Materials: The data that support the findings of this study are openly available in the ImageCAS dataset, accessible at https://www.kaggle.com/datasets/xiaoweixumedicalai/imagecas (accessed on 01 June 2025). Additional data and materials supporting the conclusions of this article are included within the manuscript. Researchers interested in further details can contact the corresponding author for access to any underlying data not publicly available.
Ethics Approval: Not applicable. This study does not involve human participants or animals and used only publicly available de-identified medical imaging datasets.
Conflicts of Interest: The authors declare no conflicts of interest to report regarding the present study.
References
1. Abuqaddom I , Mahafzah BA , Faris H . Oriented stochastic loss descent algorithm to train very deep multi-layer neural networks without vanishing gradients. Knowl Based Syst. 2021; 230: 107391. doi:10.1016/j.knosys.2021.107391. [Google Scholar] [CrossRef]
2. Chen Z , Liu R , Huang S , Guo Y , Ren Y . A survey of large-scale deep learning models in medicine and healthcare. Comput Model Eng Sci. 2025; 144( 1): 37– 81. doi:10.32604/cmes.2025.067809. [Google Scholar] [CrossRef]
3. Zeng A , Wu C , Lin G , Xie W , Hong J , Huang M , et al. ImageCAS: a large-scale dataset and benchmark for coronary artery segmentation based on computed tomography angiography images. Comput Med Imaging Graph. 2023; 109: 102287. doi:10.1016/j.compmedimag.2023.102287. [Google Scholar] [CrossRef]
4. Jin Y , Ye X , Feng N , Wang Z , Hei X , Liu J , et al. Lesion classification of coronary artery CTA images based on CBAM and transfer learning. IEEE Trans Instrum Meas. 2024; 73: 1– 14. doi:10.1109/tim.2024.3385035. [Google Scholar] [CrossRef]
5. Wu W , Zhang J , Xie H , Zhao Y , Zhang S , Gu L . Automatic detection of coronary artery stenosis by convolutional neural network with temporal constraint. Comput Biol Med. 2020; 118: 103657. doi:10.1016/j.compbiomed.2020.103657. [Google Scholar] [CrossRef]
6. Hong Y , Commandeur F , Cadet S , Goeller M , Doris M , Chen X , et al. Deep learning-based stenosis quantification from coronary CT angiography. In: Proceedings of the Medical Imaging 2019: Image Processing; 2019 Feb 16–21; San Diego, CA, USA. p. 88. doi:10.1117/12.2512168. [Google Scholar] [CrossRef]
7. Ovalle-Magallanes E , Avina-Cervantes JG , Cruz-Aceves I , Ruiz-Pinales J . Transfer learning for stenosis detection in X-ray coronary angiography. Mathematics. 2020; 8( 9): 1510. doi:10.3390/math8091510. [Google Scholar] [CrossRef]
8. Paul JF , Rohnean A , Giroussens H , Pressat-Laffouilhere T , Wong T . Evaluation of a deep learning model on coronary CT angiography for automatic stenosis detection. Diagn Interv Imag. 2022; 103( 6): 316– 23. doi:10.1016/j.diii.2022.01.004. [Google Scholar] [CrossRef]
9. Pang K , Ai D , Fang H , Fan J , Song H , Yang J . Stenosis-DetNet: sequence consistency-based stenosis detection for X-ray coronary angiography. Comput Med Imaging Graph. 2021; 89: 101900. doi:10.1016/j.compmedimag.2021.101900. [Google Scholar] [CrossRef]
10. Zreik M , van Hamersvelt RW , Wolterink JM , Leiner T , Viergever MA , Išgum I . A recurrent CNN for automatic detection and classification of coronary artery plaque and stenosis in coronary CT angiography. IEEE Trans Med Imag. 2019; 38( 7): 1588– 98. doi:10.1109/TMI.2018.2883807. [Google Scholar] [CrossRef]
11. Wang X , Leng S , Lu Z , Huang S , Lee BH , Baskaran L , et al. Context-aware deep network for coronary artery stenosis classification in coronary CT angiography. In: Proceedings of the 2023 45th Annual International Conference of the IEEE Engineering in Medicine & Biology Society (EMBC); 2023 Jul 24–27. Sydney, Australia. p. 1– 4. doi:10.1109/EMBC40787.2023.10340650. [Google Scholar] [CrossRef]
12. Suboh MZ , Jaafar R , Nayan NA , Hasmiza Harun N , Faizal Mohamad MS . Association of severe stenosis in coronary arteries with common demographic and clinical data among ischemic heart disease patients. In: Proceedings of the 2023 International Conference on Engineering Technology and Technopreneurship (ICE2T); 2023 Aug 15–16; Kuala Lumpur, Malaysia. p. 206– 10. doi:10.1109/ICE2T58637.2023.10540498. [Google Scholar] [CrossRef]
13. Zhang D , Yang G , Zhao S , Zhang Y , Ghista D , Zhang H , et al. Direct quantification of coronary artery stenosis through hierarchical attentive multi-view learning. IEEE Trans Med Imaging. 2020; 39( 12): 4322– 34. doi:10.1109/tmi.2020.3017275. [Google Scholar] [CrossRef]
14. Compas CB , Syeda-Mahmood T , McNeillie P , Beymer D . Automatic detection of coronary stenosis in X-ray angiography through spatio-temporal tracking. In: Proceedings of the 2014 IEEE 11th International Symposium on Biomedical Imaging (ISBI); 2014 Apr 29–May 2; Beijing, China. p. 1299– 302. doi:10.1109/ISBI.2014.6868115. [Google Scholar] [CrossRef]
15. Chi Y , Huang W , Zhou J , Toe KK , Zhang JM , Wong P , et al. Stenosis detection and quantification on cardiac CTCA using panoramic MIP of coronary arteries. In: Proceedings of the 2017 39th Annual International Conference of the IEEE Engineering in Medicine and Biology Society (EMBC); 2017 Jul 11–15; Jeju, Republic of Korea. p. 4191– 4. doi:10.1109/EMBC.2017.8037780. [Google Scholar] [CrossRef]
16. Zhou J , Huang W , Chi Y , Duan Y , Zhong L , Zhao X , et al. Quantification of coronary artery stenosis by area stenosis from cardiac CT angiography. In: Proceedings of the 2015 37th Annual International Conference of the IEEE Engineering in Medicine and Biology Society (EMBC); 2015 Aug 25–29; Milan, Italy. p. 695– 8. doi:10.1109/EMBC.2015.7318457. [Google Scholar] [CrossRef]
17. Alexey PZ , Alexey VB . Computer modeling of stress-strain state of the intact portion of the coronary artery with circular irregular stenosis. In: Proceedings of the 2015 International Conference on Biomedical Engineering and Computational Technologies (SIBIRCON); 2015 Oct 28–30; Novosibirsk, Russia. p. 176– 9. doi:10.1109/SIBIRCON.2015.7361877. [Google Scholar] [CrossRef]
18. Koroleva EA , Khapaev RS . The prevalence and risk factors of carotid artery stenosis in type 2 diabetic patients. In: Proceedings of the 2020 Cognitive Sciences, Genomics and Bioinformatics (CSGB); 2020 Jul 6–10; Novosibirsk, Russia. p. 253– 6. doi:10.1109/csgb51356.2020.9214707. [Google Scholar] [CrossRef]
19. Caruso MV , De Rosa S , Indolfi C , Fragomeni G . Computational analysis of stenosis geometry effects on right coronary hemodynamics. In: Proceedings of the 2015 37th Annual International Conference of the IEEE Engineering in Medicine and Biology Society (EMBC); 2015 Aug 25–29; Milan, Italy. p. 981– 4. doi:10.1109/EMBC.2015.7318528. [Google Scholar] [CrossRef]
20. Asakawa T , Shinoda H , Shimizu K , Nomura K , Aono M . Estimating degree of coronary artery stenosis severity from non-contrast CT images using CNN. In: Proceedings of the 2024 IEEE 37th International Symposium on Computer-Based Medical Systems (CBMS); 2024 Jun 26–28; Guadalajara, Mexico. p. 9– 14. doi:10.1109/CBMS61543.2024.00010. [Google Scholar] [CrossRef]
21. Ovalle-Magallanes E , Alvarado-Carrillo DE , Avina-Cervantes JG , Cruz-Aceves I , Ruiz-Pinales J , Correa R . Deep learning-based coronary stenosis detection in X-ray angiography images: overview and future trends. In: Artificial intelligence and machine learning for healthcare. Cham, Switzerland: Springer; 2022. p. 197– 223. doi:10.1007/978-3-031-11170-9_8. [Google Scholar] [CrossRef]
Cite This Article
 Copyright © 2025 The Author(s). Published by Tech Science Press.
This work is licensed under a Creative Commons Attribution 4.0 International License , which permits unrestricted use, distribution, and reproduction in any medium, provided the original work is properly cited.
 Downloads
 Citation Tools