
 Submit a Paper
 Propose a Special lssue
 Open Access
ARTICLE
Augmenting IoT Intrusion Detection System Performance Using Deep Neural Network
1 Department of Computer Science, Islamia College Peshawar, Peshawar, 25120, Pakistan
2 Department of Computer Science, CECOS University of IT and Emerging Sciences, Peshawar, 25000, Pakistan
3 Department of Electrical Engineering, HITEC University Taxila, Taxila, 47080, Pakistan
4 Computer Science Department, College of Computer and Information Sciences, Imam Mohammad Ibn Saud Islamic University (IMSIU), Riyadh, 11432, Saudi Arabia
5 DAAI Research Group, Department of Computing and Data Science, School of Computing and Digital Technology, Birmingham City University, Birmingham, B4 7XG, UK
* Corresponding Author: Muhammad Shoaib. Email:
Computers, Materials & Continua 2023, 74(1), 1351-1374. https://doi.org/10.32604/cmc.2023.030831
Received 02 April 2022; Accepted 15 June 2022; Issue published 22 September 2022
 View Full Text
 Download PDF
Abstract
Due to their low power consumption and limited computing power, Internet of Things (IoT) devices are difficult to secure. Moreover, the rapid growth of IoT devices in homes increases the risk of cyber-attacks. Intrusion detection systems (IDS) are commonly employed to prevent cyberattacks. These systems detect incoming attacks and instantly notify users to allow for the implementation of appropriate countermeasures. Attempts have been made in the past to detect new attacks using machine learning and deep learning techniques, however, these efforts have been unsuccessful. In this paper, we propose two deep learning models to automatically detect various types of intrusion attacks in IoT networks. Specifically, we experimentally evaluate the use of two Convolutional Neural Networks (CNN) to detect nine distinct types of attacks listed in the NF-UNSW-NB15-v2 dataset. To accomplish this goal, the network stream data were initially converted to two-dimensional images, which were then used to train the neural network models. We also propose two baseline models to demonstrate the performance of the proposed models. Generally, both models achieve high accuracy in detecting the majority of these nine attacks.Keywords
As the Internet of Things (IoT) has grown in popularity in our daily lives [1], it is a research and industrial trend in the field of Information and Communication Technologies (ICT) that has grown accustomed to being a part of technological advancements in our daily lives. The IoT is a new communication paradigm that refers to devices having the sensors and the actuators that can be used as objects or they are the “things,” that sense their surroundings, communicates with each other, and exchange data though the Internet [2]. The IoT requires the platform’s development upon which all the products, applications & services can be connected for capturing, communicating, storing, accessing, and sharing/transferring data from real world [3,4]. Around 50.0 billion IoT devices are currently connected to Internet, and the number is still expected for growing exponentially in the coming years [5,6]. Numerous applications can benefit from the massive amounts of data generated by such a large number of connected devices. Numerous IoT application scenarios exist, including those involving food and agriculture (including smart farming), demography, assisted living, e-health, and augmented learning, to name a few. By 2025, for example, there will be 15.3 billion IoT devices in use for smart agriculture [7,8]. Numerous industrial sectors and this is true across all industries, require a large no. of sensors & the actuators for real-time & environmental monitoring so that it can provide the insights that are actionable and also can make timely decisions [9].
Despite this, there are numerous impediments to the IoT widespread adoption in research and industry. Security and trust, reliability, scalability, and portability are just a few of the issues that can cause problems. The IoT introduces a wide variety of potential security threats due to their connection to the global Internet via immature and insecure communication protocols and applications [3,4]. A cyberattack could use unauthorized access to IoT-based applications to introduce anomalies and cause them to make incorrect control decisions, potentially wreaking havoc on people’s lives and property, as well as the economy [7,10]. The sophistication of threats to the IoT ecosystem is increasing, and cyber-attacks pose a significant threat to the ecosystem. To compound matters, IoT devices rely on various platforms and network connectivity protocols (such as Ethernet, Wi-Fi, ZigBee, and wired-based technologies) to achieve connectivity. Multiple standards and protocols must be coordinated in order to reduce security threats. The heterogeneous & distributed nature of IoT applications adds to the complexity of IoT networks & thus increasing the likelihood of security breaches in the IoT environment as a result of the various technologies utilized by IoT industry. Numerous security issues and cyber-attacks on IoT networks result from these disadvantages. Accurate anomaly detection IDS models are therefore critical for the success of IoT applications. Numerous IDS have been proposed to safeguard IoT devices from cyber criminals [11–13].
Active security measures and passive security measures are the two types of security solutions that can be implemented. Taking proactive measures to defend against external threats can effectively protect the IoT. Although active security measures are in place, there is a high risk of intrusion because the IoT is connected to the global Internet. IDS are used as a second line of defense and can detect and prevent a wide range of cyberattacks and other threats. A large number of IDS solutions have been proposed [14–16], and IDS solutions have received a great deal of attention from researchers and industry in the context of the IoT. In terms of the methods used to detect them, IDS solutions can be divided into three categories: signature IDS models, anomaly IDS models, and hybrid IDS models, among others. As a general rule, signature-based approaches are more effective against known attacks, whereas anomaly-based approaches are more effective against unidentified attacks. It is inefficient and unproductive to employ traditional signature-based techniques since they demand constant human intervention and expertise for extract attacking patterns and patterns to updating the IDS models [17,18]. This has occurred as a result of the heterogeneity, dynamic nature, and complexity of IoT networks. Using anomaly-based intrusion detection systems in the IoT has several advantages, including detecting zero-day attacks and the need for less manual intervention [18]. In hybrid approaches, signature-based approaches are combined with anomaly-based approaches to provide a complete picture. The use of signature-based intrusion detection systems in the IoT networks, on the other hand, is restricted due to the impracticality of relying on predefined attack patterns (signature-based) for intrusion detection in the networks of IoT [16–18].
Anomaly intrusion detection systems, which are critical components of intrusion detection in IoT environments, are essential in combating this threat. The vast majority of existing IDSs develop detection models using traditional machine learning techniques [19], described in more detail below. Machine learning techniques are frequently used in developing IDS models, and they are particularly effective. When it comes to extracting representative features from the big and unstructured data generated by IoT devices, however, the speed and volume of IoT devices necessitate extensive research efforts. As a result of the large amount of unstructured data generated by IoT devices, traditional machine learning techniques, which require elaborate feature engineering, will necessitate extensive research efforts to extract representative features from the data. Therefore, traditional machine learning-based solutions continue to encounter several challenges when putting them into practice. During the past several years, deep learning (DL) techniques have become increasingly popular in IDSs, particularly in the military. In order to extract relevant information from rapidly changing and real-time data streams, DL accelerates the analysis of fast and real-time data streams to predict the future of the IoT.
In general, digital learning is seen as more trustworthy and accurate than conventional learning since it is easier to extract information and so delivers superior accuracy [20]. As a result of its ease of use and higher degree of accuracy in extracting data, digital learning is used. Therefore, the application of DL techniques in areas such as anomaly and malware detection has been the focus of some research, with the results still inconclusive. DL techniques have been applied to problems that fall under 2 different perspectives, namely, technical & regulatory, in anomaly & malware detection. Most IDS systems have been built using existing computer networks, wireless sensor networks, and self-organizing mobile networks, among other sources. However, while the IDS proposed for these networks is suitable for IoT applications, the unique characteristics of IoT-based networks, such as connectivity to the global Internet and the use of lightweight resources, render it ineffective for IoT applications [11,12]. Only a few studies have been conducted in the IoT domain specifically focused on DL techniques [21]. Deep learning-based IDSs haven’t been specifically studied, as far as the authors know, in IoT security research. Consequently, the aim of this study is to fill up this gap and investigate how decentralized techniques may be used most effectively and efficiently in IoT environments. This review, which employs DL techniques to discover robust anomaly-based intrusion detection systems, provides an in-depth, focused, and high-quality analysis that will guide future research in the field of IDS.
We proposed two novel Deep Convolutional Neural Network (DCNN) methods for the detection of various malicious and benign intrusion attacks in a IoT networks. We improved the performance of an automatic intrusion detection and reduced the computational power which may be helpful for low power IoT devices in the network. We identified the subcategory of cyberattacks in the IoT networks. We performed a comparison of two custom created DCNN model in term of accuracy and efficiency the proposed scheme with other DL and traditional Machine Learning (ML) techniques. Unlike many previous works we use a modern dataset that is using new standard feature set for network intrusion detection system datasets. In this manuscript, we use a small convolutional neural network that can fit on IoT devices whereas prior work using CNNs have not been specifically aimed at IoT.
The information industry’s software and hardware systems are protected from external threats by security, an essential and integral component of the sector. As the amount of new data generated on the Internet continues to grow, the importance of data security to a business’s success grows.
2.1 Internet of Things Security
The Internet of Things is not a centralized system core architecture (IoT). The IoT has created a new ecosystem of connected devices and smart cities, breaking away from traditional centralized system core architectures [22]. It is now an essential part of the smart city infrastructure. By using embedded device networks or other wireless methods, anyone with an internet connection can access massive amounts of sensitive and private data in the future [23]. The IoT has many advantages for users, service providers, and businesses, but it also has many drawbacks.
An embedded system communicates via a protocol that varies by device and application, unlike a traditional network system. There is currently no centralized and uniform framework for developing security measures. This increases security risks associated with IoT networks as data volume increases [24]. Most network attacks and anomalous behavior involve malicious code, trojan horses, hackers, and viruses. These are the most common and destructive malicious objects. Device theft, device manipulation, identity theft, and eavesdropping [25] are all serious threats to IoT networks. When the IoT is compromised, it affects both people’s lives and data integrity. For example, hackers can hack a person’s fitness tracker or IoT-based perimeter defense system, gaining unauthorized access to sensitive workplace areas like Information Technology (IT) infrastructure. Also, IoT flaws make it easier for hackers to access sensitive data and systems. The device can authenticate and encrypt data before transmission and exchange to prevent unauthorized access. Encryption prevents hackers from gaining access to data even if they steal it. A device that cannot be manipulated avoids the autonomous control trap [26].
Signed coding certificates serve as digital signatures to ensure that only authenticated code is executed and that only the editor can break or change the code. Due to encryption, IoT devices often run on different platforms [27]. By 2020, over a billion devices and servers will be online, giving hackers an infinite number of new attack vectors to profit from. Without centralized control, the only way to protect these devices is to protect them at the factory. Because cloud servers are the primary traffic conduit for the IoT, they must act as a secondary perimeter defense. Existing cloud security regulations can be tailored to the IoT environment [28], allowing for the most efficient implementation. The use of Deep Learning (DL) methods such as Deep Reinforcement Learning (DBN) has accelerated the development of IDSs for IoT servers [29].
Network traffic identification is critical to network security because it alerts when an intrusion is detected. Traditional detection systems become ineffective as traffic packets and users grow. Port detection is another long-used technique. The basic Hyper Text Transfer Protocol (HTTP) does not perform well due to the system’s limited protocol set compared to other systems worldwide. Other system applications use the signature mode approach to deliver specific payloads. [30] Remember that this strategy can be used in a wide range of situations. Many machine learning algorithms have been proposed for traffic recognition, each with its own set of benefits and drawbacks. Traditional traffic recognition and classification algorithms like plain Bayes [31], random forests [32], and decision trees [33] have long been used. In their work, Yang et al. [34] used Restricted Boltzmann Machine (RBM) and Support Vector Machine (SVM) to detect and identify network traffic. However, machine learning has enabled the development of more sophisticated methods for analyzing security issues. The researchers say there are numerous ways to apply DL to cybersecurity. A recent study found that hybrid methodologies were used to create IDSs. Various DL methods are used in the overall process, which is divided into three categories. [34] The method has been used to detect numerous malicious anomalies in network traffic. The method uses a variety of statistical techniques to process network data computations. This is done by observing how the system’s neutral points interact. To detect network security anomalies, a variety of network security variables must be evaluated.
2.2 Factors in Intrusion Detection
When an IDS attempts to detect a system intrusion, it must first distinguish between normal data and system anomalies. Thus, the IDS should detect malicious data characteristics. The classification system must also accurately distinguish between the two information sets for normal and abnormal data. The system uses a network-specific code to calculate distance between nodes automatically [35]. This technique’s use is predicated on the following fundamental assumption: A distance between two nodes’ consistency is used to estimate data integrity and normality [36]. As a result, a large distance between nodes indicates anomalous data, which is a red flag. The Manhattan distance can be calculated in two ways: by using the cumulative network size distance or by using the Euclidean distance, which focuses on calculating the vector size. Manhattan Distance is used to calculate the distance between two points in a network. Another issue is sample integrity, which is used to detect anomalies in samples (also known as ordinary poisoning). The output of the feature extraction functions is critical in unsupervised DL because it determines the overall learning outcome. As a result, the method should protect normal data while allowing for continuous self-defense. Manipulation of a network includes adding traffic and performing information operations [37].
2.3 Traditional Detection Methods
Machine learning, on the other hand, can be used to detect malicious anomalies in a network, which is particularly useful for catching hackers. [38] Automatic dimensionality reduction (ADR) is a video streaming technique that uses both the encoder and decoder to reduce dimensionality. There are three more layers: an input layer, an output layer, and a hidden layer. Autoencoders also use pre-training, deployment, and fine-tuning. All of this is done by professionals in a controlled setting. Deep belief networks (DBNs) [39] are also significant because they combine unsupervised RBM and supervised backpropagation network layers, and are considered traditional DL methods. Unsupervised RBM and supervised backpropagation network layers are combined in deep belief networks (DBNs) [39]. Unsupervised RBM processing and supervised RBM processing are two DBN approaches. These two techniques were combined to create a hybrid anomaly detection system. This method’s dimensionality reduction is achieved by separating vectors using autoencoder algorithms [40]. As a result, DL systems classify data collected by DBN systems. In conclusion, hybrid systems have less time-related complexity and more detection accuracy. Studies show that protocol identification threatens traditional detection methods, even though over one-eighth of all network traffic is unidentifiable. [41] A system that uses probabilistic operations on unknown flows, such as DL, is more accurate.
2.4 Sequential Detection Method
The language model represents the probability distribution of the word sequence being evaluated in Natural Language Processing (NLP) tasks. The RNN-based language model is widely used in NLP, but it can also be used with other sequential data types. Sequential data, like system routines, network load, and programme code, dominates the cyberspace security domain. As in sequence modelling, the vanishing and exploding gradient of basic RNN models is unstable. Several relevant papers and experiments have used the Long Short-Term Memory (LSTM) model [42]. Because it depicts the interaction between programme and system kernel, system routine sequence data is the most useful and accurate data to have. Real-time traces of the system routine are easy to obtain for data acquisition [43]. In addition, the system routines sequence corresponds to the system’s language. The system routine and its sequence are compared to natural language words and sentences. Using this data, we can determine if the system is out of sync. To forecast anomalies, the sequential model’s backend uses an ensemble of thresholding classifiers to model the system’s normal sequence in language. The language model can estimate a system’s sequence’s probability distribution. The data is fed into the model using a one-hot encoding form [44]. During the training phase, the Backpropagation Through Time (BPTT) algorithm [45] provides standard samples. The back-end classifiers are Neural Network (NN) and k-means models [46]. A web shell takes more steps to detect than a backdoor. The first step is to convert PHP (Hypertext Preprocessor) files to opcodes using Vulcan Logic Disassembler (VLD). The Bag of Word (BOW) model can then decode the opcode. The final step is to feed the sequence into the language model.
This section discusses how the intrusion detection dataset i.e., NF-UNSW-NB15-v2 presented in the paper and how the same was used to develop DL models to detect/identify and classify cyberattacks. Details of our categorization studies and neural network model utilized for testing are described in great depth. Additionally, we discuss classification experiments more broadly.
The Cyber Range Lab at the Australian Centre for Cyber Security (ACCS) published the dataset in 2015. According to the researchers at the Australian Centre for Cyber Security, it is one of the most extensively utilized NIDS datasets on the market (ACCS). Additional 12 features were created by matching the Argus and Bro-IDS datasets to each other and extracting 35 features [47]. Network traffic generated by the IXIA PerfectStorm tools and captured as pcap files are also included. By comparing the NF-UNSW-NB15-v2 dataset to the UNSWNB15 dataset, we were able to create a new dataset called the NF-UNSW-NB15-v2, which was developed utilising 43 NetFlow characteristics retrieved from the nProbe pcap file as criteria. The NF-UNSW-NB15-v2 dataset is a newly created dataset that is based on the UNSWNB15 dataset but includes extra information. The IoT data is preprocessed by converting it to RGB images using the short-term fast Fourier transform method, the resolution of the constructed RGB image is 256 × 256 24 bit image with are saved in .png file format. As a result, this dataset [48] was chosen, and the results demonstrated that using this new dataset resulted in significant improvements in multi-class classification and reduced prediction times.
After data is collected, it must be pre-processed before being used to train our model, which is the next step after data collection. Cleaning the data, transforming it, splitting it into training and testing sets, and creating image representations are all steps in a five-step process. A Comma Separated Values (CSV) file containing 43 NetFlow functions, each with an attack category and a malicious or not label. After cleanup, we have a dataset with 37 features Tabs. 1 and 9 classes Fig. 1. For speed, we used only 40% of the dataset. Hierarchical split ensured equal distribution of attacks. After the image conversion, we needed to split the dataset into training (60%) testing (20%) and validation (20%) sets. Each attack in each dataset is represented hierarchically. A total of 560927 training, validation, and test samples were used. In general, large datasets are trained with 3-way holdout because high variance is less of an issue than small datasets [49]. Because our dataset is not image-based, we used the same method as Nguyen et al. [50]. Fig. 2 shows the three steps. Our data are normalised using min-max scaling Eq. (3.1). Padding ensures the array is the right size. An 8-bit integer is created by multiplying 255 by a colour map. Color maps help DoS (Denial-of-Service) attacks and malware improve CNN images [51,52]. The Eq. (3.1) is used to normalized the IoT data which is used for model training and validation, the variable x represent a features of an attribute while the max(x) is the maximum value in that attribute and min(x) is the minimum value in the selected attributed used for normalizing an entire attributes values in a dataset.

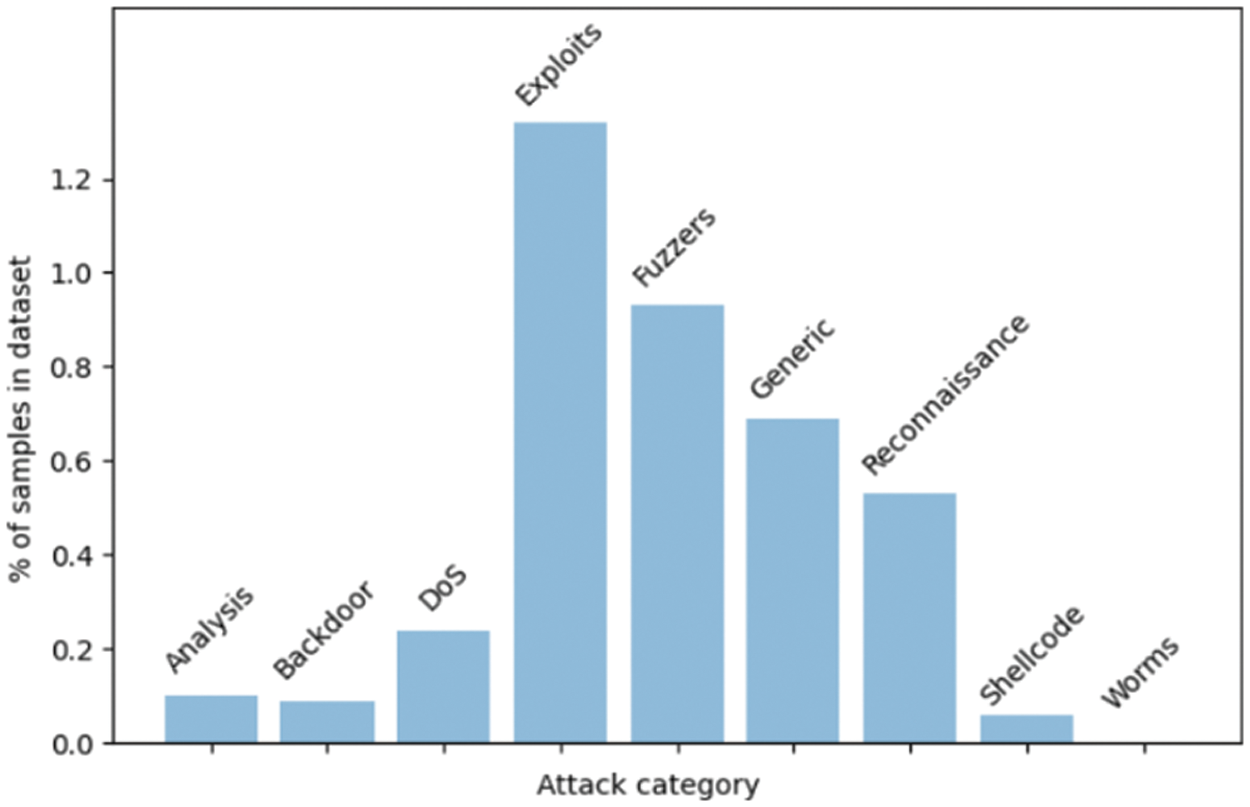
Figure 1: Frequency of instances by class distribution using the histogram method
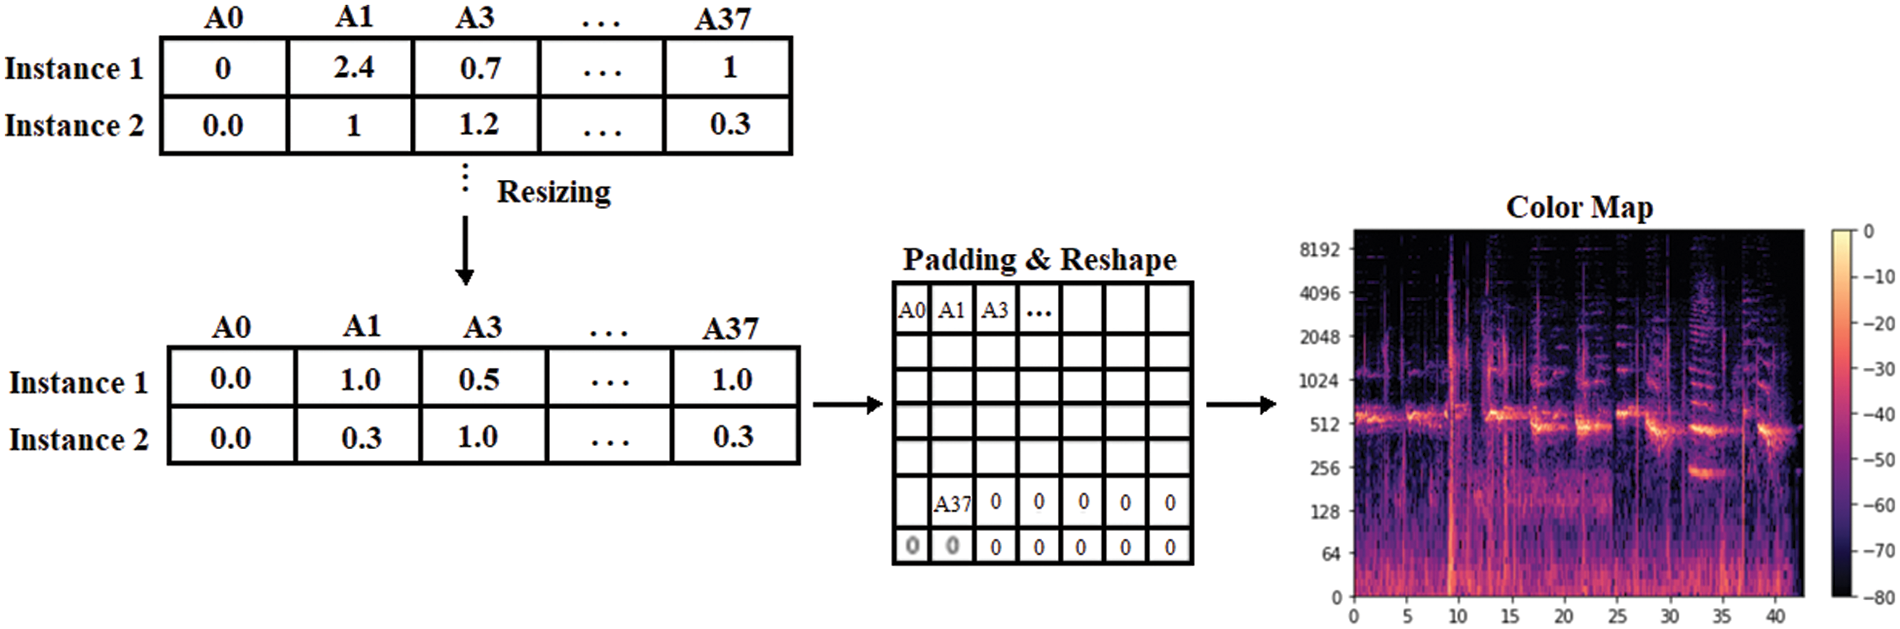
Figure 2: The process of creatin g a 2D RGB image
Fig. 3a shows three convolutional modules, followed by two fully connected layers and a softmax activation layer, which modifies the basic CNN structure slightly from what is shown. IoT and Android malware [53,54] can be categorized using similar smaller models, as well as other types of malware [55]. Given that this network will be used for comparison purposes, it bears little resemblance to the basic CNN structure that will serve as the investigation’s starting point. There are three layers total: a 3 × 3 convolution layer, a batch normalization layer, and a max-pooling layer (
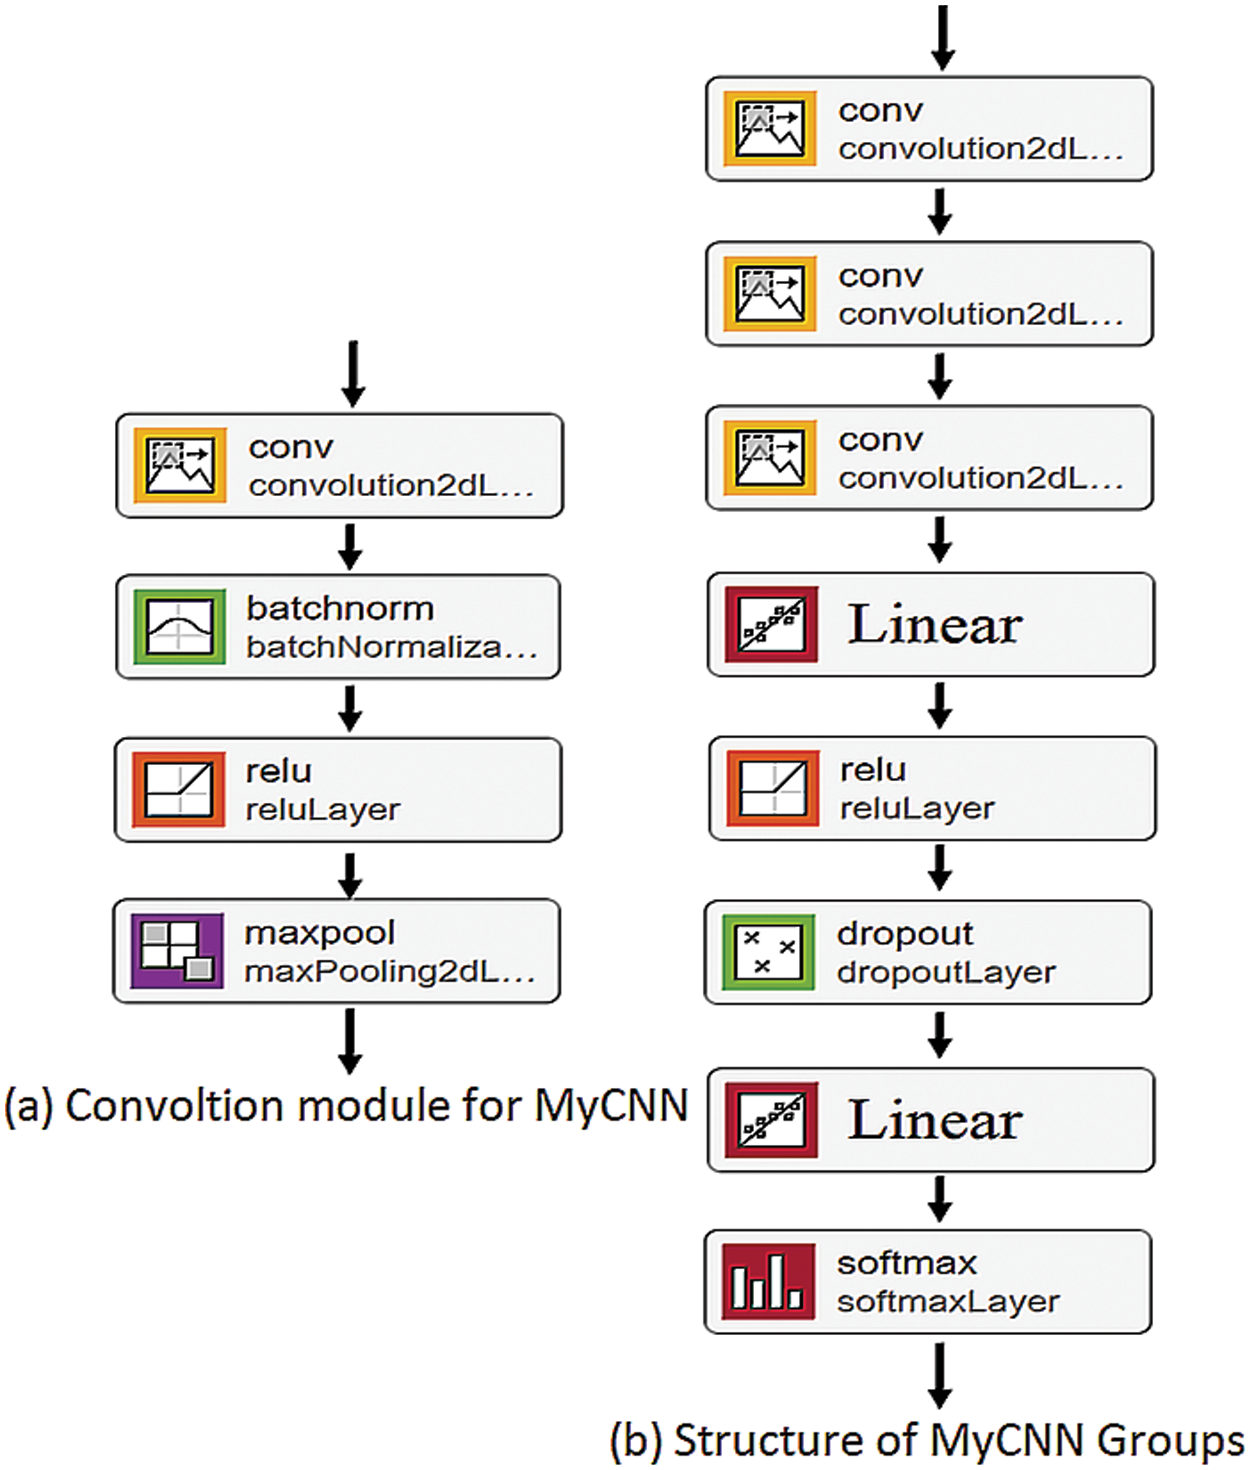
Figure 3: MyCNN architecture
While the standard 3 × 3 convolution is a good starting point for most applications, T. Lawrence and L. Zhang developed our second model, IoTCNN, for resource-constrained environments such as IoT devices. Convolutional modules (blocks) and groups (multiple blocks) make up the network structure instead of the standard 3 × 3 convolution [56]. Fig. 4 illustrates a hierarchical organization of blocks, with each block incorporating batch normalization, an activator for the ReLU, and a jump connection to the next block in the hierarchy. The network structure is more fully illustrated in Fig. 4b; to control the network’s width the first
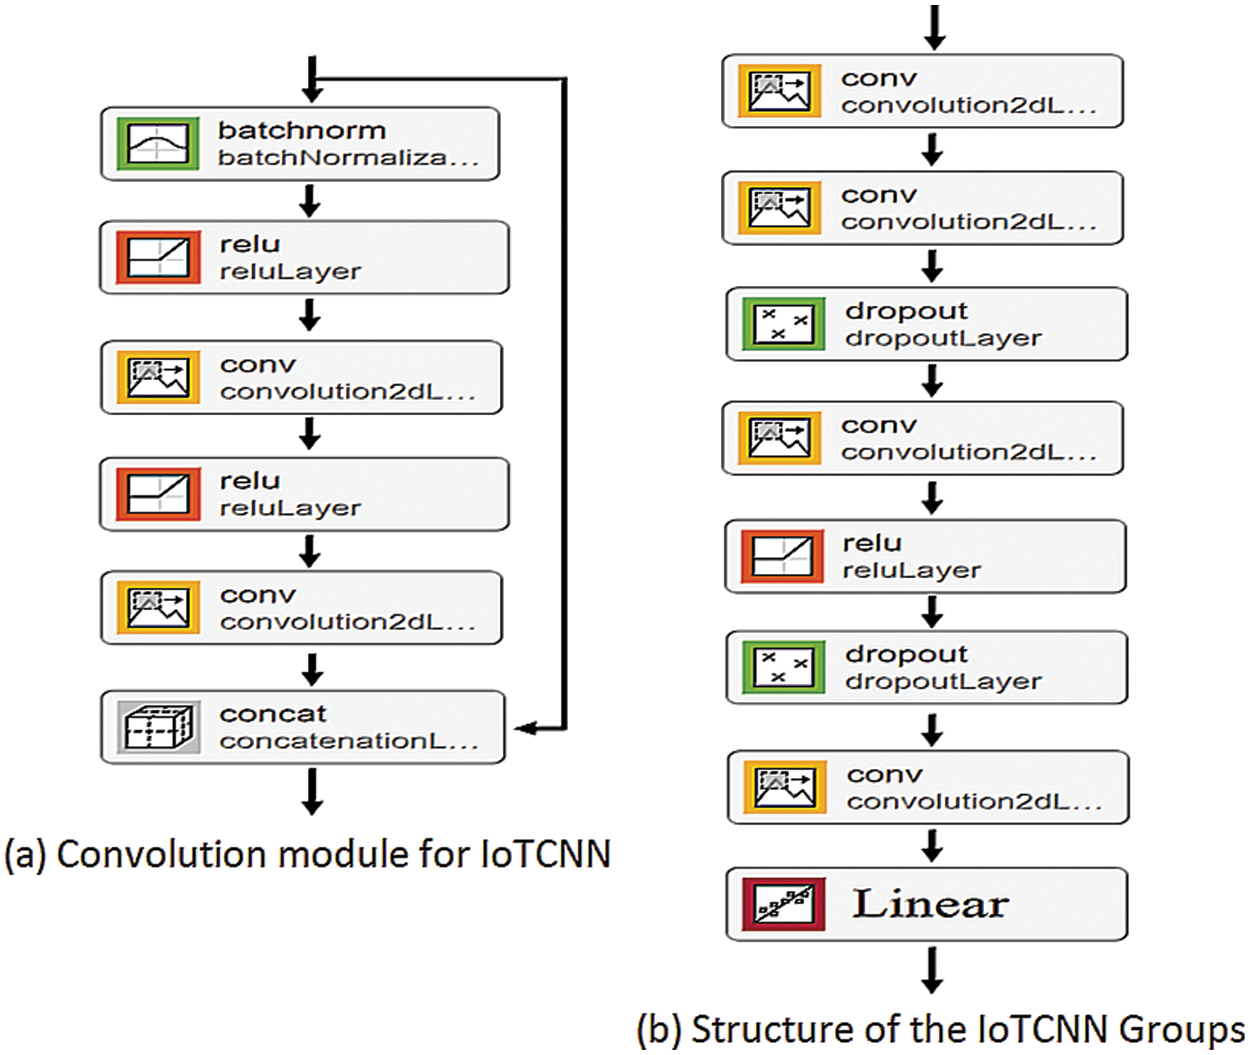
Figure 4: IoTCNN architecture
For training classifiers on unbalanced datasets, we implemented a number of different techniques, all of which are described in this section. The testing hardware and methods used to select hyperparameters are also described here. It also describes how we selected the hyperparameters that were used for testing.
We trained four neural networks concurrently without experiencing any lag when using hardware rented from vast.ai, a service that delivers docker instances over peer-to-peer hardware for rental aggregate. We trained four neural networks concurrently using rented hardware with no lag.
• HP Z-440 Intel® Xeon® Processor E5-2697 v3 CPU @2.90Ghz
• Nvidia RTX 2070 Super 8 GB GPU
• 47 GB of DDR4 RAM
Our research focused on two hyperparameters: learning rate and batch size. We deemed these two parameters crucial. In the end, the models with the least validation loss had the best performance. We used this data to calculate our hyperparameters. The learning rate was set to 0.01, 0.001, 0.0001, and 0.00001 to allow the model to converge as quickly as possible without returning a worse solution. Our tests show that when the learning rate is greater than 0.0001, the model achieve to learn and produces useful results, instead classifying all samples into the same category. Because a learning rate of 0.00001 gives significant results for 50 epochs, we used 0.00005 to get a good balance of performance and efficiency. Consider the number of samples used to train the network in each iteration when determining batch size. This determines the length of training and the model’s generalization ability. According to S. Keskar and coworkers, using large data sets reduces the generalization ability of models [51,58,59]. As a result, big data models lose generalizability. Using larger batch sizes than 128 rather than 32, 64, and 128 can significantly reduce training time per epoch. As a result, we chose 128 for training because we are working with small images and each batch does not require a lot of graphics card RAM. Small images and low-memory batches are the main reasons.
We sample our dataset using weighted random sampling and the official Pytorch implementation of this sampler. We assign a weight to each sample in the dataset we are sampling using this sampler. Eq. (3.2) [60] is used to calculate the weight of a class, where x denotes the class being weighed. We will use Eq. (3.2) to calculate the class weight, where x denotes the class [61]. The training weights are listed in Tab. 2, and they effectively undersample the majority of our classes (for example, benign) while oversampling a few (for example, malignant) (e.g., worms).

Our loss function is the cross-entropy loss (CELoss), which is commonly utilised in CNNs and is frequently employed in conjunction with softmax activation. The cross-entropy loss, which is perhaps the most often used loss function for CNNs, is also evaluated to see how adding weights to each class affects the loss function in conjugation. The network will try to avoid misclassifying classes with higher weights by adding weights. In order to rebalance the loss, people developed a second loss function known as class balance loss. To determine the type of loss, there are three hyperparameters that control the loss function: softmax, sigmoid, focuses of the loss type,
In our studies, we use the NF-UNSW-NB15-v2 dataset to train and evaluate two distinct CNN models for multiclass classification, each with four possible configurations. We train 100 epochs for each model after picking hyperparameters, store the parameters when the validation loss lowers, and then test using the model with the best validation loss. The Adam optimizer [60], one of the most extensively used neural network training optimizer, is employed during the training process. Additionally, we used I. Loshchilov and F. Hutter’s decoupled weight decay regularisation with a factor of 0.0005, which has been shown to improve generalisation performance when employing Adam [64]. Tabs. 3 and 4 detail the test parameters utilized for each model.


There were 100 epochs of training and validation datasets that were pre-segmented. A neural network’s training and validation results are its loss on the training set and validation sets as well, on its validation accuracy, and on its average training time.
On the graph in Fig. 5, the dashed line represents the model’s training loss, while the solid line depicts its validation loss over time. If the network is under or overfitted, the correlation between validation and training losses can be used to determine its performance. Underfitting occurs when the validation loss is less than or equal to the training loss, while overfitting occurs when this difference is bigger. All trained models after epoch 20, experience a quick decrease in loss as early in training in a closer examination of Fig. 5a. The only models in which the training loss decreases significantly over time are MyCNN Sampler and MyCNN CELoss, but because the validation loss does not decrease at the same rate, this could indicate overfitting the training set. In comparison to the other models, CBLoss has a lesser loss since it classifies attacks into fewer categories. As demonstrated in Tab. 5, the difference in loss between the IoTCNN and MyCNN models during training is bigger than the difference in loss between the MyCNN models.

Figure 5: Classification model training and validation loss plots

The validation accuracy of the model is shown in Fig. 6, and we can see that it varies more than the full range of training and validation losses. Both MyCNN and IoTCNN can achieve accuracies of close to 99 percent at their peak, which is similar to the losses we see, with most of the improvement occurring in the first 20 periods. MyCNN’s resampling accuracy is lower than the other methods, whereas IoTCNN’s accuracy is comparable to the other high-performing methods. When using class balance loss, the accuracy of the two networks differs, with MyCNN’s validation accuracy erratic and IoTCNN’s validation accuracy consistent at 0.01 percent. It is worth noting that 182,282 out of 186,976 samples are benign, or 97.49 percent, implying that classifiers that overfit to most classes will have that accuracy, implying that accuracy is not all the time a good measure for unbalanced datasets. IoTCNN takes more time to train than MyCNN because of its usage of more convolutional layers, as seen in Tab. 6. When using weighted CELoss or CBLoss for any of the four networks, we see no increase in time, but we see an increase in time when using resampling due to oversampling and undersampling.
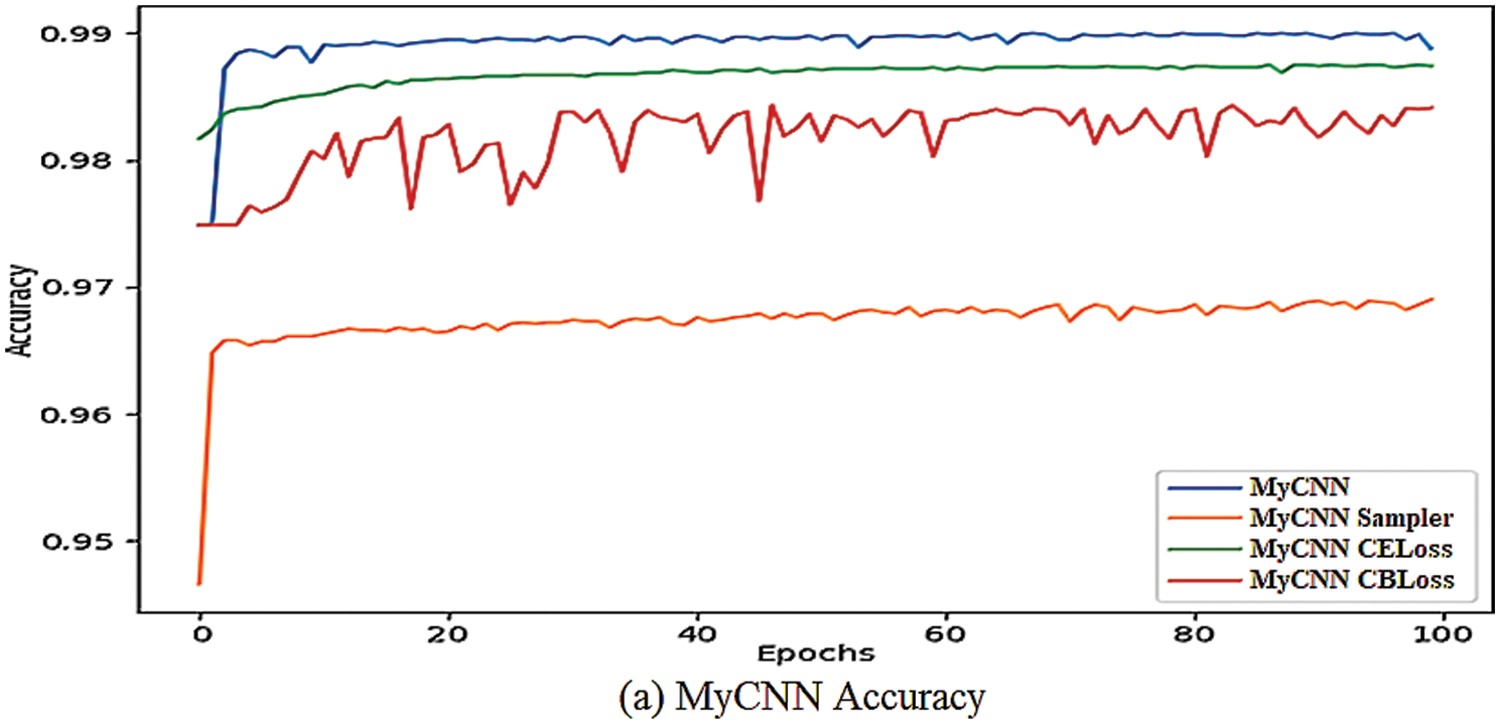
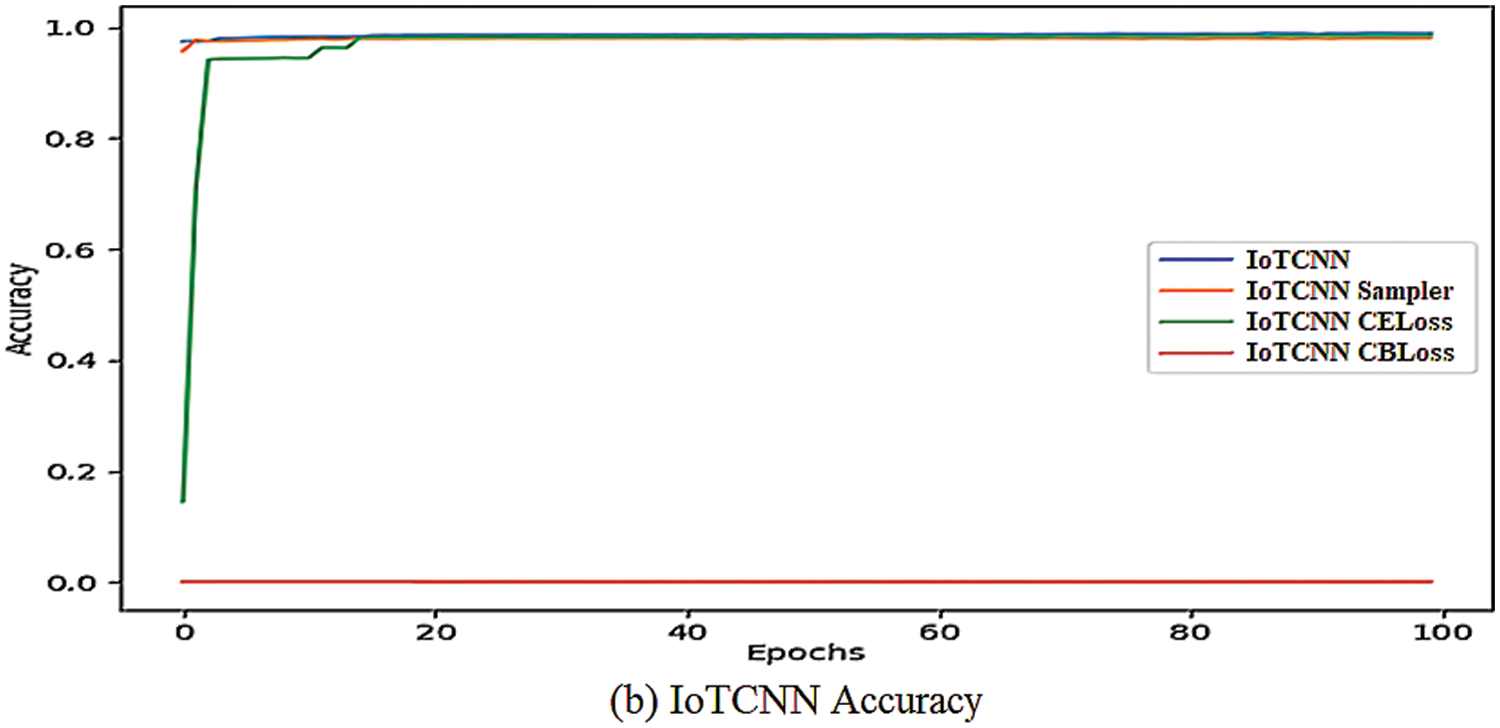
Figure 6: Validation accuracy plots of proposed CNN models

It took roughly 42 h to train all 8 models because we could only train four models at a time, resulting in a training round lasting more than 10 h each time.
The models with the lowest validation loss were selected to evaluate the classification capabilities of our models, and they were then used to classify the test samples. A confusion matrix is used to display and assess the classifying results for each model. In addition, we calculated generic metrics that measure the performance of each type of abnormality detection using the values in the matrix to determine the best model for each neural network. The proportion of correct predictions in all samples is called accuracy. The proportion of true positives to all positives is known as precision. F1 Score, the sum of precision and recall, is the proportion of correct predictions across all relevant samples.
The confusion matrix in Tab. 7 shows the MyCNN trained on an imbalanced dataset and how all samples are sorted into the three biggest classes using the conventional cross-entropy loss. The analysis has been misclassified as secure because many attack samples were classified benign. In terms of recall, the model has an 88.9 percent use rate for the vulnerabilities it categorizes.

Although like MyCNN, IoTCNN only categorizes samples into the largest category, unlike MyCNN, fewer malicious samples are wrongly categorized as benign. In comparison to MyCNN, the fuzzifier has dropped from 91.60 percent to 79.84 percent in the recall.
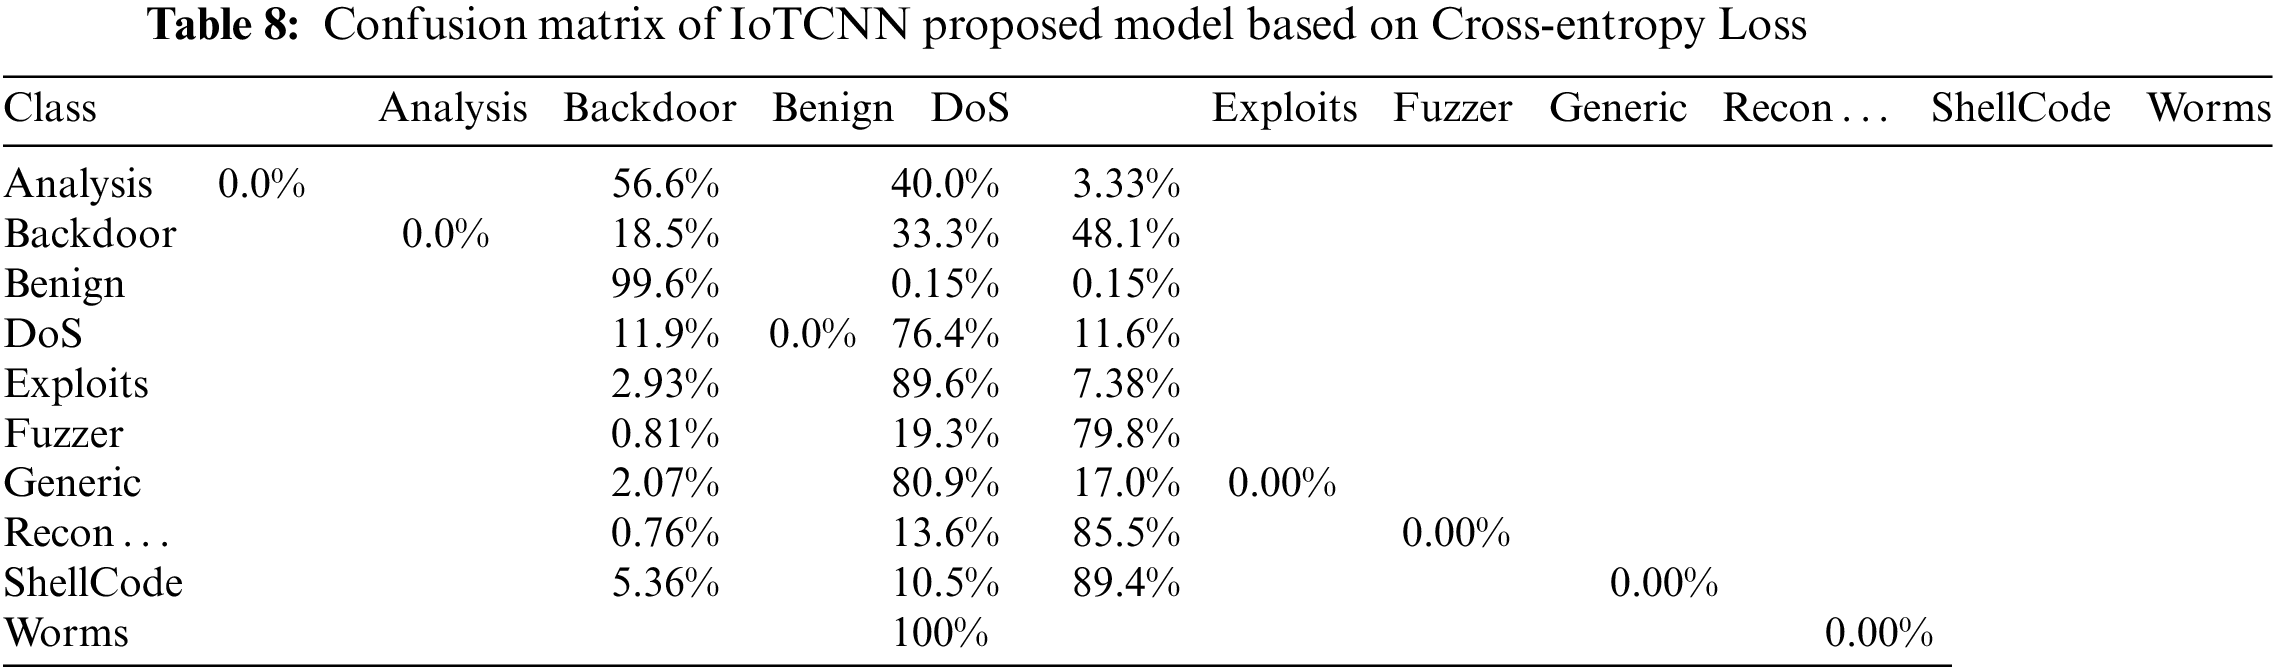
Tab. 8 depict the confusion matrix of proposed IoTCNN classifier trained using the cross-entropy loss. Similarly, Tab. 9 depicts the impact of resampling on a MyCNN using a weighted random sampler on data of successfully classified samples from all categories of interest. Worms with 100 percent recall have the best results, as this is the smallest category with the most weight. With only 37.08 percent correctly classified, DoS attacks are more difficult to classify than the second-lowest attack type by more than 20 percent.

We can see some similarities between IoTCNN and MyCNN in Tab. 10, as this time just to classify DoS correctly both the IoTCNN and MyCNN struggle, with only a 13.86 percent recall. Compared to the resampled MyCNN, IoTCNN can classify the shellcode with a significantly higher recall of 91.23 percent. When resampling was used in both networks, the numbers of samples that are classified as benign was lower than when resampling was not used. Overall, the classifications were more evenly distributed across all ten categories, indicating that the technique successfully addressed some of the dataset’s category imbalances.

A. Weighted cross-entropy loss
The performance of MyCNN is affected by weighted cross-entropy loss, as shown in the Tab. 10. We can observe that the network successfully detected any additional categories, that the number of benign attacks increases slightly, and that the number of benign samples misclassified decreases.
The Tab. 11 consists of MyCNN Intrusion detection classifier confusion matrix trained with weighted cross entropy loss while the results of IoTCNN during the use of weighted cross-entropy loss are shown in Tab. 12, which shows that the number increases if the classification class has some samples that are classified as reconnaissance, and all samples classified as reconnaissance are incorrectly classified. We see fewer false positives for benign classes & more false positives for benign ones, similar to MyCNN, and the fuzzers have increased recall and reduced vulnerability exploitation, unlike MyCNN.


B. Class balanced loss
As shown in Tab. 13, MyCNN only classifies samples into the 2 largest classes, with a high number of false positives for benign classes, which is worse than when no technique is used to help train the unbalanced dataset. As depicted in Tab. 7. IoTCNN’s class balancing loss results are depicts in Tab. 14, all samples are labeled as backdoor attacks, resulting in the model’s worst performance to date.


Resampling with a weighted random sampler yield results for MyCNN for each class that differs from those provided by Sarhan et al., as shown in Tab. 15. In parentheses, people are listed [29]. MyCNN had a higher recall in six of the ten classes, with analysis having the highest recall of 0.93, or 62.44 percent higher. With the exception of one class, all F1 scores were lower, MyCNN had a lower backdoor, and the best overall performance class was benign. The disproportionately low precision is because missing classifications are distributed across most classes, as shown in Tab. 9.

Tab. 16, shows the results of IoTCNN resampling using a weighted random sampler, with the same format for each category as Tab. 15. IoTCNN had greater precision and recall differences than MyCNN, and performed worse on categorical generalizers and fuzzers.

Analysis, backdoor, and DoS were the worst-classified categories, consistent with Sarhan et al. People’s findings. We improved recall in all of the above classes by using MyCNN and resampling. Our model falls short when classifying vulnerability exploits, shellcode [29] and generalizations.
Small CNNs can classify network attacks using resampling and the NF-UNSW-NB15-v2 dataset. On the contrary, our models have higher F1 scores, as shown in the Tabs. 15 and 16. Our models’ successfully classified various kind of intrusion attacks. The proposed models are generalizable, so they can detect attacks efficiently with higher accuracy. To overcome class imbalances, we can use hybrid techniques rather than testing every possible parameter, the most critical ones: learning rates and batch sizes were chosen . The number of groups and blocks in IoTCNN should be adjusted, as should the rate of dropout for each dropout layer. The model training time for IoTCNN is less than 7 h, including tuning the model and hyperparameters. This time was set aside to ensure the model’s functionality. Better parameters has shown improvement in our results. The final dataset was too large and unbalanced to be evaluated using a larger dataset. Only one or two samples in the smallest subset make learning the class impossible. Due to the dataset’s imbalance, we needed a large dataset to get good representation of each class. So our model is limited, the experimental results show that the trained models’ performance is superior to the reference paper’s. Even when using a random sampler, class precision is still higher. Resampling and cost-sensitive learning can produce good results, and the worst-performing classes can be given extra weight. Because of the IoT device training takes too long, externally trained cloud models should be distributed to each IoT device. The IoT device can learn a few new assault samples. The IDS should be trained overnight so it can be updated quickly when new attacks are discovered. IoTCNN took longer time in model training and validation process than the MyCNN.
To classify an IDS data test set, the model average test time was recorded as 51 s, the testing time many vary from model-to-model architecture and parameters. The difference in inference times between the two proposed networks was only 3 s.
It’s important to note that while IoTCNN (3.05 MB) is smaller than MyCNN (3.79 MB), the models’ trainable parameters differ significantly. Aside from that, neither MyCNN nor IoTCNN has any untrainable parameters. A classifier’s main goal is generalization. Our models are accurate and more generalizable. A better sampler or loss function may help generalization. Using larger input images with larger width factors can also improve generalization.
Because the dataset is unbalanced, resampling and cost-sensitive learning are ineffective. We could avoid hierarchical splitting for training and validation by selecting evenly from classes. One reason for not choosing the small sample size available for the least populated worm class. It is best to analyses the features further during pre-processing to save or gain space in the final image. This should improve the convolutional layer input quality. Add noise or other enhancement techniques to the image to reduce category preference. Pads add too much data to the image due to their small size. Padding can be tested because it can affect the results. The expansion factor, group count, and block count should all be evaluated. A few more lightweight classification models would be effective. Instead of a fixed learning rate, the leaning scheduler could be used. So, the configuring of the learning rate scheduler during training should be skipped. Finally, the resampler and loss function rates were fine-tune to achieve better performance in IoT IDS.
We created two convolutional neural networks and trained them on the NF-UNSW-NB15-v2 dataset to classify cyber-attacks. This research aims to look into how CNNs designed for IoT devices perform in cyber-attacks and see if they can be used as anomaly-based intrusion detection systems. Experiments show that the model can classify cyber-attacks accurately and that it can be run as an IDS in real-time on most devices. We used resampling and cost-sensitive learning in this research to test multiple methods for improving the accuracy of training DL models on unbalanced datasets. Finding the optimal weights and the possibility of combining resampling with cost-sensitive learning using a hybrid approach are two areas that need to be investigated further. Unbalanced datasets would be addressed in this way. Different splitting methods or other oversampling methods that introduce more variation in the data could be used to address unbalanced datasets. Use a different preprocessing method that does not include padding, leading to errors. Larger images can be created from a small amount of data because convolutional neural networks use filters that pass through the image. This can result in more connections between features depending on how the image is constructed. The investigation is needed in the field of fine-tuning the hyperparameters in IoTCNN, and in other different DL models. The use of different optimizers for training can also be investigated for improving the classification accuracy of the proposed models, as the Adam optimizer is the only one used in this paper.
Acknowledgement: The authors extend their appreciation to the Deanship of Scientific Research at Imam Mohammad Ibn Saud Islamic University for funding this work through Research Group No. RG-21-07-04.
Funding Statement: This research is funded by Imam Mohammad Ibn Saud Islamic University, RG-21-07-04.
Conflicts of Interest: The authors declare that they have no conflicts of interest to report regarding the present study.
References
1. L. Atzori, A. Iera and G. Morabito, “Understanding the internet of things: Definition, potentials, and societal role of a fast evolving paradigm,” Ad Hoc Networks, vol. 56, pp. 122–140, 2017. [Google Scholar]
2. M. F. Elrawy, A. I. Awad and H. F. A. Hamed, “Intrusion detection systems for IoT-based smart environments: A survey,” Journal of Cloud Computing, vol. 7, no. 1, pp. 1–20, 2018. [Google Scholar]
3. L. Da Xu, S. Member, W. He and S. Li, “Internet of things in industries: A survey,” IEEE Transactions on Industrial Informatics, vol. 10, no. 4, pp. 2233–2243, 2014. [Google Scholar]
4. J. Lin, W. Yu, N. Zhang, X. Yang, H. Zhang et al., “A survey on internet of things: Architecture, enabling technologies, security and privacy, and applications,” IEEE Internet of Things Journal, vol. 4, no. 5, pp. 1125–1142, 2017. [Google Scholar]
5. M. Almiani, A. AbuGhazleh, A. Al-Rahayfeh, S. Atiewi and A. Razaque, “Deep recurrent neural network for IoT intrusion detection system,” Simulation Modelling Practice and Theory, vol. 101, no. may 2020, pp. 102031, 2020. [Google Scholar]
6. S. J. Moore, C. D. Nugent, S. Zhang and I. Cleland, “IoT reliability: A review leading to 5 key research directions,” CCF Transactions on Pervasive Computing and Interaction, vol. 2, no. 3, pp. 147–163, 2020. [Google Scholar]
7. M. A. Ferrag, L. Shu, X. Yang, A. Derhab and L. Maglaras, “Security and privacy for green IoT-based agriculture: Review, blockchain solutions, and challenges,” IEEE Access: Green Internet of Things, vol. 8, pp. 32031–32053, 2020. [Google Scholar]
8. M. S. Farooq, S. Riaz, A. Abid, K. Abid and M. A. Naeem, “A survey on the role of IoT in agriculture for the implementation of smart farming,” IEEE Access, vol. 7, pp. 156237–156271, 2019. [Google Scholar]
9. J. Ruan, Y. Wang, F. T. S. Chan, X. Hu, M. Zhao et al., “A life cycle framework of green IoT-based agriculture and its finance, operation, and management issues,” IEEE Communications Magazine, vol. 57, no. 3, pp. 90–96, 2019. [Google Scholar]
10. F. A. Ghaleb, M. A. Maarof, A. Zainal, M. A. Rassam, F. Saeed et al., “Context-aware data-centric misbehaviour detection scheme for vehicular ad hoc networks using sequential analysis of the temporal and spatial correlation of the consistency between the cooperative awareness messages,” Vehicular Communications, vol. 20, no. December 2019, pp. 100186, 2019. [Google Scholar]
11. A. A. Diro and N. Chilamkurti, “Distributed attack detection scheme using deep learning approach for internet of things,” Future Generation Computer Systems, vol. 82, pp. 761–768, 2018. [Google Scholar]
12. M. Ge, N. F. Syed, X. Fu, Z. Baig, and A. Robles-Kelly, “Towards a deep- learning-driven intrusion detection approach for Internet of Things,” Computer Networks, vol. 186, no. 1, pp. 107784, 2019. [Google Scholar]
13. E. M. Bårli, A. Yazidi, E. H. Viedma and H. Haugerud, “DoS and DDoS mitigation using Variational Autoencoders,” Computer Networks, vol. 199, no. 2, pp. 108399, 2019. [Google Scholar]
14. W. C. Shi and H. M. Sun, “DeepBot: A time-based botnet detection with deep learning,” Soft Computing, vol. 24, no. 21, pp. 16605–16616, 2020. [Google Scholar]
15. M. Munir, S. A. Siddiqui, A. Dengel and S. Ahmed, “Deepant: A deep learning approach for unsupervised anomaly detection in time series,” IEEE Access, vol. 7, pp. 1991–2005, 2019. [Google Scholar]
16. N. Shone, T. N. Ngoc, V. D. Phai and Q. Shi, “A deep learning approach to network intrusion detection,” IEEE Transaction on Emerging Topics in Computational Intelligence, vol. 2, no. 1, pp. 41–50, 2018. [Google Scholar]
17. S. Hajiheidari, K. Wakil, M. Badri and N. J. Navimipour, “Intrusion detection systems in the internet of things: A comprehensive investigation,” Computer Networks, vol. 160, pp. 165–191, 2019. [Google Scholar]
18. M. Fahim and A. Sillitti, “Anomaly detection, analysis and prediction techniques in IoT environment: A systematic literature review,” IEEE Access, vol. 7, pp. 81664–81681, 2019. [Google Scholar]
19. K. A. P. da Costa, J. P. Papa, C. O. Lisboa, R. Munoz and V. H. C. de Albuquerque, “Internet of things: A survey on machine learning-based intrusion detection approaches,” Compuer Networks, vol. 151, pp. 147–157, 2019. [Google Scholar]
20. H. Albasheer, M. M. Siraj, A. Mubarakali, O. E. Tayfour, S. Salih et al., “Cyber-attack prediction based on network intrusion detection systems for alert correlation techniques: A survey,” Sensors, vol. 22, no. 4, pp. 1–15, 2022. [Google Scholar]
21. B. Sharma, L. Sharma and C. Lal, “Anomaly detection techniques using deep learning in IoT: A survey,” in Int. Conf. on Computational Intelligence and Knowledge Economy ICCIKE 2019, Dubai, UAE, pp. 146–149, 2019. [Google Scholar]
22. W. Wang, F. Xia, H. Nie, Z. Chen, Z. Gong et al., “Vehicle trajectory clustering based on dynamic representation learning of internet of vehicles,” IEEE Transactions on Intelligent Transportation Systems, vol. 22, no. 6, pp. 3567–3576, 2021. [Google Scholar]
23. W. Wang, J. Chen, J. Wang, J. Chen and Z. Gong, “Geography-aware inductive matrix completion for personalized point-of-interest recommendation in smart cities,” IEEE Internet of Things Journal, vol. 7, no. 5, pp. 4361–4370, 2020. [Google Scholar]
24. W. Wang, J. Chen, J. Wang, J. Chen, J. Liu et al., “Trust-enhanced collaborative filtering for personalized point of interests recommendation,” IEEE Transactions on Industrial Informatics, vol. 16, no. 9, pp. 6124–6132, 2020. [Google Scholar]
25. E. Schiller, A. Aidoo, J. Fuhrer, J. Stahl, M. Ziörjen et al., “Landscape of IoT security,” Computer Science Review, vol. 44, no. May, pp. 100467, 2022. [Google Scholar]
26. M. Conti, A. Dehghantanha, K. Franke and S. Watson, “Internet of things security and forensics: Challenges and opportunities,” Future Generation Computer Systems, vol. 78, pp. 544–546, 2018. [Google Scholar]
27. D. E. Kouicem, A. Bouabdallah and H. Lakhlef, “Internet of things security: A top-down survey,” Computer Networks, vol. 141, pp. 199–221, 2018. [Google Scholar]
28. K. Gupta and S. Shukla, “Internet of things: Security challenges for next generation networks,” in 2016 1st Int. Conf. on Innovation and Challenges in Cyber Security (ICICCS 2016), Greater Noida, India, no. Iciccs, pp. 315–318, 2016. [Google Scholar]
29. I. S. Gracia, O. D. Suarez, G. B. Garcia and T. K. Kim, “Fast fight detection,” PLoS One, vol. 10, no. 4, pp. 1–19, 2015. [Google Scholar]
30. H. Peng, C. Liu, D. Zhao and J. Han, “Reliability analysis of CPS systems under different edge repairing strategies,” Physica A: Statistical Mechanics and its Applications, vol. 532, pp. 121865, 2019. [Google Scholar]
31. C. Kruegel, D. Mutz, W. Robertson and F. Valeur, “Bayesian event classification for intrusion detection,” in Proc.-Annul Computer Security Applications Conf. ACSAC, Las Vegas, NV, USA, vol. 2003-January, pp. 14–23, 2003. [Google Scholar]
32. C. Sinclair, L. Pierce and S. Matzner, “An application of machine learning to network intrusion detection,” in Proc.-Annul Computer Security Applications Conf. ACSAC, Phoenix, Arizona, USA, vol. Part F133431, no. 0293, pp. 371–377, 1999. [Google Scholar]
33. J. Zhang and M. Zulkernine, “A hybrid network intrusion detection technique using random forests,” in Proc. the First Int. Conf. on Availability, Reliability and Security, Vienna, Austria, vol. 2006, pp. 262–269, 2006. [Google Scholar]
34. J. Yang, J. Deng, S. Li and Y. Hao, “Improved traffic detection with support vector machine based on restricted boltzmann machine,” Soft Computing, vol. 21, no. 11, pp. 3101–3112, 2017. [Google Scholar]
35. H. Peng, Z. Kan, D. Zhao and J. Han, “Security assessment for interdependent heterogeneous cyber physical systems,” Mobile Networks and Application, vol. 26, no. 4, pp. 1532–1542, 2021. [Google Scholar]
36. L. Greche, M. Jazouli, N. Es-Sbai, A. Majda and A. Zarghili, “Comparison between Euclidean and manhattan distance measure for facial expressions classification,” in 2017 Int. Conf. Wireless Technologies, Embedded Intellegent Systems (WITS) 2017, Fez, Morocco, pp. 2–5, 2017. [Google Scholar]
37. H. Peng, C. Liu, D. Zhao, H. Ye, Z. Fang et al., “Security analysis of CPS systems under different swapping strategies in IoT environments,” IEEE Access, vol. 8, pp. 63567–63576, 2020. [Google Scholar]
38. Q. Tian, D. Han, K. C. Li, X. Liu, L. Duan et al., “An intrusion detection approach based on improved deep belief network,” Applied Intelligence, vol. 50, no. 10, pp. 3162–3178, 2020. [Google Scholar]
39. G. Hinton, “Deep belief networks,” Scholarpedia, vol. 4, no. 5, pp. 5947, 2009. [Google Scholar]
40. I. Tolstikhin, O. Bousquet, S. Gelly and B. Schölkopf, “Wasserstein auto-encoders,” in 6th Int. Conf. Learning Representation ICLR 2018, Vancouver, BC, Canada, pp. 1–20, 2018. [Google Scholar]
41. A. I. Abubakar, H. Chiroma, S. A. Muaz and L. B. Ila, “A review of the advances in cyber security benchmark datasets for evaluating data-driven based intrusion detection systems,” Procedia Computer Science, vol. 62, no. Scse, pp. 221–227, 2015. [Google Scholar]
42. K. Greff, R. K. Srivastava, J. Koutník, B. R. Steunebrink and J. Schmidhuber, “LSTM: A search space odyssey,” Transactions on Neural Networks and Learning Systems, vol. 28, no. 10, pp. 2222–2232, 2016. [Google Scholar]
43. I. T. Bowman, R. C. Holt and N. V. Brewster, “Linux as a case study: Its extracted software architecture,” in Proc.-Int. Conf. on Software Engineering, Los Angeles, California, USA, pp. 555–563, 1999. [Google Scholar]
44. Y. Fu, Y. Du, Z. Cao, Q. Li and W. Xiang, “A deep learning model for network intrusion detection with imbalanced data,” Electronics (Switzerland), vol. 11, no. 6, pp. 898, 2022. [Google Scholar]
45. K. Chen, Z. J. Yan and Q. Huo, “A Context-sensitive-chunk BPTT approach to training deep LSTM/BLSTM recurrent neural networks for offline handwriting recognition,” in Int. Conf. on Document Analysis and Recognition, ICDAR, Tunis, Tunisia, vol. 2015-Novem, pp. 411–415, 2015. [Google Scholar]
46. A. K. Jain, “Data clustering: 50 years beyond K-means,” Pattern Recognition Letters, vol. 31, no. 8, pp. 651–666, 2010. [Google Scholar]
47. Y. Cui, M. Jia, T. Y. Lin, Y. Song and S. Belongie, “Class-balanced loss based on effective number of samples,” in Proc. of the IEEE Computer Society Conf. on Computer Vision and Pattern Recognition, Long Beach, CA, USA, vol. 2019-June, pp. 9260–9269, 2019. [Google Scholar]
48. M. Sarhan, S. Layeghy and M. Portmann, “Towards a standard feature set for network intrusion detection system datasets,” Mobile Networks and Applications, vol. 27, no. 1, pp. 357–370, 2022. [Google Scholar]
49. N. S. Keskar, J. Nocedal, P. T. P. Tang, D. Mudigere and M. Smelyanskiy, “On large-batch training for deep learning: Generalization gap and sharp minima,”5th Int. Conf. on Learning Representations, ICLR 2017-Conf. Track Proc., Palais des Congrès Neptune, Toulon, France, pp. 1–16, 2017. [Google Scholar]
50. S. N. Nguyen, V. Q. Nguyen, J. Choi and K. Kim, “Design and implementation of intrusion detection system using convolutional neural network for DoS detection,” in ACM Int. Conf. Proceeding Series, New York, NY, United States, pp. 34–38, 2018. [Google Scholar]
51. J. Kim, J. Kim, H. Kim, M. Shim and E. Choi, “CNN-Based network intrusion detection against denial-of-service attacks,” Electronics (Switzerland), vol. 9, no. 6, pp. 1–21, 2020. [Google Scholar]
52. D. Vasan, M. Alazab, S. Wassan, H. Naeem, B. Safaei et al., “IMCFN: Image-based malware classification using fine-tuned convolutional neural network architecture,” Computer Networks, vol. 171, no. April 2019, pp. 107138, 2020. [Google Scholar]
53. J. Su, V. D. Vasconcellos, S. Prasad, S. Daniele, Y. Feng et al., “Lightweight classification of IoT malware based on image recognition,” in Proc.-Int. Computer Software and Applications Conf., Washington, DC, USA, vol. 2, pp. 664–669, 2018. [Google Scholar]
54. T. Y. Lin, P. Goyal, R. Girshick, K. He and P. Dollar, “Focal loss for dense object detection,” IEEE Transactions on Pattern Analysis and Machine Intelligence, vol. 42, no. 2, pp. 318–327, 2020. [Google Scholar]
55. I. Loshchilov and F. Hutter, “Decoupled weight decay regularization,” in 7th Int. Conf. on Learning Representations, ICLR 2019, New Orleans, LA, USA, 2019. [Google Scholar]
56. T. J. Saleem and M. A. Chishti, “Deep learning for the internet of things: Potential benefits and use-cases,” Digital Communications and Networks, vol. 7, no. 4, pp. 526–542, 2019. [Google Scholar]
57. S. Zagoruyko and N. Komodakis, “Wide residual networks,” in British Machine Vision Conf. 2016, BMVC 2016, York, UK, vol. 2016-Septe, pp. 87.1–87.12, 2016. [Google Scholar]
58. S. Ullah, M. A. Khan, J. Ahmad, S. S. Jamal, Z. E. Huma et al., “HDL-IDS: A hybrid deep learning architecture for intrusion detection in the internet of vehicles,” Sensors (Switzerland), vol. 22, no. 4, pp. 1–20, 2022. [Google Scholar]
59. L. Ashiku and C. Dagli, “Network Intrusion Detection System using Deep Learning,” Procedia Computer Science, vol. 185, no. 6, pp. 239–247, 2021. [Google Scholar]
60. D. P. Kingma and J. L. Ba, “Adam: A method for stochastic optimization,” in 3rd Int. Conf. on Learning Representations, ICLR 2015-Conf. Track Proc., San Diego, CA, USA, pp. 1–15, 2015. [Google Scholar]
61. F. Florencio, T. Valença, E. D. Moreno and M. Colaço Junior, “Performance analysis of deep learning libraries: Tensor flow and PyTorch,” Journal of Computer Science, vol. 15, no. 6, pp. 785–799, 2019. [Google Scholar]
62. N. Moustafa and J. Slay, “UNSW-NB15: A comprehensive data set for network intrusion detection systems (UNSW-NB15 network data set),” in 2015 Military Communications and Information Systems Conf., MilCIS 2015–Proc. 2015, Canberra, ACT, Australia, 2015. [Google Scholar]
63. W. Wang, M. Zhao and J. Wang, “Effective android malware detection with a hybrid model based on deep autoencoder and convolutional neural network,” Journal of Ambient Intelligence and Humanized Computing, vol. 10, no. 8, pp. 3035–3043, 2019. [Google Scholar]
64. Y. Zhang, P. Li and X. Wang, “Intrusion detection for IoT based on improved genetic algorithm and deep belief network,” IEEE Access, vol. 7, no. c, pp. 31711–31722, 2019. [Google Scholar]
Cite This Article
 Copyright © 2023 The Author(s). Published by Tech Science Press.
This work is licensed under a Creative Commons Attribution 4.0 International License , which permits unrestricted use, distribution, and reproduction in any medium, provided the original work is properly cited.
 Downloads
 Citation Tools