
 Submit a Paper
 Propose a Special lssue
 Open Access
ARTICLE
COVID-19 Outbreak Prediction by Using Machine Learning Algorithms
1 Department of Creative Technologies, Air University, Islamabad, 44230, Pakistan
2 School of Computer Science and Engineering, Kyungpook National University, Daegu, 41566, Korea
* Corresponding Author: Dongsun Kim. Email:
Computers, Materials & Continua 2023, 74(1), 1561-1574. https://doi.org/10.32604/cmc.2023.032020
Received 03 May 2022; Accepted 24 June 2022; Issue published 22 September 2022
 View Full Text
 Download PDF
Abstract
COVID-19 is a contagious disease and its several variants put under stress in all walks of life and economy as well. Early diagnosis of the virus is a crucial task to prevent the spread of the virus as it is a threat to life in the whole world. However, with the advancement of technology, the Internet of Things (IoT) and social IoT (SIoT), the versatile data produced by smart devices helped a lot in overcoming this lethal disease. Data mining is a technique that could be used for extracting useful information from massive data. In this study, we used five supervised ML strategies for creating a model to analyze and forecast the existence of COVID-19 using the Kaggle dataset” COVID-19 Symptoms and Presence.” RapidMiner Studio ML software was used to apply the Decision Tree (DT), Random Forest (RF), K-Nearest Neighbors (K-NNs) and Naive Bayes (NB), Integrated Decision Tree (ID3) algorithms. To develop the model, the performance of each model was tested using 10-fold cross-validation and compared to major accuracy measures, Cohan’s kappa statistics, properly or mistakenly categorized cases and root means square error. The results demonstrate that DT outperforms other methods, with an accuracy of 98.42% and a root mean square error of 0.11. In the future, a devised model will be highly recommendable and supportive for early prediction/diagnosis of disease by providing different data sets.Keywords
COVID-19 pandemic is one of the worst infectious diseases on the planet in 21-century and WHO on 11 February 2020 declared “COVID-19” a contiguous and fatal virus. It is believed that COVID-19, a severe acute respiratory syndrome coronavirus 2 (SARS-CoV-2) spread from a Beta coronavirus which naturally infects bats and pangolins and has 86.9% resembles bats coronavirus in the Asian region [1]. Coronavirus 19 originated in Wuhan city in Hubei province of China on December 8, 2019 and the virus is speedily spreadable as well as its evolution period ranges between 2 to 14 days [2]. A total of 99,070 people suffered from coronavirus and 4,636 lost their life in China and worldwide 5.24 M deaths were recorded out of 265 M cases till 04 December 2021. The spread rate of this deadly disease was around 26% to 30% in the confirmed cases on 11 March 2021, United States of America (USA) among other almost fifteen countries in the European Union Fig. 1 faced the worst episode of contiguous disease in the world [3,4]. Black Caribbean population and British majority faced the highest Per capita COVID-19 hospital deaths among few minority nations like Pakistanis and black Africans while Bangladesh saw less number of fatalities than others [5].As per the report published by VOX, age bracket (0–9) years and senior citizens after age 50 are more vulnerable to the virus [6].
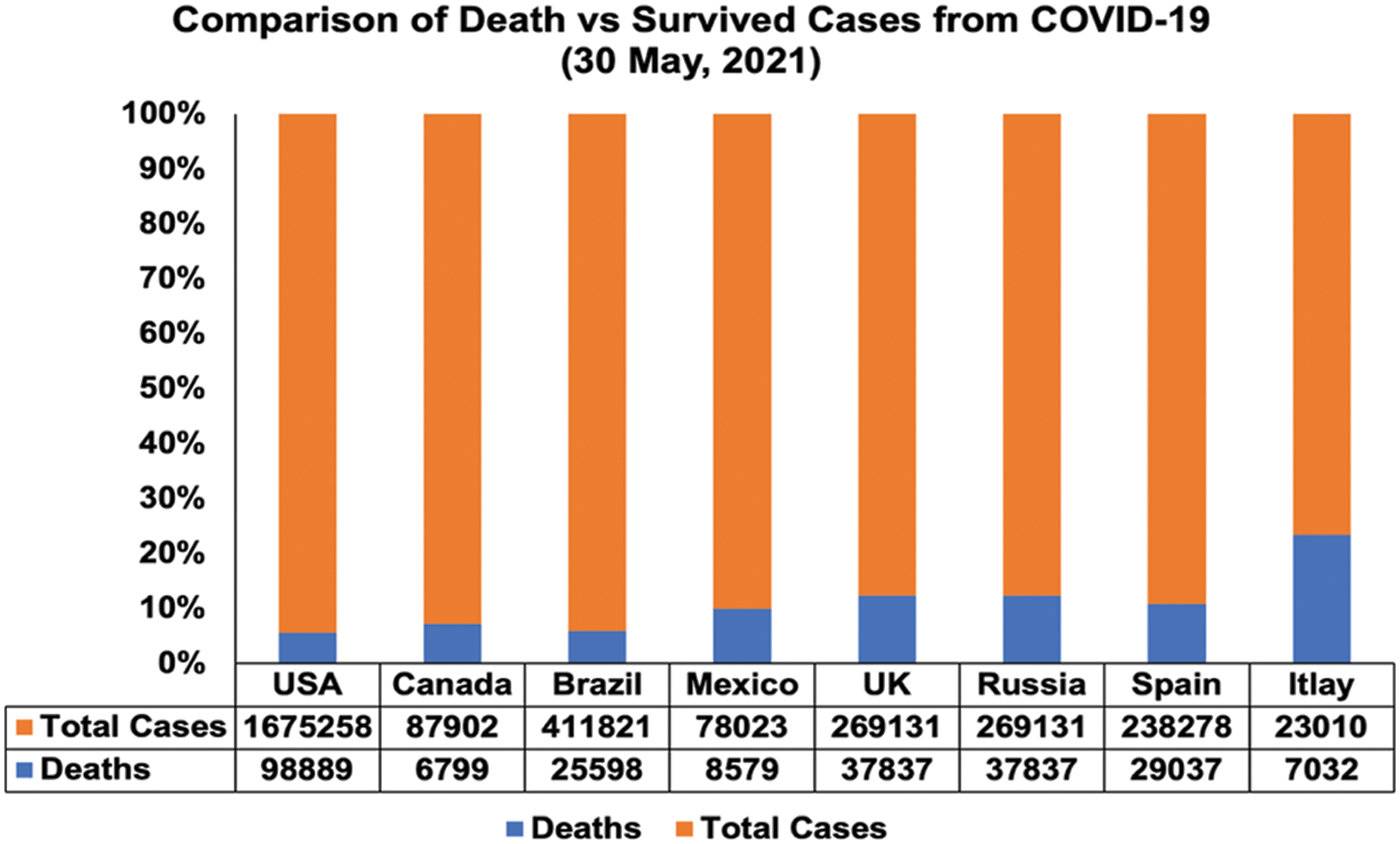
Figure 1: Comparison of death vs. survived from COVID-19 on May 30, 2021
COVID-19 pandemic affected badly all spheres of life, including its impact on the quality of life, psychology of sustainability and the global economy [6]. The virus spreads among people who come into contact with short-range transmissions (one meter), according to the World Health Organization. A virus spreads in poorly ventilated or crowded interior environments because contaminated particles or droplets are breathed or infect through the eyes, nose, or mouth. It spreads across stuffy and congested interior settings because aerosols or droplets remain debarred in the air or move more than 1 meter (long-range). By using, COVID-19 vaccine, washing hands for at least 20 s after each activity, wearing of face mask as well as maintaining social distance are the possible measures to contain the spread of the virus. Moreover, early detection of the virus, as well as isolation of infected personnel, is another way to stop the spread of the virus which is possible by the use of Internet of Things (IoT) and Social IoT [7–12] . Early detection of the virus in infected people is a challenge, which may be handled through ML algorithms.
ML is a branch of Artificial Intelligence (AI) that is used to train the model by using the historical data as an input and predict the new outcomes by using different algorithms. “Machine Learning is defined as the study of computer programs that leverage algorithms and statistical models to learn through inference and patterns without being explicitly programmed. ML field has undergone significant developments in the last decade.” It has three types: Supervised Machine Learning (SML), Un-Supervised Machine Learning (Un-SML) and Reinforcement Learning (RL). In SML, algorithms build in such a manner that machines will be able to infer general patterns and hypotheses via externally supplied instances to predict the outcome of future instances. Moreover, SML classification algorithms have another purpose to categorize the data by using prior information [13]. As a result, the machine will examine the provided data before forecasting new instances based on information gleaned from previous data. In contrast to SML, in Un-SML, the provided dataset is not correctly labeled and the machine infers the data on its own. In this process, the machine is given training samples and it is then the machine’s job to predict hidden patterns from the dataset.
Reinforcement learning is the next type of machine learning. In this sort of learning, the computer employs appropriate actions with a trial-and-error technique to identify the most likely outcome of future instances in the given environment [14]. The disease prediction model was developed using multiple Supervised ML techniques and different algorithms would produce varied results based on the datasets. As many pieces of research have already been carried out to predict this novel disease earlier by using machine learning algorithms. Convolutional Neural Network (CNN) has been applied as a COVID-19 predictor based on the ML because it has flexibility and scalability as compared to old-fashioned bio-statistical methods, ML algorithms can be utilized for a variety of tasks, including disease diagnosis and classification, risk stratification and patient survival forecasts. Moreover, machine learning algorithms are capable to analyze multidimensional data types and machines could be trained by using laboratory findings, demographic data, imaging data and doctors’ views about the disease.
By using the provided information, a machine could predict disease risk to life, diagnose the disease and could suggest appropriate treatments as required. Along with these benefits, machine learning presents several challenges in the health-care delivery system, including data pre-processing, model training and fine-tuning of the system to actual clinical problems due to limitations and constraints in the provision of sufficient data as well as ethical considerations, such as medico-legal ramifications, doctors’ expertise in ML tools and data privacy and security [15]. COVID-19 is a challenging disease to forecast and we are focused to develop a supervised ML model that can accurately predict COVID-19 in people in our study. As studies already have been carried out to predict respiratory disease, coronary artery disease, diabetes, breast cancer, fatty liver disease and dementia with the help of machine learning [16–20]. Fig. 2 shows a classifier’s accuracy chart of illnesses prediction research by using machine learning algorithms, the best algorithms based on the experiments along with the accuracy acquired, as well as our suggested classifier for COVID-19 prediction, which gave 98.42 percent accuracy.
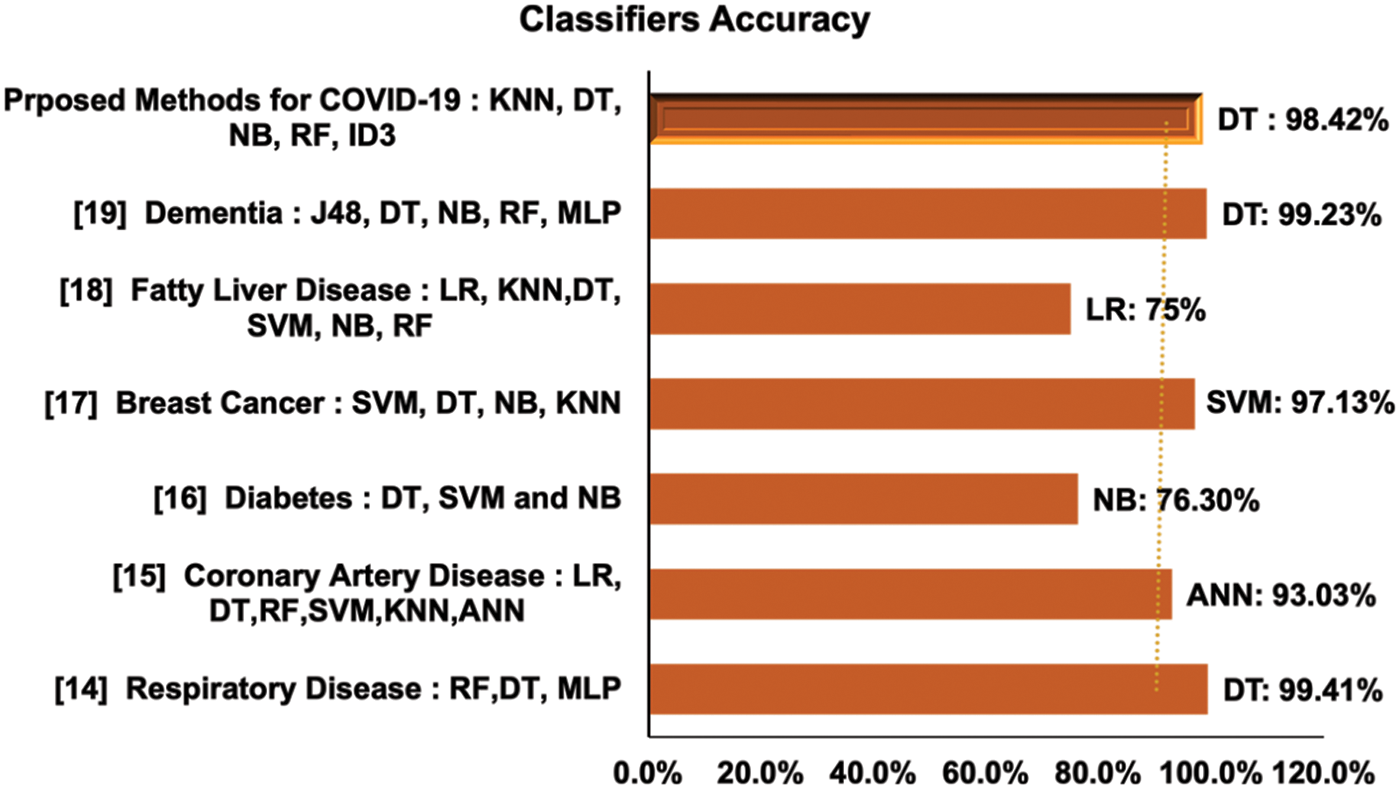
Figure 2: Comparison of classifier’s accuracy on particular disease
The disease prediction model was developed using multiple Supervised ML techniques and different algorithms would produce varied results based on the datasets. As several research articles have already been carried out to predict this novel disease earlier by using machine learning algorithms. Convolutional Neural Network (CNN) has been applied as a COVID-19 predictor based on the laboratory finding, a dataset was taken from a hospital in Sao Paul, Brazil and the model was predicted with 76% accuracy [21]. To improve the accuracy of the model for COVID-19 severity prediction at the early stage was also considered by another researcher while taking samples of initial complete blood test results which were dependent upon age, white blood cells (WBC), lymphocytes and neutrophils [22]. Moreover, different machine learning algorithms were tested on publicly available X-ray images for the prediction of COVID-19 and Smartphones have been programmed with the high-performing model. In terms of predicting the COVID-19 virus, VGG16 was found to have a lower negative likelihood and a larger positive likelihood [23]. Furthermore, the XG Boost model has been developed with an accuracy rate of 90% for predicting the mortality of a COVID-19 patient approximately 10 days earlier [24].
To forecast cases of COVID-19, ML models were developed by using mathematical expressions along with Stochastic Fractal search algorithms for the prediction of symptomatic and asymptomatic patients or mortality or recovery from COVID-19 virus [25]. The Polynomial Neural Network method was used to predict the confirmed and death cases on daily basis from the Asian continent [26]. However, existing literature lack rarely prediction because multiple supervised ML approaches were employed to predict COVID-19 considering symptoms experienced by the user as parameters. The focus of this research would be to use the RapidMiner Studio Tool to create a model that will automatically predict the presence of COVID-19 in a person using KNN, ID3, NB, RF and DT algorithms. RapidMiner is software developed by the RapidMiner firm that provides an integrated environment for ML predictive analysis, business analytics and text mining. Rapid Miner is based on a client/server approach with the services available on cloud infrastructures. It is a cross-platform application. It offers around twenty-two file formats. RapidMiner has more than 100 learning models for clustering analysis, regression and classification. It was initially known as YALE in 2001 at the Artificial Intelligence Unit of the Technical University of Dortmund. Rapid-I GmbH was founded in 2006 by Ingo Mierswa and Ralf Klinkenberg and YALE was renamed Rapid Miner in 2007 [27]. Rapid Miner Studio implements the workflow in software, in the Design View. The Design View consists of numerous panels.
• The repository in the RapidMiner is used for Data storage, its processes and storage of results.
• Operators are used to carrying out an essential work flow for a project.
• Ports are used to connect Operators. The first operator’s output is being used as input again for a second.
• A process is a collection of Operators that work together to alter and analyze data.
• Parameters are used for modifying the behavior of an operator.
• A help option could be used for the understanding of certain Operators.
The solution to the problem of predicting COVID-19 presence in the person includes the following sections: Section 2 will describe materials and methods for the key problem, Section 3 is the Result’s section and Section 4 deals with Discussion on the results given by the different classifiers, Section 5 is Conclusion.
The work flow diagram is shown in Fig. 3 and this study follows steps as per work flow diagram.
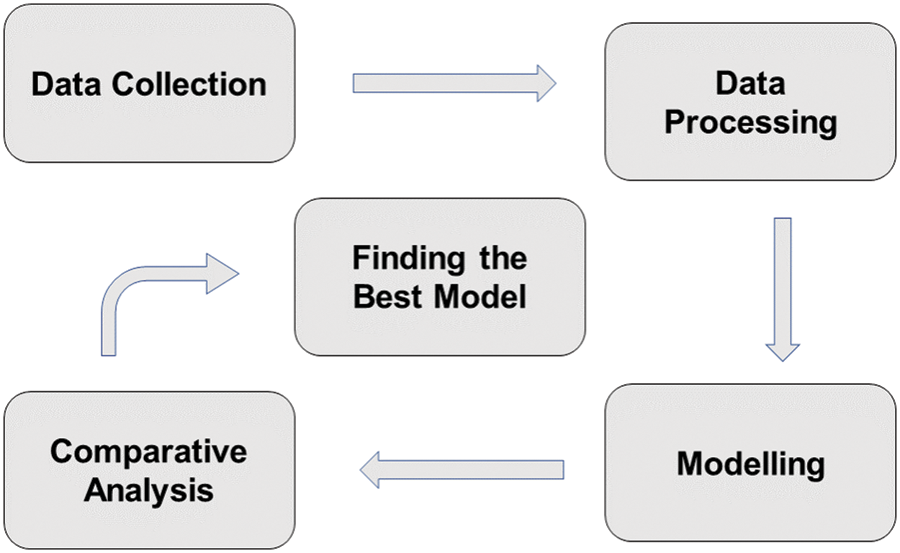
Figure 3: The work process for finding the best model for COVID-19 prediction
For data collection, the researcher used the dataset” COVID-19 Symptoms and Presence” which was available at https://www.kaggle.com/hemanthhari/symptoms-and covid-presence. The dataset includes twenty features that may be responsible for the virus’s presence and propagation, as well as one class feature/attribute that determines the presence of COVID-19.
To process the dataset, the author used the RapidMiner machine learning software’s RapidMiner Studio supports ACCDB-Microsoft Access database, ARFF-Weka file format, CSV-Comma Separated Value, DBF-dBASE Database file format (read-only), DTA-Stata file format (read-only), HYPER-Tableau file format MDB-Microsoft Access database, QVX, QlikView data exchange (write-only), SAS-SAS file format up to v9.2 (read-only), SAV-IBM SPSS file format (read-only), TDE–Tableau file format, XLS/XLSX-Microsoft Excel spreadsheet, XML-Extensible Markup Language, XRFF-Weka file format file types. Therefore, The COVID-19 Symptoms and Presence dataset is in csv format, making it simple to import and study in the tool. Data preprocessing would begin by selecting the Import Data option from the Repository menu and searching for the dataset’s location. Once the dataset is imported into RapidMiner’s process window, the data cleaning operation is performed for the removal of undefined numbers which could be done by filing those missing values by an average of numbers/minimum or maximum value.
After data processing, different SML algorithms, namely DT, RF, KNN, ID3 and NB were applied. In the operator tab of the RapidMiner, the classifier name was chosen by the researchers and selected 10-fold cross-validation. For determining best configuration, many optimization techniques like Feature Scaling and Batch normalization, Mini-batch gradient descent, Gradient descent with momentum, RMSProp optimization, Adam optimization, Hyperparameter optimization and Learning rate decay. The research preferred hyperparameter optimization technique for determining the best configuration for each algorithm by performing several pieces of training on the model. For Decision Tree (DT), maximal depth ten was considered along with pruning (confidence = 0.1) and pre-pruning (minimal gain = 0.01). The researcher used the optimization technique to get the best results and successfully got 98.42% accuracy and Kappa 0.95. The researcher used another classifier like Random Forest (RF) with a hundred iterations and maximum depth to zero (unlimited depth), iterations represent the total number of trees in the forest. The researcher used the optimization technique to get better results and computed 98.37% accuracy with Kappa 0.948. Furthermore, another classifier like KNN was used to find better accuracy than previously used classifiers, when K = 10 with optimization technique. KNN classifier provided 97.58% and kappa was 0.922. For the ID3 classifier, the researcher used minimal leaf size 2 and with minimum size for split is 4. The author used an optimization technique to get better performance but the classifier gave 98.26% and Kappa is 0.945. Lastly, the NB with Kernel Estimator algorithm and Supervised Discretization rather than the normal distribution of numeric attributes gave an accuracy 96.87% and kappa 0.897 after optimization. Moreover, the following supervised machine algorithms were used and their mathematical descriptions are given as follows:-
The Complete Process of Classifiers Using RapidMiner is shown in Fig. 4a whereas, an algorithm for a DT Fig. 4b is a graphical tree-like structure, wherein a root node is used to classify the instances like having a test condition (e.g., abroad travel is the root node in our case) and branches determine the answer. J. R. Quinlan’s, paper entitled “Learning Decision Tree Classifiers”, stated that “a tree is either a leaf node or a test node” [28]. Gain Info and Gini Index are utilized for deciding the root node, moreover, the following mathematical expressions, see Eq. (1) are used for computing the root node [29].
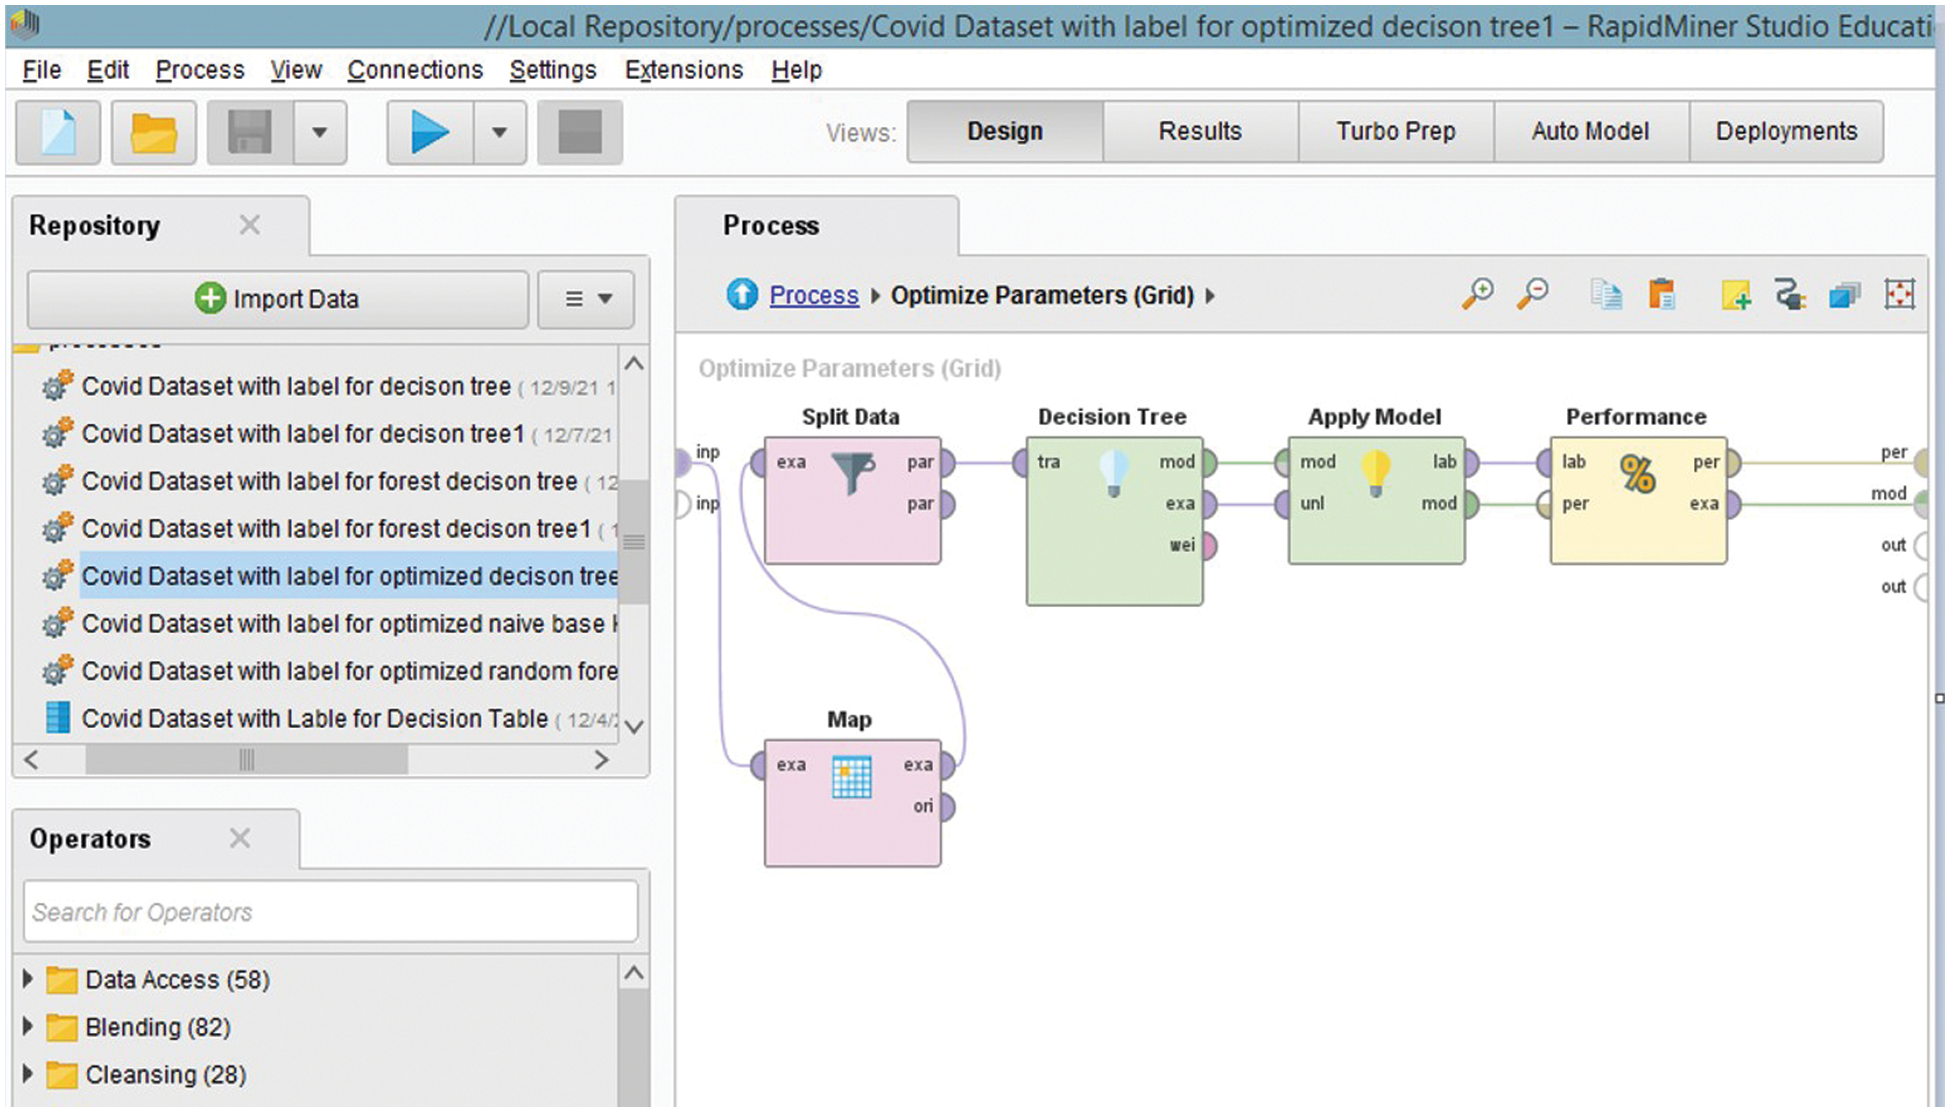
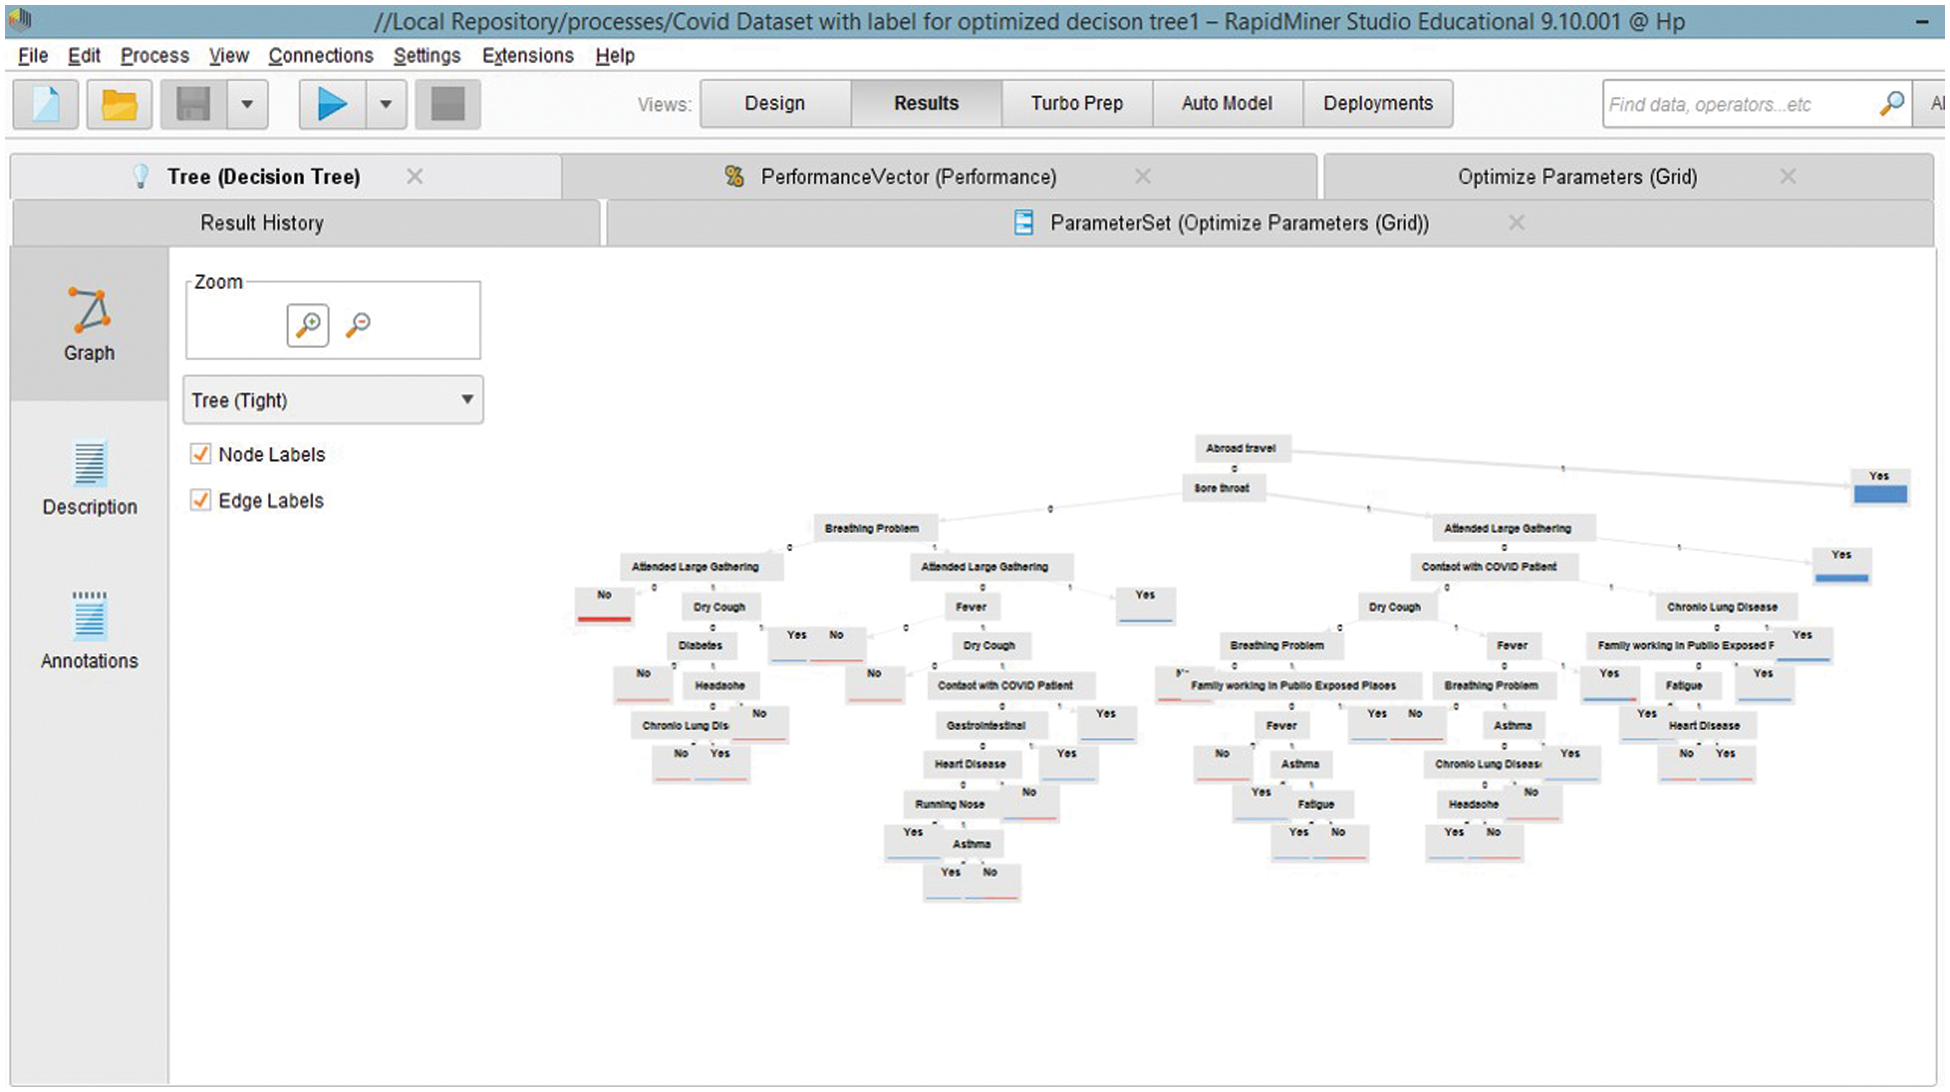
Figure 4: (a) Complete process of classifier’s using RapidMiner. (b) Decision Tree using RapidMiner
The Gini Index measures the reduction in class impurity from partitioning the feature space see Eqs. (3) and (4).
The RF algorithm creates trees as well, but it creates multiple trees from the values of random samples in the dataset, with final results dependent on the majority of the trees generated. By constructing a group of trees that create individual outcomes, aggregating those results and deciding which class had the most votes, RF could exhibit considerable increases in the categorization (accuracy) of a given model [30]. L. Breiman invented a bagging approach, which is a method of prediction based on the generation of many versions of predictors. The predictors are generated by replicas of the dataset and an aggregated predictor can be generated by combining the predictors. When employed in subset selection for linear regression tasks, as well as when incorporated in classification and regression trees, bagging improves model accuracy significantly. A tree classifier was represented by h (x, Θk, k = 1, …) was used to symbolize a tree classifier, where the Θk are equally distributed random vectors and ‘x’ represents the input. Each of these classifiers delivers a result for the highest probability of a class [30] and the group of classifiers can be written as h1 (x), h2 (x), . . ., hk (x).
2.3.3 K-Nearest Neighbors (K-NNs)
K-NNs algorithms functionality is to find k-nearest neighbors of data points in a data set. The k-nearest-neighbor classifier’s working is done by Euclidean distance between specified training samples and a test sample. The Euclidean distance between sample qi and pi is defined as Eq. (5).
The test sample will be classified in that class which has a minimum Euclidean distance among the points. In practice, to avoid ties, k is preferably chosen to be odd. The k = 1 rule is generally called the nearest-neighbor classification rule [31].
2.3.4 Integrated Decision Tree (ID3)
The Integrated Decision Tree (ID3) is a supervised learning technique that uses a fixed set of instances to form a DT. Future samples will be classified using the modeled tree. The ID3 method generates trees based on the information gained from the training examples, which are then used to categorize the test samples. When utilizing the ID3 technique, there are no missing data because nominal attributes are used for classification [32]. If ‘P’ is a probability distribution with ‘m’ samples, i.e., P = (p1, p2, . . ., pk) and a sample ‘S’ contains information from a defined distribution. Eq. (6) shows the entropy of ‘P’ is equal to:
The Gain Information G Info (p, T): In Eq. (7) It’s a function that calculates the degree of mixed classes in a sample set and also displays the tree’s position. The function that will select the test that will label the running/current node is as follows. For a test T and a position p, we can define gain info.
where ‘pk’ are all possible values for attribute ‘T’. A researcher could use this equation for the placement of attributes and could build the DT where each node’s attribute is located with the highest information gain among all attributes which are not yet decided in the form of the root node.
A statistical supervised ML algorithm called a Naive Bayesian classifier which forecasts the likelihood of belonging to a particular class. When applied to a big dataset, NB produces excellent accuracy [33], but it also improves accuracy when applied to small datasets [34]. The Bayes theorem [35], which was developed by an English mathematician named Thomas Bayes in 1763, can be defined as Eq. (8):
• P(C/F): Posterior Probability
• P(C): Class Prior Probability
• P(F/C): Likelihood
• P(F): Predictor Prior Probability whereas ‘c’ stands for ‘class’ and ‘f’ stands for features.
The author employed 10-fold cross-validation testing to compare the following settings on several SML Algorithms. The results of the comparative analysis are displayed in Fig. 5 and the essential criteria that were used in this phase are as follows:
Each algorithm will perform differently concerning the correctly classified instances and accuracy is the parameter of all successfully predicted instances divided by the total predictions generated by the model. The ratio of correctly classified true positives (TP) and true negatives (TN) over the total number of cases is used to calculate accuracy. Accuracy can be calculated using the following formula in Eq. (9):
Furthermore, precision is a crucial aspect in determining the optimal model; it is calculated by dividing the TP by the total of TP and FP and it assesses the accuracy of TP prediction’s overall anticipated positives. Precision refers to how many COVID-19-positive classified patients are genuinely COVID-19-positive in a given dataset and it can be calculated using the following Eq. (10):
The accuracy of predicted TP over actual positive cases in the dataset is measured by recall. The following Eq. (11) can be used to compute the recall percentage:
3.2 Correctly and Incorrectly Classified Instances
These values are considered in the comparative analysis of the machine learning algorithms. TP and TN predictions show the correctly classified instances; conversely, FP and FN predictions show incorrectly classified instances in the model.
Cohen’s kappa statistic, often known as Kappa statistics, is a statistic that evaluates the reliability of a prediction or outcome between two raters of the same sample; it shows how closely the raters agree by chance. A zero score indicates that there is a random or low possibility of agreement between two raters and it indicates that the score could be less than zero. Furthermore, a score of 1 indicates that the two raters are completely in accord [35]. Cohen begins by defining i by j matrix (confusion matrix), in which an element
where P1 is the observed proportional agreement,
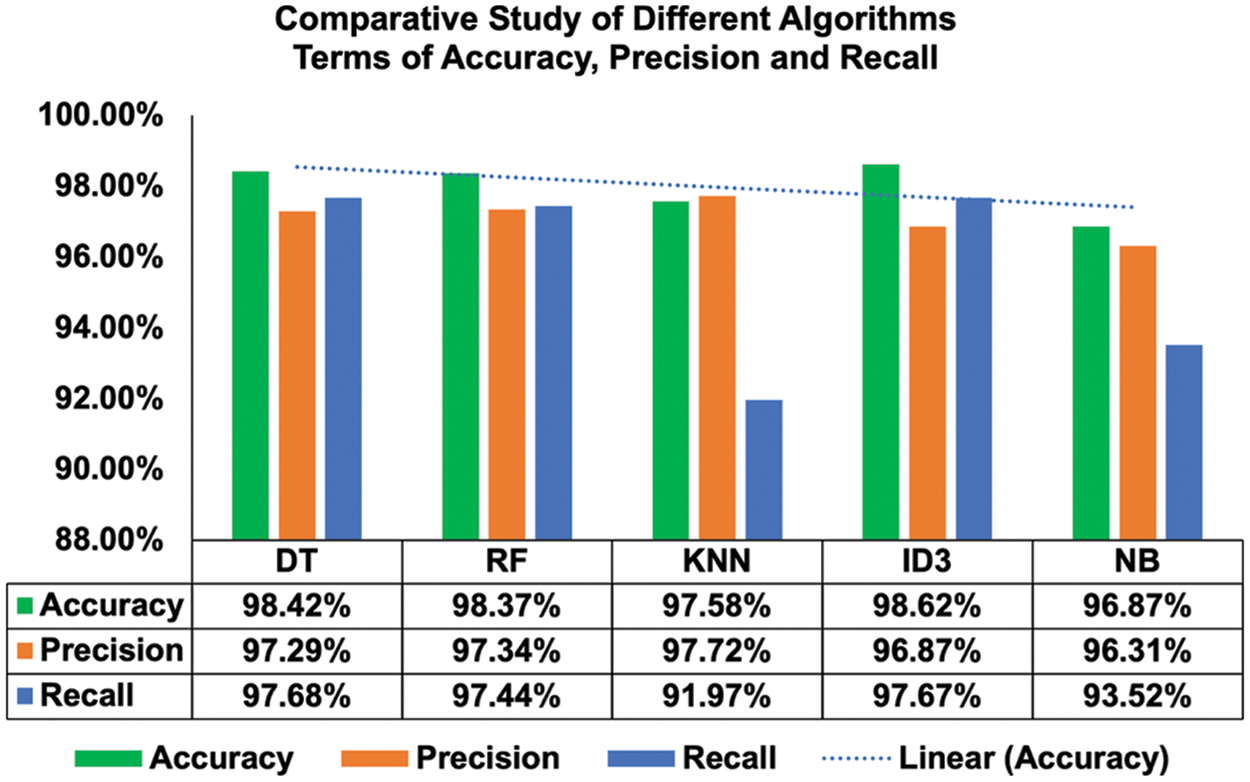
Figure 5: Comparative study of different algorithms in terms of accuracy, precision and recall
The following are contributing factors in determining the best model for the under discussion dataset as Accuracy alone could not determine the best model for detection of COVID-19 presence in the person. Therefore, the researcher kept this in mind while finding the best model.
• Highest accuracy, precision, recall
• Highest correctly classified instances
• Lowest incorrectly classified instances;
• Highest kappa statistic score
• Lowest Root Mean Square Error
4.1 The COVID-19 Symptoms and Presence Dataset
The researchers used the” COVID-19 Symptoms and Presence” dataset from Kaggle. There are 20 attributes in this dataset, plus one target/class attribute. There are 5434 instances in the dataset.
Yes accounts for 4383 (81%) of the cases, indicating that the person void-19 is present in 1051 occurrences (19%). However, in the modeling phase, the best performance of an algorithm can be attained by using the best configuration. As a result, the researchers used the COVID-19 Presence and Symptoms dataset to undertake hyperparameter optimization to determine the values at which the algorithm will work best. All of the studies employed 10-fold cross-validation and a batch size of 100 to assess the model’s performance.
4.2 Results for Comparative Analysis
The Hyperparameter optimization process was used to get optimal best results for each algorithm, after analysis of the results, researchers were able to decide which model gave the best results after optimization. Therefore, the DT algorithm predicted the presence of COVID-19 in a person with better results. The established models were evaluated using the 10-fold cross-validation technique and the results of the model’s accuracy performance along with other measures are displayed in Tab. 1.
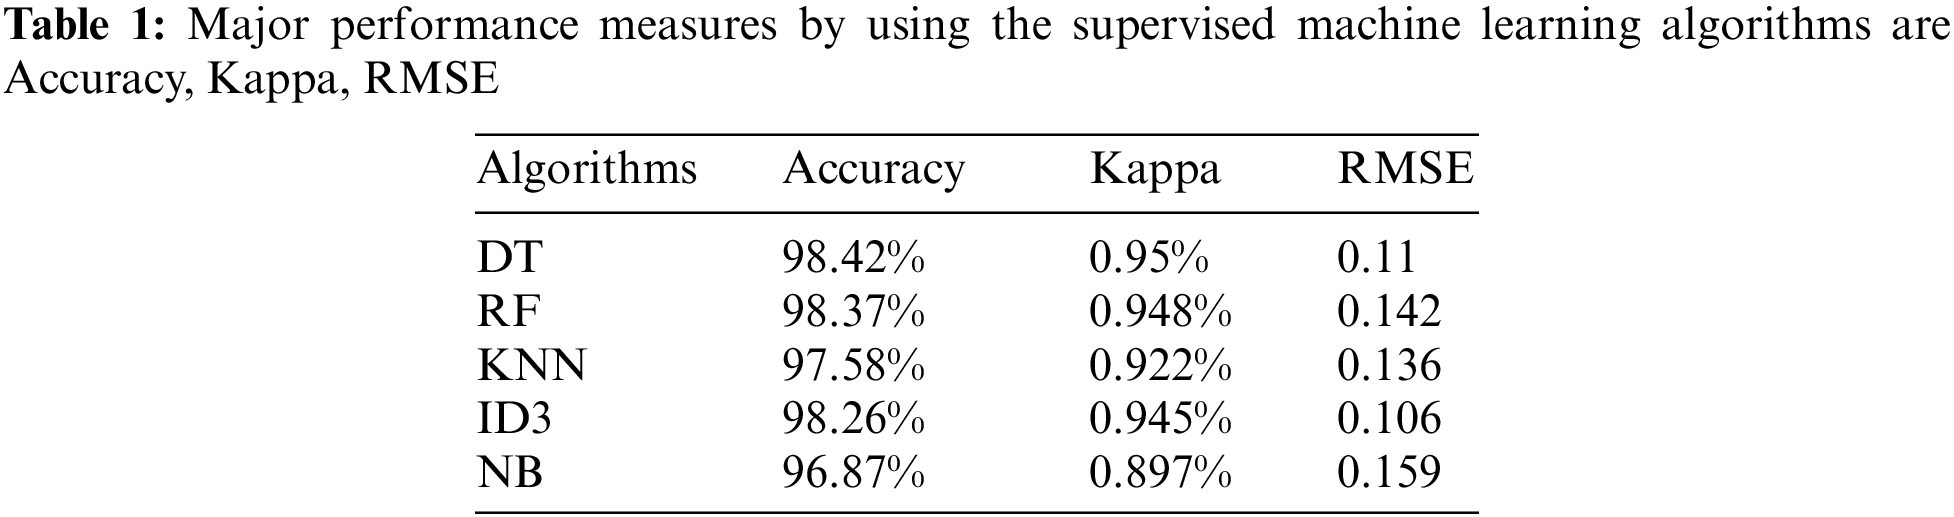
The authors created a model with a low RMSE because they believe it will be more effective than models with a greater RMSE. Lastly, the data was analyzed using Kappa statistics as a criterion for the model’s effectiveness concerning the true labels present in our dataset. Finally, all algorithms due to tuning by hyperparameters performed well in the training/testing process. DT and RF almost showed the best performances in the prediction of COVID-19 presence in the person.
This study sought to create a COVID-19 presence prediction algorithm/model by using five supervised ML algorithms: DT, RF, K-NNs, ID3 and NB. The model’s performance was assessed in 10-fold cross-validation with RapidMiner Studio machine learning software for a detailed examination. The DT was found to be the most accurate ML algorithm with a 98.42 percent accuracy and a 0.11 root mean square error (RMSE). In terms of accuracy, recall, precision, properly and erroneously categorized instances and kappa statistic score, the DT method surpassed other algorithms. Furthermore, the results reveal that the Random Forest method is the second-best model for developing a COVID-19 presence predictor, as it achieves minor difference in accuracy measures as comparative to DT algorithm. Furthermore, the ID3 is the third-best model for predicting the presence of COVID-19 in a person. Furthermore, K-NNs is listed as the fourth most appropriate algorithm, while NB is ranked as the fifth most relevant algorithm for consideration. This research could help with medical decision-making by utilizing a technologically enhanced model to assist in diagnosing COVID-19 presence in a person based on symptoms. Additionally, symptoms experienced by the people were used to determine the chance of being COVID-19 positive or negative. The model created in this study can be used to create an application with the following advantages:
• The presence of the COVID-19 virus in the individuals could easily be monitored by using symptoms as an input feature.
• Medical practitioners can utilize this study as a preliminary patient assessment.
• Businesses community could be assisted by restricting physical contact with the customer’s
• Possibility of having COVID-19
• This study will be used at quarantine facilities as an additional self-management tool for monitoring COVID 19 symptoms while individuals are isolated
• This study may be useful to the community and government as a tool for containing the virus’s spread by detecting COVID-19 timely.
In addition to this research, A multifeatured learning model with enhanced local attention for vehicle re-Identification [36] may be used for our dataset with images which contains multifeatured to detect early COVID-19 in a person. Moreover, a lightweight convolutional network with feature optimization (LWCNN-FO) is used for classification of vehicle by using images dataset Car-159 [37], similarly we may deploy Chest X-Rays to detect the COVID-19 patient as it may also give better accuracy in future research work .
Acknowledgement: Tahir Sher has done all the experiments and wrote the manuscript. Dr. Abdul Rehman has revised the manuscript in several meetings and refined the idea. Whereas, Dr. Dongsun Kim has supervised this research work.
Funding Statement: This work was supported by the National Research Foundation of Korea (NRF) grant funded by the Korea government (MSIT) (No. 2021R1A5A1021944 and 2021R1A5A1021944). Additionally, the research was supported by Kyungpook National University Research Fund, 2020.
Conflicts of Interest: The authors declare that they have no conflicts of interest to report regarding the present study.
References
1. D. M. Morens, J. G. Breman, C. H. Calisher, P. C. Doherty, B. H. Hahn et al., “The origin of COVID-19 and why it matters,” The American Society of Tropical Medicine and Hygiene, vol. 103, no. 3, pp. 955, 2020. [Google Scholar]
2. M. BS and V. Nambiar, “COVID-19: An insight into SARS-CoV-2 pandemic originated at Wuhan city in Hubei province of China,” J. Infect. Dis. Epidemiol., vol. 6, no. 4, pp. 146, 2020. [Google Scholar]
3. J. Riou and C. L. Althaus, “Pattern of early human-to-human transmission of Wuhan 2019 novel corona virus (2019-nCoV),” European Centre for Disease Prevention and Control, vol. 25, no. 4, pp. 2000058, 2020. [Google Scholar]
4. R. Salgotra, M. Gandomi and A. H. Gandomi, “Time series analysis and forecast of the COVID-19 pandemic in India using genetic programming,” Chaos, Solitons & Fractals, vol. 138, pp. 109945, 2020. [Google Scholar]
5. L. Platt and R. Warwick, “Are some ethnic groups more vulnerable to COVID-19 than others?,” Institute for Fiscal Studies, vol. 1, no. 5, pp. 2020–2021, 2020. [Google Scholar]
6. M. E. S. E. Keshky, S. S. Basyouni and A. M. A. Sabban, “Getting through COVID-19: The pandemic’s impact on the psychology of sustainability, quality of life and the global economy–A systematic review,” Frontiers in Psychology, vol. 11, pp. 3188, 2020. [Google Scholar]
7. A. Rehman, R. Naqvi, A. Rehman, A. Paul, M. T. Sadiq et al., “A trustworthy SIoT aware mechanism as an enabler for citizen services in smart cities,” Multidisciplinary Digital Publishing Institute, vol. 9, no. 6, pp. 918, 2020. [Google Scholar]
8. F. Saeed, A. Paul, A. Rehman, W. H. Hon and H. Seo, “IoT-Based intelligent modeling of smart home environment for fire prevention and safety,” Multidisciplinary Digital Publishing Institute, vol. 7, no. 1, pp. 11, 2018. [Google Scholar]
9. A. Rehman, A. Paul, M. G. Junaid, W. H. Hong and H. Seo,“Exploiting small world problems in a SIoT environment,” Multidisciplinary Digital Publishing Institute, vol. 8, no. 11, pp. 2089, 2018. [Google Scholar]
10. A. Rehman, A. Paul, A. Ahmad and G. Jeon, “A novel class based searching algorithm in small world internet of drone network,” Elsevier, vol. 157, pp. 329–335, 2020. [Google Scholar]
11. A. Rehman, A. Paul and A. Ahmad, “A query based information search in an individual’s small world of social internet of things,” Elsevier, vol. 163, pp. 176–185, 2020. [Google Scholar]
12. A. U. Rehman, A. Jiang, A. Rehman and A. Paul, “Weighted based trustworthiness ranking in social internet of things by using soft set theory,” in Proc. ICCC, Chengdu, China, pp. 1644–1648, 2019. [Google Scholar]
13. A. Singh, N. Thakur and A. Sharma, “A review of supervised machine learning algorithms,” in Proc. INDIACom, New Delhi, India, pp. 1310–1315, 2016. [Google Scholar]
14. D. Sisodia and D. S. Sisodia, “Prediction of diabetes using classification algorithms,” Procedia Computer Science, vol. 132, pp. 1578–1585, 2018. [Google Scholar]
15. K. Y. Ngiam and I. W. Khor, “Big data and machine learning algorithms for health-care delivery,” The Lancet Oncology, vol. 20, no. 5, pp. e262–e273, 2019. [Google Scholar]
16. C. N. Villavicencio, J. J. E. Macrohon, X. A. Inbaraj, J. Jeng and J. Hsieh, “COVID-19 prediction applying supervised machine learning algorithms with comparative analysis using WEKA,” Multidisciplinary Digital Publishing Institute, vol. 14, no. 7, pp. 201, 2019. [Google Scholar]
17. M. Abdar, W. Ksiazek, U. R. Acharya, R. Tan, V. Makarenkov et al., “A new machine learning technique for an accurate diagnosis of coronary artery disease,” Computer Methods and Programs in Biomedicine, vol. 179, pp. 104992, 2019. [Google Scholar]
18. H. Asri, H. Mousannif, H. A. Moatassime and T. Noel, “Using machine learning algorithms for breast cancer risk prediction and diagnosis,” Procedia Computer Science, vol. 83, pp. 1064–1069, 2016. [Google Scholar]
19. A. K. M. S. Rahman, F. M. J. M. Shamrat, Z. Tasnim, J. Roy and S. A. Hossain, “A comparative study on liver disease prediction using supervised machine learning algorithms,” International Journal of Scientific & Technology Research, vol. 8, no. 11, pp. 419–422, 2019. [Google Scholar]
20. D. Bansal, R. Chhikara, K. Khanna and P. Gupta, “Comparative analysis of various machine learning algorithms for detecting dementia,” Procedia Computer Science, vol. 132, pp. 1497–1502, 2018. [Google Scholar]
21. H. Turabieh and W. B. A. Karaa, “Predicting the existence of COVID-19 using machine learning based on laboratory findings,” in Proc. WiDSTaif, Taif, Saudi Arabia, pp. 1–7, 2021. [Google Scholar]
22. J. Luo, L. Zhou, Y. Feng, B. Lo and S. Guo, “The selection of indicators from initial blood routine test results to improve the accuracy of early prediction of COVID-19 severity,” Plos one, Public Library of Science San Francisco, vol. 16, no. 6, pp. e0253329, 2021. [Google Scholar]
23. A. K. Rangarajan and H. K. Ramachandran, “A preliminary analysis of AI based smartphone application for diagnosis of COVID-19 using chest X-ray images,” Expert Systems with Applications, vol. 183, pp. 115401, 2021. [Google Scholar]
24. L. Yan, H. Zhang, J. Goncalves, Y. Xiao, M. Wang et al., “An interpretable mortality prediction model for COVID-19 patients, nature machine intelligence,” Nature Publishing Group, vol. 2, no. 5, pp. 283–288, 2020. [Google Scholar]
25. S. Khalilpourazari and H. H. Doulabi, “Robust modelling and prediction of the COVID-19 pandemic in Canada,” International Journal of Production Research, pp. 1–17, 2021. [Google Scholar]
26. P. Majumder, “Chapter 10-Daily confirmed cases and deaths prediction of novel coronavirus in Asian continent polynomial neural network,” in Biomedical Engineering Tools for Management for Patients with COVID-19, Academic Press, pp. 163–172, 2021. [Google Scholar]
27. I. Mierswa, M. Wurst, R. Klinkenberg, M. Scholz and T. Euler, “Yale: Rapid prototyping for complex data mining tasks,” in Proc. ACM SIGKDD, Philadelphia, PA, USA, pp. 935–940, 2006. [Google Scholar]
28. J. R. Quinlan, “Learning decision tree classifiers,” ACM Computing Surveys (CSUR), vol. 28, no. 1, pp. 71–72, 1996. [Google Scholar]
29. A. C. Dean, E. D. London, C. A. Sugar, C. M. R. Kitchen, A. Swanson et al., “Predicting adherence to treatment for methamphetamine dependence from neuropsychological and drug use variables,” Drug and Alcohol Dependence, vol. 105, no. 1–2, pp. 48–55, 2009. [Google Scholar]
30. L. Breiman, “Random forests,” Machine Learning, vol. 45, no. 1, pp. 5–32, 2001. [Google Scholar]
31. L. E. Peterson, “K-Nearest neighbor,” Scholarpedia, vol. 4, no. 2, pp. 1883, 2009. [Google Scholar]
32. C. Jin, L. De-lin and M. Fen-xiang, “An improved ID3 decision tree algorithm,” in Proc. ICCSE, Nanning, China, pp. 127–130, 2009. [Google Scholar]
33. C. Shah and A. G. Jivani, “Comparison of data mining classification algorithms for breast cancer prediction,” in Proc. ICCCNT, Tiruchengode, India, pp. 1–4, 2013. [Google Scholar]
34. J. P. D. Delizo, M. B. Abisado and M. I. D. L. Trimos, “Philippine twitter sentiments during COVID-19 pandemic using multinomial na¨ıve-Bayes,” International Journal of Advanced Trends in Computer Science and Engineering, vol. 9, no. 1.3, pp. 408–412, 2020. [Google Scholar]
35. C. Villavicencio, J. J. Macrohon, X. A. Inbaraj, J. Jeng and J. Hsieh, “Twitter sentiment analysis towards COVID-19 vaccines in the Philippines using na¨ıve Bayes,” Information, vol. 12, no. 5, pp. 204, 2021. [Google Scholar]
36. S. Wei, C. Xuan, Z. Xiaorui, D. Guangzhao, C. Pengshuai, et al., “A multi-feature learning model with enhanced local attention for vehicle re-identification,” Computers Materials & Continua, vol. 69, no. 3, pp. 3549–3561, 2021. [Google Scholar]
37. W. Sun, G. C. Zhang, X. R. Zhang, X. Zhang and N. N. Ge, “Fine-grained vehicle type classification using lightweight convolutional neural network with feature optimization and joint learning strategy,” Multimedia Tools and Applications, vol. 80, no. 20, pp. 30803–30816, 2021. [Google Scholar]
Cite This Article
 Copyright © 2023 The Author(s). Published by Tech Science Press.
This work is licensed under a Creative Commons Attribution 4.0 International License , which permits unrestricted use, distribution, and reproduction in any medium, provided the original work is properly cited.
 Downloads
 Citation Tools