
 Submit a Paper
 Propose a Special lssue
 Open Access
ARTICLE
Fault Tolerant Optical Mark Recognition
1 Department of Computer Science & IT, The Islamia University of Bahawalpur, 63100, Pakistan
2 Department of Information Sciences, The University of Education, Lahore, 54770, Pakistan
3 Industrial Engineering Department, College of Engineering, King Saud University, P.O. Box 800, Riyadh, 11421, Saudi Arabia
4 Department of Information and Communication Engineering, Yeungnam University, Gyeongsan, 38541, Korea
* Corresponding Author: Muhammad Shafiq. Email:
Computers, Materials & Continua 2023, 74(2), 3829-3847. https://doi.org/10.32604/cmc.2023.026422
Received 26 December 2021; Accepted 05 May 2022; Issue published 31 October 2022
 View Full Text
 Download PDF
Abstract
Optical Mark Recognition (OMR) systems have been studied since 1970. It is widely accepted as a data entry technique. OMR technology is used for surveys and multiple-choice questionnaires. Due to its ease of use, OMR technology has grown in popularity over the past two decades and is widely used in universities and colleges to automatically grade and grade student responses to questionnaires. The accuracy of OMR systems is very important due to the environment in which they are used. The OMR algorithm relies on pixel projection or Hough transform to determine the exact answer in the document. These techniques rely on majority voting to approximate a predetermined shape. The performance of these systems depends on precise input from dedicated hardware. Printing and scanning OMR tables introduces artifacts that make table processing error-prone. This observation is a fundamental limitation of traditional pixel projection and Hough transform techniques. Depending on the type of artifact introduced, accuracy is affected differently. We classified the types of errors and their frequency according to the artifacts in the OMR system. As a major contribution, we propose an improved algorithm that fixes errors due to skewness. Our proposal is based on the Hough transform for improving the accuracy of bias correction mechanisms in OMR documents. As a minor contribution, our proposal also improves the accuracy of detecting markers in OMR documents. The results show an improvement in accuracy over existing algorithms in each of the identified problems. This improvement increases confidence in OMR document processing and increases efficiency when using automated OMR document processing.Keywords
Optical Mark Recognition (OMR) is a technique used for automatically reading the user input in surveys, questionnaires, interviews and examination systems. It is also called a “mark sensing” technique, in which marks of the users on paper are sensed automatically by counting the black pixels of the area inside the circle on a document. Being an automated system, it is very fast, accurate and time efficient as compared to manual evaluation of a user input. An OMR system is very important for an organization and the efficiency and accuracy of the staff is greatly increased by adopting this system [1]. In an OMR system, a template is created and copies of that template are printed. Each copy is distributed among users from whom input is expected. Users fill the designated empty circles on paper sheets, which are then collected and scanned. The scanned images are passed through an OMR algorithm, which identifies the filled circles and generate results.
Mark recognition technology has been studied since 1950s. In early techniques, users were required to fill circles on a document using graphite pencils, while sensing brushes were used to sense the number of graphite particles in an area. An improvement in technology came in 1970s, when dedicated OMR machines were designed to project light on special sheets [2]. Filled circles would allow only partial light to pass through them, thus a light intensity contrast to empty/unfilled circles was created. Sensors would detect this contrast to identify filled circles [3]. Main disadvantage of these types of machines was that if someone wants to change the layout/template of the OMR sheet, he needs to change the hardware as well, and hence creating a new layout/template of OMR sheet requires changing the position of light sensitive sensors as well as some layout changes also requires increase or decrease the number of sensors and hence, changing the layout/template of OMR sheet was not an easier task at that time. Those machines were costly and having high maintenance cost.
As technology improved with the passage of time, OMR was introduced using ordinary image scanner and using the ordinary desktop PC, which was used to scan the OMR sheet and convert into digital image [4]. This method of OMR is still very popular and is being used in OMR in different institutions worldwide. The digital image obtained during the scanning process is analyzed by algorithm and circles on the images were identified. Advantage of using optical image scanners was, changing layout/template for OMR sheet become lot of easier, and there was no need to change the hardware or position or number of light sensitive sensors. All we need to change the software in order to change the template of the OMR sheet. Some work in the literature also describes a method for dynamic OMR template mechanism. Dynamic OMR template discussed in literature does not need to change the software or hardware.
There is need of some preprocessing of OMR sheets after scanning them from optical scanner. Preprocessing of the OMR sheets involves skew correction, deviation removal and noise removal. Then by using image processing techniques on the document, filled and empty circles are identified by the algorithms. In this method OMR template can be created ordinary word processor software like Microsoft Word (Windows), Pages (Mac OS X) or Libre Office word processor (Linux) or it can also be created using image processor program like Adobe Photoshop, Gimp etc. This technique was very dynamic, changing of the template does not require changing in the hardware, and hence it is very easy to design template and use that custom designed template in OMR.
A digital image is a combination of pixels, Pixel projection method was introduced in 1999 in order to detect user input during the OMR by using ordinary scanner and a desktop PC [4–7]. Dynamic template generation algorithm was introduced which does not need change hardware as well as software [8]. Process of designing the OMR template and the processing of OMR sheet with some variations was discussed in [9–13]. An efficient method of skew detection in printed documents using horizontal and vertical projection method has been implemented [11]. Bold border was used instead of corner angles or circles as anchor points [9,14], they called it “pattern finder”. Special pattern boxes technique on three corners of the OMR sheet was used to detect anchor points of the OMR sheet [10]. Horizontal and vertical flag points were also placed at regular intervals in the template in addition to special pattern on the three corners of the OMR sheet. Square boxes on the corners were introduced on the four corners of OMR sheets were introduced in order to detect anchor points [12]. Multi-mode operations were used for OMR [4]. Two modes were added in the OMR process. First mode is called learning mode in which they have used image processing to detect horizontal and vertical lines in the OMR sheet and calculate their cross out points so that the rectangles with Region of Interest (ROI) can be created. Their second mode is called operation mode, in this mode they have counted number of black pixels in each circle.
Another technique in an OMR system is the use of OMR sheet image registration with the correct answer sheet image registration [15]. Base image, also called correct answer key image and the student’s OMR sheet are scanned. Both images were aligned at same angle by using image processing techniques. After both images are aligned, images were cropped to avoid unnecessary computation. Square of pixels in base image is multiplied by the square of pixels in answer sheet image, and hence a third image is created in the result. In the resulting image, only correct answers are drawn. Incorrect answers are skipped during the multiplication operation. Some performance improvements by paralleling of tasks or images over multiple core processors have been achieved [16]. They have distributed tasks like preprocessing & border detection, bubble detection and feature extraction among multiple cores in a processor. Thick border around the OMR template was used in order to detect and correct tilted or skewed images [17]. Vertical scan lines were used at a distance of every one hundred pixels to find out the skew in the border. Algorithm tries to find out first block of black pixels in the template while finding out the skew angle. Gamera framework written in Python was implemented to detect marks in the OMR sheets [18]. Flag points were printed during the process of OMR template and later on flag points were used for the detection of optical marking circles during the processing of the OMR sheet [19].
OMR can be implemented using a phone camera instead of optical image scanners [20]. A regular PC webcam is used to draw a low-cost, Hough transform Algorithm based solution for an OMR system [21]. A bold vertical bar was used in the center of the OMR sheet for the purpose of skew detection and correction using mobile phone camera [22]. Accuracy of OMR was improved by applying perspective correction of images [23,24], by using black squares in the template to find out the corners of ROI in an image. A new OMR system was developed that can recognize MCQs using mobile phone camera [16,25,26]. Some work on alignment, scale, skew of OMR Sheet has been done [27]. ROI is searched by using a neighborhood rule and pattern recognition process. Method of training and classification has been used to improve the accuracy of scanner-based OMR [28]. Open source software called “FormScanner” is also available [29].
A framework for OMR using Octave script was implemented [30]. Another method by using Canny Edge Detection is introduced in OMR [31–34] in order to detect lines and the position of circles [35]. In order to improve accuracy over Canny Edge Detection Method artificial vision is used for the corrections of de-shaped circles filled by the students [36]. Square boxes were used on the four corners of the OMR sheet for the skew detection and correction; however, circles were detected without template and predetermined positions of circles.
Open CV (an open source image processing library) was used to extract ROIs (Regions of Interest) [37], then cropping region of every question and then the algorithm performs recognition of answers. Web cam was used instead of optical image scanner for Optical Mark Recognition [38] and training phase was introduced in which shape based matching approach is used to sense the marking in OMR sheet. Some issues were discussed [39] that can come up at the stage of scanning of OMR sheets. OMR was used in the Ballot process of elections in United States [40]. OMR sheet evaluation by using two phase system (training phase and recognition phase) along with Modified Multi Connect Architecture is introduced [41].
Field Programmable Gate Array (FPGA) was being to improve the speed of OMR [42]. In this work, speed up to 50,000 pages per hour can be achieved using a high-resolution CCD linear image sensor. Another OMR system with ordinary web cam was created with the help a conveyor belt which was controlled by a micro-controller [43]. Radon Transform method was used to detect and fix the skew angle for the handwritten documents [44]. Template matching technique during the prepossessing of images and later on perform AND operation between the template and the captured image to identify the marked positions [45].
Issues came up and how they affect accuracy of OMR is discussed in the literature [46]. A new OMR System introduce which does not need parameters, hence their system does not require specific templates in order to work, and their system is completely dynamic [47–49]. Realtime webcam-based OMR system is implemented [50]. Identification of the sheet is also very important phase, and is explained along with the OMR process [51,52]. Tampering detection of the identification of the sheet is done [53]. OMR process using method of the canny edge detection and finding counters is done [54].
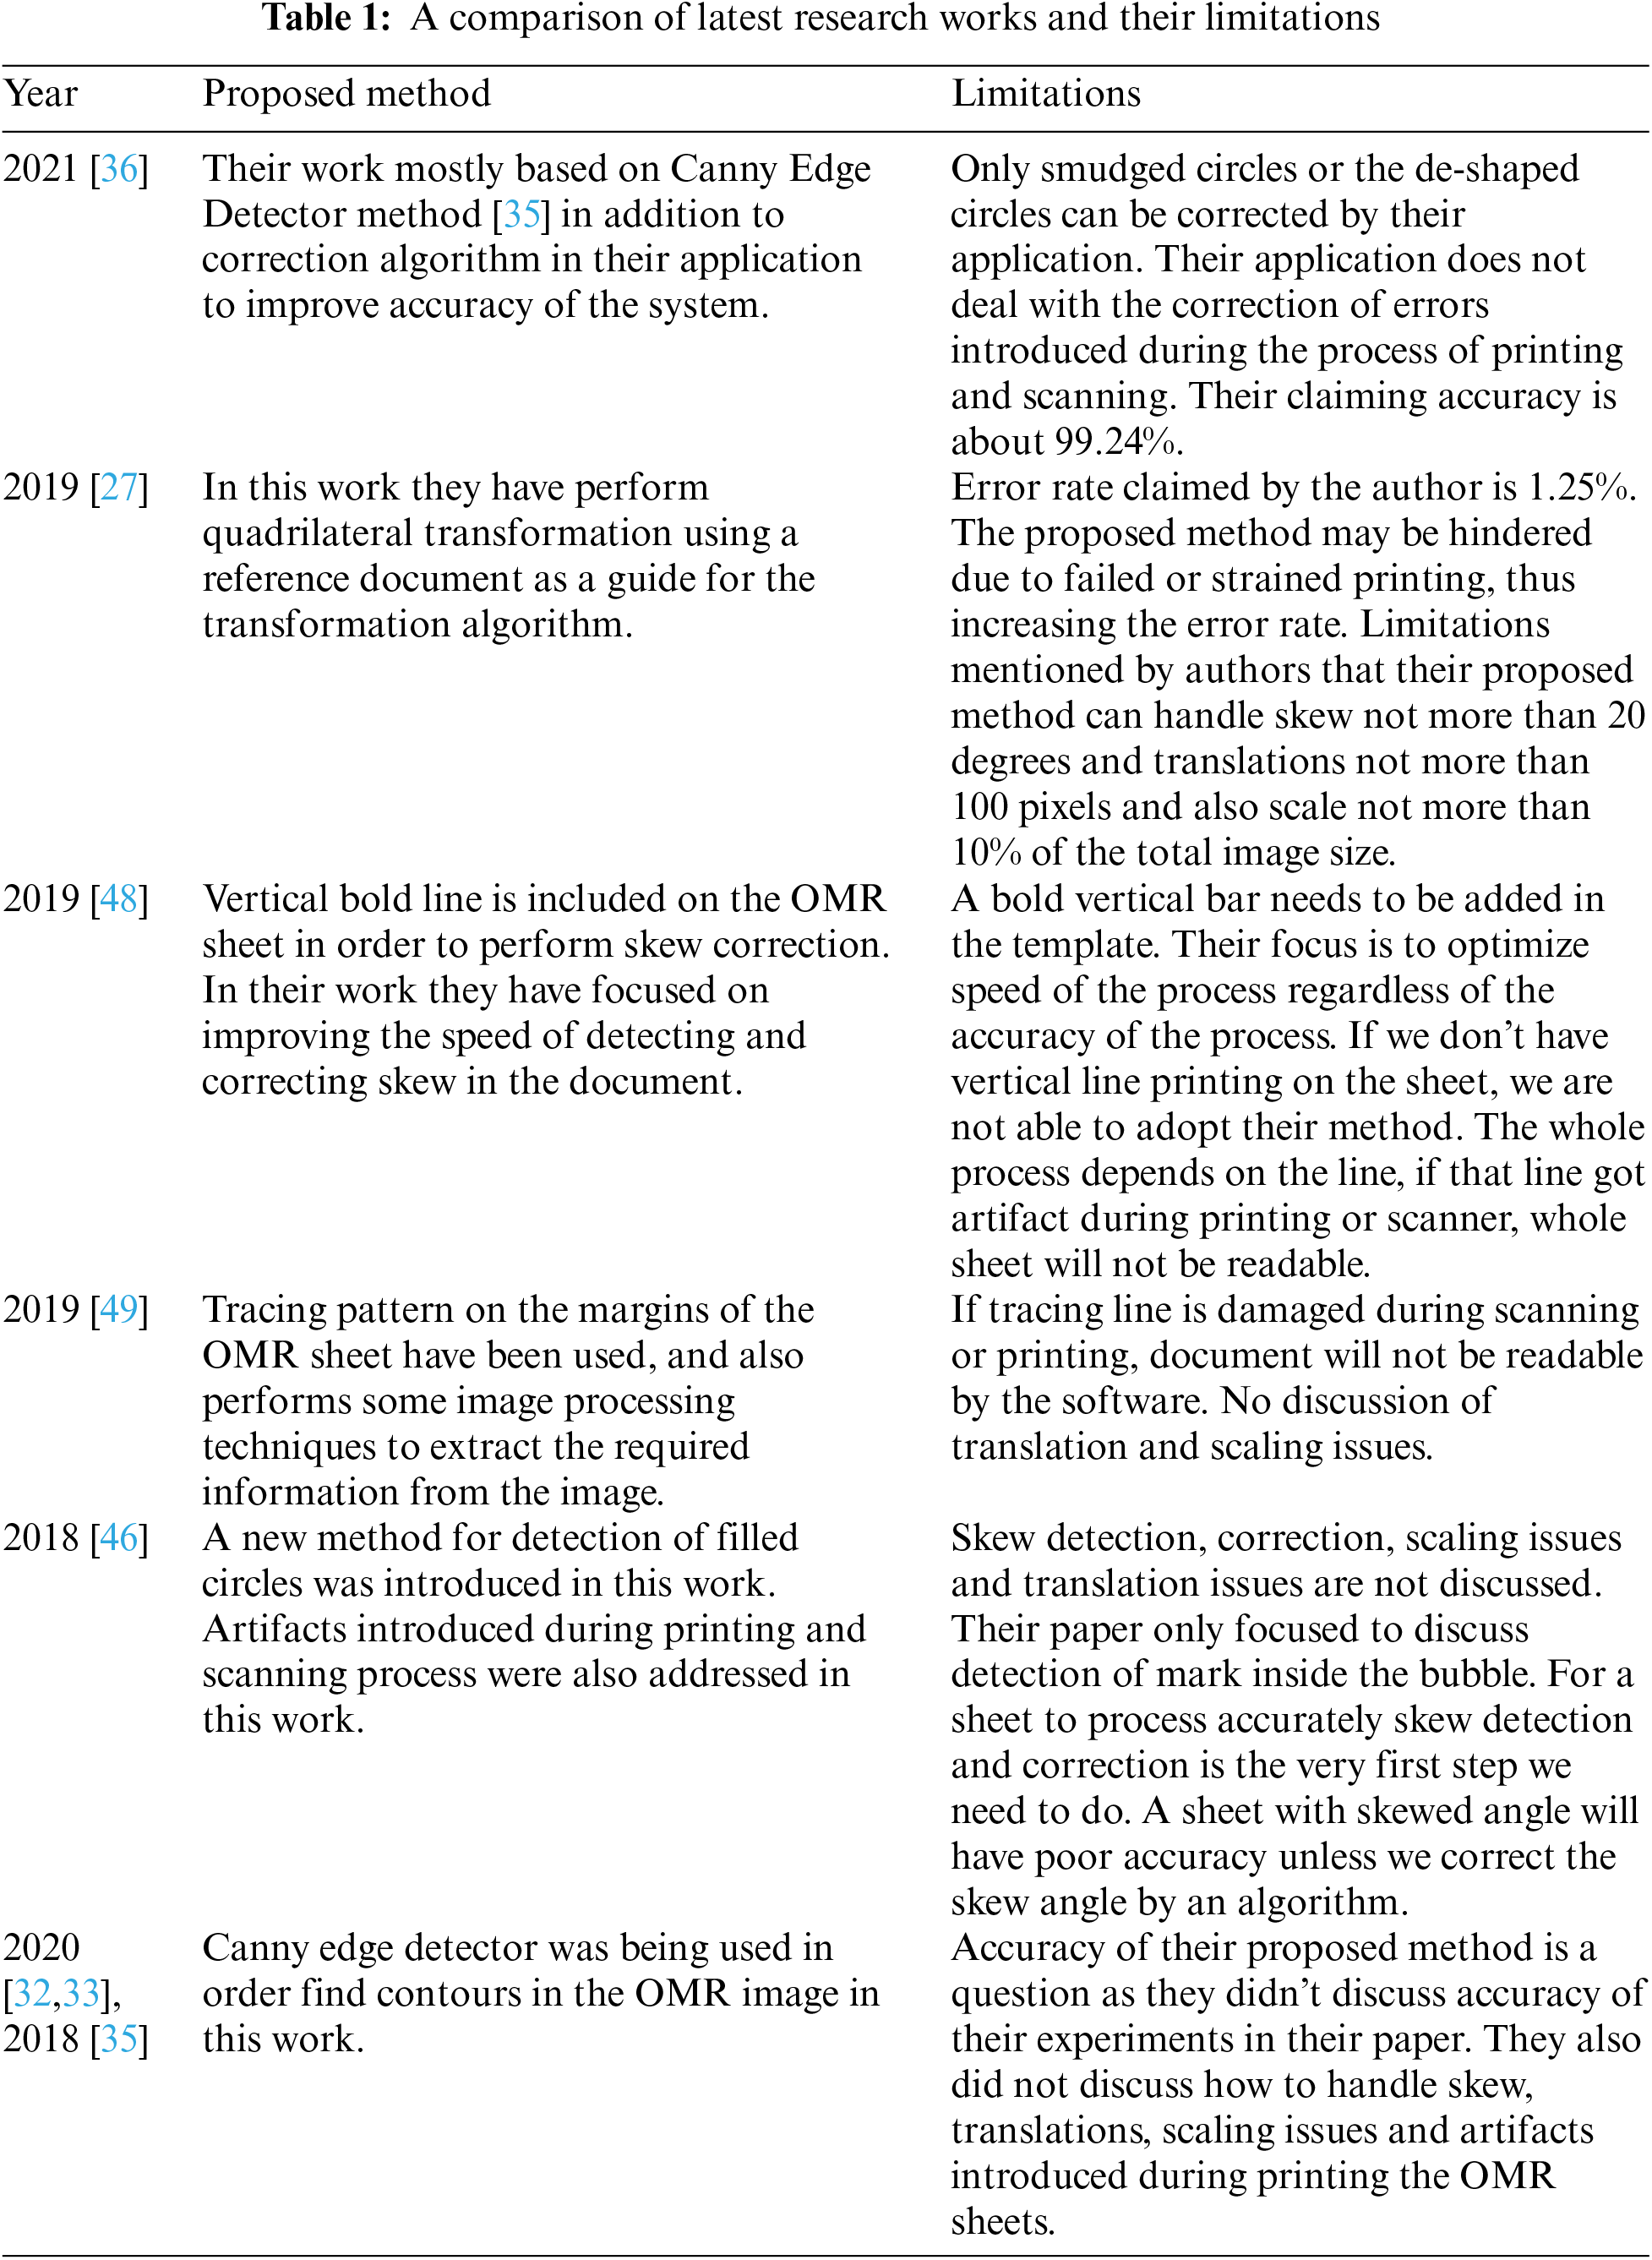
In this work we have address problems, how to detect skew angle if OMR sheets have missed information? Information may be missed due to folded, torn, poorly printed and artifacts induced due to mishandling of paper during the scanning and printing process. How to perform skew correction in the above case? How to detect circles with distortion, and how to reduce the error rate with the sheet missing information? We have shown the comparison of related works with their limitations in Tab. 1.
This paper is organized in such a way that introduction is described in Section 1. Complete process of OMR system and the possible reasons of the issues coming in the OMR system is explained in Section 2. Two of the most popular methods of OMR with minor variations in the literature are explained in Subsections 2.6 and 2.7. Section 3 is explaining the proposed system. Section 4 will discuss how the experiments are performed and their results.
In this section we will discuss the complete process of an OMR system in detail. Following steps are involved during the process of an OMR
2.1 Creating OMR Templates and Printing of OMR Sheets
In first step OMR template is created by using word processor software or an image processor program like Adobe Photoshop, Gimp etc. Printing press or a printer can be used to print OMR sheets. One of the basic requirements of OMR template in literature is to add special shapes at four corners of the OMR document. This shape can be angle bracket, solid square, thick circles, or a special pattern. Instead of four corners, dotted border or thick border can also be used. These corner points are used in stage D or during the processing of images. Usually, size of bubble is 30 pixels, which is not mandatory.
• We noticed two types of issues during the printing of OMR sheets at larger scale. Special quality control is required when printing at large scale.
• Due to normal wear and tear in the mechanical parts of the printer and rolling mechanism in the printer, some deviation is introduced in the printed OMR sheets. Current methods of OMR in literature need printing to be pixel perfect for an acceptable level of accuracy in the OMR system.
• When printing OMR sheets at larger scale printer’s drum may get dirty and hence leaving noise or lines on the OMR sheet.
• Another issue we found was miss-printed areas on the OMR sheets when printing at large scale.
2.2 Printing, Distributing and Getting User Input
In this step, the printed sheets are ready to distribute to the users to fill the marks. The circles are filled by students. There are three possible cases where student can fill the circles.
• All circles are filled by student.
• Circles are not filled completely (partially filled circles)
• Circles are not filled accurately; the mark either moved to right or left side of circle.
• All circles are empty by students.
• Normal filled circles by students.
After filling the marks by users, sheets are collected and send to the scanners where operators will scan the sheets and convert them to digital images. OMR sheets are handled by humans, so OMR sheets can be folded and torn during the whole process of OMR. Current research methods/techniques are not able to process those OMR sheets that are having sufficient information to read the marks.
In this step, some preprocessing of images is done. First of all, skew angle is detected and later on corrected. After skew angle correction the image is converted into black and white using a threshold value i.e., 127. Image is converted into black and white to reduce the complexity of the processing of images. Performance of the algorithm also increased due to this conversion. Some other corrections will also be done at this stage like deviation correction, noise removal.
Current research methods used in the OMR system are not able to identify skew angle and hence they can’t correct the skew angle, in case if the OMR document is worn out or tilted or it if the OMR sheet is skewed more than an acceptable angle. The document that cannot be detected by the skew detection mechanism used in OMR system is not able to extract student’s responses from the document. Most of the researchers have used skew detection, and calculation method as shown in Fig. 1 [12].
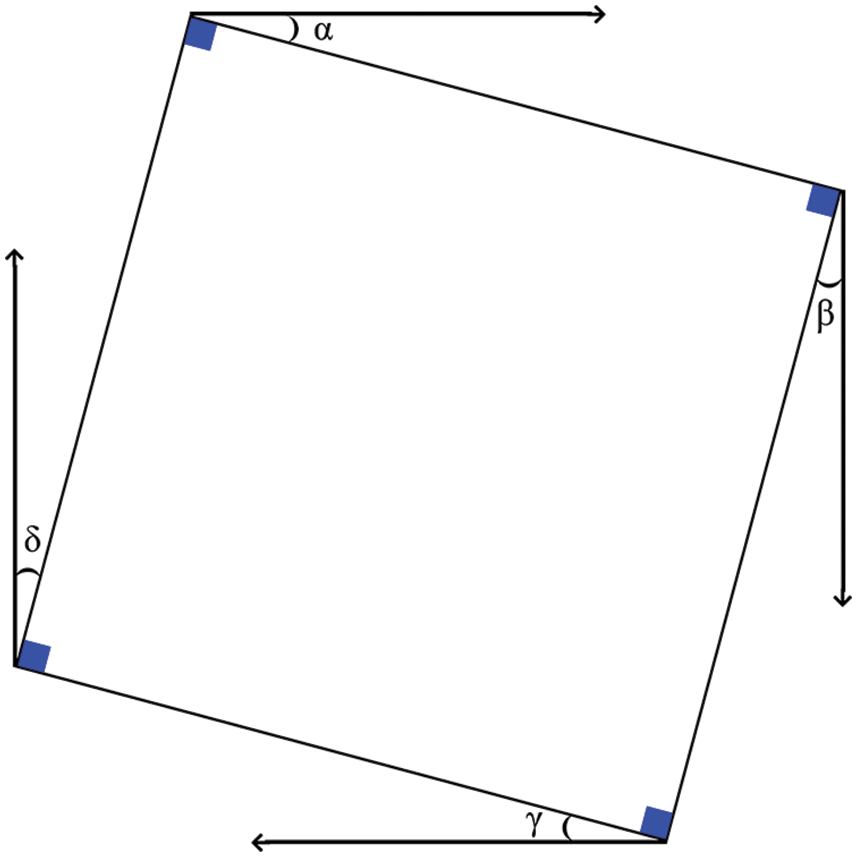
Figure 1: Calculation of tilt/skew angle
Let
is a Pythagoras theorem, where c is the length of the hypotenuse in a triangle and a and b is the length of two other sides of a triangle.
2.4 Skew Detection and Correction
A digital image is a collection of pixels horizontally and vertically aligned. Each pixel is denoted by an address like P (X, Y), where P is representing the pixel and X is the number of pixels on X-Axis and Y is the number of pixels on Y-Axis.
During the processing of OMR sheet, current research methods scans anchor points (circles or angle brackets) in the image and their address is used by the algorithm as a starting point. These anchor points are used in skew detection and correction mechanism.
2.5 Processing of Filled Circles
At this step, location of the circle in the image is scanned by the algorithm in order to determine the actual response of the user. The accuracy of the OMR system actually depends on this step, how the algorithm efficiently calculates the position of the circle. If an algorithm scans an area which is not a circle, however it is supposed to be, then the accuracy of the OMR system is compromised.
If we classify the methods used in OMR system, there are two methods for calculating the positions of the circles are being used in the literature.
2.6 Using Predetermined Position of Each Circle
First method basically uses predetermined positions of the circles. In this method position of all circles are stored in a file at the time of creating a new template. This position is stored as P (X, Y) in the file, where X is the number of pixels on horizontal axis, and Y is the number of pixels on vertical axis. Positions of these circles can be stored in XML (Extensible Markup Language) file, JSON (JavaScript Object Notation) file or it can also be store in database. The position P (X, Y) is relative to the anchor point. In most of the cases top left anchor is used for the relative positioning. For example, a circle position is P (10,15). This means that the distance of circle from top left anchor point is 10 pixels on X axis and the distance of circle from top left anchor point is 15 pixels on Y axis.
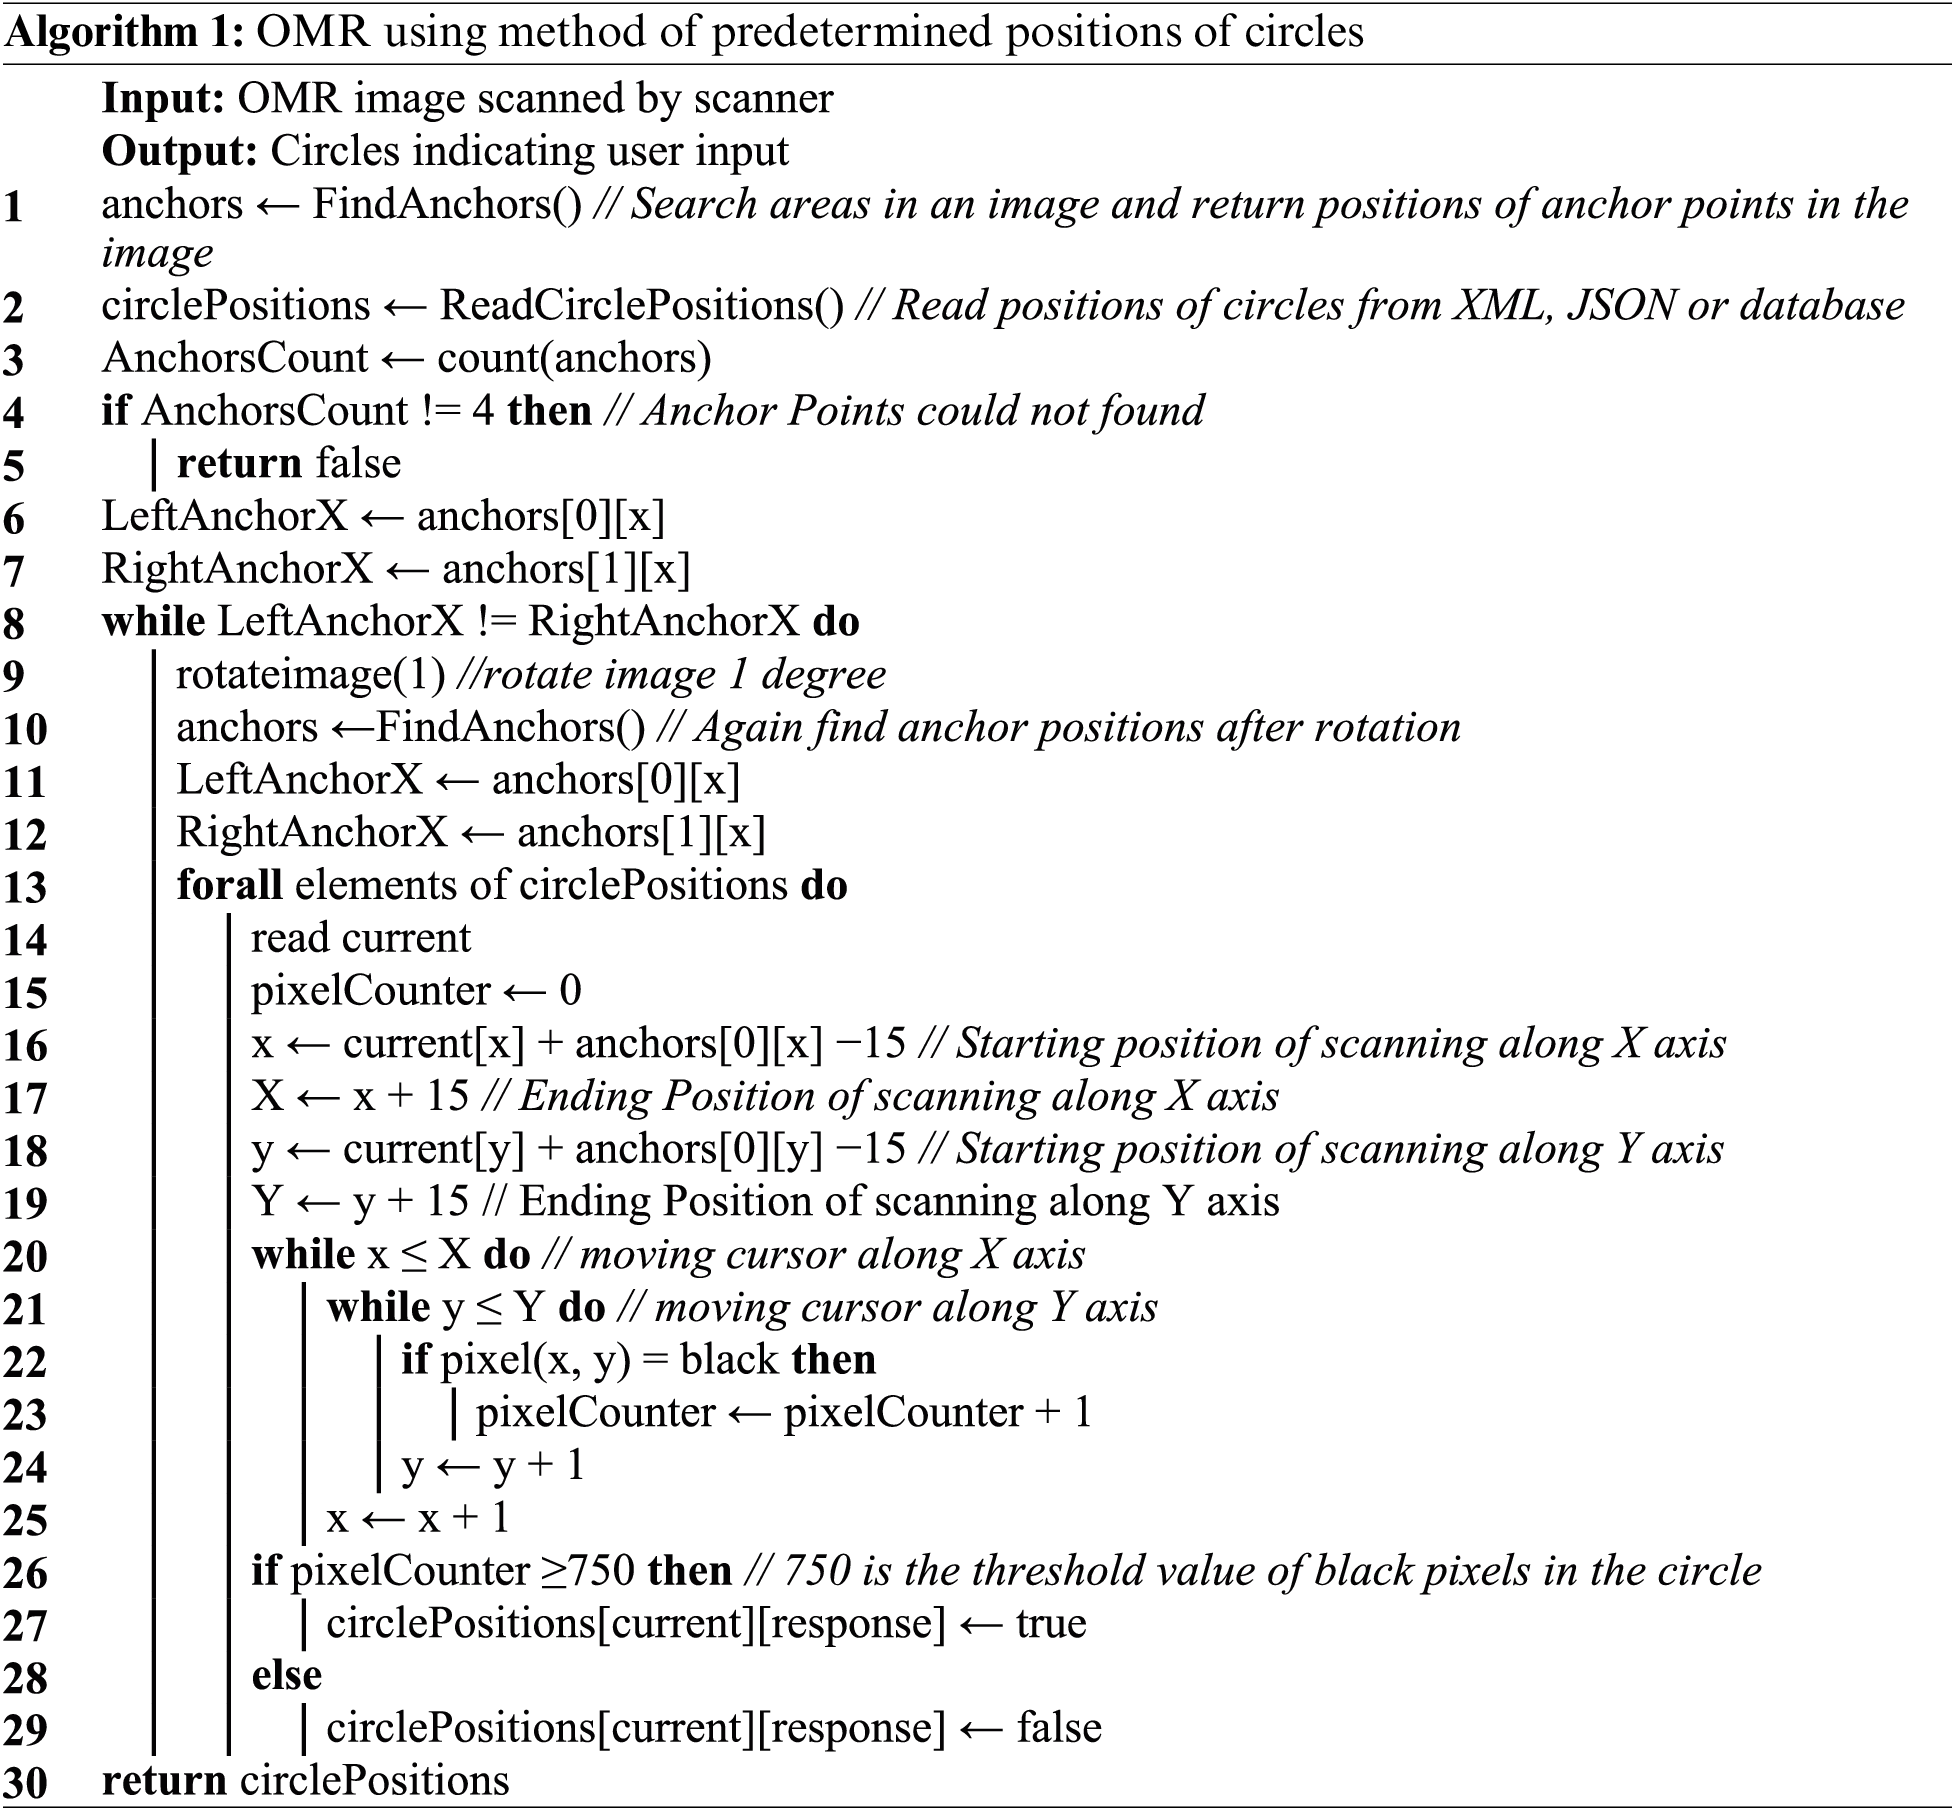
At the time of processing of an individual circle, position of the four anchor points on the corners of the document are search by algorithm. Pattern matching techniques are used for this purpose. The processing algorithm will consider top left anchor as the starting point and the position of top left anchor is considered as P (0, 0). In this case, the readability of the OMR system heavily depends on the searching of anchor points. If algorithm fails to search the anchor point, further steps cannot be completed. In order to check the response on a circle from the user, position of that circle is retrieved from the file that is containing positions of all circles. Once the position of the circle is retrieved, the algorithm moves its cursor to that position and the algorithm scans
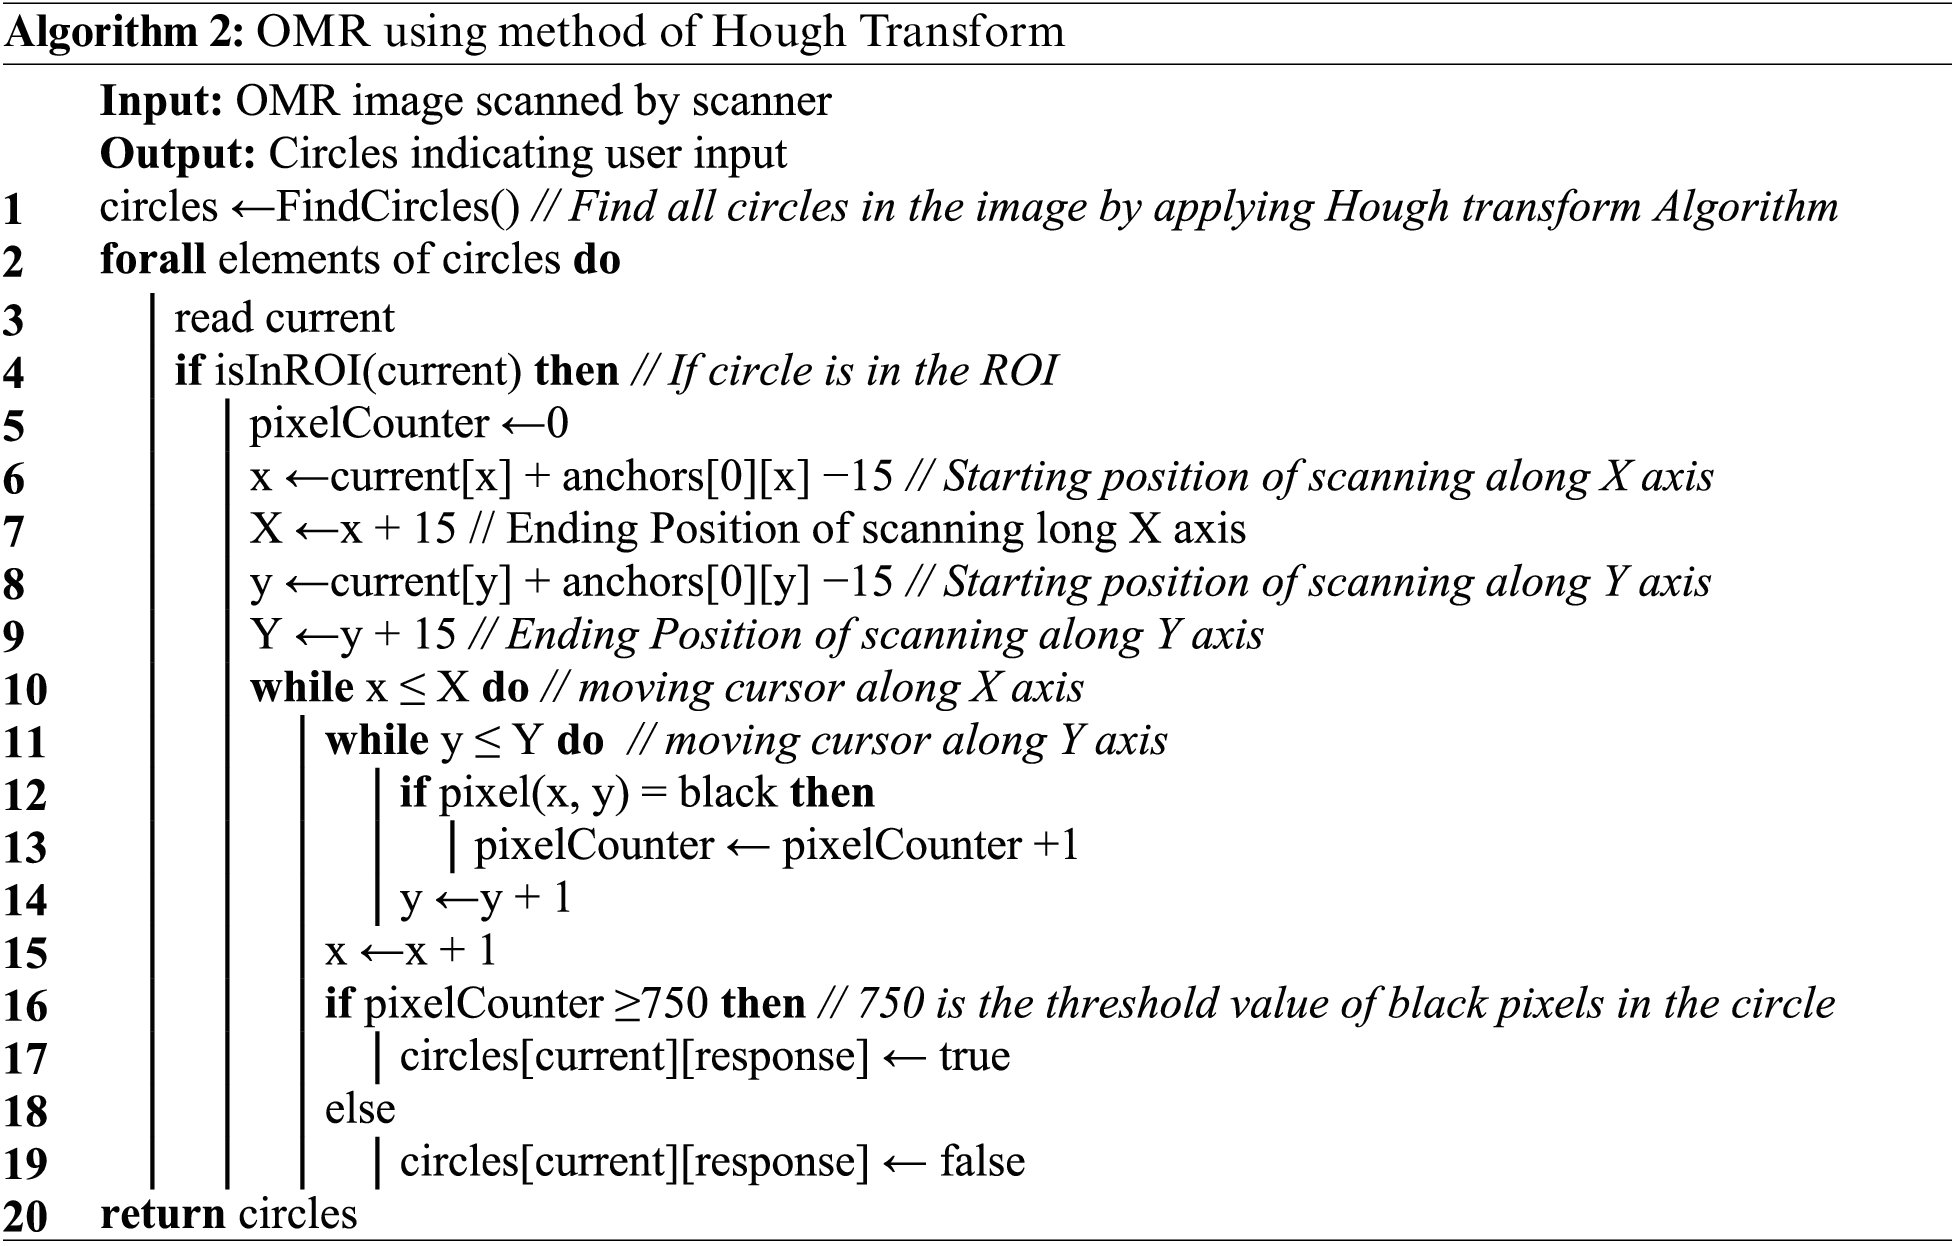
2.7 Use of the Hough Transform Algorithm to Detect Positions of Circles
In this method of calculation of the position of circles is done by the Hough transform Algorithm. This method basically works with the pattern matching technique. Usually in this method whole image is searched for the circles with 30 pixels diameter. This method does not require storing predetermined positions of the circles in a file. All positions of the circles found by the Hough transform Algorithm is stored in memory for further calculations. Once position of all circles in the image are retrieved by the algorithm, it can scan number of black pixels in the circle and if number of black pixels in the circle more than given threshold value, it is considered to be filled by the student.
User response for each individual circle is calculated in the previous step. In this step circles are grouped together in the form of questions. As we mentioned before an MCQ type question typically requires 4 circles and a digit question needs 10 circles. In this step user input is calculated with respect to defined questions. In case of MCQ, user input is compared with the answer key to generate score automatically for each OMR image. In case of surveys and votes, graphs are generated and the results can be stored in database for future use.
When we use conventional methods in the literature of OMR, images having following errors are not readable or having inaccuracy in their results.
2.9.1 E1: One of the Anchor Points are Damaged
This type of error came up when one of the four anchor points are either torn due to mishandling of the papers by students or staff in the examination hall. Anchor point can also be missed due to folding of paper during the printing and the scanning process, or the anchor point can be miss print during the process of printing. Example for E1 is shown in Fig. 2.
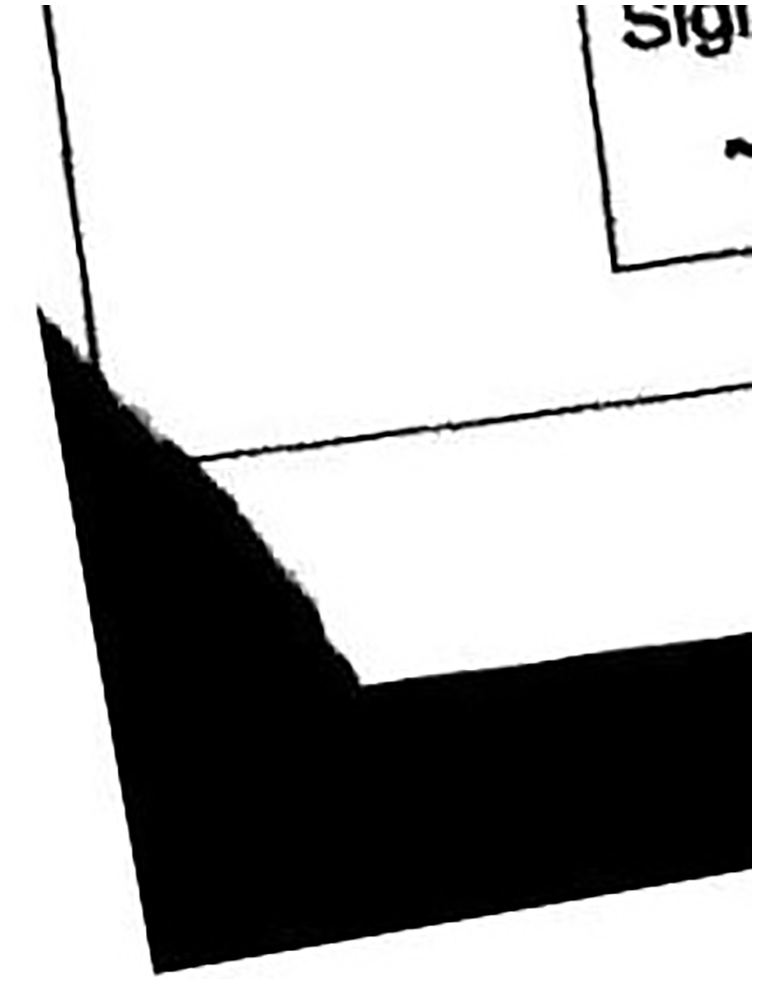
Figure 2: Torn image, from left bottom corner
2.9.2 E2: Image Tilted Beyond the Acceptable Angle
This type of error came up when image is tilted too much and algorithms used to find anchor points in the corners of the image will fail because the anchor point’s shapes get skewed beyond an acceptable angle or the anchor points will be missed during scan due to skew in the document.
2.9.3 E3: Translation Introduced in Images
When a document is scanned, due to mechanical nature of the scanner, a document scanned by a scanner is not pixel perfect with template. Some pixels are translated horizontally or vertically. Printing mechanism in printers is also responsible for translations in OMR system.
Translation of pixels is showing in Fig. 3, where P (X0, Y0) is the original position of a pixel on the template created while P (X1, Y1) is the position of same pixel on the scanned image. Xt is the number of pixels translated on X axis, while Yt is the number of pixels the image is translated on Y axis. Xt and Yt is very minor in most of the cases and is not noticeable with a naked eye, whereas it affects the accuracy of the OMR system if not handled by the algorithm.
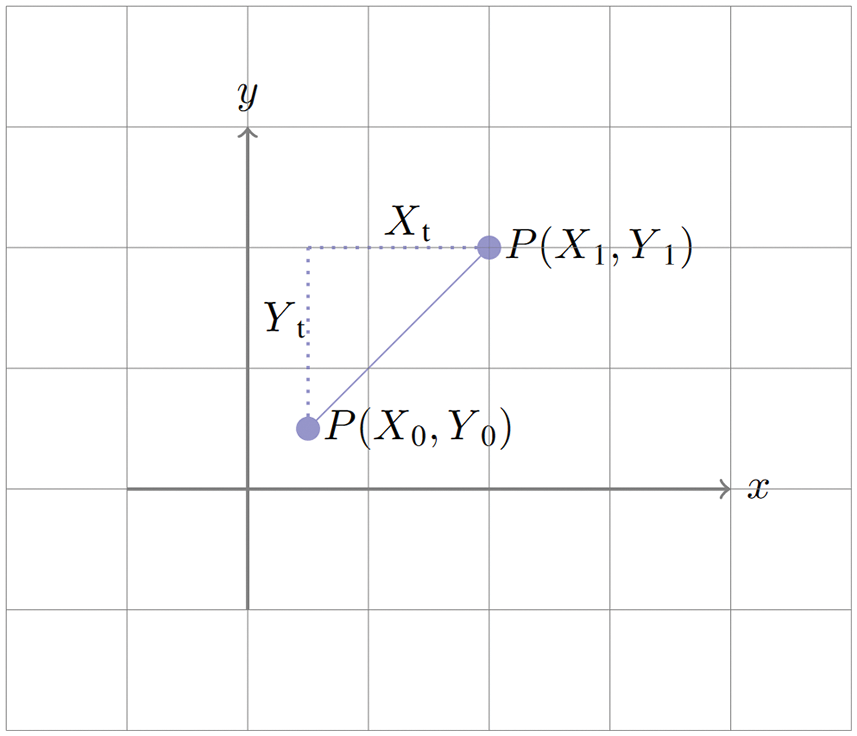
Figure 3: Translation of a pixel on a 2D plane
Fig. 4 is showing an example where the circles of fifth column are de-shaped horizontally as compared to the circles in the first four columns.
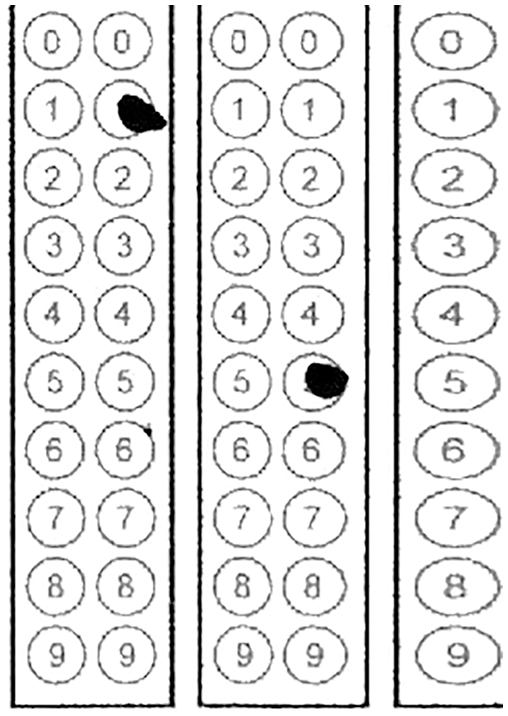
Figure 4: A de-shaped circle due to translation
2.9.4 E4: Artifacts Introduced on Some Points in The Image
Artifacts can be introduced due to students, staff, faulty printer or scanner. In Fig. 5, artifacts introduced on top of four anchor points or borders will result the image unreadable by the OMR algorithm in the current literature.
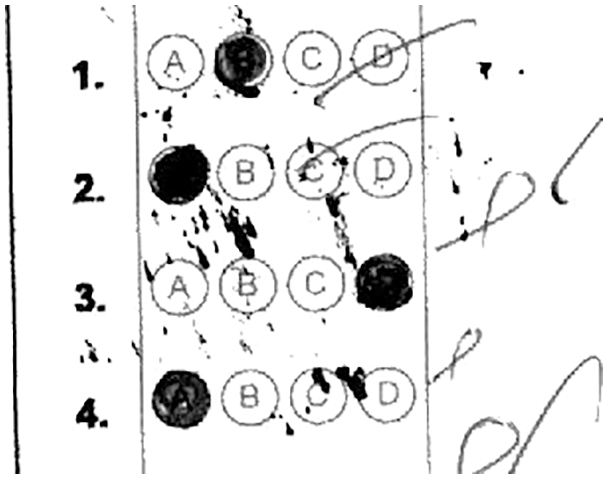
Figure 5: Artifacts introduced during scanning or printing
2.9.5 E5: Overfilled Circle/De-shaped Circle
Some researchers have studied to perform optical mark recognition by finding circles in the document, so if a circle is overfilled it will de-shape the circle, i.e., make it oval. In that case the circle detection algorithm failed to detect the circle and hence accuracy is reduced using the algorithms in literature. Example of overfilled/de-shaped circle is shown in Fig. 6.
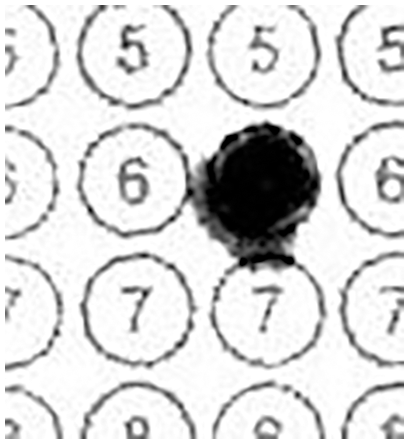
Figure 6: A de-shaped circle due to overfilling
2.9.6 E6: Misprinting of Circle
This type of error came up when a circle is not printed; this usually happens when a printer is having a defective drum or low toner. Example of miss printing is shown in Fig. 7.
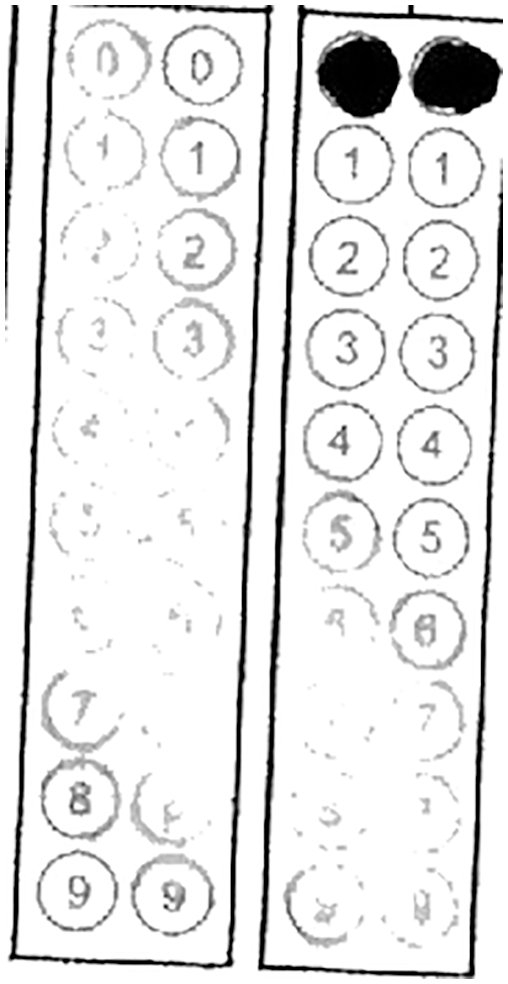
Figure 7: Misprinting of a circle
First step during the process of OMR is to find and fix the skew angle introduced during the process of printing and scanning. In our proposed system the anchor points on the four corners of the document are ignored because if one of the four anchor points are damaged, we cannot find the skew angle. The OMR document is passed through the Hough transform Algorithm. In our case the Hough transform Algorithm is used to identify the position of circles with radius of 15 pixels. After having the position of all circles in the OMR document, an algorithm is used to draw lines from center of the circles. Angle of these lines with X axis will help the algorithm to calculate skew angle using Eq. (2). Skew detection algorithm is explained graphically in Fig. 7. Line A is drawn by combining the center points of the circles identified by Hough transform. Line B is drawn along X axis and hence the angle is calculated by the algorithm between two lines. Using this method, we were able to fix the skew angle of the OMR document without need of the anchor points as shown in Fig. 8.
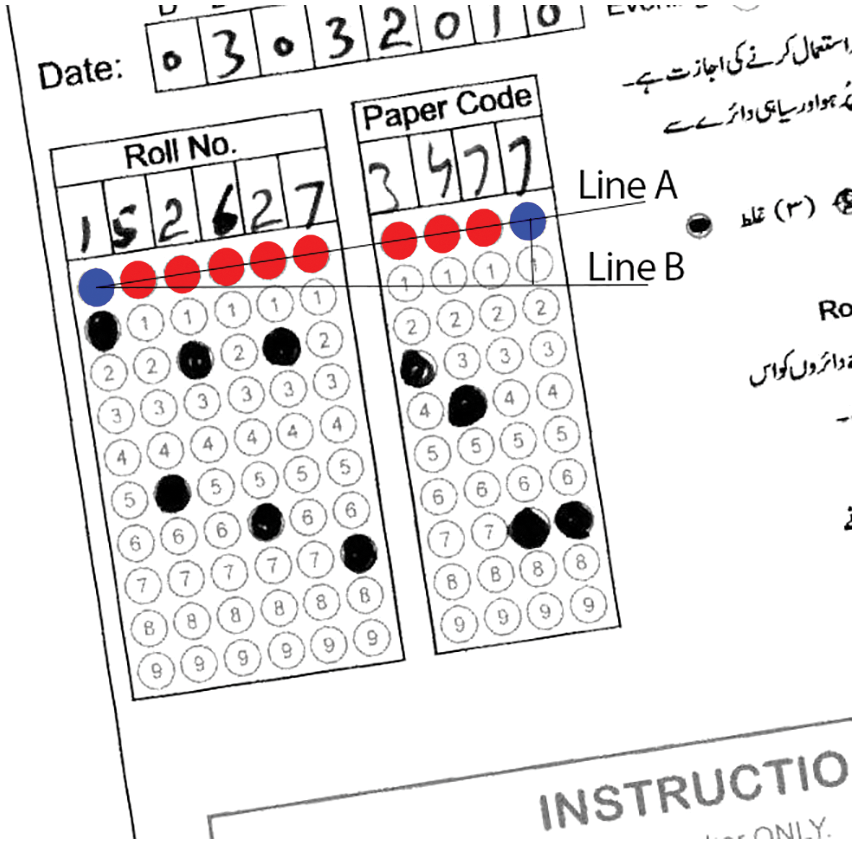
Figure 8: The skew calculation algorithm
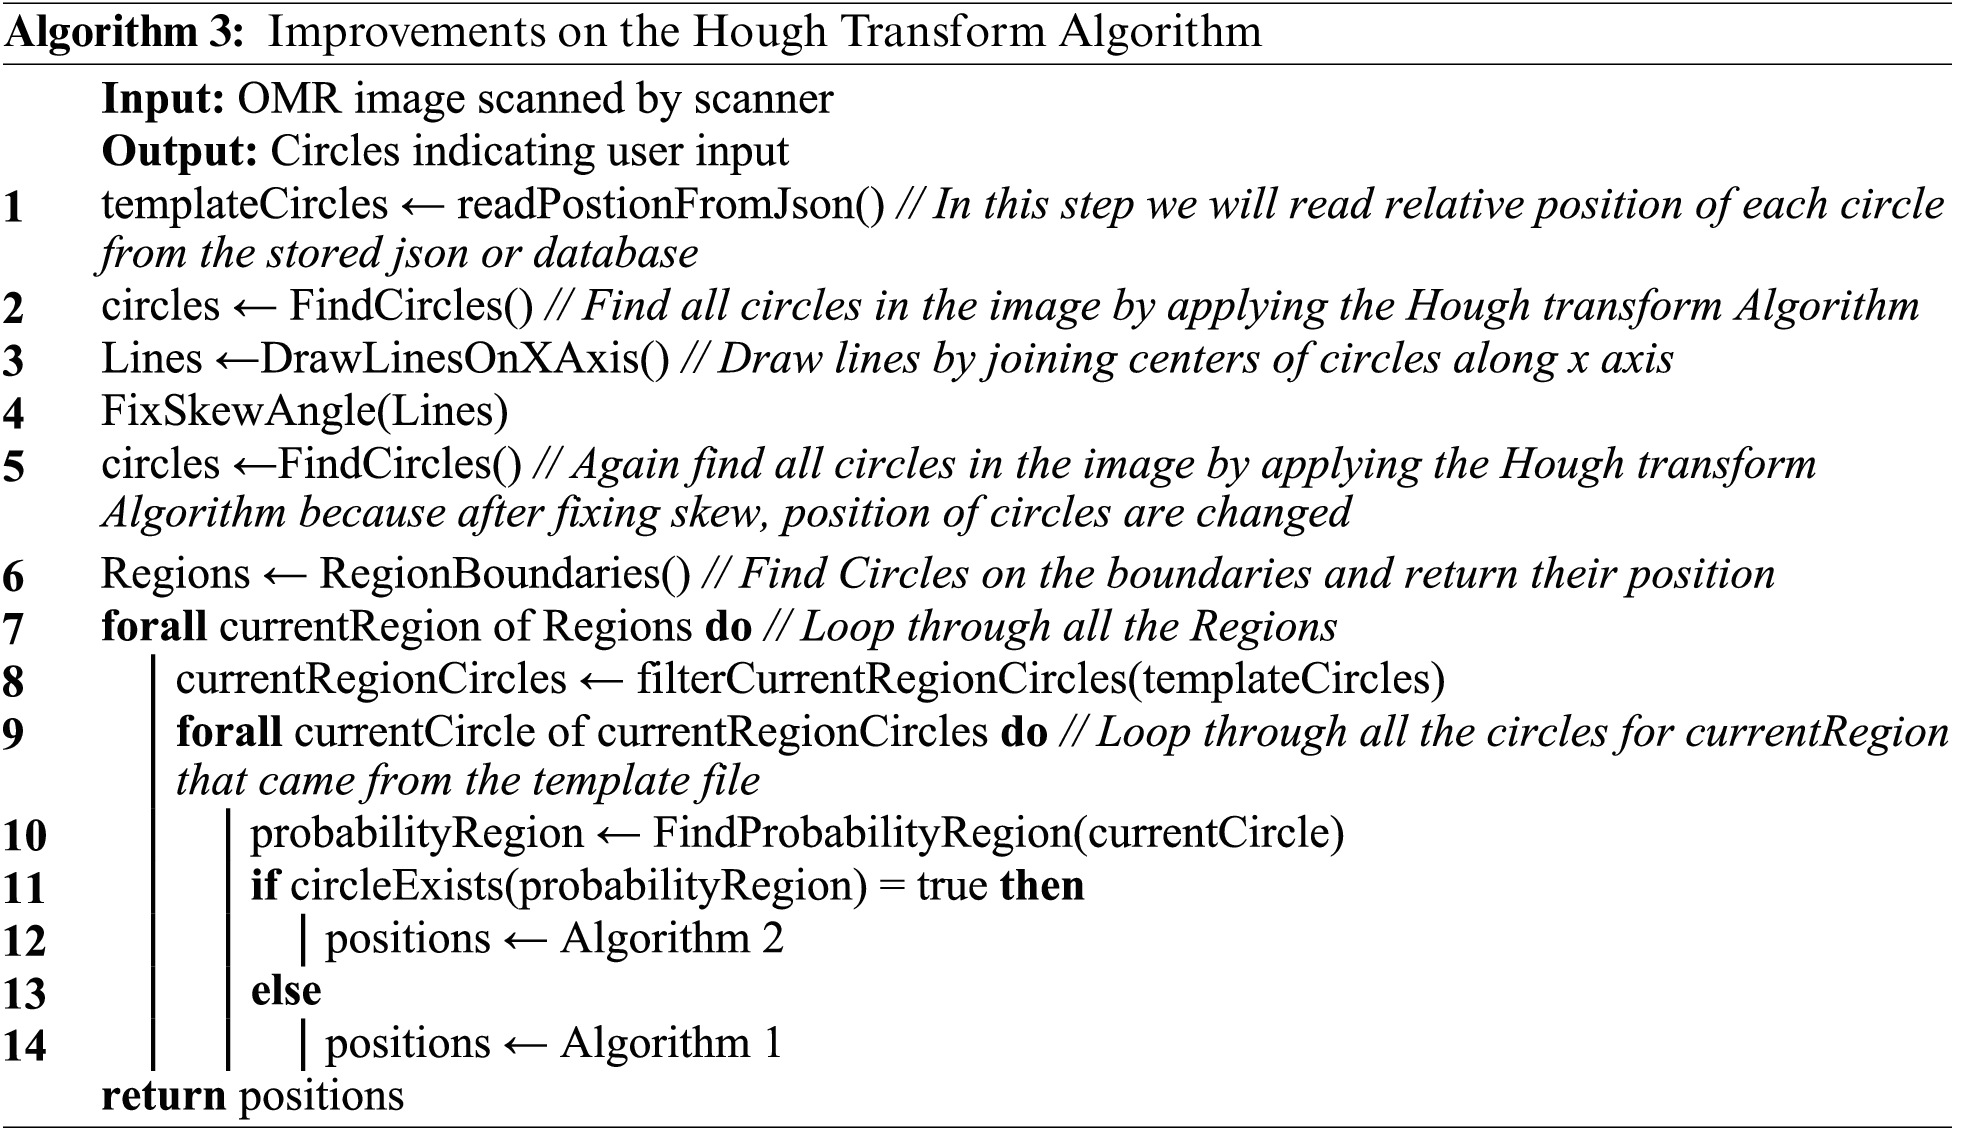
In next step our algorithm tried to find the regions of the circles in the OMR document. A region is usually an area consisting of questions whose circles are located close to each other. In other words, circles in a particular area are grouped together. We divided our OMR document into 4 major regions. First region is for MCQs 1 to 12, second region is for MCQs 13 to 24, third region is for Paper Code, and fourth region for Questions 1 to 10 and Total Marks. Once the regions are defined, positions of circles are found by the Hough transform Algorithm that separates each region. Also, it finds top left circle, top right circle, bottom left circle and bottom right circle in each region, and hence algorithm is able to mark the boundaries of the region. We call these four circles as boundary circles. This is called region detection phase.
Position calculated for the boundary circles in a region are used as reference points for other circles in that region. Now positions of other circles are referred with respect to these four boundary circles. By doing this we have solved the problem of translation for that region. For every circle in the region, we have estimated position of that circle calculated by the algorithm using the JSON/Database file created in first step.
So there came up two types of situations that we need to handle separately.
• If a circle from the Hough transform Algorithm exists within the estimated area then we are having a position of the circle having hundred percent accuracy. The estimated area is given by ± 5 pixels.
• If none of the circle positions are detected by the Hough transform Algorithm within the estimated area in the document, it means the circle is missed by the Hough transform Algorithm. This may happen due to miss printing, de-shaped circle when filling by the student, or the artifact introduced during the process of scanning and printing. In this case we will use the estimated position of the circle calculated by algorithm using JSON/Database. Issues of translation, miss-printing are also improved by the position of boundary circles detected by Hough transform, and hence we are having a better accuracy for the position of that circle.
Once the position of each circle is calculated, the next step performed by the algorithm is to scan the area of 12 each circle to detect whether it is filled by the student or it is an empty circle. For this purpose, our algorithm calculates number of black pixels in that circle. If number of black circles is more than 70 percent of the area of circle in pixels, the algorithm considers the circle to be filled, and if number of black pixels is less than 70 percent then it is considered as empty circle. In the final step, our algorithm matches the student’s filled circles with the correct key of the questions and hence the score for that student is calculated and stored in database.
We have performed experiments on 86,913 sheets filled by the students during an examination. To perform our experiments, we have scanned OMR documents using high speed Canon image FORMULA DR-G1100 scanner, which can scan at more than 200 pages per minute in grey scale mode. Feeding to scanner was in bundles for about 250 sheets per bundle which were not properly aligned in order to test the accuracy of the system. To compare the accuracy of the OMR document we have processed each document through Algorithm 1, Algorithm 2 and finally through our proposed Algorithm 3. Algorithms were implemented using Open CV image library and using command line PHP scripts. A flavor of Linux (Ubuntu) operating system was used during the experiments. Core i3 3rd generation CPU was used coupled with 8 GB of RAM.
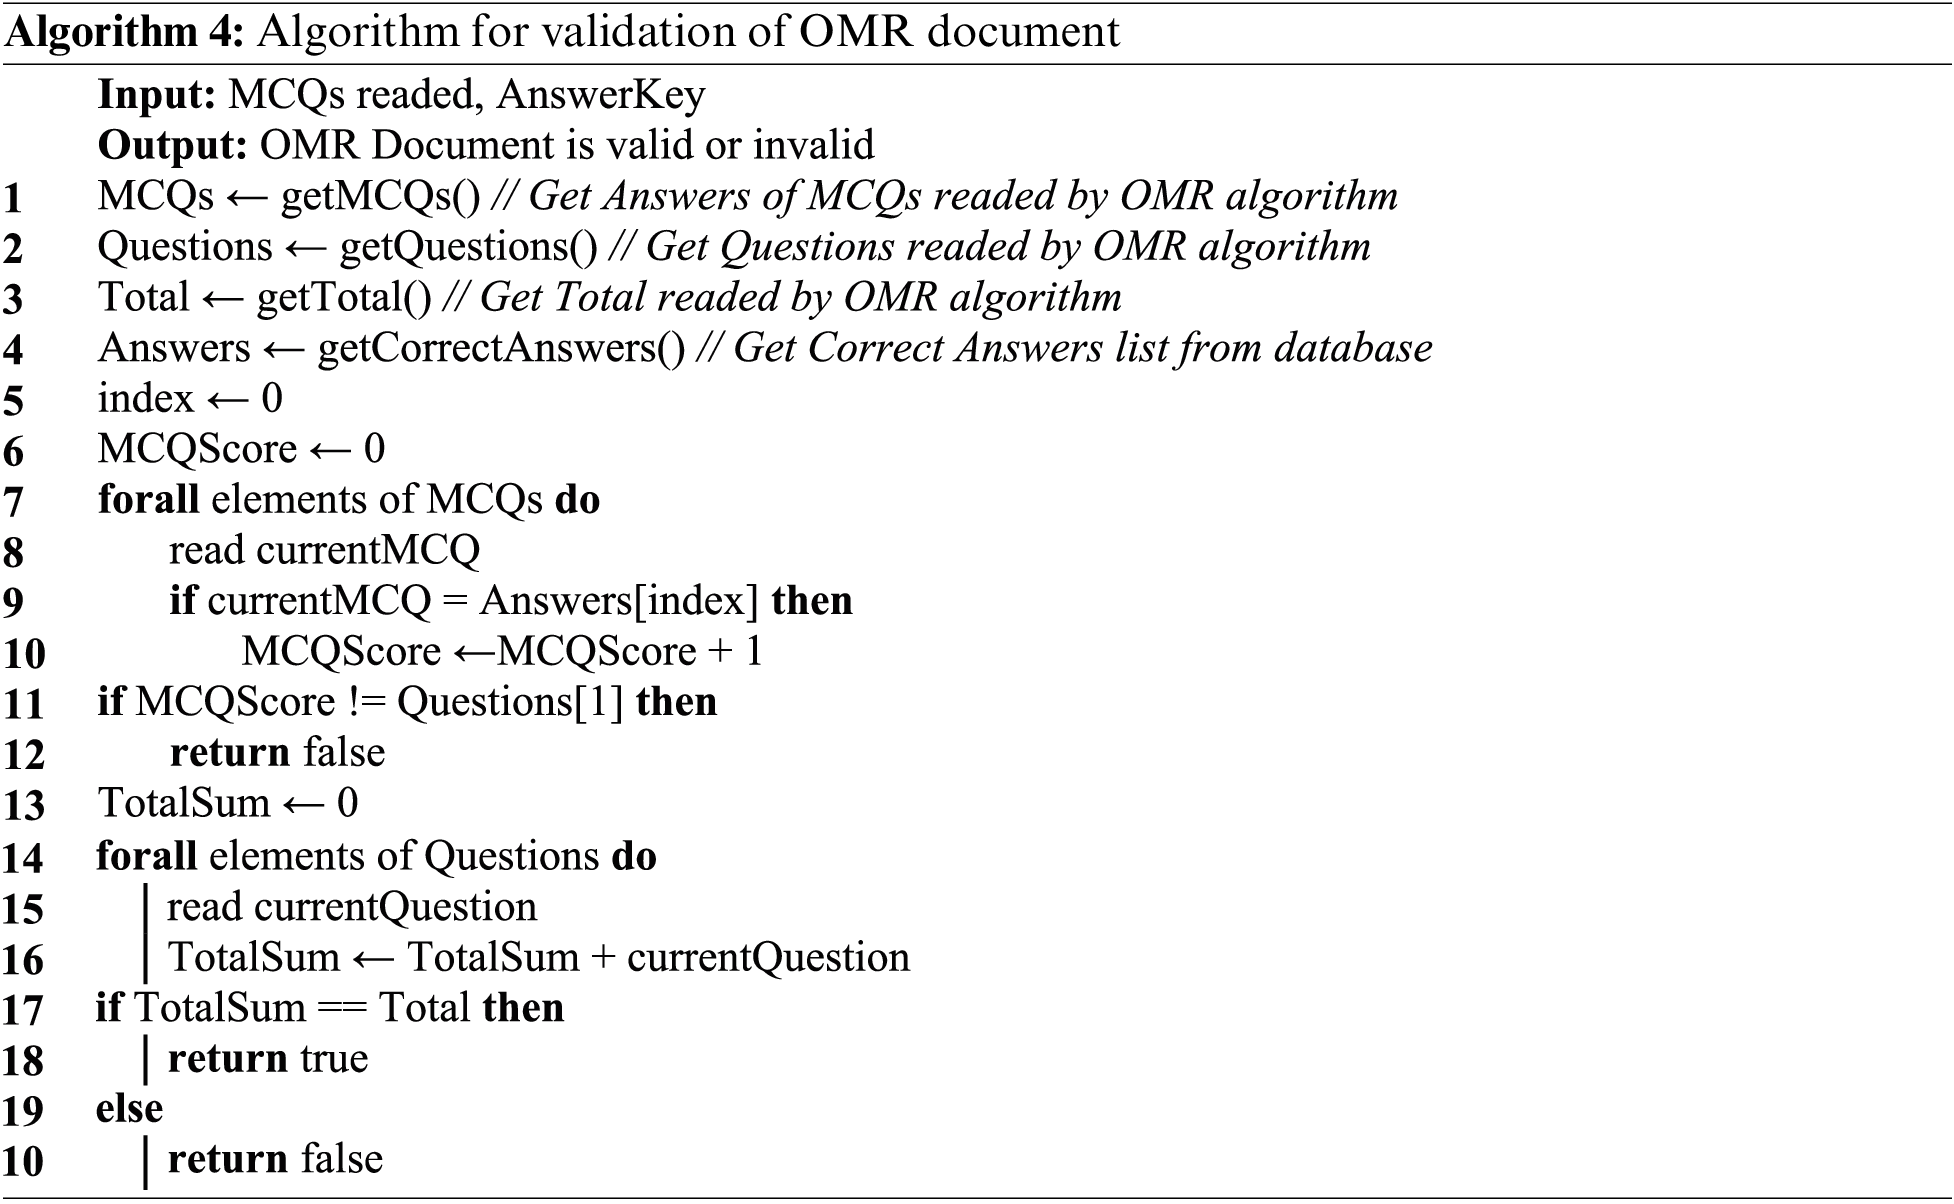
An OMR document is marked as invalid if sum of number of correct MCQs is not equal to MCQs or the or if sum of Question 1 to Question 10 is not equal to Total Marks. In other words, an OMR document is valid only if both Eq. (3) and Eq. (4) are satisfied. The scenario is briefly explained by the Algorithm 4. Documents marked invalid by 4 is a collection of two types of errors (Manual Errors and Software Errors).
Types of all possible manual errors in our experiments are given below.
• If the number of true answers from MCQs is not equal to Q1.
• If sum of Q1 to Q10 is not equal to total marks.
• If two circles are filled in MCQs or any question.
• Circles are filled less than 70% area of a circle.
Types of possible software errors are explained in Section 3. We are more focused on software errors and hence ignoring the manual errors. The details of the results are sown in Tab. 2.
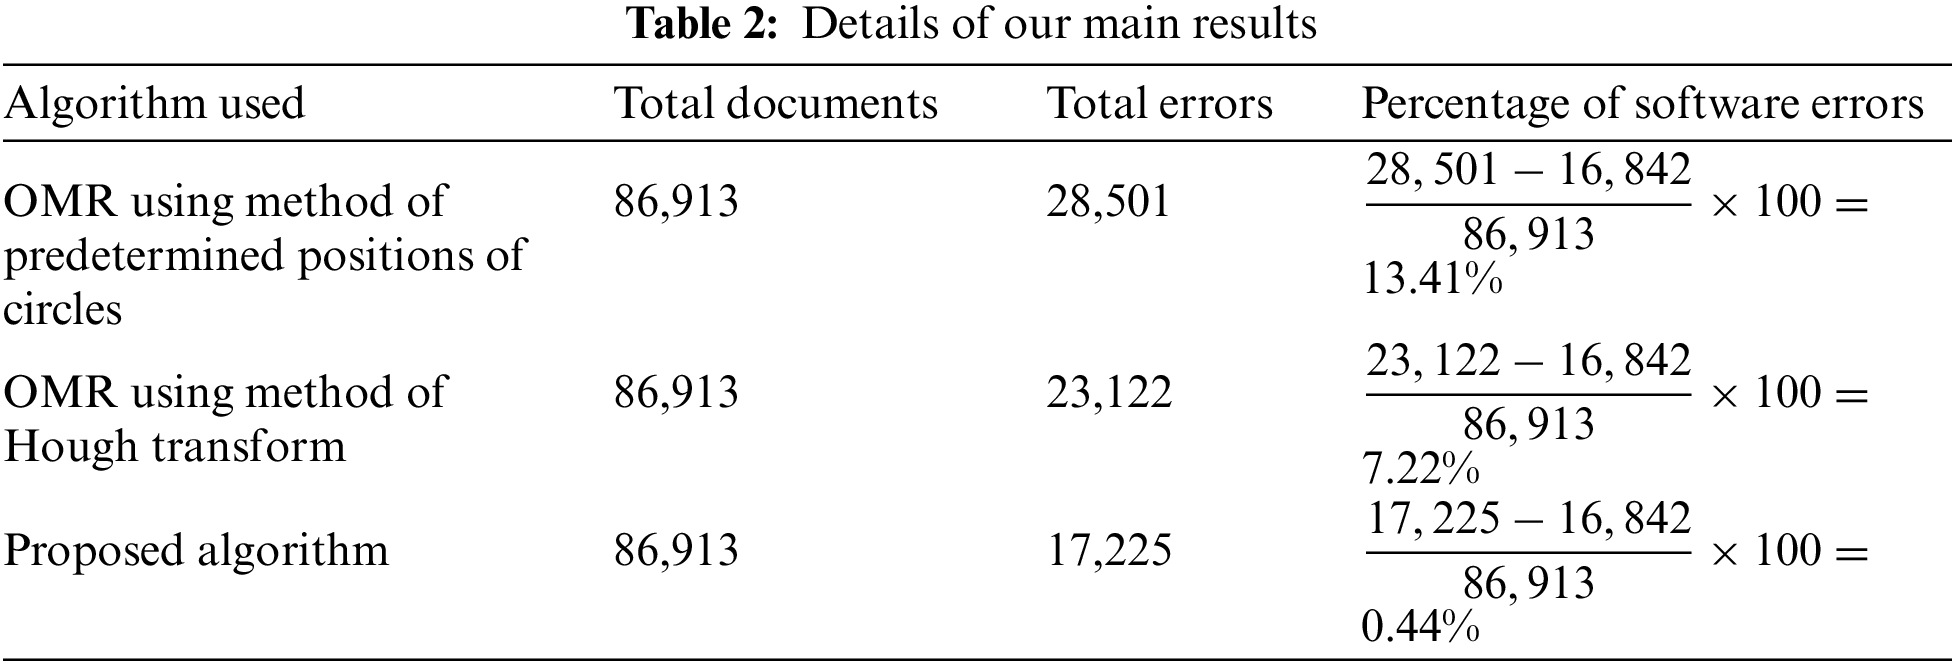
Our proposed system is divided into two parts, in the first part of our proposed system, we introduce a new mechanism for bias correction in OMR documents. We use the Hough transform algorithm to correct skew in the document. The second part of our proposed system is to compute the exact position of the circle in the OMR document so that accurate user input can be identified. In this part of the proposed system, we introduce the method of the Hough transform algorithm and a fallback method for pixel projection in case of errors to improve the accuracy of calculating circle positions. The results show that we obtain a minimum error rate of 7.22% using the existing algorithms in the dataset. The proposed algorithm improves the accuracy of the system. By using the proposed algorithm, we can achieve a maximum error rate of 0.44%. This is a huge improvement over the OMR system. By using our proposed algorithm, the OMR system can be more accurate, reliable and practical. The software error in our proposed system is 0.44%. If the algorithm is fine-tuned later, the accuracy of the OMR system can be improved to 100%. This work can also be ported to mobile applications, allowing higher-precision OMR systems to be used with cell phone cameras.
Acknowledgement: The authors extend their appreciation to King Saud University for funding this work through Researchers Supporting Project number (RSP2022R426), King Saud University, Riyadh, Saudi Arabia.
Funding Statement: This work was supported by King Saud University for funding this work through Researchers Supporting Project number (RSP2022R426).
Conflicts of Interest: The authors declare that they have no conflicts of interest to report regarding the present study.
References
1. J. L. Pérez-Benedito, E. Q. Aragón, J. A. Alriols and L. Medic, “Optical mark recognition in student continuous assessment,” Revista Iberoamericana de Tecnologias del Aprendizaje, vol. 9, no. 4, pp. 133–138, 2014. [Google Scholar]
2. S. Kumar, “A study on optical mark readers,” International Interdisciplinary Research Journal, vol. 3, pp. 40–44, 2015. [Google Scholar]
3. D. D. S. Poor, “Image capture and storage techniques in association with optical mark reading,” US Patent 5,452,379., 1995. [Google Scholar]
4. K. Chinnasarn and Y. Rangsanseri, “Image-processing-oriented optical mark reader,” Applications of Digital Image Processing XXII, vol. 3808, pp. 702–708, 1999. [Google Scholar]
5. N. V. Patel and G. I. Prajapati, “Various techniques for assessment of OMR sheets through ordinary 2D scanner: A survey,” International Journal of Engineering Research, vol. V4, pp. 803–807, 2015. [Google Scholar]
6. D. Patel and S. Zaid, “Efficient system for evaluation of OMR eheet,” International Journal of Advanced Research in Engineering, vol. 3, pp. 1349–1362, 2017. [Google Scholar]
7. A. Gupta and S. Avasthi, “Image based low cost method to the OMR process for surveys and research,” International Journal of Scientific Engineering and Applied Science, vol. 2, pp. 91–95, 2016. [Google Scholar]
8. A. M. Abdu and M. M. Mokji, “A novel approach to a dynamic template generation algorithm for multiple-choice forms,” in Proc. IEEE Int. Conf. on Control System, Computing and Engineering, Penang, Malaysia, pp. 216–221, 2012. [Google Scholar]
9. D. Chai, “Automated marking of printed multiple choice answer sheets,” in Proc. IEEE Int. Conf. on Teaching, Assessment, & Learning for Engineering, Bangkok, Thailand, pp. 145–149, 2016. [Google Scholar]
10. P. Sanguansat, “Robust and low-cost optical mark recognition for automated data entry,” in Proc. Int. Conf. on Electrical Engineering/Electronics, Computer, Telecommunications and Information Technology, Hua Hin, Thailand, pp. 1–5, 2015. [Google Scholar]
11. A. Papandreou, B. Gatos, S. J. Perantonis and I. Gerardis, “Efficient skew detection of printed document images based on novel combination of enhanced profiles,” International Journal on Document Analysis and Recognition, vol. 17, no. 4, pp. 433–454, 2014. [Google Scholar]
12. S. Rakesh, K. Atal and A. Arora, “Cost effective optical mark reader,” International Journal of Computer Science and Artificial Intelligence, vol. 3, no. 2, pp. 44–49, 2013. [Google Scholar]
13. C. Saengtongsrikamon, P. Meesad and S. Sodsee, “Scanner-based optical mark recognition,” Information Technology Journal, vol. 5, pp. 69–73, 2009. [Google Scholar]
14. I. A. Belag, Y. Gültepe and T. M. Elmalti, “An image processing based optical mark recognition with the help of scanner,” International Journal of Engineering Innovation & Research, vol. 7, pp. 108–112, 2018. [Google Scholar]
15. A. A. Abbas, “An automatic system to grade multiple choice questions paper based exams,” Journal of University of Anbar for Pure Science, vol. 3, pp. 174–181, 2009. [Google Scholar]
16. A. Al-marakeby, “Multi core processors for camera based OMR,” International Journal of Computer Applications, vol. 68, no. 13, pp. 1–5, 2013. [Google Scholar]
17. E. O. Gyamfi and Y. M. Missah, “Pixel-based unsupervised classification approach for information detection on optical markup recognition sheet,” Advances in Science, Technology & Engineering Systems Journal, vol. 2, no. 4, pp. 121–132, 2017. [Google Scholar]
18. A. Spadaccini and V. Rizzo, “A multiple-choice test recognition system based on the Gamera framework,” arXiv preprint arXiv:1105.3834, 2011. [Google Scholar]
19. H. Deng, F. Wang and B. Liang, “A low-cost OMR solution for educational applications,” in Proc. IEEE Int. Symp. on Parallel & Distributed Processing with Applications, Sydney, NSW, pp. 967–970, 2008. [Google Scholar]
20. T. Hendra, G. B. Yoga, L. Samuel and K. Dion, “Android based automated scoring of multiple choice test,” International Journal of Machine Learning and Computing, vol. 7, no. 5, pp. 110–113, 2017. [Google Scholar]
21. J. A. Fisteus, A. Pardo and N. F. García, “Grading multiple choice exams with low-cost and portable computer-vision techniques,” Journal of Science Education and Technology, vol. 22, no. 4, pp. 560–571, 2013. [Google Scholar]
22. D. Krisnadi, A. R. Mitra, R. I. Desanti, W. D. Ciputra and H. Hery, “A multiple-choice test recognition system based on android and RBFNN,” Destech Transactions on Computer Science and Engineering, vol. 1, pp. 501–505, 2017. [Google Scholar]
23. F. A. Zampirolli, J. A. Gonzalez and R. O. Neves,“ Automatic correction of multiple-choice tests using digital cameras and image processing,” in Universidade Federal do Visão Computacional, Rio de Janeiro, Brazil, Universidade Federal Fluminense, 2013. [Google Scholar]
24. R. T. China, F. D. Zampirolli, R. P. Oliveira Neves and J. A. Quilici-Gonzalez, “An application for automatic multiple-choice test grading on android,” Revista Brasileira de Iniciação Cientı́fica, vol. 3, pp. 4–25, 2016. [Google Scholar]
25. R. Patel, S. Sanghavi, D. Gupta and M. S. Raval, “CheckIt-A low cost mobile OMR system,” in TENCON 2015-2015 IEEE Region 10 Conf., Macao, pp. 1–5, 2015. [Google Scholar]
26. T. D. Nguyen, Q. H. Manh, P. B. Minh, L. N. Thanh and T. M. Hoang, “Efficient and reliable camera based multiple-choice test grading system,” in Proc. Int. Conf. on Advanced Technologies for Communications, Danang, Vietnam, pp. 268–271, 2011. [Google Scholar]
27. E. M. Elias, P. M. Tasinaffo and R. Hirata, “Alignment, scale and skew correction for optical mark recognition documents based,” in Proc. Workshop of Computer Vision, Las Vegas, Nevada, USA, pp. 26–31, 2019. [Google Scholar]
28. M. Afifi and K. F. Hussain, “The achievement of higher flexibility in multiple-choice-based tests using image classification techniques,” International Journal on Document Analysis and Recognition, vol. 22, no. 2, pp. 127–142, 2019. [Google Scholar]
29. C. Young, G. Lo, K. Young and A. Borsetta, “Formscanner: Open-source solution for grading multiple-choice exams,” The Physics Teacher, vol. 54, no. 1, pp. 34–35, 2016. [Google Scholar]
30. J. A. Catalan, “A framework for automated multiple-choice exam scoring with digital image and assorted processing using readily available software,” in Proc. DLSU Research Congress Manila, Philippines, pp. 1–5, 2017. [Google Scholar]
31. G. Bayar, “The use of Hough transform to develop an intelligent grading system for the multiple choice exam papers,” Karaelmas Science and Engineering Journal, vol. 6, no. 1, pp. 100–104, 2016. [Google Scholar]
32. T. Jingyi, Y. K. Hooi and O. K. Bin, “Image processing for enhanced OMR answer matching precision,” in Proc. Int. Conf. on Computer and Information Sciences: Sustaining Tomorrow with Digital Innovation, Perak, Malaysia, pp. 322–327, 2021. [Google Scholar]
33. S. Kumar and A. Rathee, “Implementation of OMR technology with the help of ordinary WebCam,” International Journal for Modern Trends in Science and Technology, vol. 6, no. 12, pp. 77–81, 2020. [Google Scholar]
34. A. E. Tümer and Z. Küçükkara, “An image processing oriented optical mark recognition and evaluation system,” International Journal of Applied Mathematics, Electronics & Computers, vol. 6, no. 4, pp. 59–64, 2018. [Google Scholar]
35. S. Reddy, Y. S. Saran, A. Sai and V. I. T. G. Mohith Krishna, “OMR evaluation using image processing,” International Journal of Innovation & Advancement in Computer Science, vol. 7, no. 4, pp. 572–576, 2018. [Google Scholar]
36. C. Y. Buleje, Y. T. P. Atencio and E. T. Tinoco, “System with optical mark recognition based on artificial vision for the processing of multiple selection tests in school competitions,” in 2020 XLVI Latin American Computing Conf. (CLEI), Loja, pp. 172–177, 2020. [Google Scholar]
37. B. Sumitra and Gaikwad, “Image processing based OMR sheet scanning,” International Journal of Advanced Research in Electronics & Communication Engineering, vol. 4, no. 3, pp. 519–522, 2015. [Google Scholar]
38. A. Talib, N. Ahmad and W. Tahar, “OMR form inspection by web camera using shape-based matching approach,” International Journal of Research in Engineering and Science, vol. 3, no. 3, pp. 1–7, 2015. [Google Scholar]
39. M. J. A. Aziz, F. Dato'Ahmad, A. Z. A. Ghani and R. Mahmod, “Automated marking system for short answer examination (AMS-SAE),” in Proc. IEEE Symp. on Industrial Electronics & Applications, Kuala Lumpur, Malaysia1, pp. 47–51, 2009. [Google Scholar]
40. E. H. B. Smith, D. Lopresti and G. Nagy, “Ballot mark detection,” in Proc. Int. Conf. on Pattern Recognition, Tampa, Florida, pp. 1–4, 2008. [Google Scholar]
41. R. H. Hasan and E. I. A. Kareem, “An image processing oriented optical mark reader based on modify multi-connect architecture MMCA,” International Journal of Modern Trends in Engineering and Research, vol. 2, no. 7, pp. 414–424, 2015. [Google Scholar]
42. S. Hussmann and P. W. Deng, “A high-speed optical mark reader hardware implementation at low cost using programmable logic,” Real-Time Imaging, vol. 11, no. 1, pp. 19–30, 2005. [Google Scholar]
43. N. Kakade and R. C. Jaiswal, “OMR sheet evaluation using image processing,” Journal of Emerging Technologies and Innovative Research, vol. 4, no. 12, pp. 640–643, 2017. [Google Scholar]
44. Y. R. Hadi, F. Karim and A. Mohammad Hadi, “A novel approach of skew estimation and correction in Persian manuscript text using radon transform,” in Proc. IEEE Symp. on Computers & Informatics, Penang, Malaysia, pp. 198–202, 2012. [Google Scholar]
45. N. Karunanayake, “OMR sheet evaluation by web camera using template matching approach,” International Journal for Research in Emerging Science and Technology, vol. 2, no. 8, pp. 40–44, 2015. [Google Scholar]
46. S. C. Loke, K. A. Kasmiran and S. A. Haron, “A new method of mark detection for software-based optical mark recognition,” PlOS one, vol. 13, no. 11, pp. e0206420, 2018. [Google Scholar]
47. N. C. D. Kumar, K. V. Suresh and R. Dinesh, “Automated parameter-less optical mark recognition,” in Proc. Data Analytics and Learning: Springer, Singapore, vol. 43, pp. 185–195, 2019. [Google Scholar]
48. K. J. Rachchh and E. S. Gopi, “Inclusion of vertical bar in the OMR sheet for image-based robust and fast OMR evaluation technique using mobile phone camera,” in Proc. Int. Conf. on Data Engineering and Communication Technology, Singapore, vol. 828, pp. 39–46, 2019. [Google Scholar]
49. O. Espitia, A. Paez, Y. Mejia, M. Carrasco and N. Gonzalez, “Optical mark recognition based on image processing techniques for the answer sheets of the Colombian high-stakes tests,” in Proc. Applied Computer Sciences in Engineering, Cham, vol. 1052, pp. 167–176, 2019. [Google Scholar]
50. H. Atasoy, E. Yildirim, Y. Kutlu and K. Tohma, “Webcam based real-time robust optical mark recognition,” in Proc. Int. Conf. on Neural Information Processing, Cham, 9490, pp. 449–456, 2015. [Google Scholar]
51. M. Alomran and D. Chai, “Automated scoring system for multiple choice test with quick feedback,” International Journal of Information and Education Technology, vol. 8, no. 8, pp. 538–545, 2018. [Google Scholar]
52. M. P. Calado, A. A. Ramos and P. Jonas, “An application to generate, correct and grade multiple-choice tests,” in Proc. Int. Conf. on Systems and Informatics, Shanghai, China, pp. 1548–1552, 2019. [Google Scholar]
53. S. Tiwari and S. Sahu, “A novel approach for the detection of OMR sheet tampering using encrypted QR code,” in Proc. IEEE Int. Conf. on Computational Intelligence and Computing Research, Coimbatore, India, pp. 1–5, 2014. [Google Scholar]
54. V. Ware, N. M. Menon, P. Varute and R. A. Dhannawat, “Cost effective optical mark recognition software for educational institutions,” International Journal of Advance Research, Ideas and Innovations in Technology, vol. 5, no. 2, pp. 1874–1877, 2019. [Google Scholar]
Cite This Article
 Copyright © 2023 The Author(s). Published by Tech Science Press.
This work is licensed under a Creative Commons Attribution 4.0 International License , which permits unrestricted use, distribution, and reproduction in any medium, provided the original work is properly cited.
 Downloads
 Citation Tools