
 Submit a Paper
 Propose a Special lssue
 Open Access
ARTICLE
Regulatory Genes Through Robust-SNR for Binary Classification Within Functional Genomics Experiments
1 Department of Statistics, Abdul Wali Khan University, Mardan, 23200, Pakistan
2 Industrial Engineering Department, College of Engineering, King Saud University, P.O. Box 800, Riyadh, 11421, Saudi Arabia
3 Department of Computer Science, COMSATS University Islamabad, Islamabad, 45550, Pakistan
4 Department of Information and Communication Engineering, Yeungnam University, Gyeongsan, 38541, Korea
* Corresponding Author: Muhammad Shafiq. Email:
Computers, Materials & Continua 2023, 74(2), 3663-3677. https://doi.org/10.32604/cmc.2023.030064
Received 17 March 2022; Accepted 10 June 2022; Issue published 31 October 2022
 View Full Text
 Download PDF
Abstract
The current study proposes a novel technique for feature selection by inculcating robustness in the conventional Signal to noise Ratio (SNR). The proposed method utilizes the robust measures of location i.e., the “Median” as well as the measures of variation i.e., “Median absolute deviation (MAD) and Interquartile range (IQR)” in the SNR. By this way, two independent robust signal-to-noise ratios have been proposed. The proposed method selects the most informative genes/features by combining the minimum subset of genes or features obtained via the greedy search approach with top-ranked genes selected through the robust signal-to-noise ratio (RSNR). The results obtained via the proposed method are compared with well-known gene/feature selection methods on the basis of performance metric i.e., classification error rate. A total of 5 gene expression datasets have been used in this study. Different subsets of informative genes are selected by the proposed and all the other methods included in the study, and their efficacy in terms of classification is investigated by using the classifier models such as support vector machine (SVM), Random forest (RF) and k-nearest neighbors (k-NN). The results of the analysis reveal that the proposed method (RSNR) produces minimum error rates than all the other competing feature selection methods in majority of the cases. For further assessment of the method, a detailed simulation study is also conducted.Keywords
All the genes in high dimensional gene expression datasets are not equally important for classification/regression purposes. There always exist redundant and noisy features/genes in high dimensional datasets like micro-array gene expression datasets, which do not contribute to the classification of the tissue samples to their correct classes. This problem is also known as the curse of dimensionality. To overcome this problem, it is necessary to select a subset of genes that can correctly assign the tissue samples to their true classes. The selection of a small number of genes is equally important in regression as well as in classification problems. The selection of informative features increases the prediction accuracy in regression problems and classification accuracy in classification problems. Therefore, it is required to determine a set of the top ranked features that possess the most discriminative power and have the ability to simplify the construction of the model. A small subset of features reduces running time and computation cost of model as well. Furthermore, it also enhances the generalizability of the classifier models by minimizing the problem of dimensionality hex (i.e., n < p) and reduces their variances. Methods used for feature selection are classified into three main classes i.e., Wrapper, Embedded and Filter methods. A brief description of these procedures is given in the subsequent subsections.
The wrapper procedures fit a machine learning model on all possible subsets of features and a performance metric is computed for the fitted model on all possible combinations of features. After that these methods select that subset of features for which the fitted mode gives the optimum value of the underlying performance criterion. Some well-known examples of the wrapper methods are forward selection, backward elimination and stepwise model selection [1], another example can be seen in [2].
The working mechanism of embedded methods is somehow alike to the Wrapper methods. In embedded procedures, it is not necessary to fit a new machine learning algorithm on each possible combination of features, rather the feature selection and model construction are carried out simultaneously, that is, feature selection is an integral part of the classification/regression algorithm. Commonly used embedded procedures are decision tree method, random forest, Ridge and LASSO regression. Classification tree-based classifier [3] is another example of these methods.
In filter methods, statistical measures are applied to each feature or gene in the data, to find its association with the target variable which is used as a relevance score for the gene. Then the relevance score of the genes are ranked and those genes are selected which possess optimal relevance score to construct the model. Example of filter procedure can be seen in [4].
The current paper is based on a method that comes under the umbrella of filtering procedures. The proposed method identifies the important genes or features by using the Robust Signal to Noise Ratio approach in conjunction with the greedy search approach [5], to predict binary class response in gene expression problems. For assessing the performance of the proposed method, five benchmark gene expression datasets are considered to compare with the other state-of-the-art methods that are POS (proportion overlapping score) [5], maximum relevance, and minimum redundancy (mRmR) [6], Wilcoxon rank-sum test [7] and GClust [8]. Three different classifiers i.e., random forest (RF) [9], k nearest neighbors (k-NN) [10], and support vector machine (SVM) [11], are used to investigate the performance of genes selected through the proposed algorithm in comparison with the other methods.
Rest of the paper is organized as follows: Section 2 provides related literature. Section 3 explains the proposed method. Section 4 gives the experimental setup of the analysis done in this paper for all the datasets considered in the study and synthetic data analysis. Finally, Section 5 concludes the paper.
A huge number of studies regarding feature selection in gene expression datasets which have high dimensions can be found in the literature. A procedure known as ‘relative importance’ was introduced in [12], where a large number of trees are grown in order to determine the most discriminative genes/features. The final subset of the most important and discriminative features is the one that predicts the maximum test instances to their true class labels. Another procedure used for feature selection known as mRMR (minimal redundancy maximal relevance) can be found in [13], where genes with maximum relevance with the response class and minimum redundancy with the other genes are considered as informative. A method using the Principal component analysis technique for feature/gene selection can be found in [14], where those features are declared the most informative and important that corresponds to the component with less variation. Similarly, the authors in [15] used the factor analysis technique for the selection of informative genes rather than principal component analysis. The concept of the p-value of tests used in statistics like t-test and Wilcoxon rank-sum test for the identification of informative genes can be found in [7]. The study in [16] used the impurity measures such as max minority, information gain and Gini index for the selection of discriminative genes. Authors in [17] introduced a novel feature selection procedure by investigating the overlapping degree between the different classes for each feature. Features that possess larger overlapping degrees between classes were considered as informative genes. The extended version of [17] can be found in [18], where one additional factor was added in their study i.e., the number of overlapped instances in the overlapping region for each feature. The authors in [18] computed the gene mask by using the range of core interval of gene expression values, which represents the capability of a feature to classify the instances or tissue samples correctly into their true classes without any equivocalness. In this procedure, a small number of features that without any ambiguity classify the majority of the training samples to their true classes are determined by using the set covering mechanism via the gene masks and overlapping scores. Finally, a subset of the most discriminative and important features is chosen by considering the features contained in the optimal subset of genes and those having the smallest overlapping scores. The idea of [18] was further extended by [5], where the expression core interval for each feature is computed by considering the robust measure of dispersion, the Interquartile Range. The distinguishing feature of [5] is that the proportion of overlapping instances in each class for each feature was calculated. Genes with the minimum value of proportional overlapping scores were declared as the most informative and discriminative. Furthermore, the relative dominant class (RDC) in the conjunction with the POS for each gene/feature was also computed which colligates each feature with the class for which it has the maximum discriminative power. Finally, a subset of the most discriminative genes is identified by the combination of the minimum subset of genes via POS and gene masks, and the highest-ranked features based on POS. A redundancy-removing study called more relevance less redundancy method developed in [19]. This procedure totally relies on mutual information and does not require data transformation. In addition, this method is used for feature selection in nominal-dataset. Similarly, another method used for features selection in case of binary class problems was proposed in [20], where the ordinary bat procedure was extended by using more suitable and refined formulations, multi-objective operators to improve the performance, and an advanced local search mechanism. Other examples can be found in [21] and [22].
The general representation of microarray gene expression datasets is given by
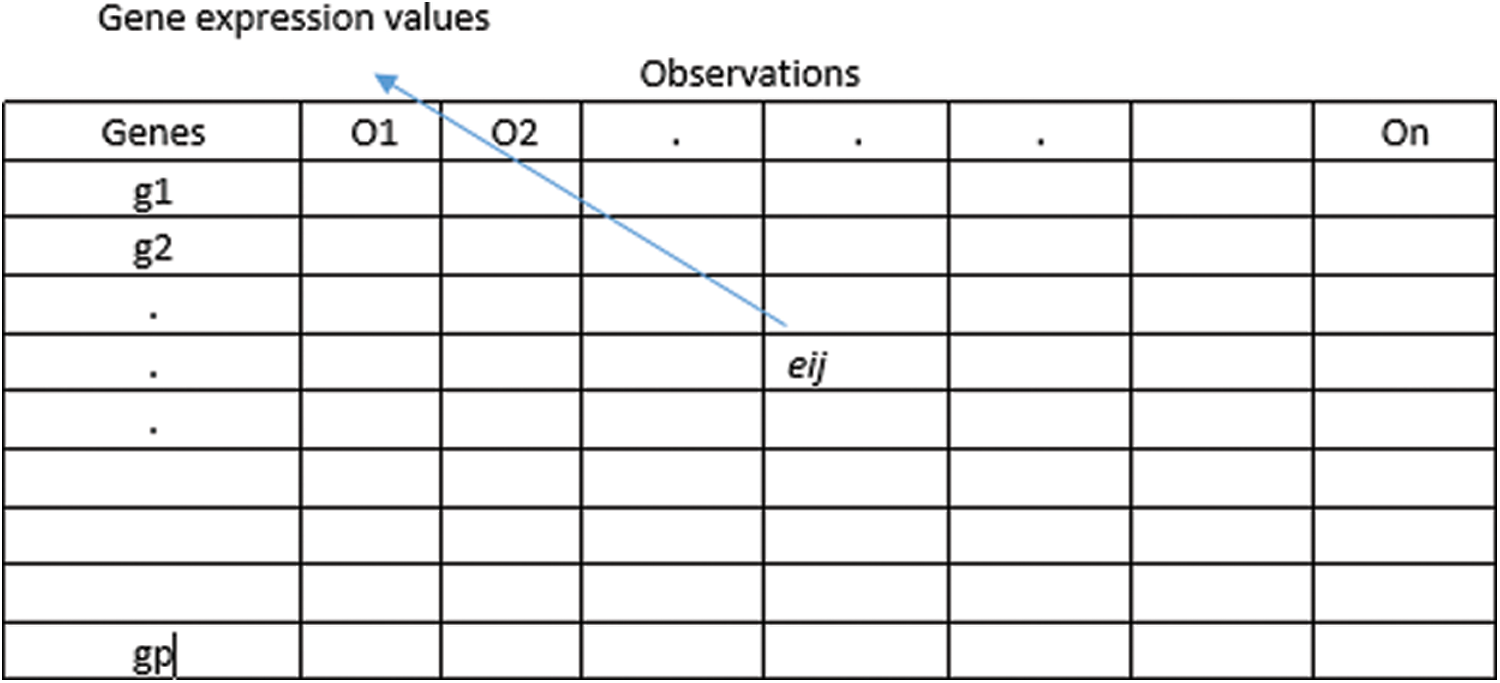
Figure 1: Gene expression data
For each class c = 0, 1 and gene i, the median is represented by
Interquartile range:
The inter quartile range of the ith gene for a given class c is represented by (IQR) and it is given by;
where
Median absolute deviation for each class c = 0, 1 and gene i is represented by MAD and it is given as:
such that
3.3 Signal to Noise Ratio Based on Median and MAD
Robust Signal to Noise Ration Based on Median and MAD is given as:
where
3.4 Signal to Noise Ratio Based on Median and Inter Quartile Range
Robust Signal to Noise Ratio Based on Median and Inter quartile range is given as,
where
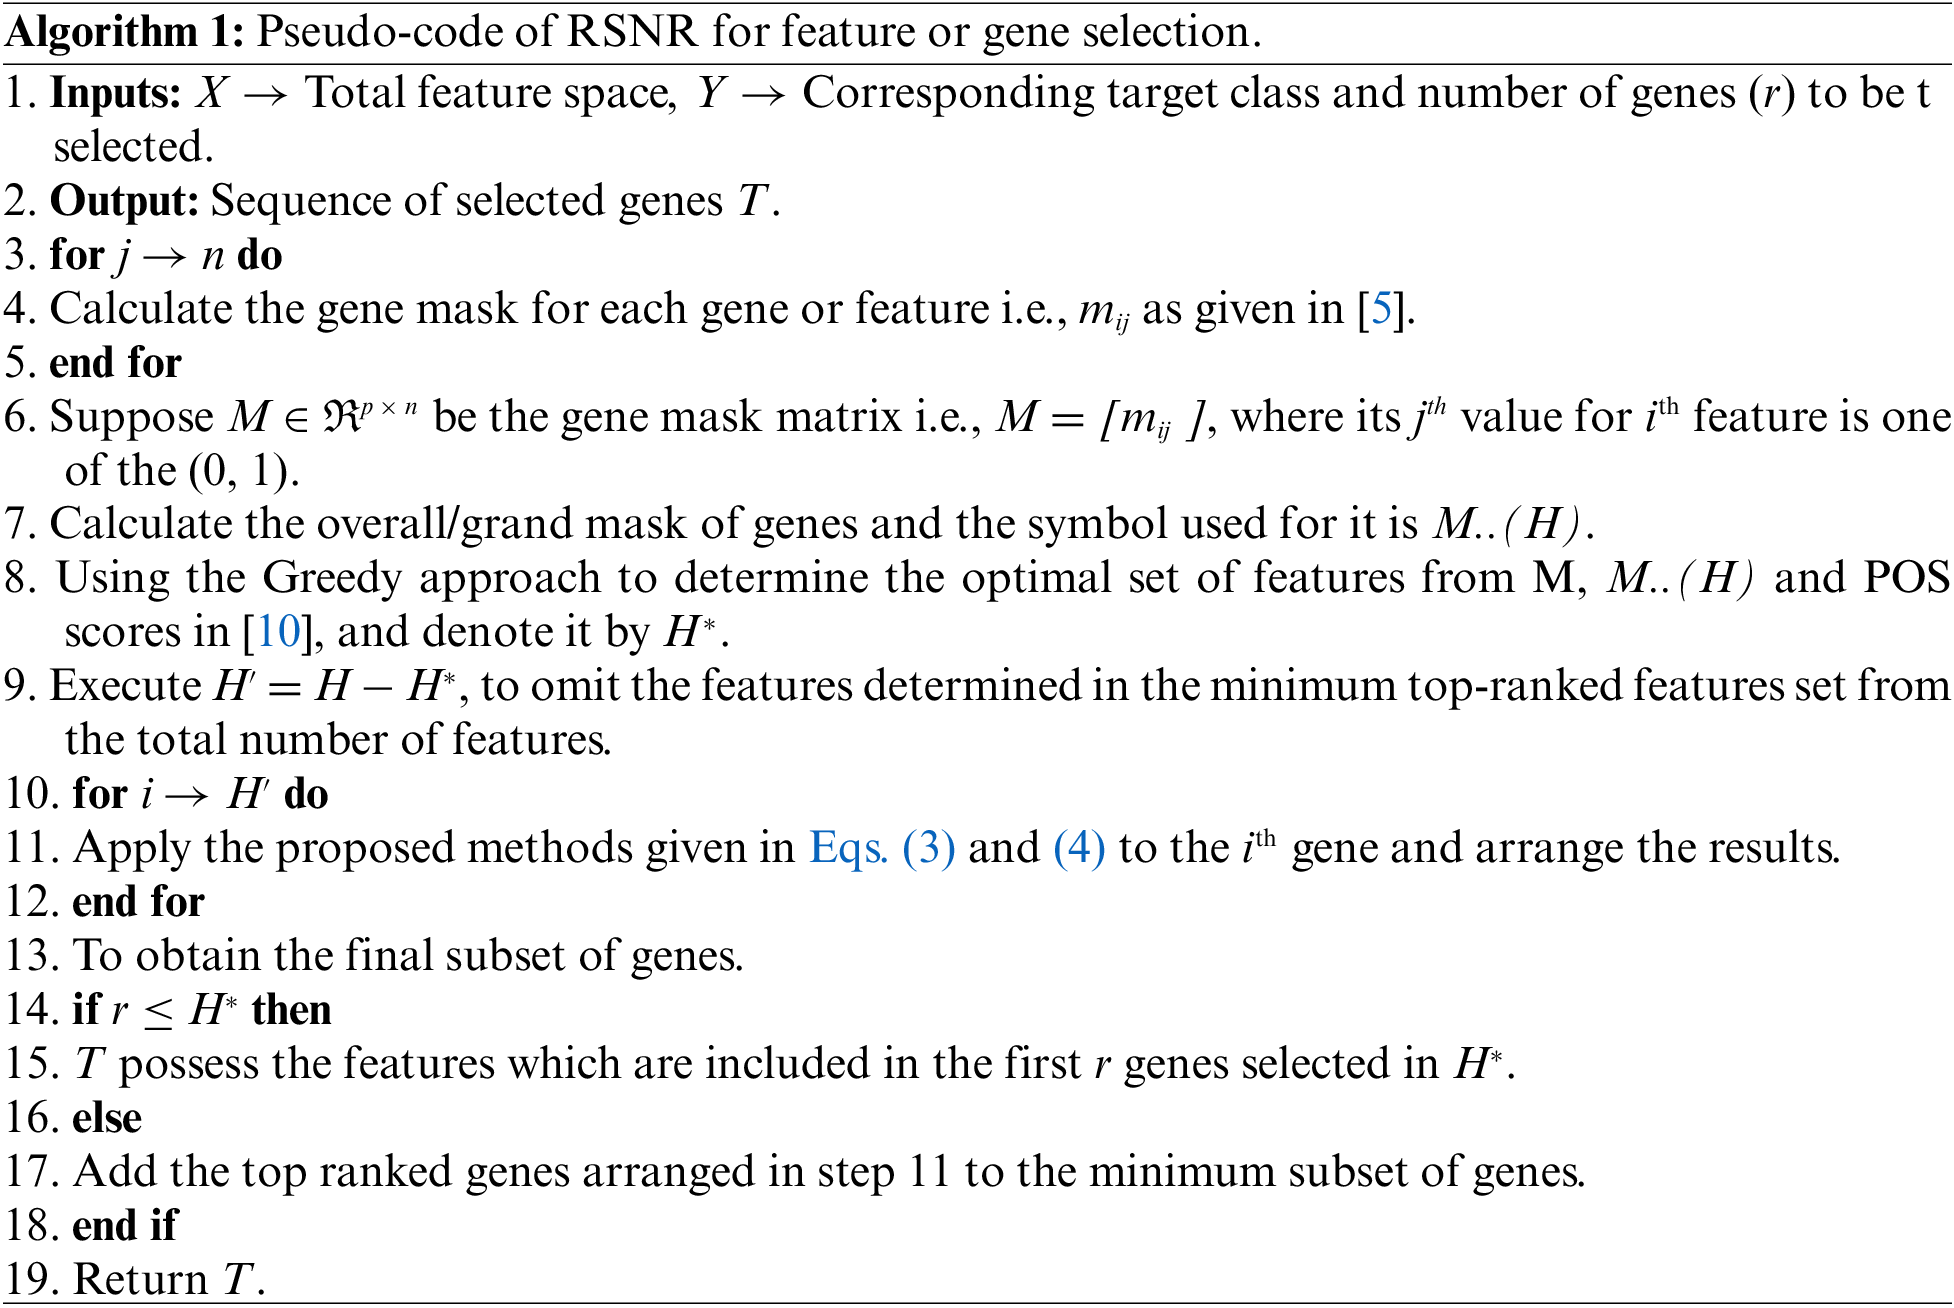
• The suggested procedure in this paper, initially determines the minimum set of features via the greedy approach given in [5].
• The remaining features that are not determined by greedy approach in step (1) are arranged according to the Robust Signal to Noise Ratio scores, given in Eqs. (3) and (4) independently.
• Genes that have larger Signal to Noise Ratio calculated in step (2) are considered as the the most important genes or features.
• The required top-ranked set of features or genes which are to be used for the construction of the model is obtained by pooling the features selected in steps (1) and (3).
The flowchart of the proposed Robust Signal to Noise Ratio (RSNR) procedure is given in Fig. 2 and the corresponding pseudo-code is given in Algorithm 1.
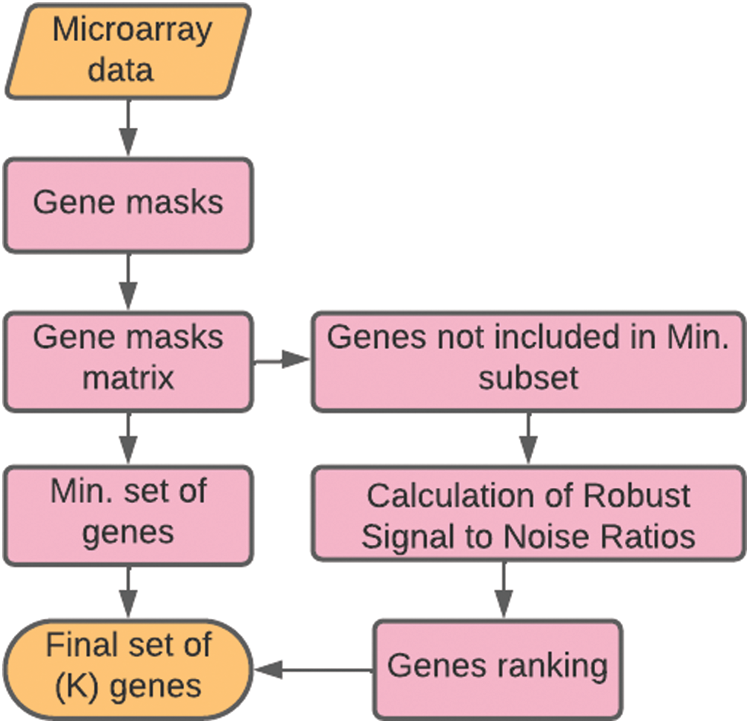
Figure 2: Flowchart of the proposed method
The novel RSNR method is expected to perform better than the other competing methods in that the value of Signal to Noise Ratio (SNR) given in [23] and [24] may increase if there are outliers in gene expression values of a particular gene for different tissue samples belonging to a particular class. Thus a larger value of Signal to Noise Ratio does not imply that the gene has a higher discriminative ability or the genes with the smaller Signal to Noise Ratio have no discriminative ability. To overcome this problem, the robust measure of location i.e., the median has been used in (SNR) rather than the mean. The advantage of the proposed “RSNR” is that it will not increase even in the presence of the outliers in gene expression values. Additionally two different robust versions of measures of dispersion i.e., median absolute deviation (MAD) and inter quartile range (IQR), have also been used to make the proposed measure more robust to the outliers. Moreover (MAD) and (IQR) have 50% and 25% breakdown points respectively, due to which they are less vulnerable to the extreme values in the data.
This section gives a detailed description about the experiments conducted for comparing the results of the novel procedure with the other state-of-the-art procedures on 5 benchmark datasets given in Tab. 1. The performance of feature selection methods is usually assessed by using different classifiers. Classification accuracy of the various feature selection procedures on the selected features set for a given data is recorded. A method with the highest accuracy is considered as the best method. The studies in [25,26] have considered various feature selection procedures given, where it has been seen that gene selection procedures have an important role in the classification problem and significantly affect the performance of classifiers. This approach has also been used in several other papers in the literature, such as [5] and [18].
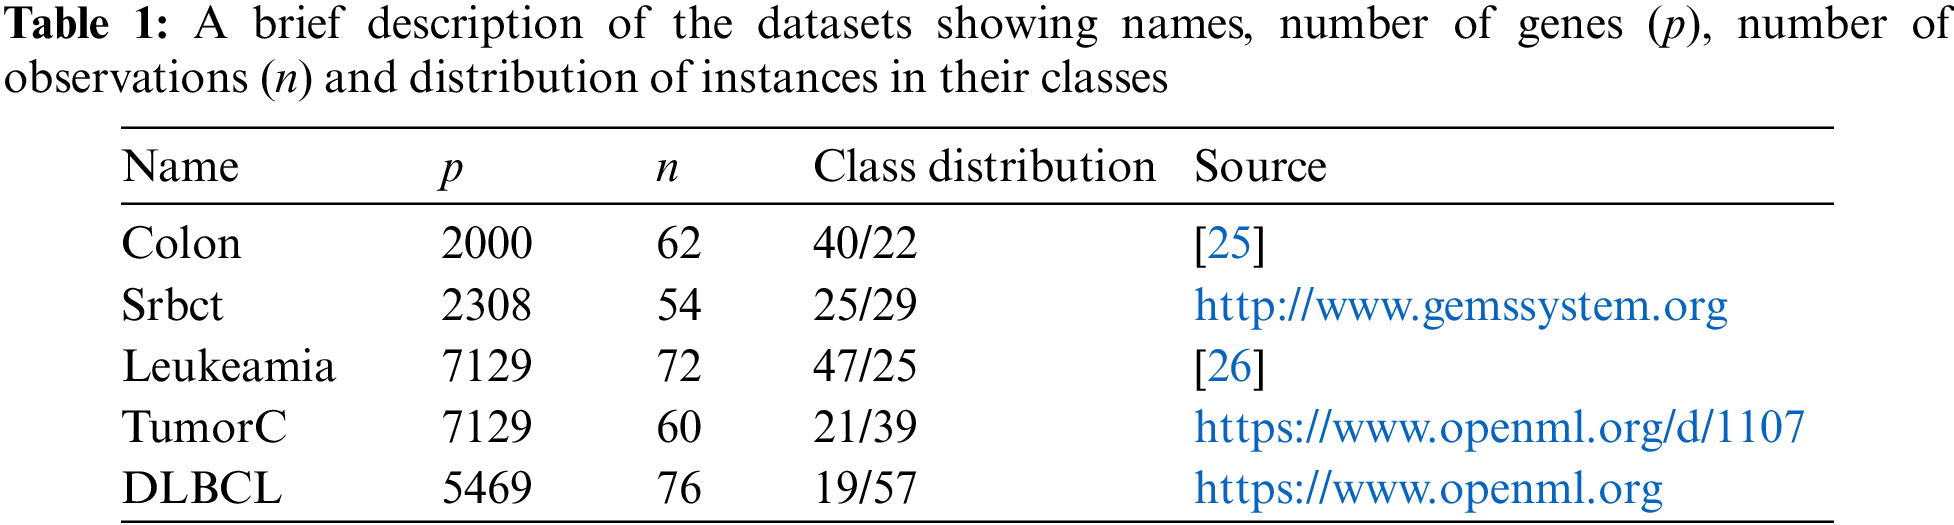
4.1 Microarray Gene Expression Datasets
A total of 5 microarray gene expression benchmark datasets have been used for assessing the performance of the proposed method. These benchmark datasets are taken from various open repositories. Each dataset contains number of variable actually shows the number of genes and number of instances actually represents number of tissue samples. A short summary of the datasets is given in Tab. 1, which shows the data names, number of genes (p), number of observations (n), distribution of the instances according to their class labels and the corresponding sources. Moreover, the response variable in Srbct dataset has four categories. To make it a binary response data, two classes with topmost observations are taken.
This section provides the basic experimental setup, which has been used for the analyses done in this study. All considered datasets in this paper are randomly divided into two non-overlapping groups according to the number of instances i.e., training part contains 70% of the total observations, while testing part consists 30% of the data points. The proposed method and other classical feature selection procedure are applied on 70% training data to select features and RF, SVM and k-NN classifiers are fitted on these selected features to assess the performance of the proposed algorithm. Thus, this process is repeated 500 times to evaluate the true performance of the proposed and other procedures included in the study. The R library “randomForest” [27] is used for RF with default parameters. The R library “kernlab” [28] with default values of parameters is used to fit SVM model with linear kernel. Similarly, the “caret” package [29] contained in R is used for the k-NN classifier with the value of k = 5 .
The number of top ranked genes i.e., 10, 20 and 30 are selected by the proposed method and other state-of-the-art gene selection procedures included in the study, by using 70% training data of all benchmark datasets and their efficacy is evaluated by the well-known models, such as RF, SVM and k-NN. The classification error rates are computed for all classifiers on 30% testing data to compare the performance of the feature selection methods based on the selected genes.
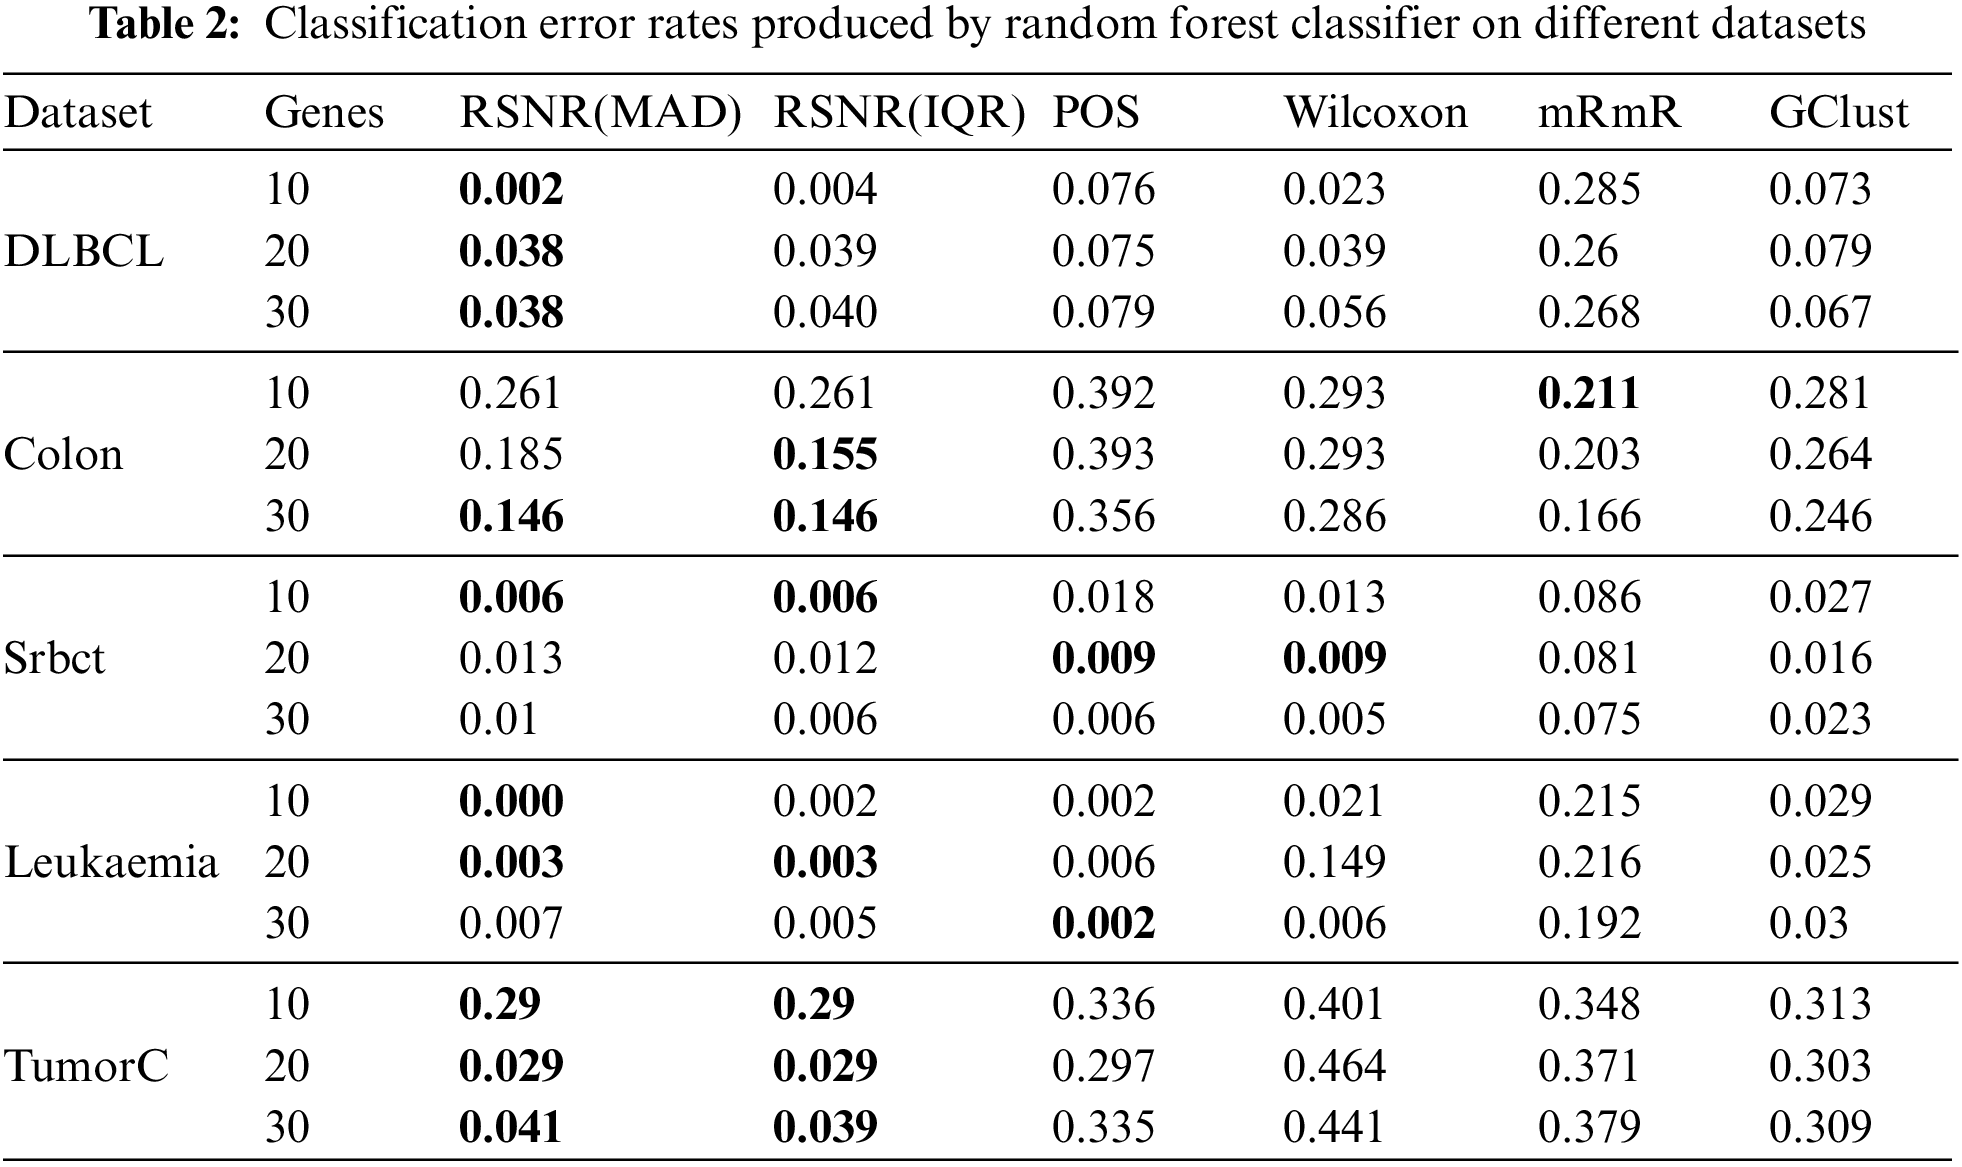
The results given in Tabs. 2–4 are computed via the proposed method RSNR and other classical procedures included in the study, for all datasets on top 10, 20 and 30 genes by using classifier models i.e., RF, SVM and k-NN. Tab. 2 represents the results given by RSNR and other standard procedures for the datasets considered in this paper on random forest classifier. It is clear from Tab. 2 that the proposed robust signal to noise ratio method based on median and MAD (Eq. (3)) outperformed rest of the procedures for “DLBCL” dataset. In case of “Colon” dataset, the novel methods given in Eqs. (3) and (4) produced minimum error when the number of genes is 30, while for 20 numbers of genes the proposed method given in Eq. (4) outperformed all the other methods. The mRmR method has the smallest error rate for 10 numbers of genes in case of “Colon” dataset. For the dataset “Srbct” the proposed method produced minimum error rate when the number of genes are 10 and 30. For 20 numbers of genes, “POS” and “Wilcoxon” methods have the smallest error rates. Random forest classifier has the minimum error for a subset of genes i.e., 10 and 20, selected by the proposed method (RSNR) in case of “Leukemia” dataset. The proposed method achieves a high error rate for 30 numbers of genes as compared to the other methods. In case of “TumorC” dataset, RSNR procedure has outperformed all the remaining procedures for all the subsets of selected genes.
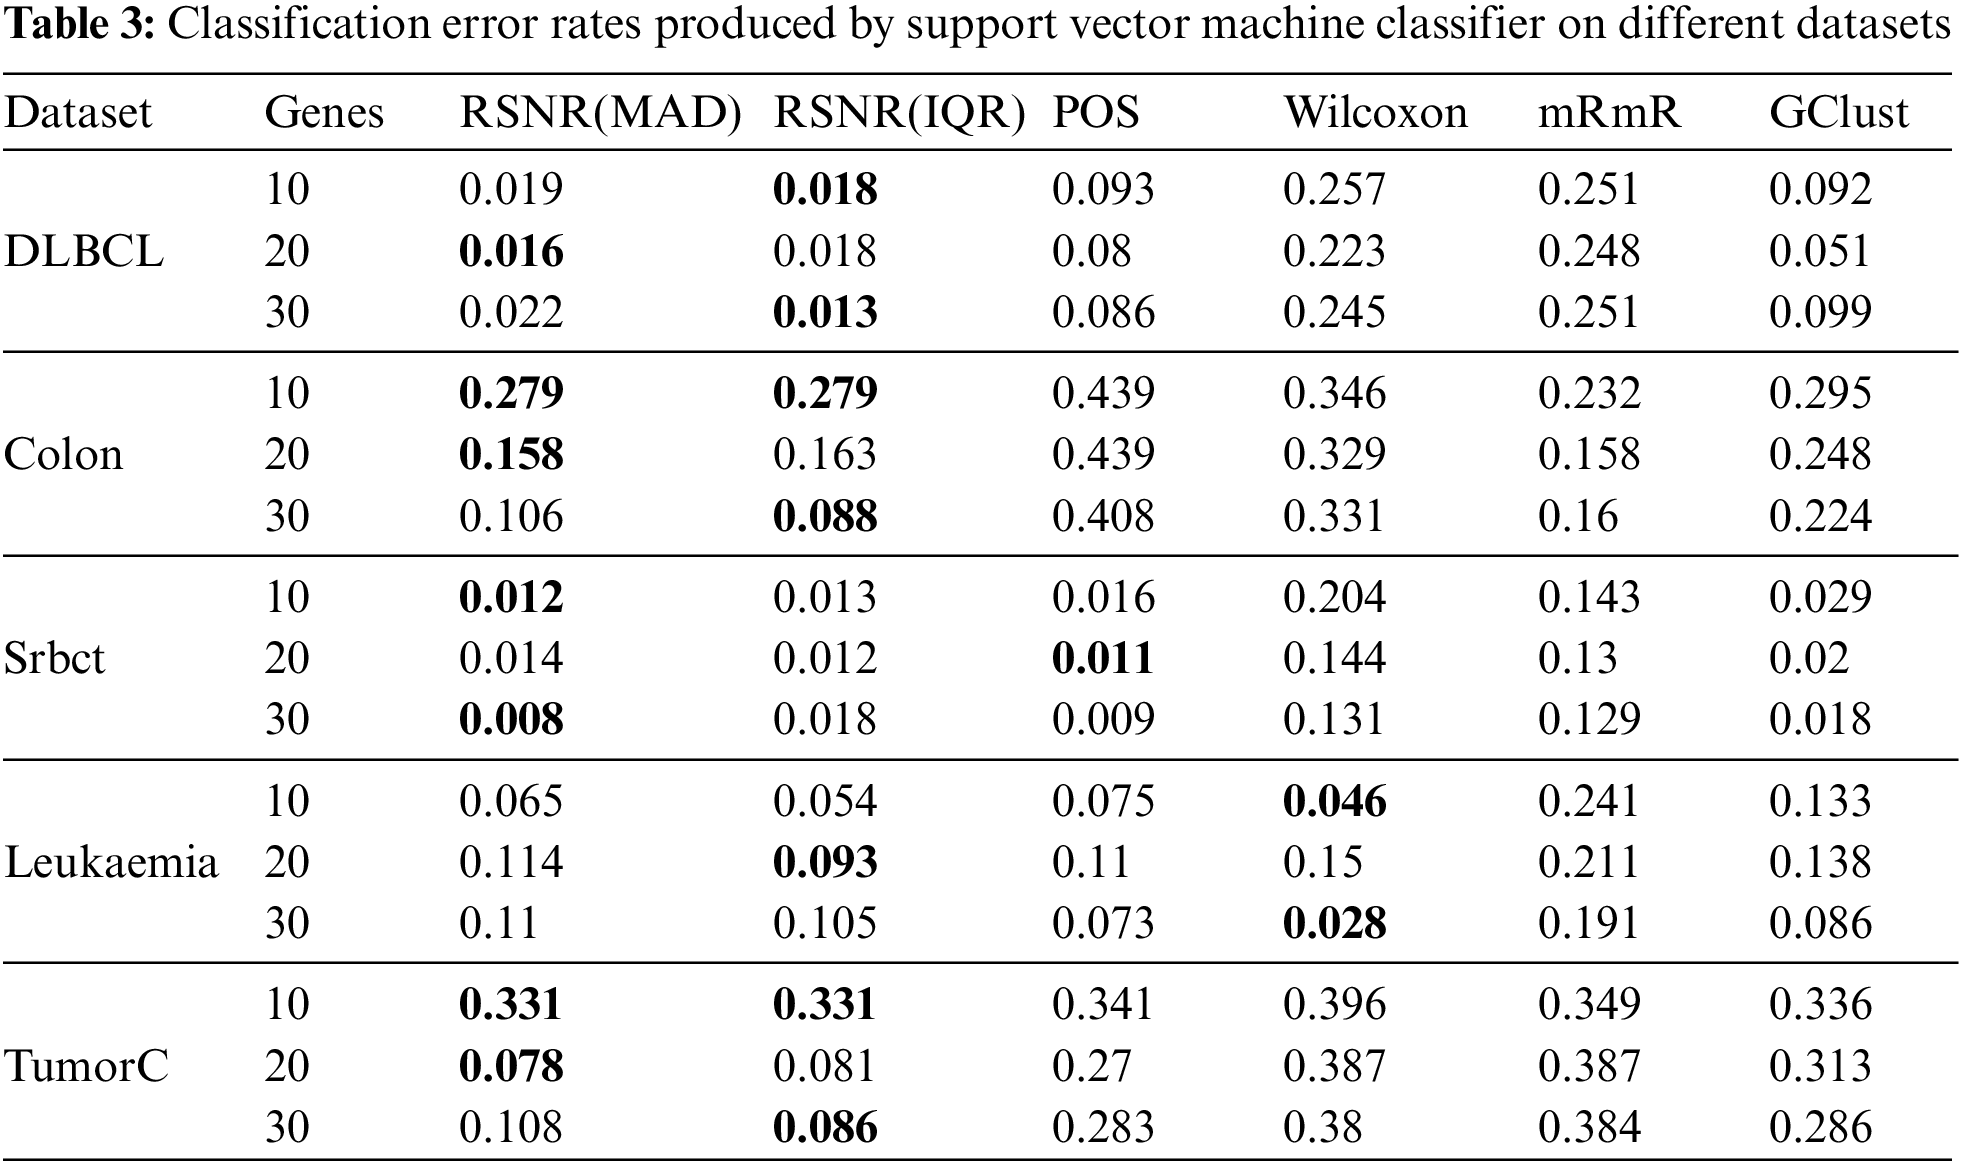
Tab. 3 represents the results given by various feature selection procedures selecting different number of genes on Support Vector Machine classifier. It is clearly shown in the table that the novel proposed method based on inter quartile range (IQR) and median absolute deviation (MAD) has outperformed all the other methods in almost all the cases, except for the datasets “Srbct” and “Leukemia” where the methods “POS” and “Wilcoxon” have produced the minimum error rates. For “DLBCL” dataset the proposed method based on inter quartile range (IQR) produced minimum error rate for 10 and 20 number of features, while for 20 number of genes, the proposed method based on median absolute deviation has the minimum error rate as compared to the other classical procedures. Similar conclusion could be drawn about the “Colon” dataset as that of DLBCL dataset. For the dataset “Srbct” the method “POS” has outperformed the remaining methods with the subset of genes consisting of the most informative 20 genes, while for the rest of the subsets, the proposed method based on (MAD) has the minimum error rates. It is clear from Tab. 3, that for the “Leukemia” data the “Wilcoxon” method has outperformed rest of the procedures in general, except for the subset of 20 genes, where the proposed method based on (IQR) produced minimum error rates. For the dataset “TumorC”, similar conclusion could be drawn as that of “DLBCL” and “Colon” datasets.
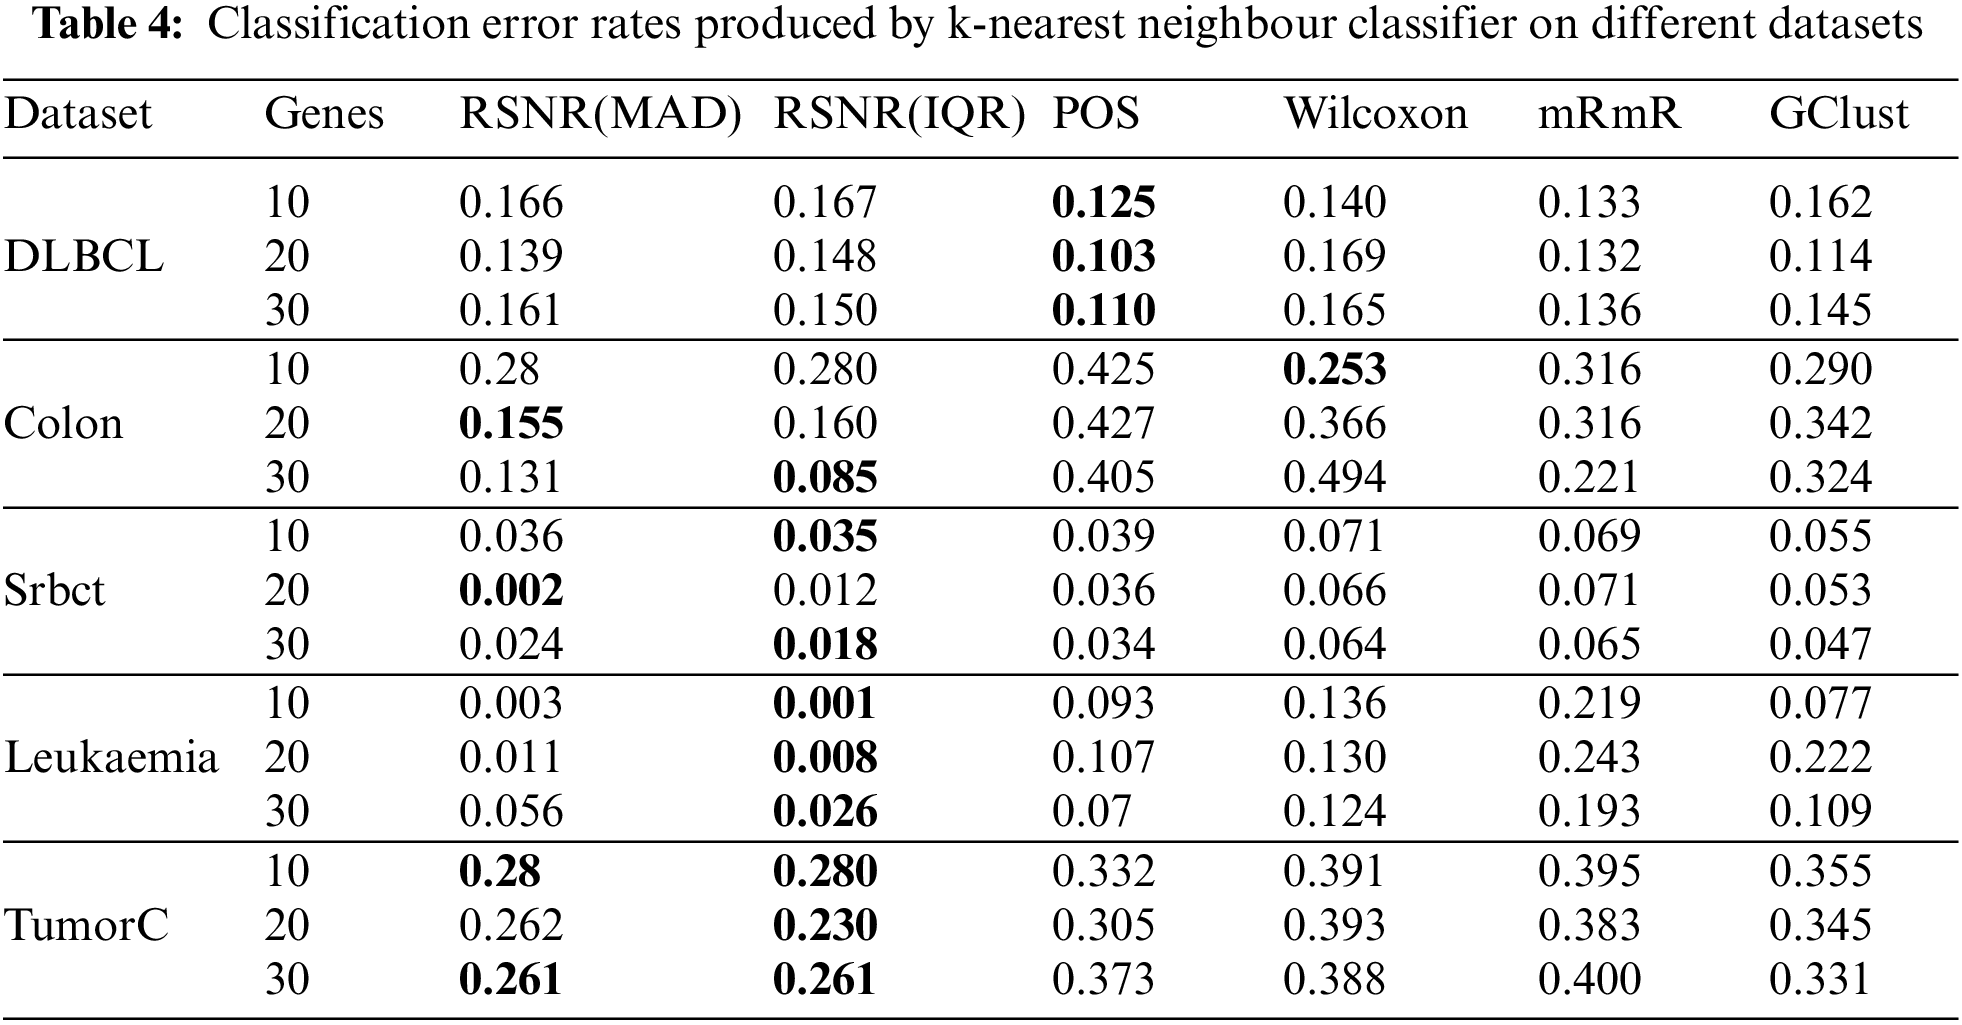
Efficacy of the selected genes can also be checked by using k-Nearest Neighbors (kNN) classifier. Tab. 4 represents the results of selected genes for different feature selection methods on k-Nearest Neighbors classifier. It is clear from Tab. 4 that the method “POS” has outperformed rest of the procedures in all the cases for the “DLBCL” dataset. For the datasets i.e., “Leukemia” and “TumorC” the proposed method “RSNR” has the minimum error rates as compared to other methods for all subset of genes.
For further assessment of the results produced by the proposed RSNR method and other classical procedures, box-plots are also constructed for 20 numbers of features they are given in Fig. 3. These box-plots clearly show that the proposed method RSNR outperforms the rest of the procedures in case of the “TumorC” data. In case of the dataset “DLBCL” the method “POS” outperforms all the other methods. The proposed method computed using (MAD) and (IQR) produced minimum error rates in case of the dataset “Srbct”. Similar conclusion could be drawn in case of the dataset i.e., “Colon” and “Leukemia”. Thus the proposed RSNR method beats rest of the feature selection procedures on the considered datasets in majority of the cases.
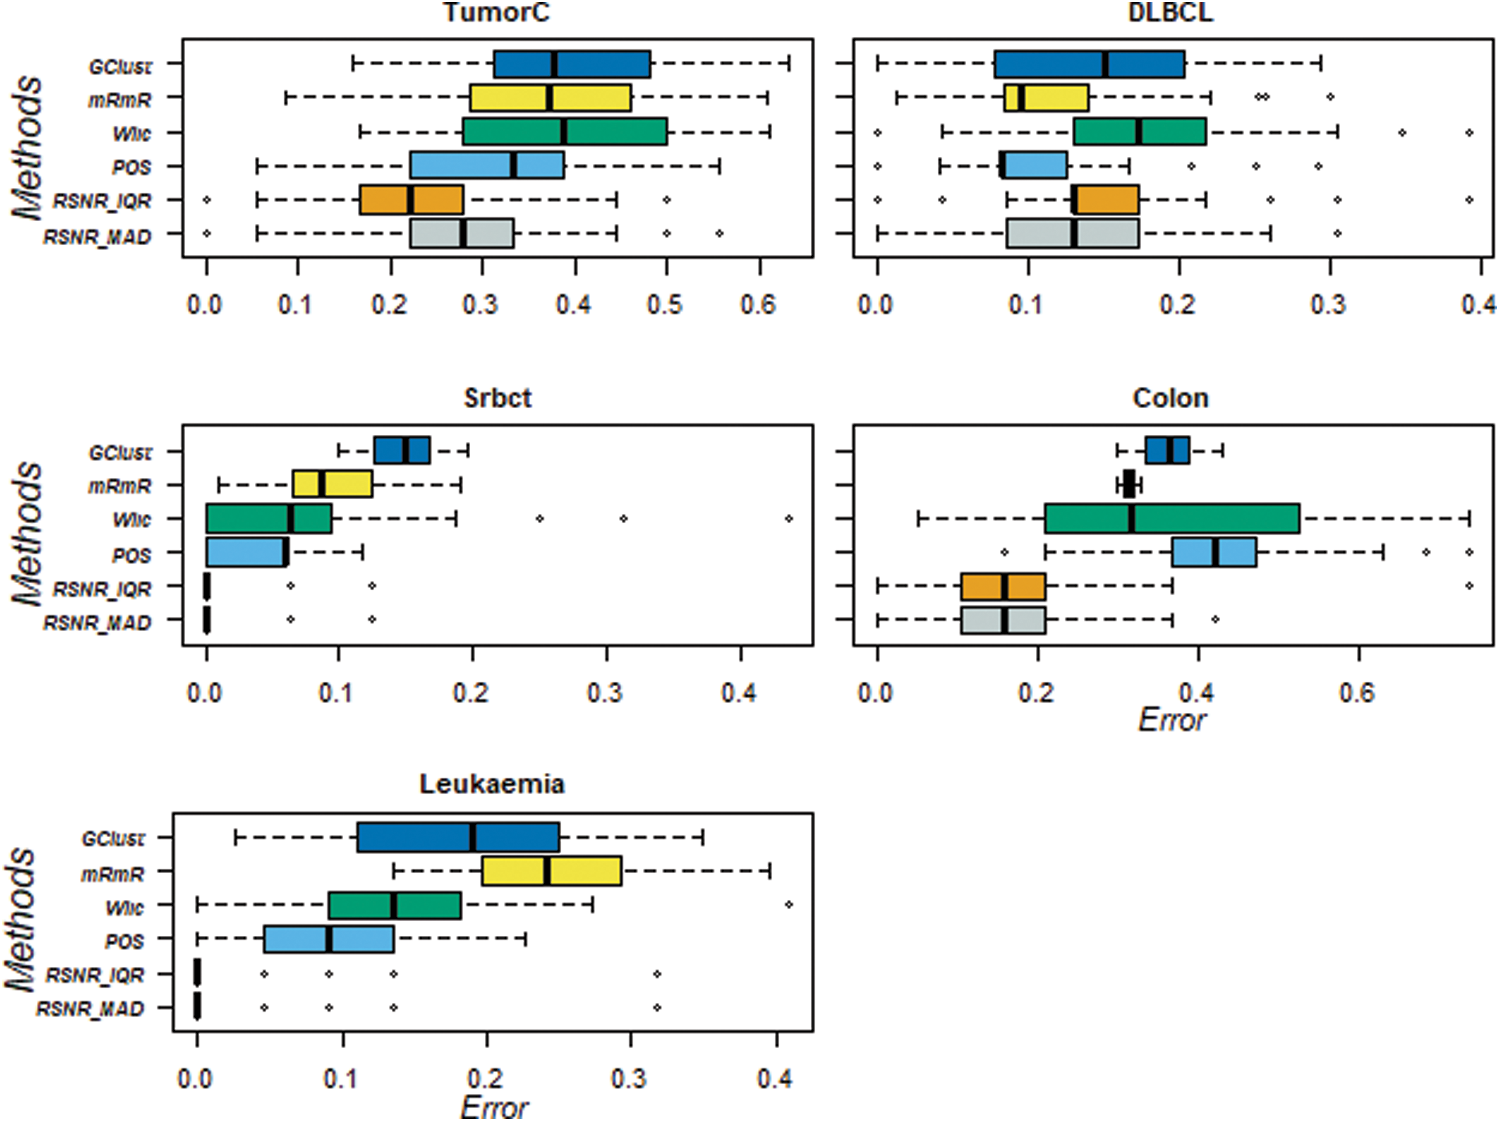
Figure 3: Classification error rates of RSNR and other standard methods on top 20 genes
Further assessment of the proposed RSNR method has also been done by plotting the errors, calculated for various numbers of features, and their results are given in Fig. 4. From the given figure, it is evident that for the dataset “TumorC”, the proposed method has produced minimum classification error rates as compared to other state-of-the-art methods for various number features. In case of “Colon” dataset the classification error rates produced by the proposed procedures based on MAD and IQR are minimum for 20 and 30 the number of features. Similar conclusion can be drawn for the other benchmark datasets.

Figure 4: Classification error rates of different methods on different number of genes
This section describes two simulation scenarios for the proposed method. The first scenario is designed to mimic a situation where the proposed method is useful, whereas the second scenario shows a data generating environment that might not favour the proposed method. For this purpose two different models are used, one for each scenario. The class probabilities of the Bernoulli response Y = Bernoulli (p) given n × p dimensional matrix X of n iid observations from Normal (0, 1) and Uniform (0, 1) distributions, in each scenario are generated by using the following equation.
The values of a and b are both fixed at 1.5. A vector of coefficients i.e., β is generated from uniform (5, − 5) distribution to fit the linear predictor given
Top five i.e., K = 5, important variables are identified from the above model based on their coefficients βs. In order to contaminate the data, outliers are added to these top five variables from Normal (20, 60) distribution. In addition, some noisy variables are also added to the data from Normal (5, 10) distribution. By this way, a simulated data having n = 100 observations and p = 120 variables is generated. The second model is also constructed in a similar fashion. The difference between the two models is that, the former contains 20% of the total observations as outliers in the important variables while the later does not contain outliers. A total of 500 realizations are made in this paper for data simulation. For running the algorithms, the same experimental setup is used as given for benchmark datasets.
The results of the simulation study for both the scenarios i.e., dataset having ouliers and the dataset that do not have outliers in the variables are given in Tabs. 5 and 6, respectively. From Tab. 5, it is clear that, when the data contain outliers in the important variables or features, the proposed method (RSNR) computed under median absolute deviation (MAD) is producing minimum error rates as compared to the other methods, in majority of the cases, except for the number of genes 25 where the method (Wilc) is producing minimum error rate. Similarly, in the second scenario, where there are no outliers in the data, the method (Wilc) is producing minimum error rates in all the cases as shown in Tab. 6. The analysis of simulated data reveals that the performance of the feature or gene selection method can be affected by the presence of outliers in the high dimensional datasets. Moreover, for further illustration, the performance of the proposed method has also been shown in the form of plots given in Fig. 5. Plot (A) indicates a situation where the data has outliers in the important variable, whereas plot (B) represents a scenario when there are no outliers in the data. Form Plots (A) and (B), the same conclusion could be drawn as that from Tabs. 5 and 6.
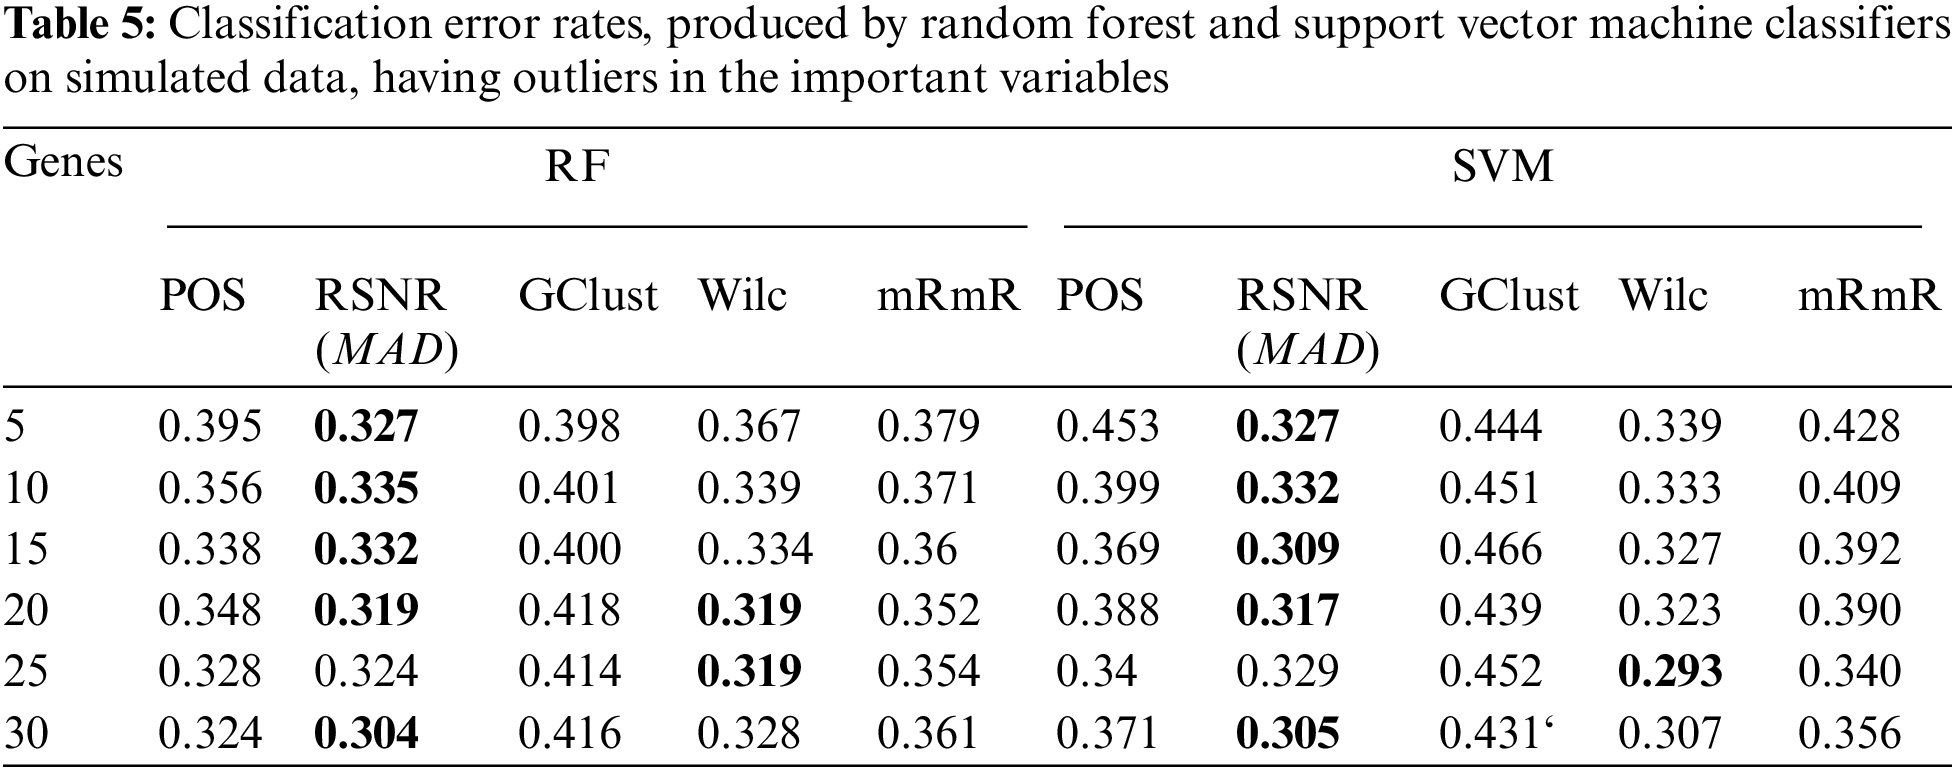
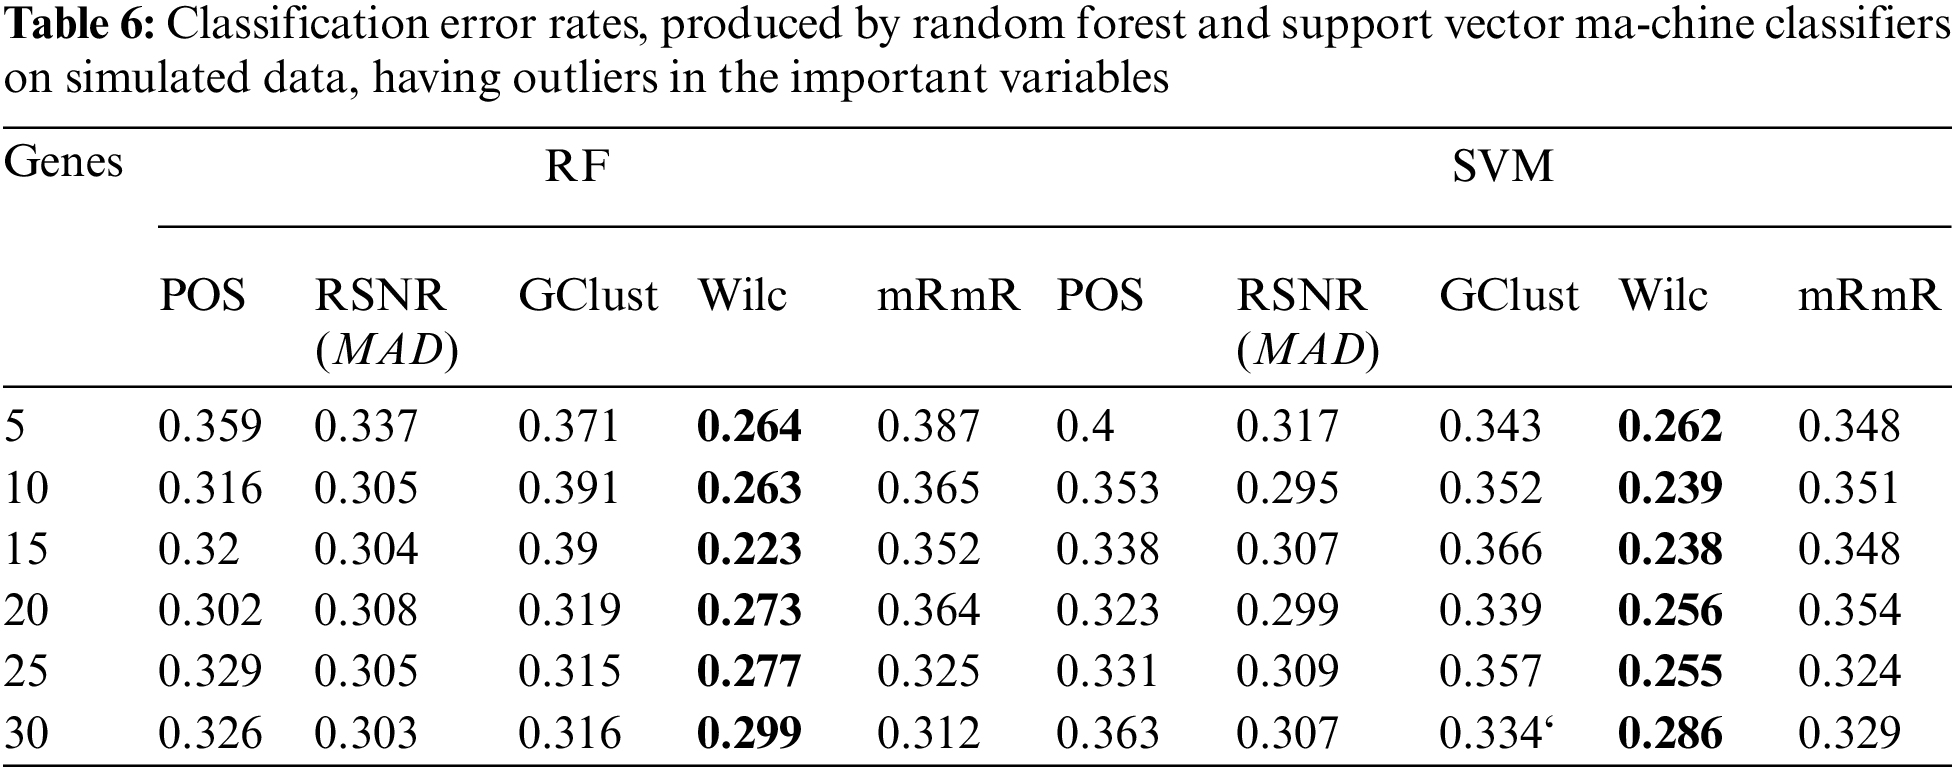
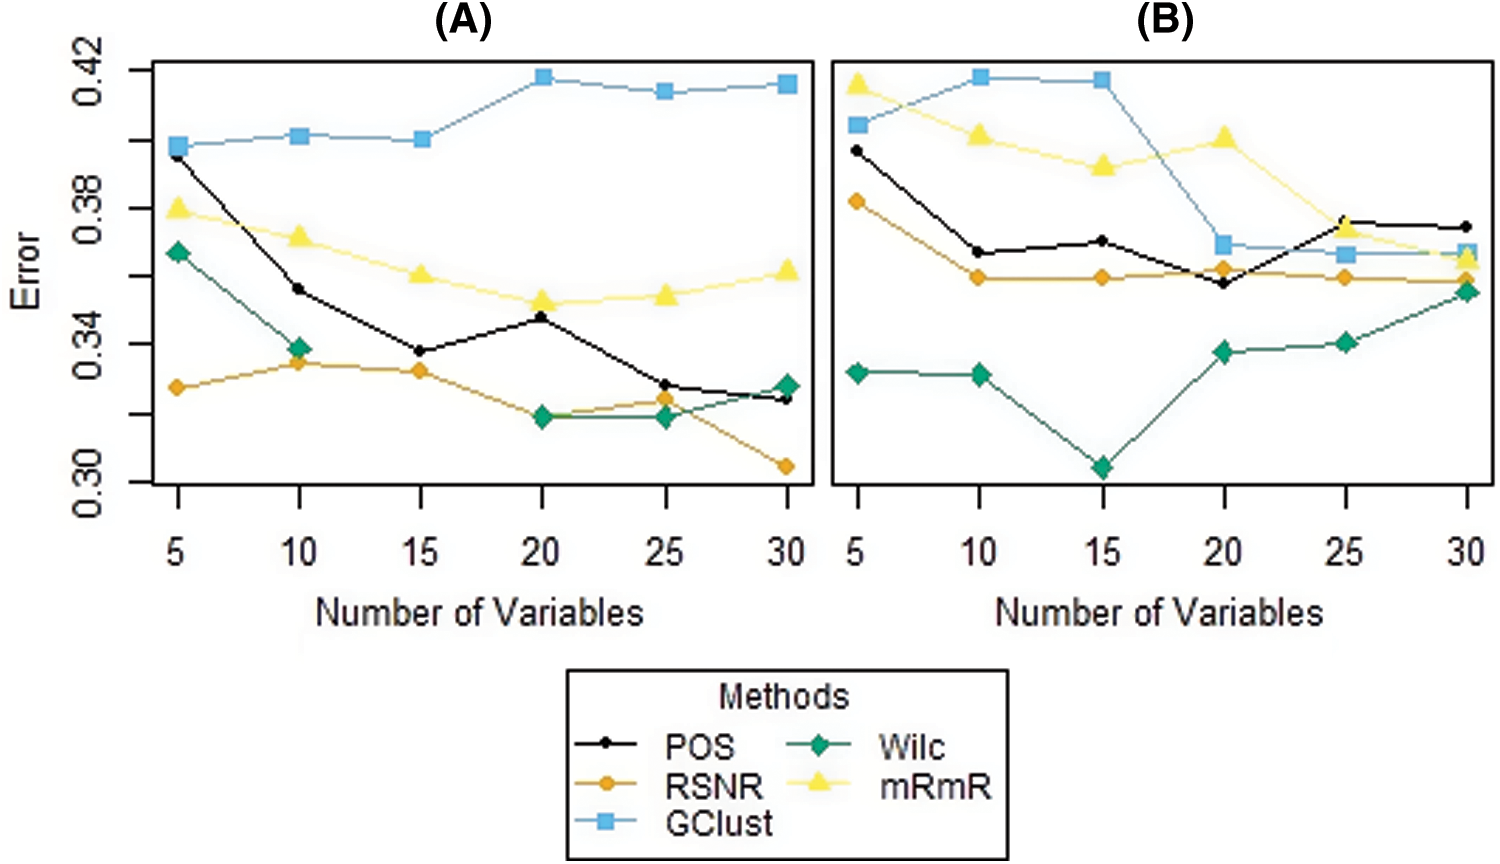
Figure 5: Plots of error rates of different methods for different subsets of genes for the datasets; (A): when there are outliers in the variables, (B): when there are no outliers in the variables
This study has presented a novel procedure of feature selection for microarray datasets by the combination of top-ranked features/genes selected via greedy procedure and the robust versions of the signal to noise ratio. The Proposed method (RSNR) utilizes the more robust measures of location and dispersion i.e., Median, Median absolute deviation (MAD) and Inter quartile range (IQR), for the identification of discriminative genes in high dimensional gene expression datasets. The proposed method identifies the most important and significant features in a manner to mitigate the effect of extreme values present in the data in combination with the small set of features determined by the greedy procedure given in [5]. The genes that have larger (RSNR) scores are considered as important because they maximize the difference between the two classes in binary class problems. The selection of important genes is carried out in two phases. In the first phase, the minimum subset of genes that unambiguously classify the tissue samples to their true classes is obtained via the greedy search approach. In the second phase the features that are not determined in the minimum subset are considered for the computation of Robust Signal to Noise Ratio (RSNR). By this way two mutually exclusive groups of important features/genes are obtained. The final top-ranked set of features considered for the construction of model is obtained from the combination of features determined via the greedy search procedure given in [5] and the top ranked genes computed via the proposed method (RSNR). The performance of the proposed method is assessed by using six gene expression datasets. It is evident from the results that the proposed method outperformed all the other competitors. Moreover, the analysis of simulated data reveals that the performance of the feature or gene selection method can be affected by the presence of outliers in the high dimensional datasets where the proposed method can effectively handle the problem. The reason behind efficacy of the proposed (RSNR) method is that the value of Signal to Noise Ratio (SNR) given in [23] and [24] may increase if there are outliers in gene expression values of a particular gene for different tissue samples belonging to a particular class. Thus a larger value of Signal to Noise Ratio does not imply that the gene has a higher discriminative ability or the genes with smaller SNR have no discriminative ability. For future work in the direction of the proposed method, one can extend this to multi-class probems as well. Further some other measure of dispersions like,
Acknowledgement: The authors extend their appreciation to King Saud University for funding this work through Researchers Supporting Project Number (RSP2022R426), King Saud University, Riyadh, Saudi Arabia.
Funding Statement: This work was supported by King Saud University for funding this work through Researchers Supporting Project Number (RSP2022R426), King Saud University, Riyadh, Saudi Arabia.
Conflicts of Interest: The authors declare that they have no conflicts of interest to report regarding the present study.
References
1. S. Derksen and H. J. Keselman, “Backward, forward and stepwise automated subset selection algorithms: Frequency of obtaining authentic and noise variables,” British Journal of Mathematical & Statistical Psychology, vol. 45, no. 2, pp. 265–282, 1992. [Google Scholar]
2. Y. Saeys, I. Inza and P. Larranaga, “A review of feature selection techniques in bioinformatics,” Bioinformatics, vol. 23, no. 19, pp. 2507–2517, 2007. [Google Scholar]
3. L. Breiman, J. Friedman, C. J. Stone and R. A. Olshen, “Classification and regression trees,” CRC Press, vol. 1, pp. 25–368, 1984. [Google Scholar]
4. I. Guyon and A. Elisseeff, “An introduction to variable and feature selection,” Journal of Machine Learning Research,” vol. 3, no. 3, pp. 1157–1182, 2003. [Google Scholar]
5. O. Mahmoud, A. Harrison, A. Perperoglou, A. Gul, Z. Khan et al., “A feature selection method for classificationwithin functional genomics experiments based on the proportional overlappingscore,” BMC Bioinformatics, vol. 15, no. 1, pp. 274, 2014. [Google Scholar]
6. C. Ding and H. Peng, “Minimum redundancy feature selection from microarray gene expression data,” Journal of Bioinformatics & Computational Biology, vol. 3, no. 2, pp. 185–205, 2005. [Google Scholar]
7. B. Lausen, T. Hothorn, F. Bretz and M. Schumacher, “Assessment of optimal selected prognostic factors,” Biometrical Journal: Journal of Mathematical Methods in Biosciences, vol. 46, no. 3, pp. 364–374, 2004. [Google Scholar]
8. Z. Khan, M. Naeem, U. Khalil, D. M. Khan, S. Aldahmani et al., “Feature selection for binary classification within functional genomics experiments via interquartile range and clustering,” IEEE Access, vol. 7, pp. 78159–78169, 2019. [Google Scholar]
9. L. Breiman, “Random forests,” Machine Learning, vol. 45, no. 1, pp. 5–32, 2001. [Google Scholar]
10. T. Cover and P. Hart, “Nearest neighbor pattern classification,” IEEE Transactions on Information Theory, vol. 13, no. 1, pp. 21–27, 1967. [Google Scholar]
11. O. Chapelle, P. Haffner and V. N. Vapnik, “Support vector machines for histogram-based image classification,” IEEE Transactions on Neural Networks, vol. 10, no. 5, pp. 1055–1064, 1999. [Google Scholar]
12. M. Draminski, A. Rada-Iglesias, S. Enroth, C. Wadelius, J. Koronacki et al., “Monte carlo feature selection for supervised classification,” Bioinformatics, vol. 24, no. 1, pp. 110–117, 2008. [Google Scholar]
13. H. Peng, L. Fuhui and D. Chris, “Feature selection based on mutual information criteria of max-dependency, max-relevance, and min-redundancy,” IEEE Transactions on Pattern Analysis & Machine Intelligence, vol. 27, no. 8, pp. 1226–1238, 2005. [Google Scholar]
14. J. Lu, R. T. Kerns, S. D. Peddada and P. R. Bushel, “Principal component analysis-based filtering improves detection for affymetrix gene expression arrays,” Nucleic Acids Research, vol. 39, no. 13, pp. e86–e86, 2011. [Google Scholar]
15. W. Talloen, D. A. Clevert, S. Hochreiter, D. Amaratunga, L. Bijnens et al., “I/Ni-calls for the exclusion of noninformative genes: A highly effective filtering tool for microarray data,” Bioinformatics, vol. 23, no. 21, pp. 2897–2902, 2007. [Google Scholar]
16. Y. Su, T. Murali, V. Pavlovic, M. Schaffer and S. Kasif, “Rankgene: Identification of diagnostic genes based on expression data,” Bioinformatics, vol. 19, no. 12, pp. 1578–1579, 2003. [Google Scholar]
17. D. Apiletti, E. Baralis, G. Bruno and A. Fiori, “The painter’s feature selection for gene expression data,” in Proc. IEEE Engineering in Medicine and Biology Society, Lyon, France, pp. 4227–4230, IEEE, 2007. [Google Scholar]
18. D. Apiletti, E. Baralis, G. Bruno and A. Fiori, “Maskedpainter: Feature selection for microarray data analysis,” Intelligent Data Analysis, vol. 16, no. 4, pp. 717–737, 2012. [Google Scholar]
19. Z. Li and W. Gu, “A Redundancy-removing feature selection algorithm for nominal data,” PeerJ Computer Science, vol. 1, pp. e24, 2015. [Google Scholar]
20. M. Dashtban, M. Balafar and P. Suravajhala, “Gene selection for tumor classification using a novel bio-inspired multi-objective approach,” Genomics, vol. 110, no. 1, pp. 10–17, 2018. [Google Scholar]
21. N. Mahendran, P. M. Durai Raj Vincent, K. Srinivasan and C. Y. Chang, “Machine learning based computational gene selection models: A survey, performance evaluation, open issues, and future research directions,” Frontiers in Genetics, vol. 11, pp. 1–25, 2020. [Google Scholar]
22. N. Mahendran, P. D. R. Vincent, K. Srinivasan and C. Y. Chang, “Improving the classification of Alzheimer’s disease using hybrid gene selection pipeline and deep learning,” Frontiers in Genetics, vol. 12, pp. 784814, 2021. [Google Scholar]
23. D. Mishra and B. Sahu, “Feature selection for cancer classification: A signalto-noise ratio approach,” International Journal of Scientific & Engineering Research, vol. 2, no. 4, pp. 1–7, 2011. [Google Scholar]
24. S. H. Bonanza, K. Auhmani and A. Zeroual, “Application of the filter approach and the clustering algorithm on cancer datasets,” Leukemia, vol. 8, no. 7129, pp. 72, 2018. [Google Scholar]
25. T. R. Golub, D. K. Slonim, P. Tamayo, C. Huard, M. Gaasenbeek et al., “Molecular classification of cancer: Class discovery and class prediction by gene expression monitoring,” Science, vol. 286, no. 5439, pp. 531–537, 1999. [Google Scholar]
26. U. Alon, N. Barkai, D. A. Notterman, K. Gish, S. Ybarra et al., “Broad patterns of gene expression revealed by clustering analysis of tumor and normal colon tissues probed by oligonucleotide arrays,” Proceedings of the National Academy of Sciences, vol. 96, no. 12, pp. 6745–6750, 1999. [Google Scholar]
27. A. Liaw and M. Wiener, “Classification and regression by randomforest,” R News, vol. 2, no. 3, pp. 18–22, 2002. [Google Scholar]
28. A. Karatzoglou, A. Smola, K. Hornik and A. Zeileis, “Kernlab-an s4 package for kernel methods in R,” Journal of Statistical Software, vol. 11, no. 9, pp. 1–20, 2004. [Google Scholar]
29. M. Kuhn, “CARET: Classification and regression training,” R package, version 6.0–90. https://CRAN.R-project.org/package=caret, 2021. [Google Scholar]
Cite This Article
 Copyright © 2023 The Author(s). Published by Tech Science Press.
This work is licensed under a Creative Commons Attribution 4.0 International License , which permits unrestricted use, distribution, and reproduction in any medium, provided the original work is properly cited.
 Downloads
 Citation Tools