
 Submit a Paper
 Propose a Special lssue
 Open Access
ARTICLE

Color Edge Detection Using Multidirectional Sobel Filter and Fuzzy Fusion
1 Computer Engineering Department, Faculty of Computers and Information Technology, University of Tabuk, Tabuk 47512, Saudi Arabia
2 Electrical Engineering Department University of Tunis, CEREP, ENSIT 5 Av, Taha Hussein, 1008, Tunis, Tunisia
* Corresponding Author: Slim Ben Chaabane. Email:
Computers, Materials & Continua 2023, 74(2), 2839-2852. https://doi.org/10.32604/cmc.2023.032760
Received 28 May 2022; Accepted 30 June 2022; Issue published 31 October 2022
 View Full Text
 Download PDF
Abstract
A new model is proposed in this paper on color edge detection that uses the second derivative operators and data fusion mechanism. The second-order neighborhood shows the connection between the current pixel and the surroundings of this pixel. This connection is for each RGB component color of the input image. Once the image edges are detected for the three primary colors: red, green, and blue, these colors are merged using the combination rule. Then, the final decision is applied to obtain the segmentation. This process allows different data sources to be combined, which is essential to improve the image information quality and have an optimal image segmentation. Finally, the segmentation results of the proposed model are validated. Moreover, the classification accuracy of the tested data is assessed, and a comparison with other current models is conducted. The comparison results show that the proposed model outperforms the existing models in image segmentation.Keywords
Image segmentation [1,2] is one of the primary challenges in image processing and computer vision [3,4]. In addition, many applications in different fields use image segmentation [5,6]. Therefore, several image segmentation techniques have been developed [7].
The main aim of the segmentation is to convert any given image into homogeneous regions [8,9] relevant to a specific application. Another aim is to detect edges in digital images where some areas have high-intensity contrasts or a massive difference in intensity between neighboring pixels, which could cause variation in image quality and segmentation.
Several image segmentation techniques, such as discontinuity, divide the image based on isolated points detection and abrupt change in grayscale [10,11]. Another technique is edge detection, a fundamental model that delivers information about the boundaries of different objects within the image [11]. Hence, selecting the proper technique is essential to reach the best segmentation results [12,13].
We focus on segmenting color images that use RGB color space in the proposed model. The main challenge is detecting the actual limits of a region with closed curves. Chaabane et al. [14] have proposed a model for combining statistical features of color edges using thresholding techniques. In the first phase, the counter of the image attribute for each of the three different primary colors is identified by a thresholding operation. Then, the three color components' edge results are integrated using fuzzy combination rules.
Having the objective as the previous paper, Zhuo et al. [15] have proposed a model that detects color edges based on CDEDA, which measures the color differences. In the first step, the authors use a color separation operation, which might provide information about the color difference. Then, the color separations are computed in all four directions for the pixel neighbors to detect the edges.
In [16], Sengupta et al. introduced the color space-based edge detection method (CSEDM), including a linear structural element. In the first phase, the image is transformed into red space. Then, the Sobel operator is applied to detect edges. Finally, the linear structuring elements are presented in the second phase, and hole filling is applied for suitable image segmentation. However, in [17], El-Sayed et al. exploited the Shannon entropy to achieve the process of edge detection and image segmentation. The authors introduced a new model based on multilevel thresholding and Shannon entropy. To successfully create a two-dimensional histogram, their model uses the gray value of the pixel and the average gray value of the entire image. Their proposed model's results show that it performs better in capturing moderate quality and execution time than existing models, especially regarding large-size images.
In [18], Wei-Chun et al. developed a quasi-high-pass filter for edge detection (QFEDM) that is used in medical images. The proposed kernel-based detector technique was compared to conventional edge detectors. The proposed operator significantly reduced the frequent problems with edge detection, including thinness loss, fragmentation, and position dislocation.
However, most of the current image edge detectors provide only candidates for the region's boundaries. The main reason is that they usually obtain color edges over-detected or discontinuous. On the other hand, edge detection using Sobel and data fusion does not require any before or after processing methods, which makes it a suitable solution for these disadvantages.
This work proposes a hybrid image segmentation technique using the new Sobel edge detection and data fusion technique. After determining the local strength of the maximum edge in all three RGB color components, the thresholding technique is implemented to find the optimal threshold automatically. This process will lead to the region boundaries of each color component. Eventually, once the edges are determined, the three primitive colors are fused using the combination rule and decision to get the final image segmentation.
The proposed model is discussed in Section 2. Section 3 shows the results and compares the proposed model to the existing techniques in the literature. Finally, Section 4 concludes the paper.
In color edge detection that uses RGB representation, the pixel has three color components: red, green, and blue. Since the correlation among these color components is high, It became suitable for color display but not for analysis and segmentation [2,6,15]. If the correlation is high, any intensity changes will change RBG components accordingly. In this context, color edge detection using the data fusion technique is an interesting method.
In this study, each RGB component has an edge detection based on a new Sobel edge detection. In addition, a thresholding mechanism is utilized to determine the region's boundaries for each component color to achieve this. The proposed method combines two segmentation techniques [19] to achieve a good consistency edge instead of developing a better-designed segmentation model.
Once the edge detection of each component color is calculated, the combination rule is used to achieve the final results of the segmentation. A flowchart depicting the proposed model is shown in Fig. 1.
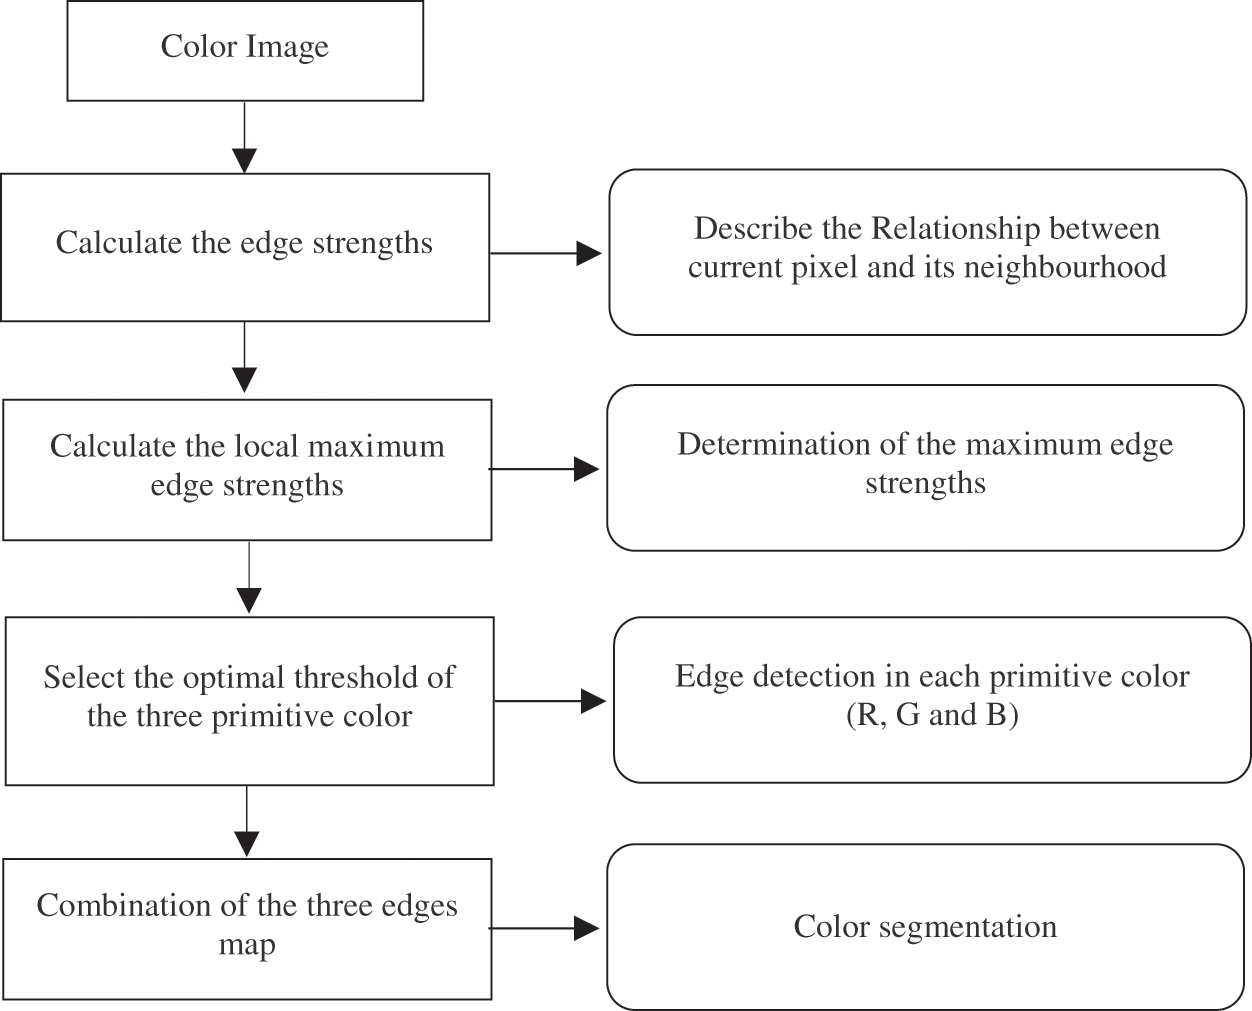
Figure 1: The flowchart of the proposed technique
2.1 Compute of Local Maximum Edge Strengths
The edge strengths of each component color are specified using the connection between the current pixel and neighbors, as shown in Fig. 2a. To solve this issue, the second-order neighborhood describes each component color of the input image to be combined. For example, an edge overlaps with other neighboring pixels in one of the four representative patterns shown in Fig. 2b.
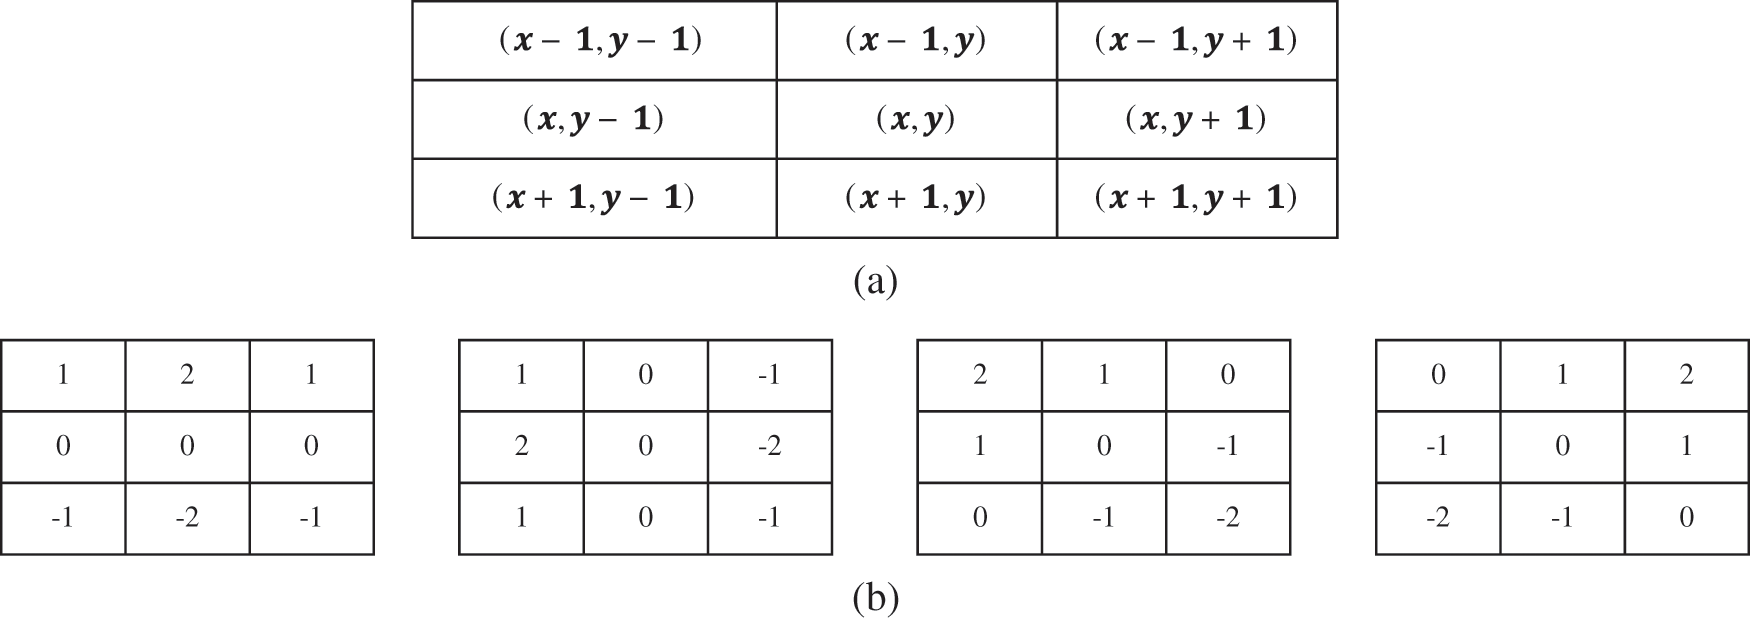
Figure 2: The four edge strengths. (a) The neighborhood of the current pixel
As shown in Fig. 2a, these edge strengths: ES1, ES2, ES3, and ES4 are computed using the weighted sum method of neighboring pixels,
For each pixel, the edge patterns, as shown in Fig. 2b, present the edge strengths ES1, ES2, ES3, and ES4, which are calculated using the two-dimensional digital convolution matrices with coefficients (
For a pixel
where
Fig. 3 shows the edge strengths performance based on image Cameraman. The local maximum edge strength of pixel
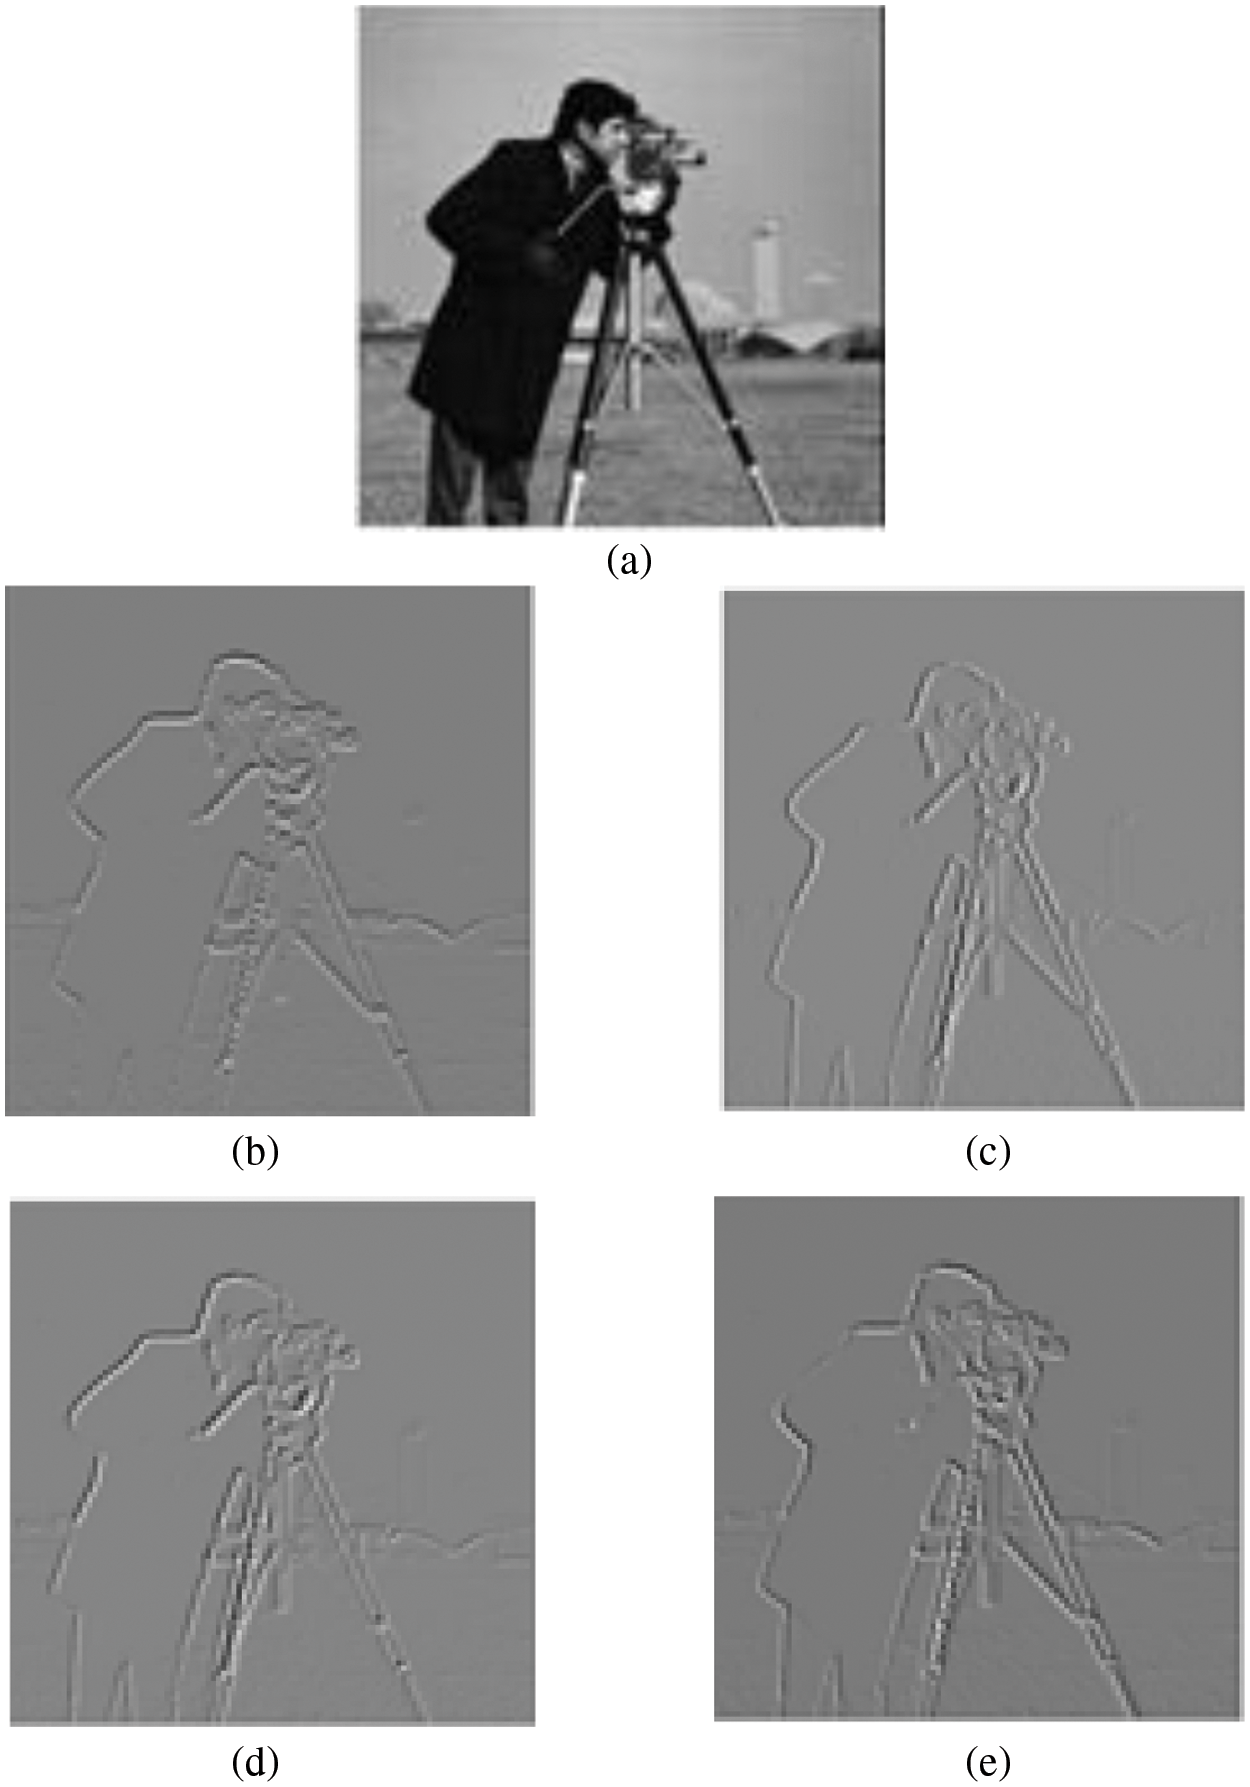
Figure 3: Edge strengths performance based on image “Cameraman”, (a) Original image, (b) (c) (d) and (e) Edge strength induced by
Given an optimal threshold
In practice, a pixel is identified as an edge pixel and set to 1 if the local maximum edge intensity of any of its three component colors is greater than the ideal threshold automatically established using the TSOM method. Otherwise, it is called a non-edge pixel and its value is set to 0.
2.2 Automatic Thresholding using a Two Stage Optimization Approach
The proposed model uses Otsu's two-stage multi-threshold method to select the best threshold for both models (unimodal and bimodal). In addition, the shortcomings of the Otsu method, such as the selection of multivalued thresholds, have been greatly improved. The general concept of the TSMO scheme is described in [20].
This technique is used to reduce significantly the iterations needed for computing the zeroth and first-order moments of a class. Therefore, we design two-stage thresholding technique to automatically classify the pixels into the predefined categories: edges and nonedges.
In the first stage, the histogram of the image with
Let Ω = {
The zeroth-order cumulative moment in the qth group denoted by
where:
The first-order cumulative moment in the qth group denoted by
The optimal threshold
However, in our application we are interested to segment the input image into two classes: eye and non-eye classes. The image is divided into two classes
The numbers of the cumulative pixels (
and
where
For a bi-level thresholding (
where
At the second stage of multilevel thresholding technique, to determine the optimal threshold
The optimal threshold
The
Given the optimal thresholds for the three primary colors red, green, and blue (
Data fusion is a strategy for associating, correlating, and combining information from single and multiple sources in order to make exact decisions.
In color edge detection, the technology of multichannel data fusion could enhance the algorithm's validity. Hence, to produce a consistent and accurate color edge, the edge information from the three gradient images may be integrated using a data fusion technique. In this work, the joint edge is calculated using the following fuzzy rule:
A pixel
3 Experimental Results and Discussion
In order to evaluate the proposed edge detection algorithm, 100 color synthetic images stored in RGB format are used. The RGB image represents the combination of Red, Green, and Blue primitive colors. Each of the three primitive colors uses 8 bits with integer values between 0 and 255.
Various segmentation results were presented to assess the efficiency and accuracy of the proposed method. In addition, the results are compared vs. existing methods including Prewitt, Canny, Sobel, CDEDA Method [9], CSEDM Method [10] and QFEDM Method [11]. The experiments are carried out on the MATLAB software 10. Example of synthetic images of size
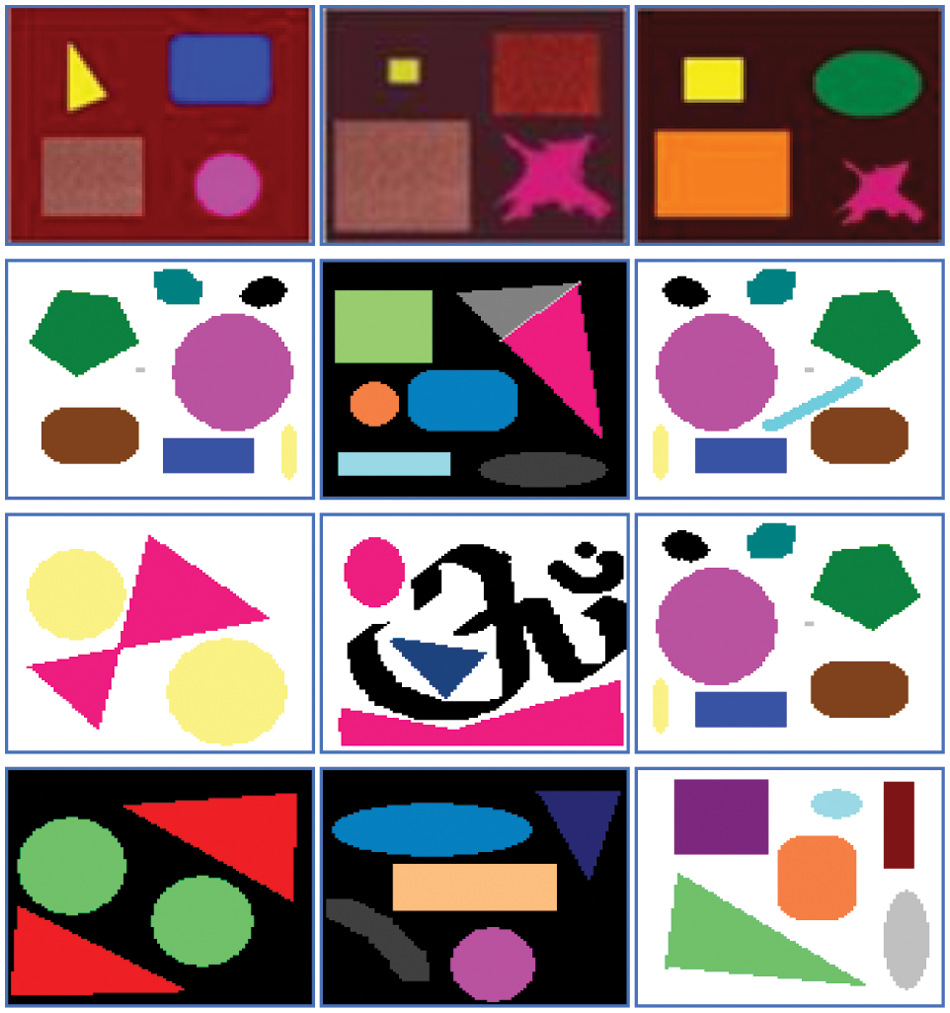
Figure 4: Samples of synthetic images
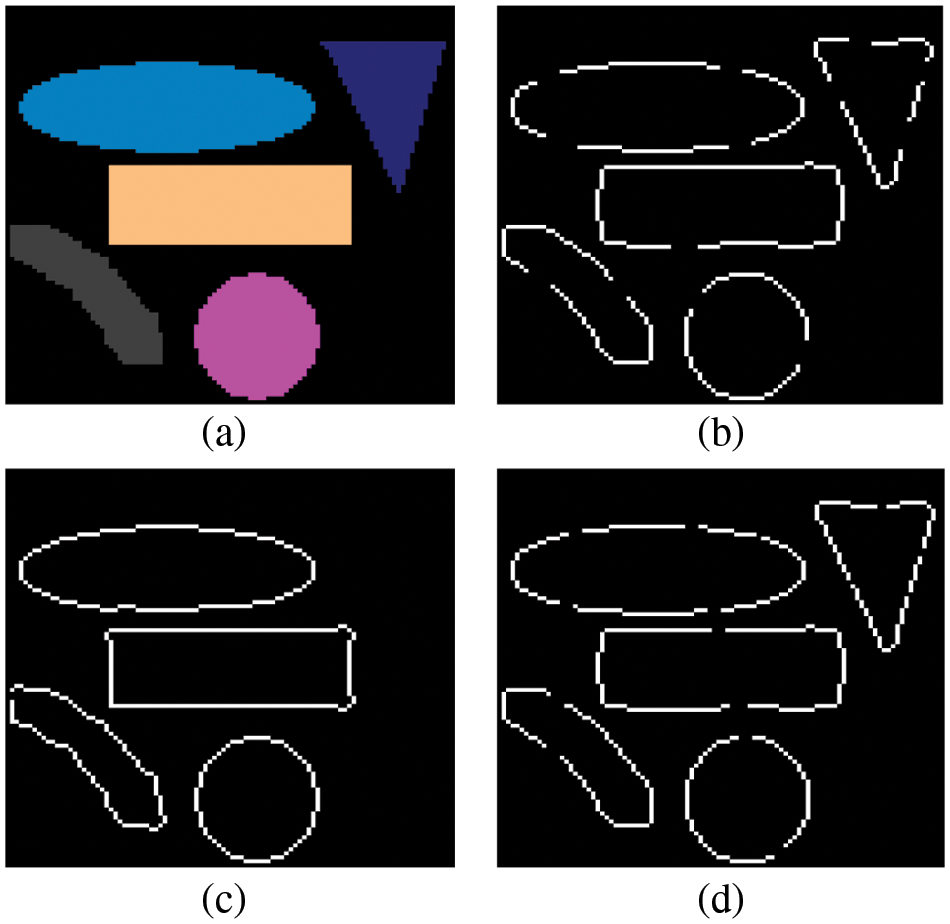
Figure 5: Edge detection results. (a) Original image of size
Fig. 5a presents the original image. The segmentation results obtained by the proposed algorithm applied to Red, Green and Blue component are shown in Figs. 5b–5d, respectively. Nevertheless, the edges are well identified in one component and unrecognized in the others. This shows that the use of a single information source does not give good segmentation results, and this can be explained by the high degree of correlation between the three components of the RGB color space. Hence, the fusion process appears as interesting technique for color edge detection.
However, the new proposed algorithm is used to produce the estimates of the first derivative of an image by doing a convolution between the original image and the proposed special kernels,
The accuracy which represents the ratio of correct edge detection results over total edge detection results is calculated as:
where:
TP: True positives represent the pixels of the edge that are detected as edge.
TN: True negative represent the pixels of nonedge that are detected as nonedge.
FP: False positive represent the pixels of nonedge that are detected as edge.
FN: False negative represent the pixels of edge that are detected as nonedge.
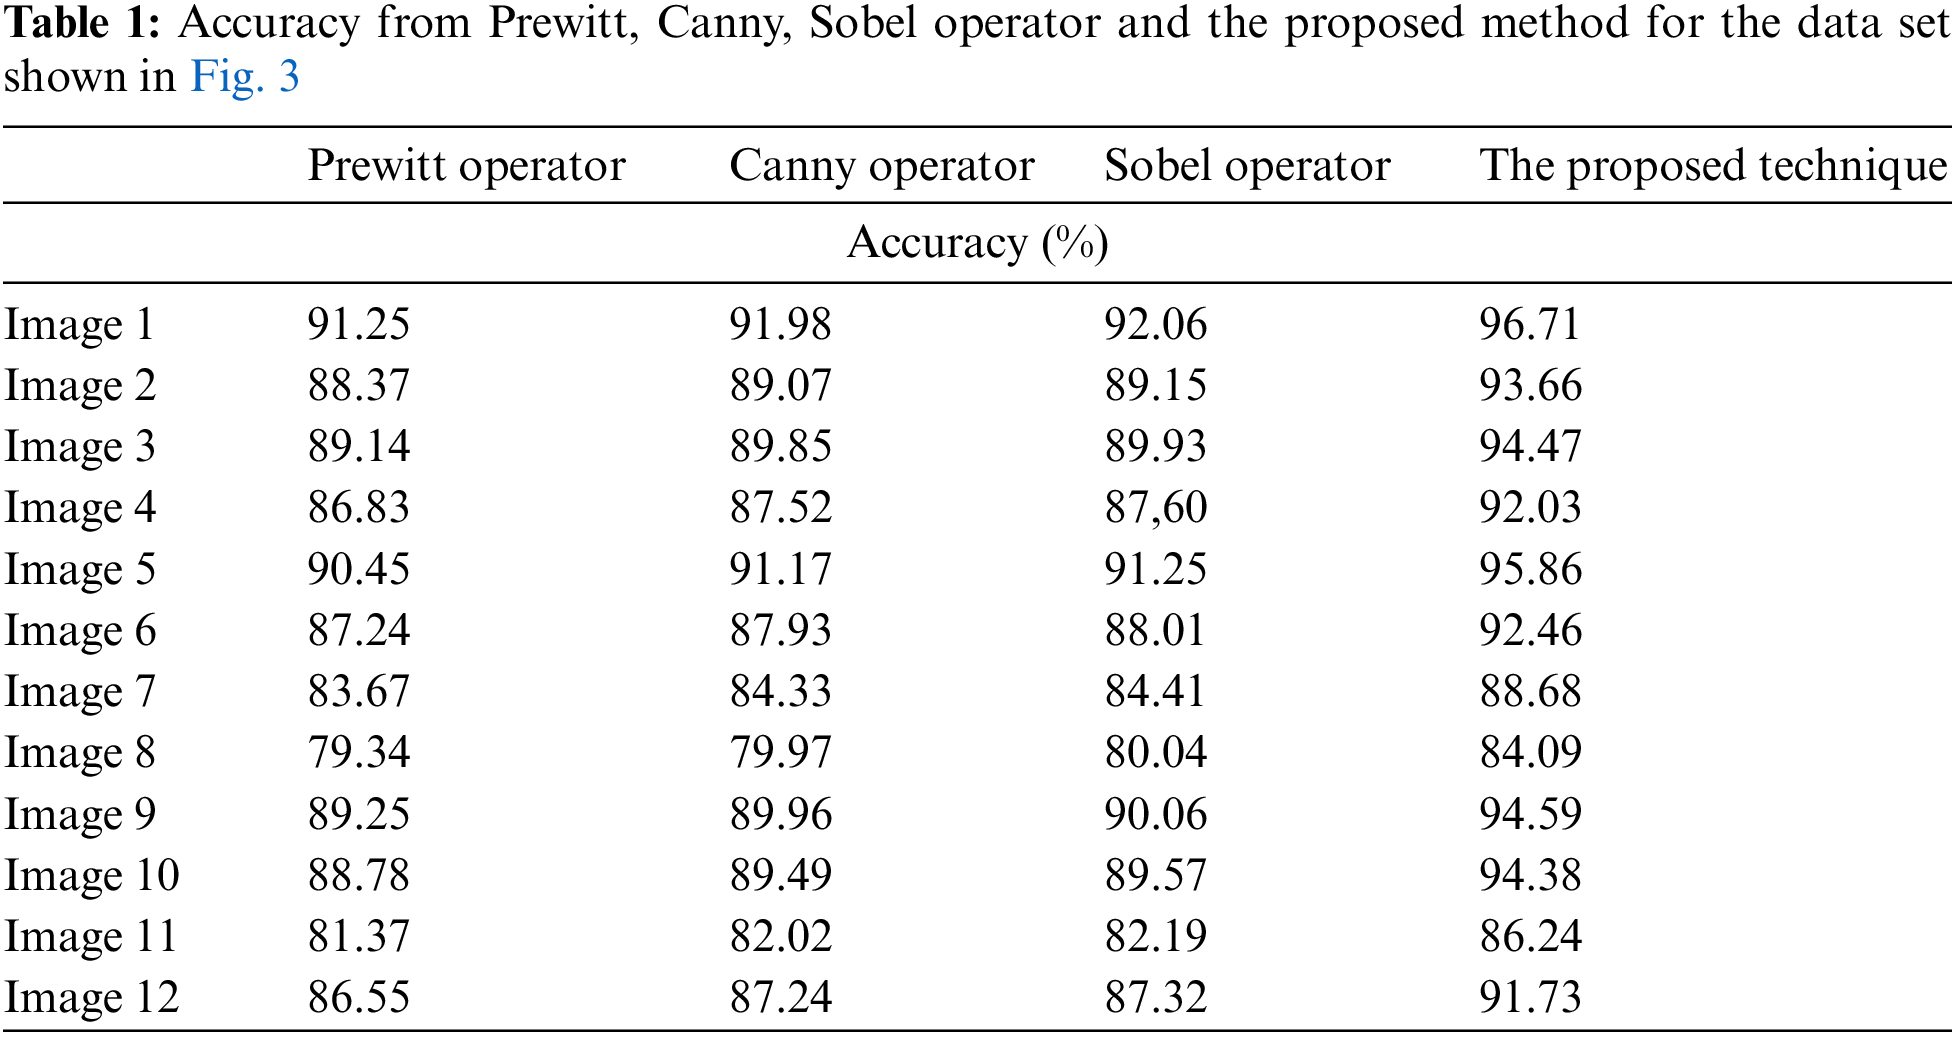
The accuracy of the existing methods such as Prewitt, Canny, Sobel and the proposed algorithm is presented in Tab. 1. It can be seen from Tab. 1, the image 1 has a percentage of incorrectly segmented pixels equal to 8.75%, 8.02%, 7.94% and 3.29% which are obtained by Prewitt, Canny, Sobel operators and the proposed method, respectively. Experimental results show that the proposed edge algorithm is more accurate than existing techniques in terms of edge quality.
Also, compare the performance of the proposed method with other existing methods, including Sengupta et al. (CSEDM) [11], Zhuo et al. (CDEDA) [15], Chun et al. (QFEDM) [18]. Fig. 6 shows edge detection results.
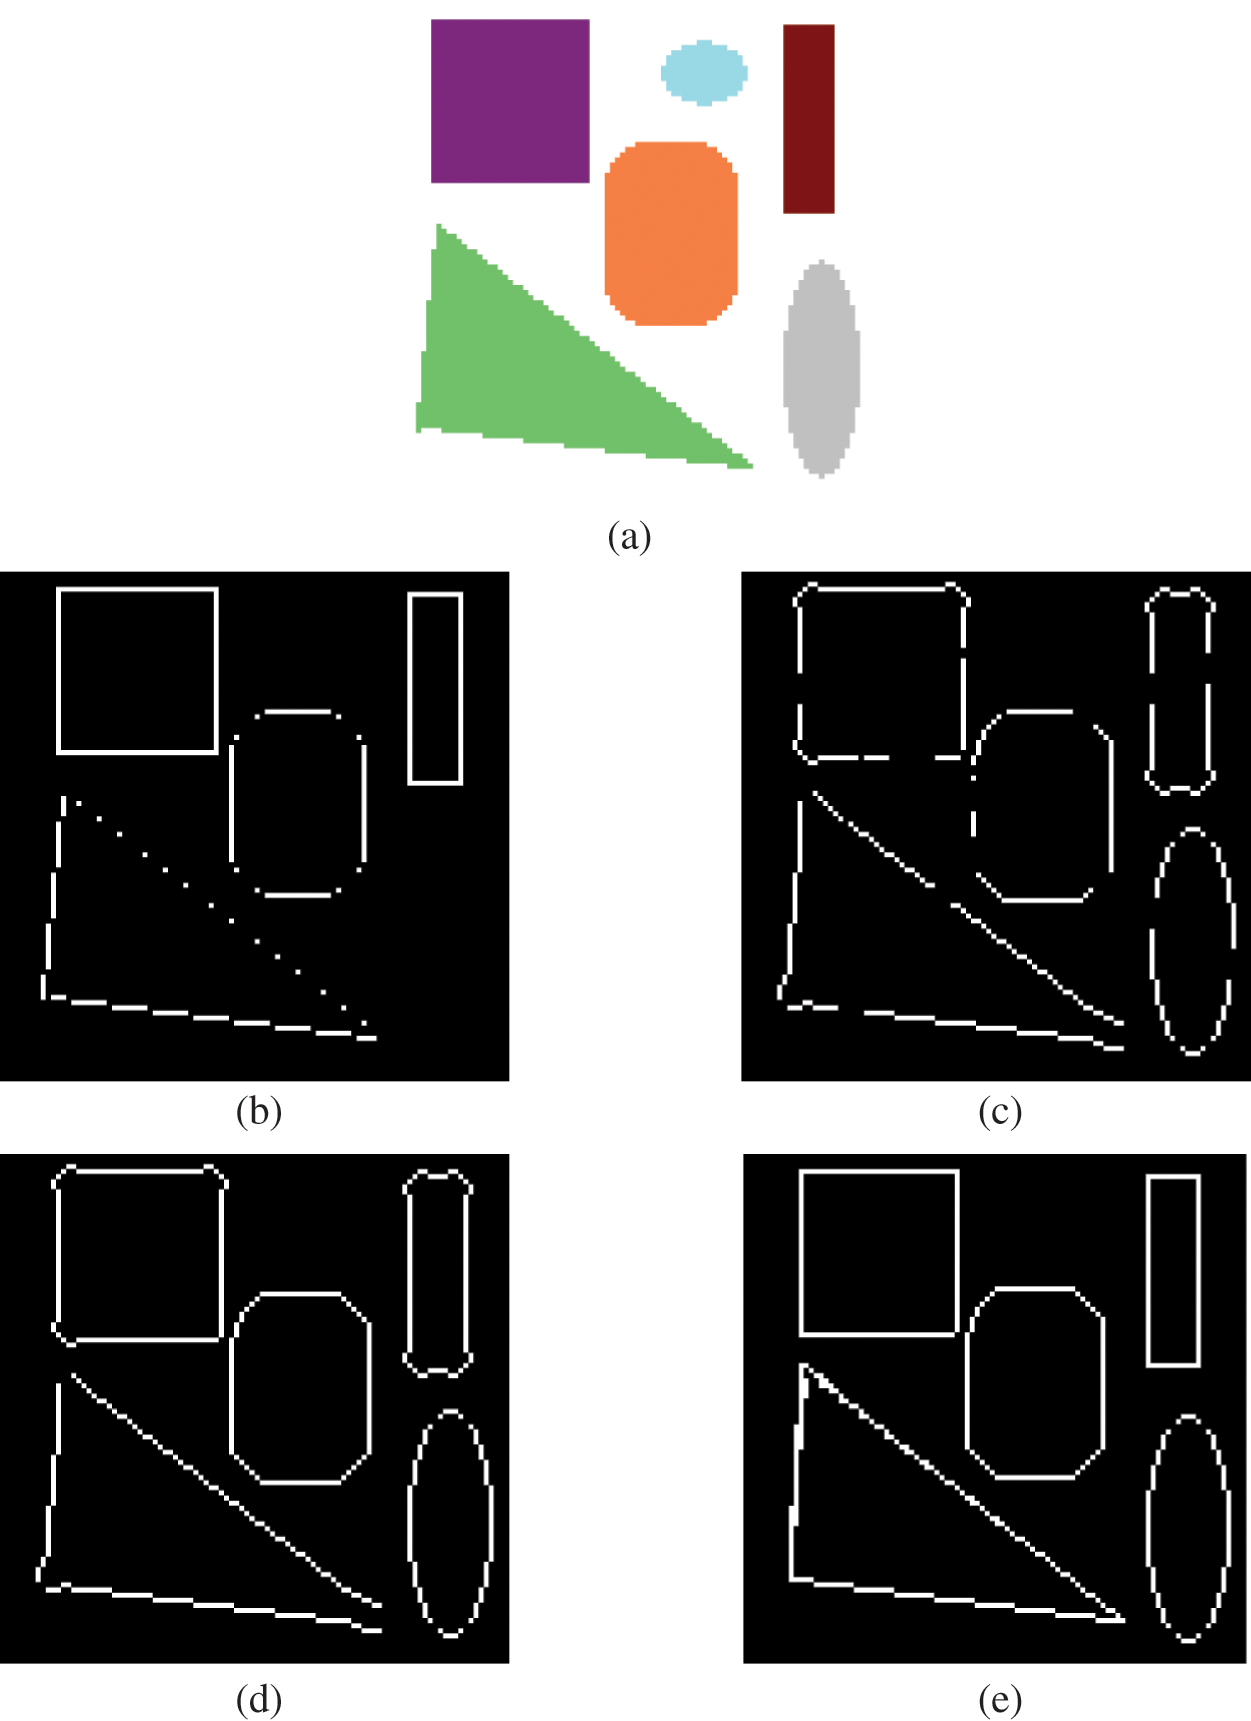
Figure 6: Color edge detection results. (a) Original image of size
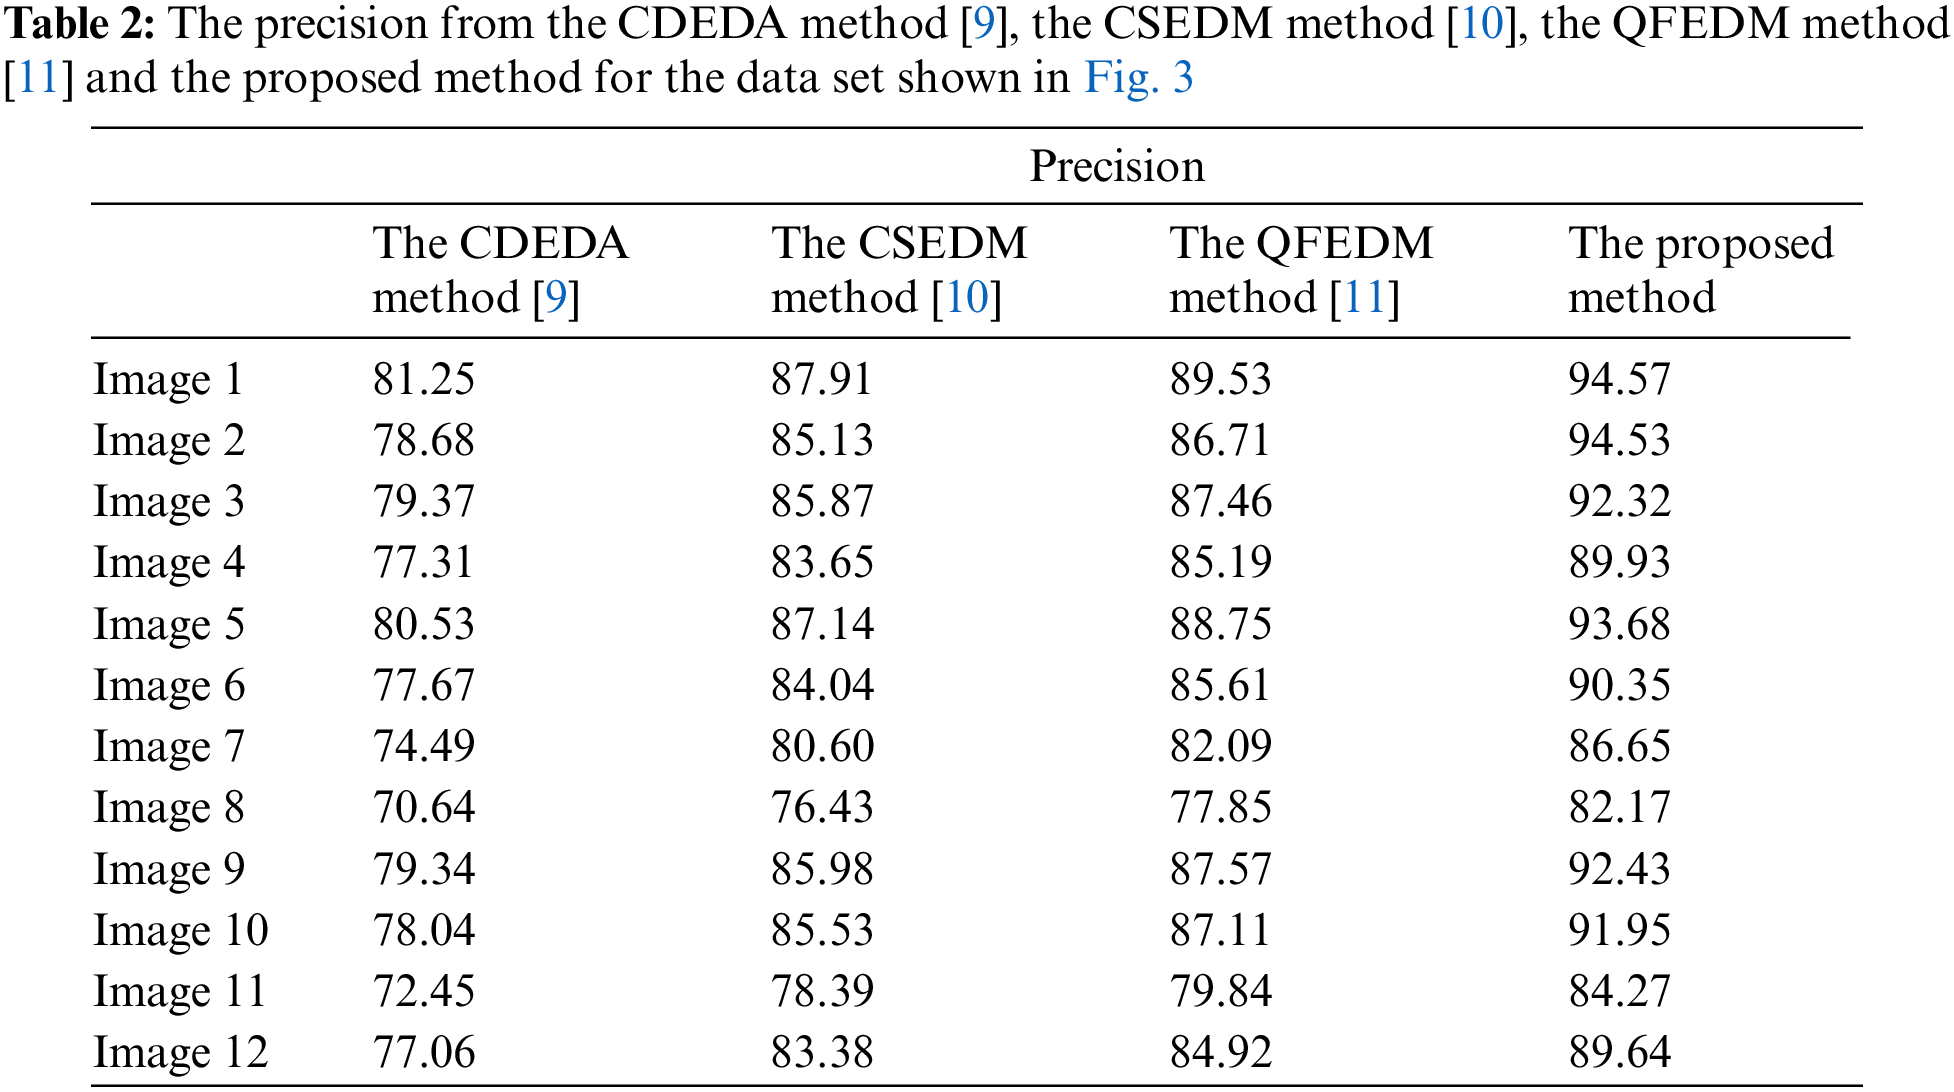
Regarding the precision, Tab. 2 presents the precision of the different methods applied to the color synthetic images used in the experiment. Bhatt et al. [22] have used the precision criteria to assess the efficiency of the segmentation approach in the biomedical application [23]. In our application, the precision criteria is used to evaluate the proposed method applied to color synthetic images.
The precision is defined as:
From Tab. 2, we can see that the proposed edge detector can provide more potential edges compared to these other published techniques. Therefore, the results obtained show that the proposed edge technique using local maximum edge intensities in four different directions and fuzzy combination is more accurate in terms of accuracy and quality than existing methods.
This paper introduced a new color edge detection approach based on the fuzzy fusion and a new Sobel edge detection algorithm. The proposed method comprises two main phases. In the first phase, the local maximum edge strengths in four different directions and the automatic thresholding techniques are used to detect the edges of each component color. In the second phase, the fuzzy fusion rule is used to join the edge results for the three primitive color. The proposed method combines two segmentation techniques to achieve a good consistent edge.
The results show that the proposed technique can effectively detect edges and suppress the effect of noise on the results while maintaining edge consistency. The proposed approach has a lot of potential, according to extensive testing results. It's a good tool for detecting color edges.
Acknowledgement: The authors thank the faculty of computers and information Technology and he Industrial Innovation and Robotics Center, University of Tabuk for supporting the study.
Funding Statement: This research is supported by the faculty of computers and information Technology and the Industrial Innovation and Robotics Center, University of Tabuk.
Conflicts of Interest: The authors declare that they have no conflicts of interest to report regarding the present study.
References
1. S. Arumugadevi and V. Seenivasagam, “Color image segmentation using feedforward neural networks with FCM,” International Journal of Automation and Computing, vol. 13, no. 2, pp. 491–500, 2016. [Google Scholar]
2. P. J. Baldevbhai and R. S. Anand, “Color image segmentation for medical images using L*a*b* color space,” IOSR Journal of Electronics and Communication Engineering, vol. 1, no. 2, pp. 24–45, 2012. [Google Scholar]
3. D. Khafaga, A. Alhussan, E. M. Elkenawy, A. E. Takieldeen, T. M. Hassan et al., “Meta-heuristics for feature selection and classification in diagnostic breast cancer,” CMC-Computers, Materials and Continua, vol. 73, no. 1, pp. 749–765, 2022. [Google Scholar]
4. L. Li, X. Huang, S. Qian, Z. Li, S. Li et al., “Fuzzy hybrid coyote optimization algorithm for image thresholding,” CMC-Computers, Materials and Continua, vol. 72, no. 2, pp. 3073–3090, 2022. [Google Scholar]
5. A. S. Puri and S. Singh, “A hybrid agglomerative method for colour image segmentation,” Advances in Data and Information Sciences, vol. 1, no. 3, pp. 583–592, 2022. [Google Scholar]
6. S. B. chaabane, M. Sayadi and F. Fnaiech, “Color image segmentation using homogeneity method and data fusion techniques,” EURASIP Journal on Advances in Signal Processing, vol. 10, no. 6, pp. 1–11, 2010. [Google Scholar]
7. A. Sharma, D. Prashar, A. A. Khan, F. A. Khan and S. Poochaya, “Automatic leukaemia segmentation approach for blood cancer classification using microscopic images,” CMC-Computers, Materials and Continua, vol. 73, no. 2, pp. 3629–3648, 2022. [Google Scholar]
8. S. B. Chaabane, M. Sayadi, F. Fnaiech, E. Brassart and F. Betin, “A new method for the estimation of mass functions in the Dempster-Shafer’s evidence theory: application to color image segmentation,” Circuits, Systems, and Signal Processing, vol. 3, no. 11, pp. 55–71, 2011. [Google Scholar]
9. R. Harrabi and E. B. Braiek, “Color image segmentation using multi-level thresholding approach and data fusion techniques: Application in the breast cancer cells images,” EURASIP Journal on Image and Video Processing, vol. 12, no. 11, pp. 1–11, 2012. [Google Scholar]
10. S. Sengupta, N. Mittal and M. Modi, “Improved skin lesions detection using color space and artificial intelligence techniques,” Journal of Dermatological Treatment, vol. 5, no. 31, pp. 511–518, 2020. [Google Scholar]
11. S. Sengupta, N. Mittal and M. Modi, “Improved skin lesion edge detection method using ant colony optimization,” Skin Research and Technology, vol. 6, no. 25, pp. 846–856, 2019. [Google Scholar]
12. M. A. Masni and M. A. Antari, “Skin lesion segmentation in dermoscopy images via deep full resolution convolutional networks,” Computer Methods and Programs in Biomedicine, vol. 162, no. 8, pp. 221–231, 2018. [Google Scholar]
13. P. Sahni and N. Mittal, “Breast cancer detection using image processing techniques,” Oriental Journal of Computer Science and Technology, vol. 10, no. 2, pp. 391–399, 2019. [Google Scholar]
14. S. B. Chaabane and F. Fnaiech, “Color edges extraction using statistical features and automatic threshold technique: Application to the breast cancer cells,” BioMedical Engineering OnLine, vol. 13, no. 4, pp. 1–18, 2014. [Google Scholar]
15. L. Zhuo, X. Hu, L. Jiang and J. Zhang, “A color image edge detection algorithm based on color difference,” Sensing and Imaging Springer, vol. 17, no. 16, pp. 1–13, 2016. [Google Scholar]
16. S. Sengupta, N. Mittal and M. Modi, “Morphological transformation in color space based edge detection of skin lesion images,” Innovations in Cyber Physical Systems, vol. 21, no. 1, pp. 265–273, 2021. [Google Scholar]
17. M. A. ElSayed, A. Abdelmgeid, M. E. Hussien and H. A. Sennary, “A multi-level threshold method for edge detection and segmentation based on entropy,” CMC Computers, Materials and Continua, vol. 63, no. 1, pp. 1–16, 2020. [Google Scholar]
18. L. W. Chun and W. J. Wein, “Edge detection in medical images with quasi high-pass filter based on local statistics,” Biomedical Signal Processing and Control, vol. 39, no. 1, pp. 294–300, 2018. [Google Scholar]
19. X. R. Zhang, W. Z. Zhang, W. Sun, H. L. Wu and A. G. Song, “A real-time cutting model based on finite element and order reduction,” Computer Systems Science and Engineering, vol. 43, no. 1, pp. 1–15, 2022. [Google Scholar]
20. C. Huang and C. Wang, “Optimal multi-level thresholding using a two-stage Otsu optimization approach,” Pattern Recognition Letters, vol. 30, no. 3, pp. 275–284, 2009. [Google Scholar]
21. F. A. Ferhat, L. A. Mohamed, O. Kerdjidj, K. Messaoudi, A. Boudjelal et al., “Implementation of Sobel, Prewitt, Roberts edge detection on FPGA,” World Congress in Computer Science, Computer Engineering, and Applied Computing Las Vegas, Nevada, USA, vol. 13, no. 7, pp. 1–5, 2013. [Google Scholar]
22. A. R. Bhatt, A. Ganatra and K. Kotecha, “Cervical cancer detection in pap smear whole slide images using convNet with transfer learning and progressive resizing,” Peer Journal Computer Science, vol. 21, no. 7, pp. 1–18, 2021. [Google Scholar]
23. X. R. Zhang, H. L. Wu, W. Sun, A. G. Song and S. K. Jha, “A fast and accurate vascular tissue simulation model based on point primitive method,” Intelligent Automation & Soft Computing, vol. 27, no. 3, pp. 873–889, 2021. [Google Scholar]
Cite This Article
 Copyright © 2023 The Author(s). Published by Tech Science Press.
This work is licensed under a Creative Commons Attribution 4.0 International License , which permits unrestricted use, distribution, and reproduction in any medium, provided the original work is properly cited.
 Downloads
 Citation Tools