
 Submit a Paper
 Propose a Special lssue
 Open Access
ARTICLE

Automated Autism Spectral Disorder Classification Using Optimal Machine Learning Model
1 Department of Information Systems, College of Computer and Information Sciences, Princess Nourah bint Abdulrahman University, P.O. Box 84428, Riyadh, 11671, Saudi Arabia
2 Department of Information Systems, College of Computer Science, Center of Artificial Intelligence and Unit of Cybersecurity, King Khalid University, Abha, Saudi Arabia
3 Department of Information Systems, College of Computer Science, King Khalid University, Abha, Saudi Arabia
4 Department of Computer Sciences, College of Computing and Information System, Umm Al-Qura University, Saudi Arabia
5 Department of Computer Science, College of Computer, Qassim University, Saudi Arabia
6 Department of Computer Science, Faculty of Computers and Information Technology, Future University in Egypt, New Cairo, 11835, Egypt
7 Department of Computer Science, College of Sciences and Humanities-Aflaj, Prince Sattam bin Abdulaziz University, Saudi Arabia
* Corresponding Author: Mesfer Al Duhayyim. Email:
Computers, Materials & Continua 2023, 74(3), 5251-5265. https://doi.org/10.32604/cmc.2023.032729
Received 27 May 2022; Accepted 29 June 2022; Issue published 28 December 2022
 View Full Text
 Download PDF
Abstract
Autism Spectrum Disorder (ASD) refers to a neuro-disorder where an individual has long-lasting effects on communication and interaction with others. Advanced information technology which employs artificial intelligence (AI) model has assisted in early identify ASD by using pattern detection. Recent advances of AI models assist in the automated identification and classification of ASD, which helps to reduce the severity of the disease. This study introduces an automated ASD classification using owl search algorithm with machine learning (ASDC-OSAML) model. The proposed ASDC-OSAML model majorly focuses on the identification and classification of ASD. To attain this, the presented ASDC-OSAML model follows min-max normalization approach as a pre-processing stage. Next, the owl search algorithm (OSA)-based feature selection (OSA-FS) model is used to derive feature subsets. Then, beetle swarm antenna search (BSAS) algorithm with Iterative Dichotomiser 3 (ID3) classification method was implied for ASD detection and classification. The design of BSAS algorithm helps to determine the parameter values of the ID3 classifier. The performance analysis of the ASDC-OSAML model is performed using benchmark dataset. An extensive comparison study highlighted the supremacy of the ASDC-OSAML model over recent state of art approaches.Keywords
Autism Spectrum Disorder (ASD) was a neuro-developmental ailment that makes persistent deficiency in social interaction behavior and skills of children. According to Diagnostic and Statistical Manual of Mental Disorders 5 (DSM-5) [1], social communication skills have been defined as 1) deficits in non-verbal interactive behavior, 2) deficits in understanding, developing, and maintaining relations 3) deficits in social emotional reciprocity [2]. Moreover, deficits in conduct were described as limited and repeated behaviour patterns and fixated interest between children having autism, which mentioned firstly repeated motor movements or stereotyping; secondly insistence on sameness, problems having variations in rigid outlines of nonverbal or verbal behavior or routine; thirdly fixated interest and finally unusual reply to sensory prospects [3]. Children having sensory problems might contain hypo sensitiveness or hyper sensitiveness to an extensive array of senses namely smells, sights, tastes, touch, sounds, body awareness, and balance. As an instance, children undergoing hypersensitiveness to noises may discover sounds which arise from air-coolers as disturbing [4,5]. Also, other problems habitually refer to sensory problems were swinging back and forth, flailing of the arms or hands, self-harm, and walking on tiptoes.
Autism diagnosis needs substantial amount of cost and time. Detection of autism at an initial stage could be very helpful for the victim counselling patients with correct treatment in the initial level [6]. This actually prevents the condition of patient from worsening and will aid in reducing long-term charges related with deferred prognosis. Hence timely, correct and simple screening test tools are highly necessary that will forecast autism traits in person and detect whether they no need or need complete autism valuation [7,8]. For improving the process of diagnosis of ASD, authors currently initiated implementing machine learning (ML) intellectual approaches. The main goal of such ML works on ASD is enhancing diagnosing period for providing faster accessibility to medical services, enriching accuracy of prognosis, and diminishing dimension of the input data because for identifying the ASDs highest ranked features [9,10]. ML can be referred to a research domain which complies artificial intelligence (AI) search approaches, mathematics, and other sciences for extracting precise prediction methods from datasets. ML approaches namely decision tree (DT), neural network (NN), rule-based classifier, and support vector machine (SVM), were automatic tools that usually need minimum human interference at the time of data processing [11–13].
In [14], the authors focused on revealing the pattern between normal and autistic children by using electroencephalogram (EEG) through the deep learning (DL) technique. The brain signal dataset utilized pattern detection where the extracted feature undergoes the multilayer perceptron (MLP) network for the classification technique. The authors in [15], developed DL method for prognosis of ASD from functional brain network built using brain functional magnetic resonance imaging (fMRI) dataset. The whole Autism Brain Imaging Dataset Exchange 1 (ABIDE 1) is applied for investigating the efficiency of the presented technique. Firstly, we constructed the brain network from brain fMRI image and determines the raw feature according to brain network. Next, we applied an autoencoder (AE) for learning the advanced feature from the raw feature. Then, they study trained a deep neural network (DNN) using the advanced features.
In [16], three AI techniques have been introduced such as ML, DL, and hybrid techniques among themselves, for earlier diagnoses of autism. In [17], the researchers presented deep multi-modal models that learn a joint description from two kinds of datasets provided using fMRI scans. Integrating two functional imaging modalities in an automatic end-to-end autism diagnoses technique provides widespread images of the neural action, and thus allows for precise diagnosis. The researchers in [18] employ a DL technique from convolutional neural network (CNN) variant to identify the patient is ASD or non-ASD and extracts the strong features from neuro-images in fMRI. Next, it explains the efficiency of pre-processed images through accuracy for classifying the neural pattern.
This study introduces an automated ASD classification using owl search algorithm with machine learning (ASDC-OSAML) model. The proposed ASDC-OSAML model majorly focuses on the identification and classification of ASD. To attain this, the presented ASDC-OSAML model follows min-max normalization approach as a pre-processing stage. Next, the owl search algorithm-based feature selection (OSA-FS) model is used to derive feature subsets. Then, beetle swarm antenna search (BSAS) algorithm with Iterative Dichotomiser 3 (ID3) classification technique was implied for ASD detection and classification. The performance analysis of the ASDC-OSAML model is performed using benchmark dataset.
In this study, a new ASDC-OSAML approach was advanced for the identification and classification of ASD. The presented ASDC-OSAML model follows min-max normalization approach as a pre-processing stage. Next, the OSA-FS model is used to derive feature subsets. Then, BSAS algorithm with ID3 classification technique has been implemented for ASD detection and classification. Fig. 1 depicts the overall block diagram of ASDC-OSAML approach.
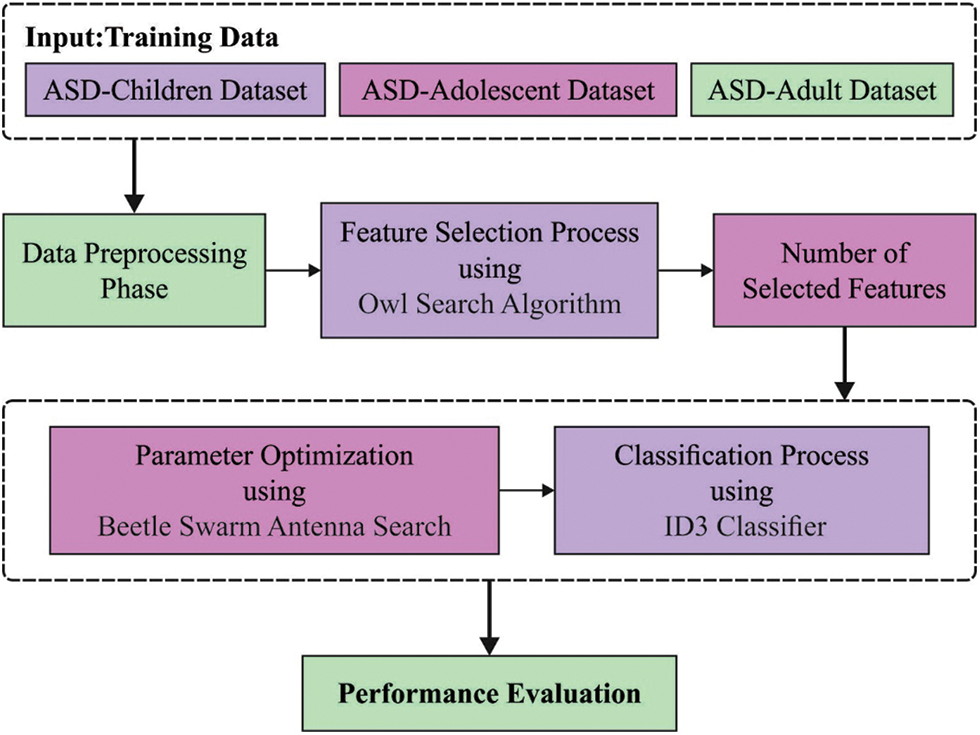
Figure 1: Overall block diagram of ASDC-OSAML approach
2.1 Stage 1: Process Involved in OSA-FS Model
At the initial stage, the OSA-FS model is used to derive feature subsets. Like other nature-inspired population related techniques, OSA initiates the optimization technique using an initialized solution set that characterizes the initial location of owls in forest
When n number of owls in the forest, then the arbitrary location has been stored in
In Eq. (1), matrix component
In Eq. (2),
Here, it can be considered that fitness value of all the owl locations straightforwardly refers the intensity data get by the ears. Therefore, better owl receives
where
The distance of prey and owl can be evaluated as follows:
In Eq. (7), V indicates the position of prey that is accomplished using the fittest owl. Also, it was considered that one vole (global optimal) in the forest was there. Owl takes silent flight when moving to the prey. Therefore, they receive changed intensity following the inverse square law of sound intensity:
Here,
In Eq. (9),
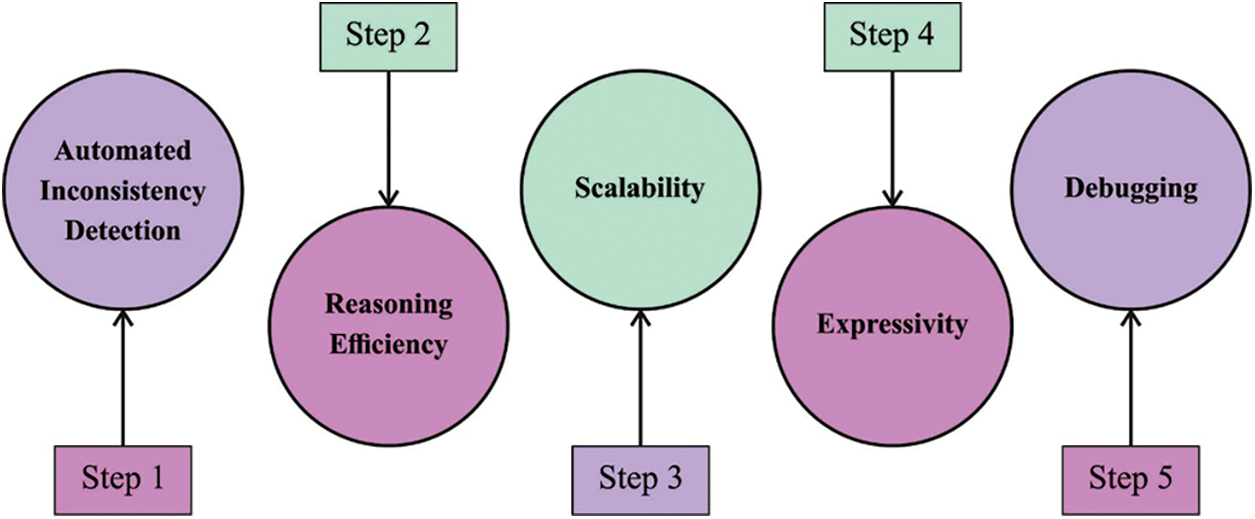
Figure 2: Steps involved in OSA
The fitness function of the OSA-FS model was devised to maintain a balance among the quantity of features which was chosen in every solution (minimal) and the classification accuracy (maximal) acquired with the help of such selected features, Eq. (10) denotes the fitness function for evaluating resolutions.
where
2.2 Stage 2: ASD Classification Model
Once the features are chosen, the ID3 classification model is applied for ASD detection and classification. The ID3 approach chooses testing components with relating and computing their information gain (IG). Consider S indicate the group of data instances. The C class component has m dissimilar values that indicate m class labels
In Eq. (11),
Consider the component A has v dissimilar values
The minimal data amount required, an additional purity of sub dataset can be
In Eq. (13),
Especially, the amount of data needed (based on the class) minus the amount of novel dataset needed (depends on component
In this study, the design of BSAS algorithm helps to determine the parameter values [20–22] of the ID3 classifier. The original beetle antenna search (BAS) involves searching and detecting behaviors [23]. In every timestep, beetles move in a random direction. Thus, a random unit vector
In Eq. (15), the subscript
In Eq. (16),
From the expression,
Generally, BAS technique has two major disadvantages. Firstly, beetles move in one random direction. It could not assurance that the move of beetle will make the objective function better. Similarly, we enhance the searching behavior of BAS technique by using k beetle to move in k direction, which improves the probability to search best location for beetles. Next, all the movements of beetle cause a step size and update of the position. Indeed, when the objective function is better, the location of beetle must be upgraded when the step size not. As a result, we designed a feedback-based location and step-size update approach. Additionally, a
The proposed model is simulated using Python tool. The experimental validation of the ASDC-OSAML model is tested using three datasets, as given in Table 1.
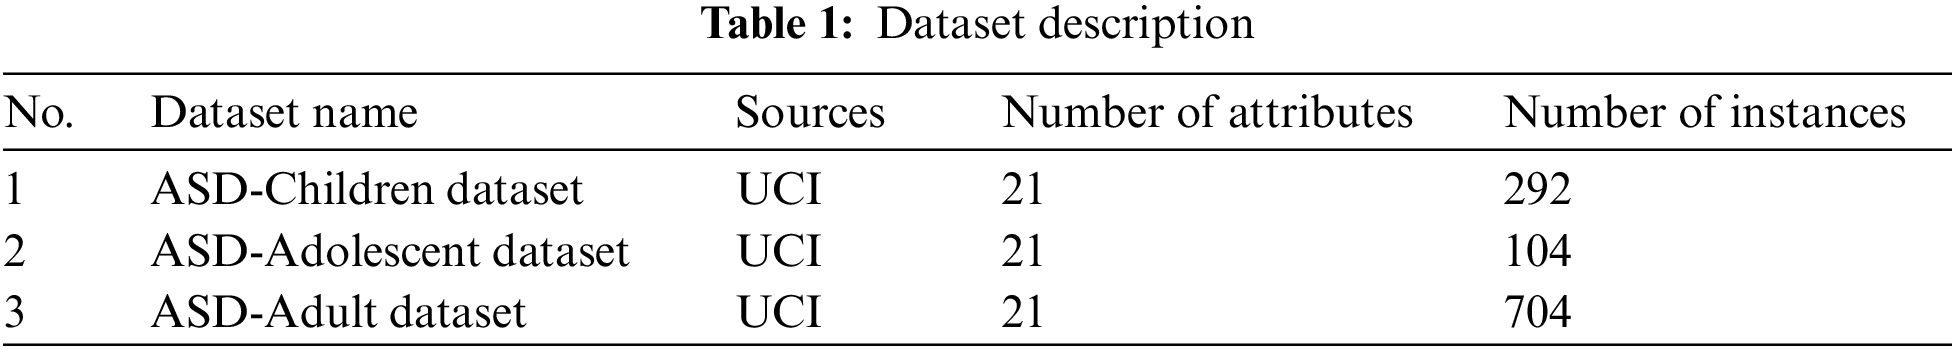
Fig. 3 shows the best cost inspection of the OSA-FS with other FS models. The figure implied that the OSA-FS model has resulted in effectual outcomes over other FS models with minimal best cost.
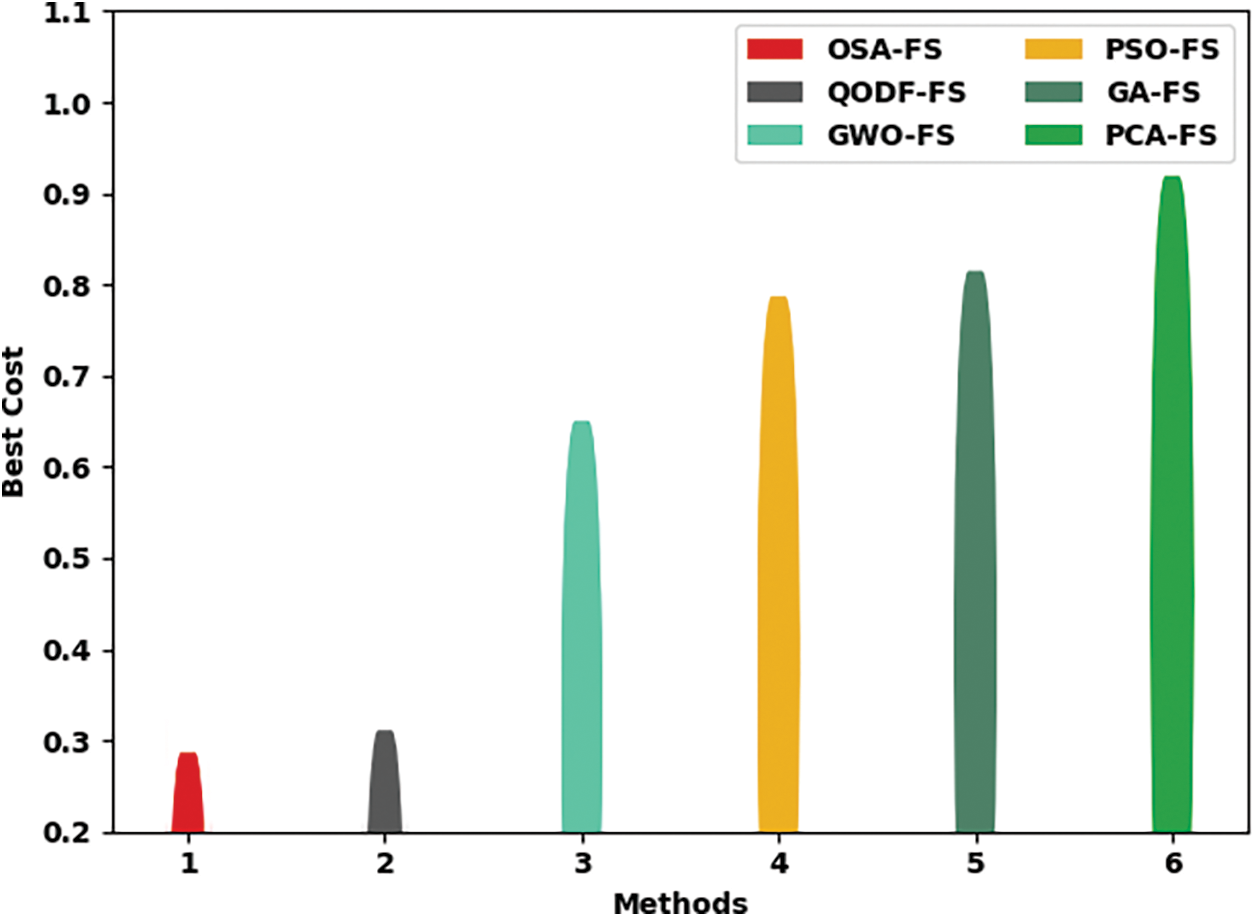
Figure 3: Best cost analysis of OSA-FS approach with other FS models
Fig. 4 highlights the confusion matrices formed by the ASDC-OSAML model on the test data. With ASD-children dataset, the ASDC-OSAML model has recognized 140 samples into Yes class and 151 samples into No class. Meanwhile, with ASD-adolescent dataset, the ASDC-OSAML approach has recognized 62 samples into Yes class and 41 samples into No class. Eventually, with ASD-adult dataset, the ASDC-OSAML technique has recognized 189 samples into Yes class and 506 samples into No class.
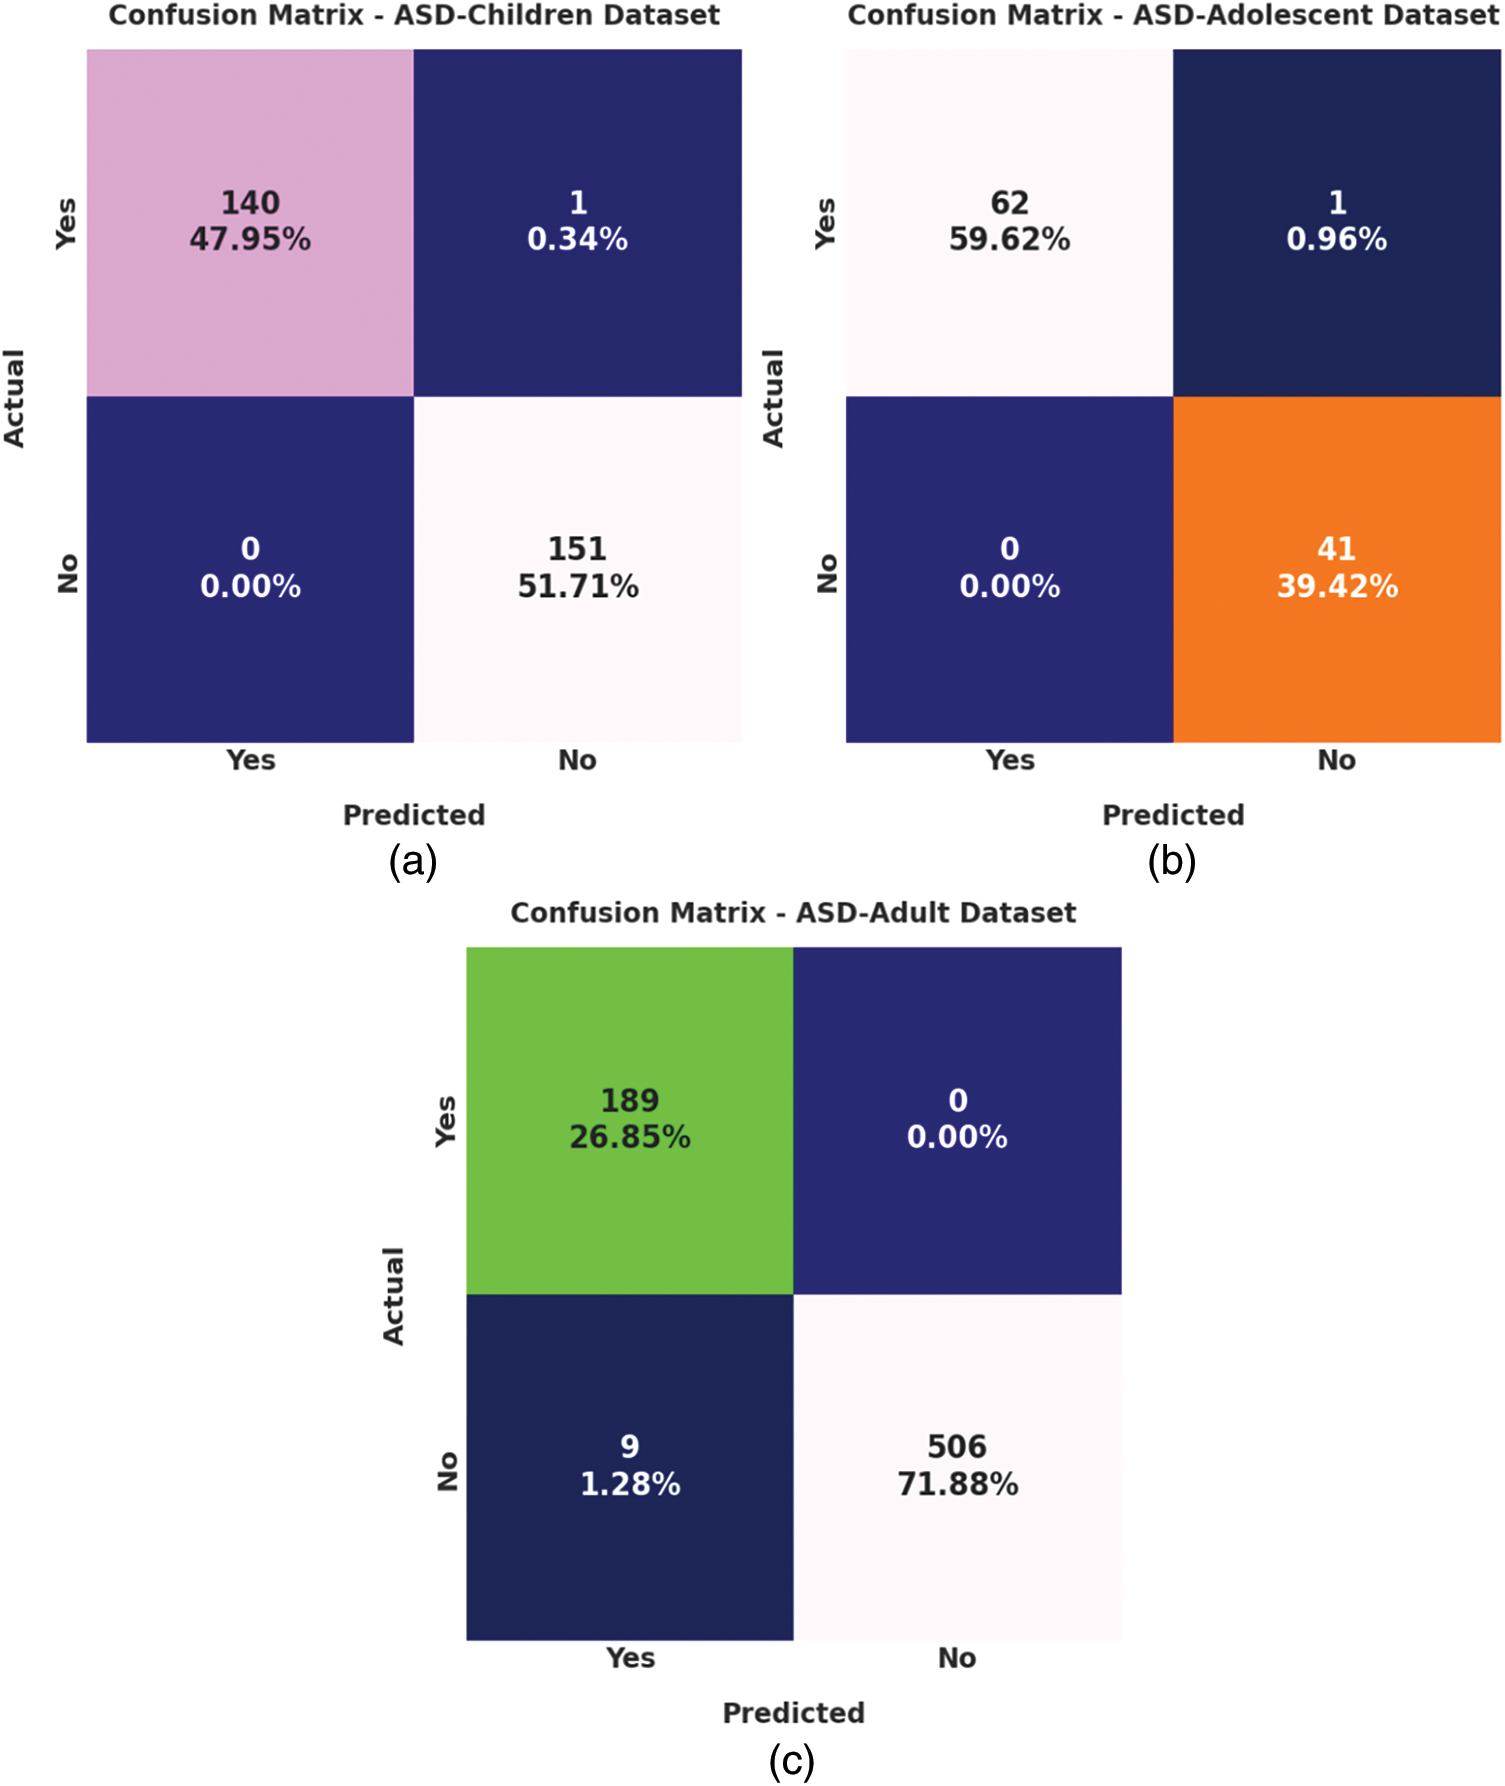
Figure 4: Confusion matrices of ASDC-OSAML approach (a) ASD-children dataset, (b) ASD-adolescent dataset, and (c) ASD-adult dataset
Table 2 provides an overall ASD classification outcomes of the ASDC-OSAML model on test data.
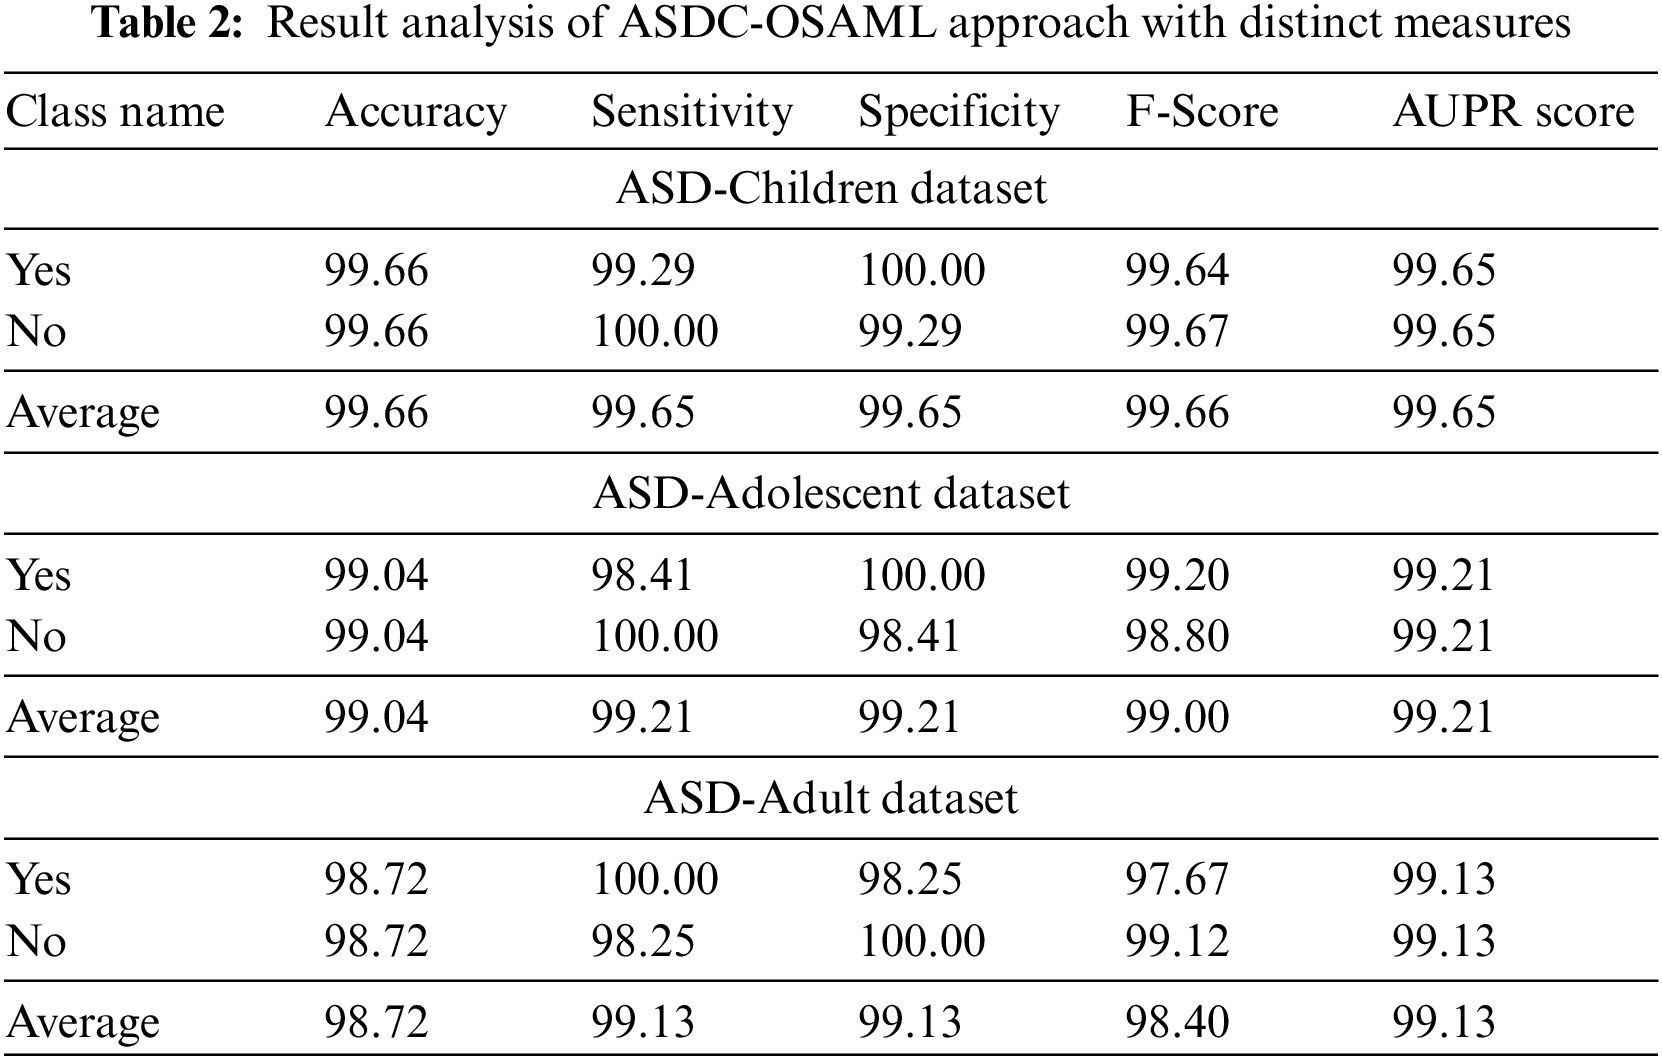
Fig. 5 reports a brief result analysis of the ASDC-OSAML model on the test ASD_childern dataset. The ASDC-OSAML model has identified Yes class with
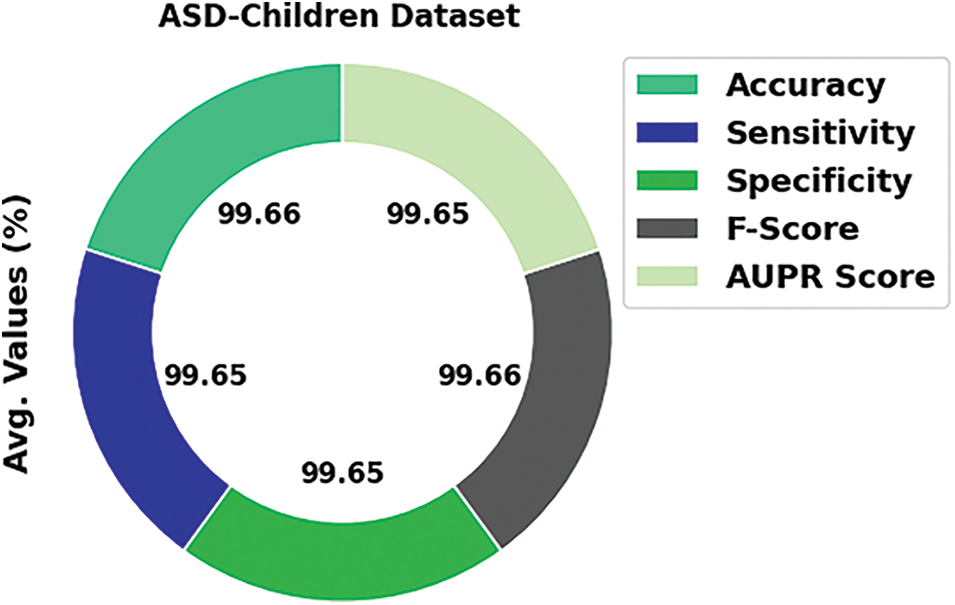
Figure 5: Average analysis of ASDC-OSAML approach on ASD_children dataset
Fig. 6 demonstrates brief outcome scrutiny of the ASDC-OSAML technique on the test ASD_adolescent dataset. The ASDC-OSAML approach has identified Yes class with
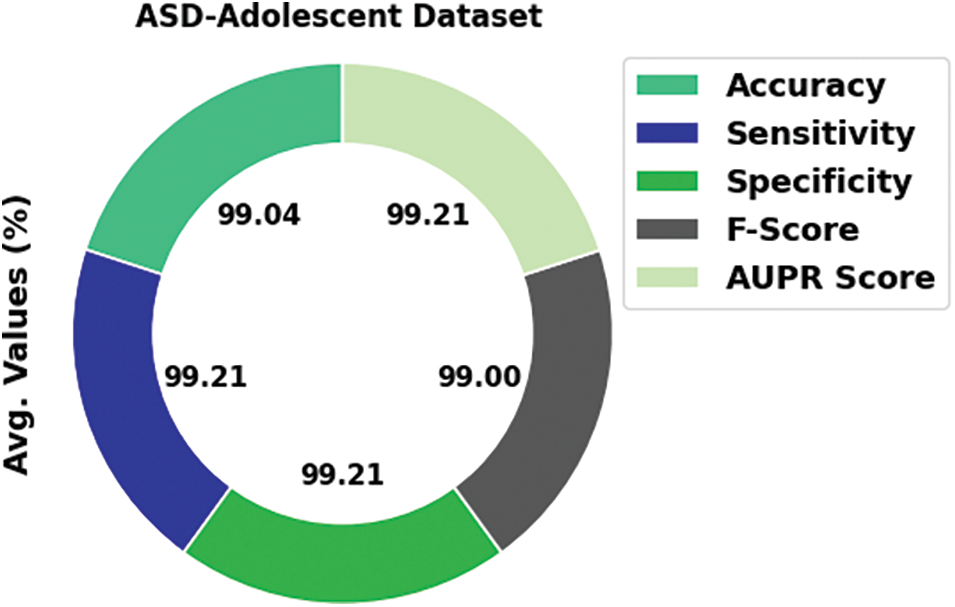
Figure 6: Average analysis of ASDC-OSAML approach on ASD_adolescent dataset
Fig. 7 signifies a brief result analysis of the ASDC-OSAML algorithm on the test ASD_adult dataset. The ASDC-OSAML method has identified Yes class with

Figure 7: Average analysis of ASDC-OSAML approach on ASD_adult dataset
Fig. 8 presents the accuracy and loss graph analysis of the ASDC-OSAML method under different datasets. The results show the accuracy value tends to rise and loss value tends to reduction with an increase in epoch count. It can be observed that the training loss is low and validation accuracy is high on different datasets.
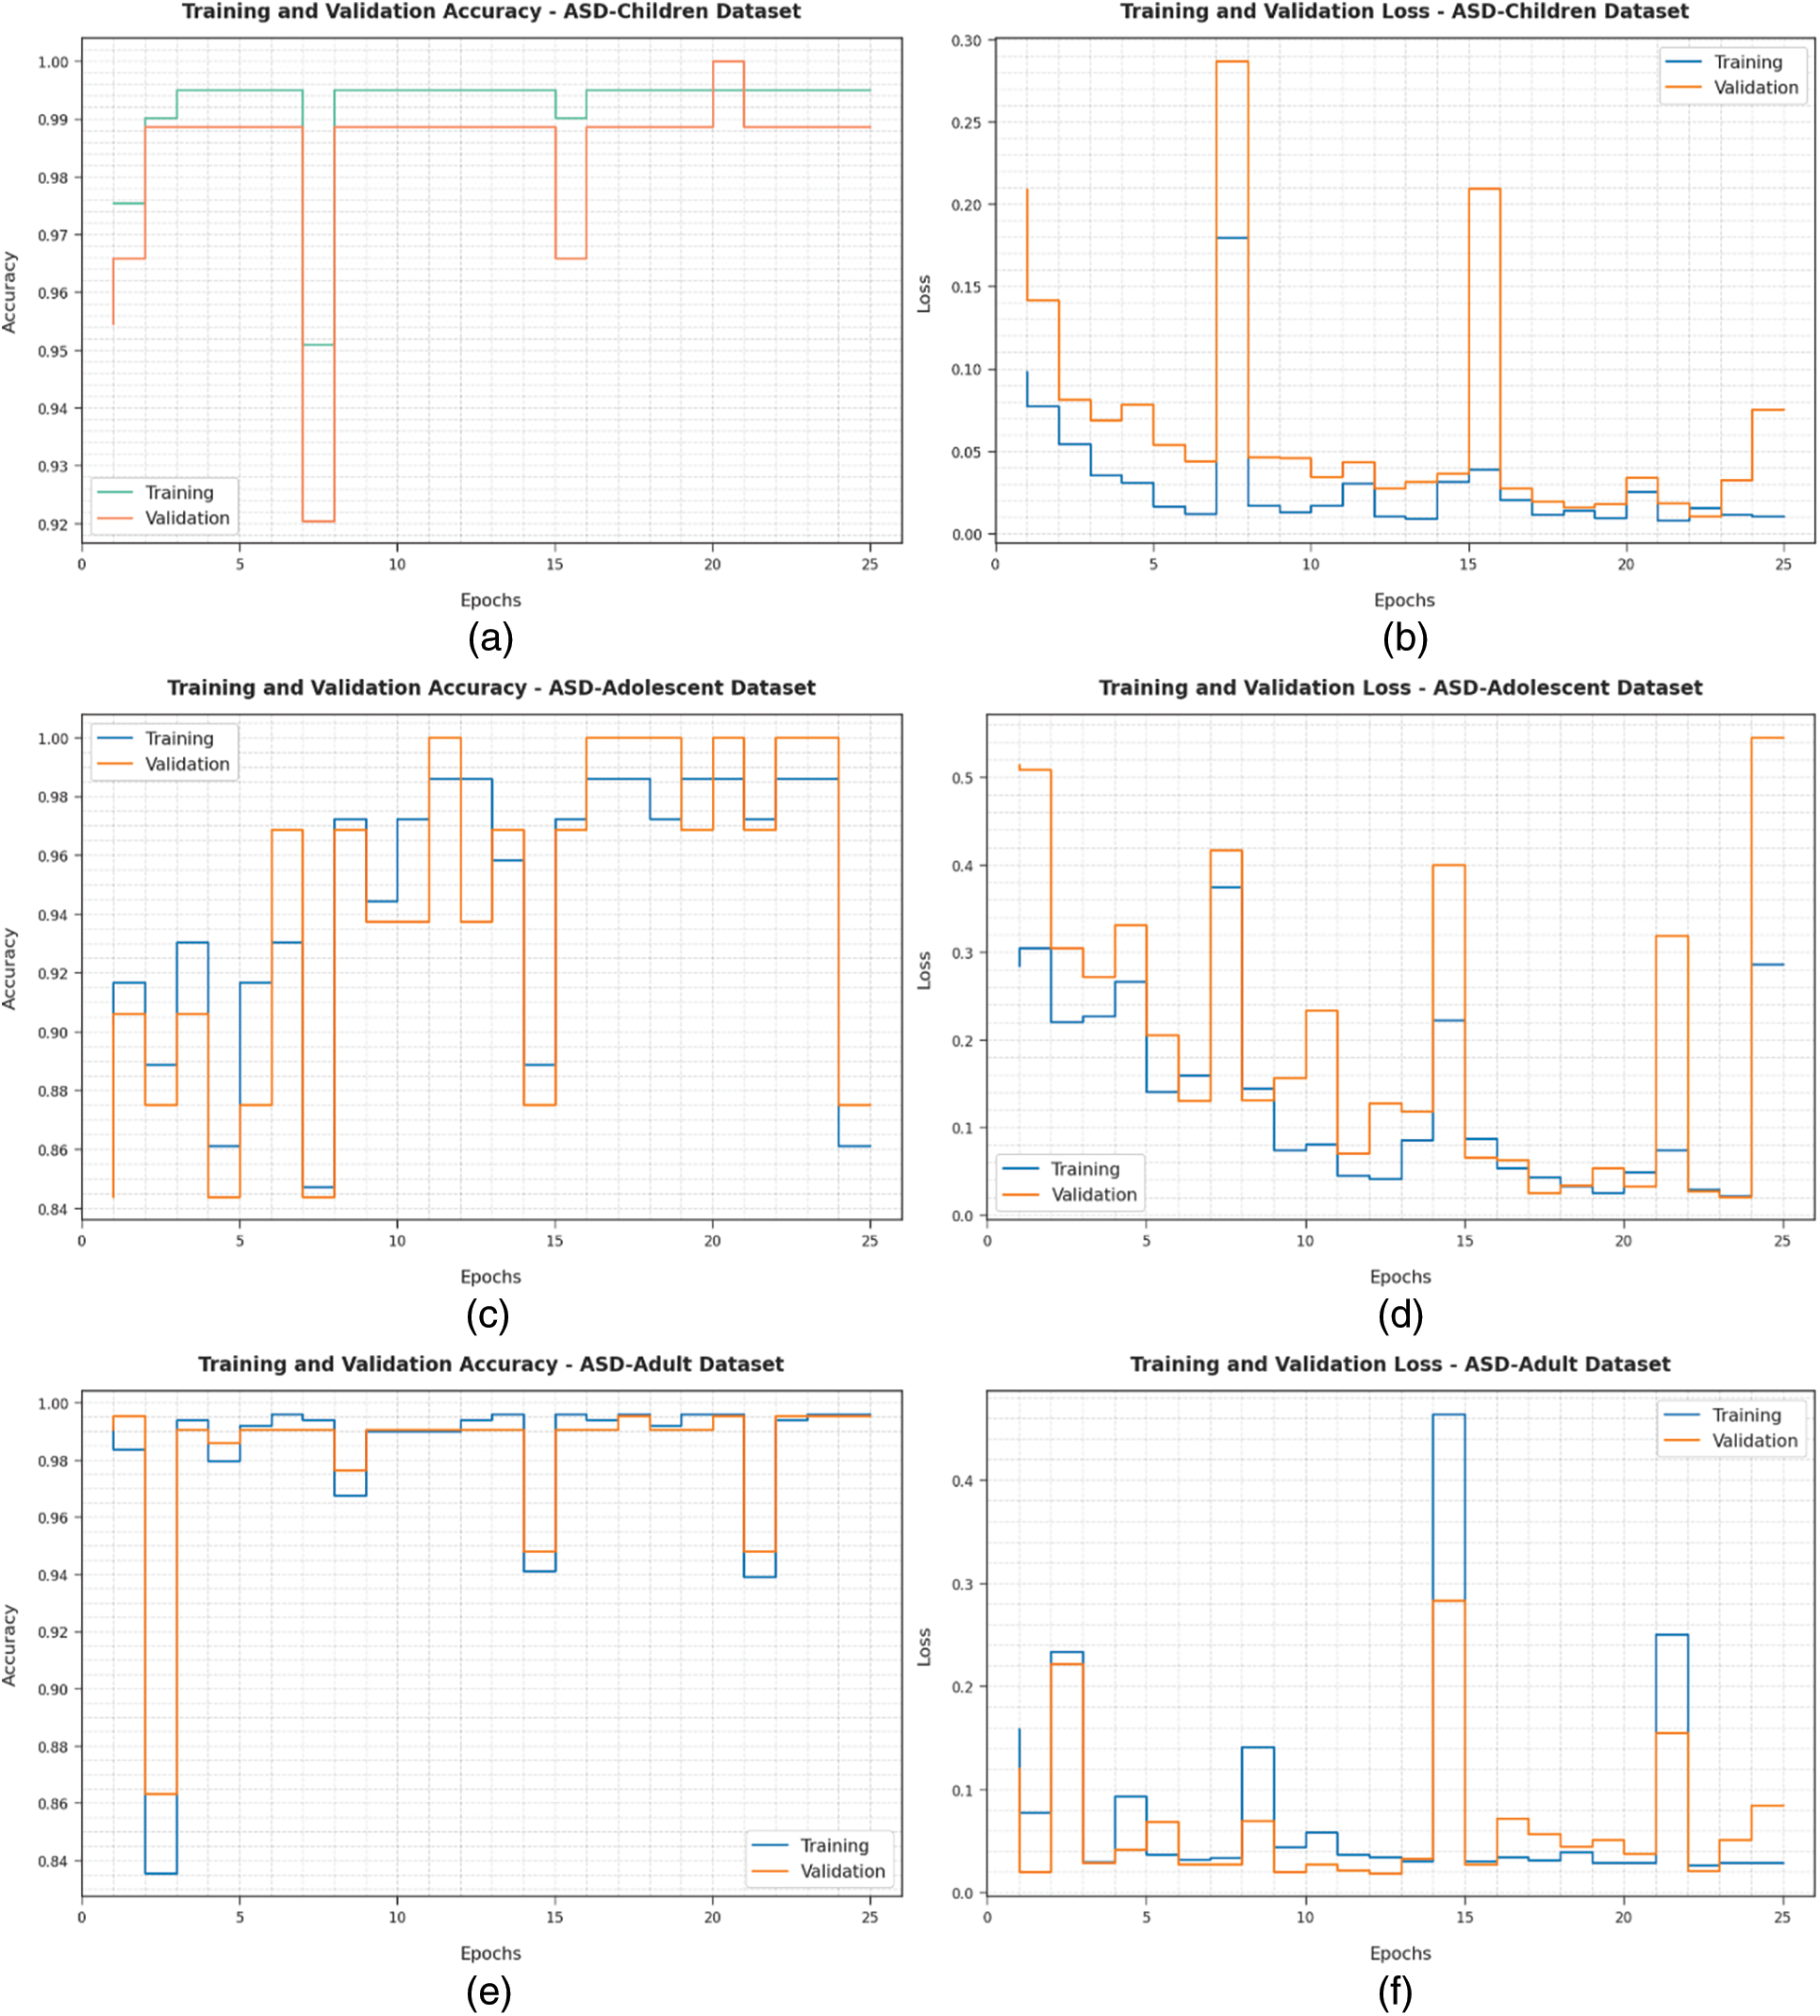
Figure 8: (a and b) Graph of Accuracy and loss on ASD_children dataset (c and d) Graph of Accuracy and loss on ASD_adolescent dataset (e and f) Graph of Accuracy and loss on ASD_adult dataset
Table 3 illustrates a comparison study of ASDC-OSAML model with recent models such as quasi-oppositional dragonfly with deep stacked autoencoder network (QODF-DSAN), logistic regression (LOR), neural network (NN), k-nearest neighbour (KNN), and SVM-linear model [24,25].
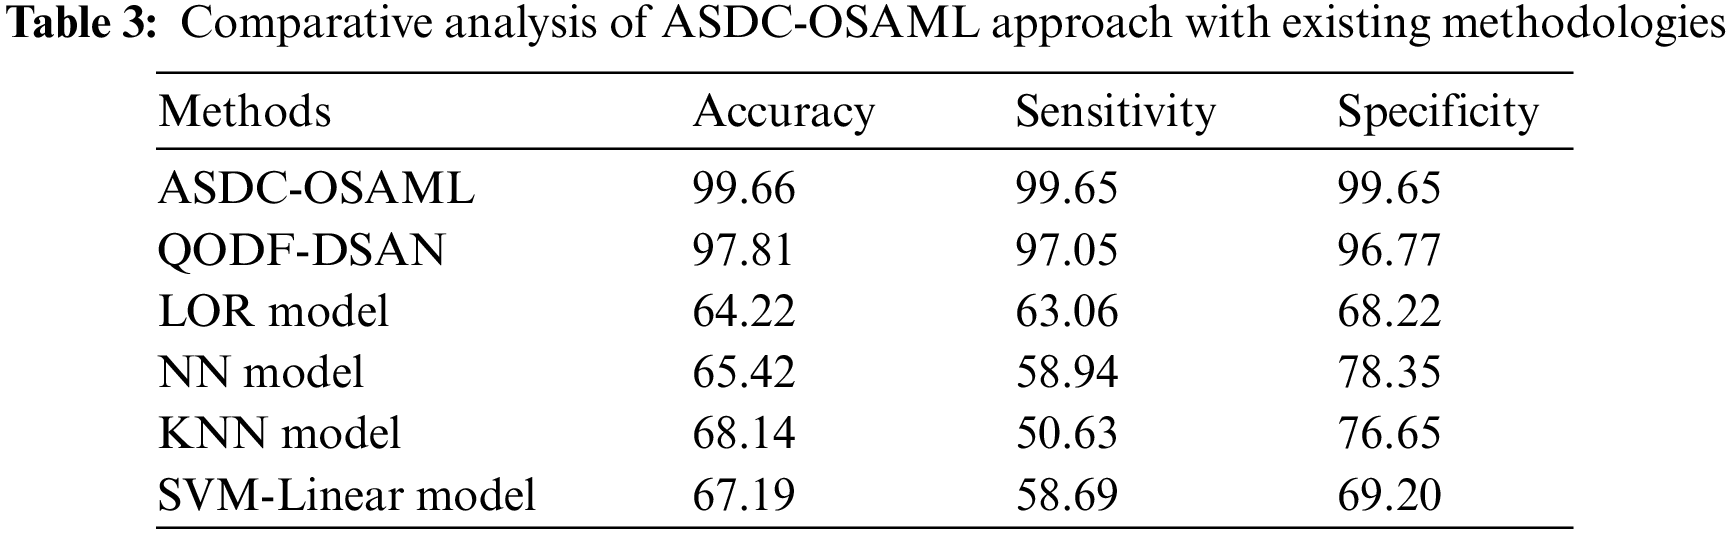
Fig. 9 renders a comparative review of the ASDC-OSAML system with other models interms of

Figure 9:
Fig. 10 provides a comparative inspection of the ASDC-OSAML model with other models interms of
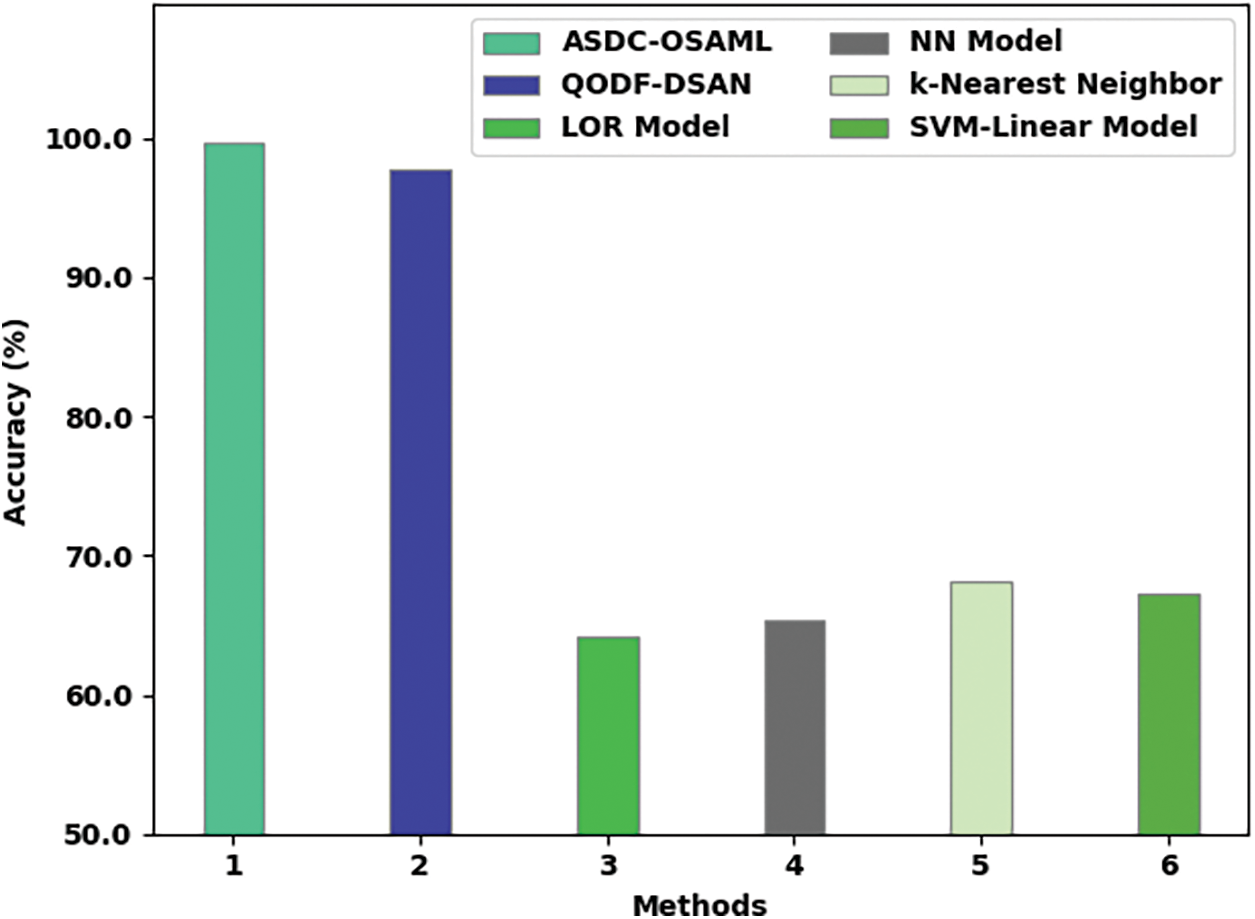
Figure 10:
In this paper, a new ASDC-OSAML approach was advanced for the classification and identification of ASD. The presented ASDC-OSAML model follows min-max normalization approach as a pre-processing stage. Next, the OSA-FS model is used to derive feature subsets. Then, BSAS algorithm with ID3 classification method was implemented for ASD detection and classification. The design of BSAS algorithm helps to determine the parameter values of the ID3 classifier. The performance analysis of the ASDC-OSAML model is performed using benchmark dataset. Extensive comparison study highlighted the supremacy of the ASDC-OSAML model over recent state of art approaches. Thus, the presented ASDC-OSAML technique was applied as an effectual tool for ASD classification. In future, an ensemble of three DL approaches has been applied to boost the classifier results.
Funding Statement: The authors extend their appreciation to the Deanship of Scientific Research at King Khalid University for funding this work through Large Groups Project Under Grant Number (61/43). Princess Nourah bint Abdulrahman University Researchers Supporting Project Number (PNURSP2022R114), Princess Nourah bint Abdulrahman University, Riyadh, Saudi Arabia. The authors would like to thank the Deanship of Scientific Research at Umm Al-Qura University for supporting this work by Grant Code: (22UQU4310373DSR26).
Conflicts of Interest: The authors declare that they have no conflicts of interest to report regarding the present study.
References
1. K. K. Hyde, M. N. Novack, H. LaHaye, C. Parlett-Pelleriti, R. K. Anden et al., “Applications of supervised machine learning in autism spectrum disorder research: A review,” Review Journal of Autism and Developmental Disorders, vol. 6, no. 2, pp. 128–146, 2019. [Google Scholar]
2. F. Thabtah and D. Peebles, “A new machine learning model based on induction of rules for autism detection,” Health Informatics Journal, vol. 26, no. 1, pp. 264–286, 2020. [Google Scholar]
3. M. M. Rahman, O. L. Usman, R. C. Muniyandi, S. Sahran, S. Mohamed et al., “A review of machine learning methods of feature selection and classification for autism spectrum disorder,” Brain Sciences, vol. 10, no. 12, pp. 949, 2020. [Google Scholar]
4. K. D. C. Garside, Z. Kong, S. W. White, L. Antezana, S. Kim et al., “Detecting and classifying self-injurious behavior in autism spectrum disorder using machine learning techniques,” Journal of Autism and Developmental Disorders, vol. 50, no. 11, pp. 4039–4052, 2020. [Google Scholar]
5. Y. Zhou, F. Yu and T. Duong, “Multiparametric MRI characterization and prediction in autism spectrum disorder using graph theory and machine learning,” PLoS One, vol. 9, no. 6, pp. e90405, 2014. [Google Scholar]
6. S. Banker, X. Gu, D. Schiller and J. F. Feig, “Hippocampal contributions to social and cognitive deficits in autism spectrum disorder,” Trends in Neurosciences, vol. 44, no. 10, pp. 793–807, 2021. [Google Scholar]
7. Y. Zhu, H. Nakatani, W. Yassin, N. Maikusa, N. Okada et al., “Application of a machine learning algorithm for structural brain images in chronic schizophrenia to earlier clinical stages of psychosis and autism spectrum disorder: A multiprotocol imaging dataset study,” Schizophrenia Bulletin, vol. 48, no. 3, pp. 563–574, 2022. [Google Scholar]
8. Y. Lin, Y. Gu, Y. Xu, S. Hou, R. Ding et al., “Autistic spectrum traits detection and early screening: A machine learning based eye movement study,” Journal of Child and Adolescent Psychiatric Nursing, vol. 35, no. 1, pp. 83–92, 2021. [Google Scholar]
9. M. A. Hamza, S. B. H. Hassine, I. Abunadi, F. N. Al-Wesabi, H. Alsolai et al., “Feature selection with optimal stacked sparse autoencoder for data mining,” Computers, Materials & Continua, vol. 72, no. 2, pp. 2581–2596, 2022. [Google Scholar]
10. M. Hosseinzadeh, J. Koohpayehzadeh, A. O. Bali, F. A. Rad, A. Souri et al., “A review on diagnostic autism spectrum disorder approaches based on the internet of things and machine learning,” The Journal of Supercomputing, vol. 77, no. 3, pp. 2590–2608, 2021. [Google Scholar]
11. A. A. Albraikan, S. B. H. Hassine, S. M. Fati, F. N. Al-Wesabi, A. M. Hilal et al., “Optimal deep learning-based cyberattack detection and classification technique on social networks,” Computers, Materials & Continua, vol. 72, no. 1, pp. 907–923, 2022. [Google Scholar]
12. M. A. Alohali, F. N. Al-Wesabi, A. M. Hilal, S. Goel, D. Gupta et al., “Artificial intelligence enabled intrusion detection systems for cognitive cyber-physical systems in industry 4.0 environment,” Cognitive Neurodynamics, 2022. https://doi.org/10.1007/s11571-022-09780-8. [Google Scholar]
13. F. Cilia, R. Carette, M. Elbattah, G. Dequen, J. L. Guérin et al., “Computer-aided screening of autism spectrum disorder: Eye-tracking study using data visualization and deep learning,” JMIR Human Factors, vol. 8, no. 4, pp. e27706, 2021. [Google Scholar]
14. N. A. Ali, “Autism spectrum disorder classification on electroencephalogram signal using deep learning algorithm,” IAES International Journal of Artificial Intelligence, vol. 9, no. 1, pp. 91–99, 2020. [Google Scholar]
15. W. Yin, S. Mostafa and F. Wu, “Diagnosis of autism spectrum disorder based on functional brain networks with deep learning,” Journal of Computational Biology, vol. 28, no. 2, pp. 146–165, 2021. [Google Scholar]
16. I. Ahmed, E. M. Senan, T. H. Rassem, M. A. H. Ali, H. S. A. Shatnawi et al., “Eye tracking-based diagnosis and early detection of autism spectrum disorder using machine learning and deep learning techniques,” Electronics, vol. 11, no. 4, pp. 530, 2022. [Google Scholar]
17. M. Tang, P. Kumar, H. Chen and A. Shrivastava, “Deep multimodal learning for the diagnosis of autism spectrum disorder,” Journal of Imaging, vol. 6, no. 6, pp. 47, 2020. [Google Scholar]
18. R. N. S. Husna, A. Syafeeza, N. A. Hamid, Y. Wong and R. A. Raihan, “Functional magnetic resonance imaging for autism spectrum disorder detection using deep learning,” Jurnal Teknologi, vol. 83, no. 3, pp. 45–52, 2021. [Google Scholar]
19. M. Jain, S. Maurya, A. Rani and V. Singh, “Owl search algorithm: A novel nature-inspired heuristic paradigm for global optimization,” Journal of Intelligent & Fuzzy Systems, vol. 34, no. 3, pp. 1573–1582, 2018. [Google Scholar]
20. K. Shankar, E. Perumal, M. Elhoseny, F. Taher, B. B. Gupta et al., “Synergic deep learning for smart health diagnosis of COVID-19 for connected living and smart cities,” ACM Transactions on Internet Technology, vol. 22, no. 3, pp. 16:1–14, 2022. [Google Scholar]
21. M. Y. Sikkandar, B. A. Alrasheadi, N. B. Prakash, G. R. Hemalakshmi, A. Mohanarathinam et al., “Deep learning based an automated skin lesion segmentation and intelligent classification model,” Journal of Ambient Intelligence and Humanized Computing, vol. 12, no. 3, pp. 3245–55, 2021. [Google Scholar]
22. I. V. Pustokhina, D. A. Pustokhin, T. Vaiyapuri, D. Gupta, S. Kumar et al., “An automated deep learning based anomaly detection in pedestrian walkways for vulnerable road users safety,” Safety Science, vol. 142, pp. 1–9, 2021. [Google Scholar]
23. P. Wang, Y. Gao, M. Wu, F. Zhang and G. Li, “In-field calibration of triaxial accelerometer based on beetle swarm antenna search algorithm,” Sensors, vol. 20, no. 3, pp. 947, 2020. [Google Scholar]
24. M. N. Parikh, H. Li and L. He, “Enhancing diagnosis of autism with optimized machine learning models and personal characteristic data,” Frontiers in Computational Neuroscience, vol. 13, pp. 9, 2019. [Google Scholar]
25. G. D. Varshini and R. Chinnaiyan, “Optimized machine learning classification approaches for prediction of autism spectrum disorder,” Annals of Autism & Developmental Disorders, vol. 1, no. 1, pp. 1001, 2020. [Google Scholar]
Cite This Article
 Copyright © 2023 The Author(s). Published by Tech Science Press.
This work is licensed under a Creative Commons Attribution 4.0 International License , which permits unrestricted use, distribution, and reproduction in any medium, provided the original work is properly cited.
 Downloads
 Citation Tools