
 Submit a Paper
 Propose a Special lssue
 Open Access
ARTICLE

Convolutional Neural Network for Overcrowded Public Transportation Pickup Truck Detection
1 School of Transportation Engineering, Institute of Engineering, Suranaree University of Technology, Nakhon Ratchasima, 30000, Thailand
2 School of Computer Engineering, Institute of Engineering, Suranaree University of Technology, Nakhon Ratchasima, 30000, Thailand
* Corresponding Author: Sajjakaj Jomnonkwao. Email:
Computers, Materials & Continua 2023, 74(3), 5573-5588. https://doi.org/10.32604/cmc.2023.033900
Received 30 June 2022; Accepted 03 October 2022; Issue published 28 December 2022
 View Full Text
 Download PDF
Abstract
Thailand has been on the World Health Organization (WHO)’s notorious deadliest road list for several years, currently ranking eighth on the list. Among all types of road fatalities, pickup trucks converted into vehicles for public transportation are found to be the most problematic due to their high occupancy and minimal passenger safety measures, such as safety belts. Passenger overloading is illegal, but it is often overlooked. The country often uses police checkpoints to enforce traffic laws. However, there are few or no highway patrols to apprehend offending drivers. Therefore, in this study, we propose the use of existing closed-circuit television (CCTV) traffic cameras with deep learning techniques to classify overloaded public transport pickup trucks (PTPT) to help reduce accidents. As the said type of vehicle and its passenger occupancy characteristics are unique, a new model is deemed necessary. The contributions of this study are as follows: First, we used various state-of-the-art object detection YOLOv5 (You Only Look Once) models to obtain the optimum overcrowded model pretrained on our manually labeled dataset. Second, we made our custom dataset available. Upon investigation, we compared all the latest YOLOv5 models and discovered that the YOLOv5L yielded the optimal performance with a mean average precision (mAP) of 95.1% and an inference time of 33 frames per second (FPS) on a graphic processing unit (GPU). We aim to deploy the selected model on traffic control computers to alert the police of such passenger-overloading violations. The use of a chosen algorithm is feasible and is expected to help reduce traffic-related fatalities.Keywords
Thailand is again included in the World Health Organization (WHO)’s infamous list of the deadliest traffic fatalities worldwide. In a 2018 global status report on road safety, the WHO ranked Thailand 8th out of 175 other countries, an improvement from the previous two surveys in which Thailand ranked 2nd [1]. In 2018, the death toll from road accidents was determined to be 22,491 people, with a fatality rate of around 32.7 per 100,000 people. The number could be significantly worse than it appears to be due to data collection incompetency [2]. Fatalities involving public transportation are typically high in terms of occupancy size (18,584 accidents in 2018, a 33.79% increase from the previous year) [2]. As of April 2022, motorcycles accounted for 52.7% (i.e., 21.8 million) of all vehicles registered in Thailand, followed by sedans (26.6%) and light pickup trucks (17%) [3]. One reason pickup trucks are in high demand is that the government state oil fund subsidizes 50% of every increase in diesel price. Moreover, biodiesel B20, which is a less expensive alternative to regular diesel, has become commercially viable and was endorsed by the Energy Ministry in 2019. This has resulted in the increase in terms of the market share of 1-ton trucks. As previously stated, pickup trucks are cost effective and therefore are modified to serve as a mode of public transportation. Approximately 100,000 public transport pickup trucks (PTPT) are currently registered with the Department of Land Transport, which is equivalent to the US Department of Motor Vehicles. These trucks have taken over the streets of the country, displacing regular buses. Depending on the structure and model, PTPTs can accommodate eight seated passengers and four to six standing passengers. Most truck operators are private companies that must pay additional taxes and fees to operate on designated routes. Therefore, the operators often carry as many passengers as they can. Typically, this means that they wait for passengers to arrive and fill the vehicle. This results in being behind schedule. Thus, they must exceed speed limits, breaking numerous traffic laws and increasing the risk of injury and death. The Thai traffic authority has a limited number of highway patrols to conduct traffic stops. Furthermore, they rely on roadblocks and closed-circuit television (CCTV) cameras to enforce traffic laws to minimize road accidents.
There are two broad categories related to overloading detection: physical sensors and computer vision. Sensors are used in intelligent transportation systems (ITS), such as Bluetooth, laser, radio wave, infrared, etc., to sense the weight of the vehicles. The use of weight sensors combined with loop induction sensors necessitates physical installations, i.e., opening a road surface and blocking traffic. Computer vision can use existing cameras. In case of a new installation, tampering with the road surface and road blocking is minimal. Recently, the use of computer vision has been developed and made available. Compared with ITS solutions, they are less expensive and easier to maintain.
In this study, we focus on computer vision category. Classic machine learning methods, such as feature extraction using histogram of oriented gradients (HOG), classification using support vector machine (SVM), and many others have been used and achieved satisfactory results. In recent years, deep learning techniques have become widely popular, especially since the introduction of various convolution neural network (CNN) algorithms in 2012. Hardware, particularly graphic processing units (GPU), also plays a significant role in reducing the time required to train a model because they are much faster than central processing units (CPU) [4]. However, a more powerful CPU comes at a higher cost and consumes more power. One could opt for online services for alternative cost-efficient solutions, such as Google Colab [5]. As a result, image classification has become more accurate. Specifically, vehicle classification in the modern era is accomplished using deep learning techniques, such as a CNN with the transfer learning method coupled with the power of modern GPUs, which allows for a significant reduction in training time. The pretrained network is considered highly effective because it has previously seen a tremendous number of images with thousands of categories. The mentioned CNN model subsequently adds extra interested classes to the last few layers of the network to enable its classification of newly added targets. In this case, the images of Thai-modified pickups and passenger-overloaded trucks are inputted into the networks to achieve the overcrowded PTPT classifier. However, the inference speed is slow, and we need to find bounding boxes or the locations of the objects of interest, i.e., one regular PTPT and two overcrowded ones, in the vicinity of the image from a CCTV video feed.
Region-based CNNs, such as R-CNN, have been proposed to identify the bounding box of an object of interest by splitting an image into regions. However, this approach is time-consuming. Fast R-CNN and Faster R-CNN are subsequently released to overcome the inference time issues. These methods are classified as two-stage detectors because they comprise, first, the generation of region proposals by selective search as in the R-CNN or by a Region Proposal Network and, second, object classification. Faster R-CNN is over 100 times faster than the traditional R-CNN. However, single-stage detectors, such as the YOLO (You Only Look Once) and its variants, such as the You Only Learn One Representation [6] and the YOLOX [7], an anchor-free version of the YOLO, have recently emerged by directly applying object classification and bounding box regression [8]. Generally, two-stage detectors are more accurate but slower than single-stage detectors, such as the YOLO.
Thus, in this study, we propose a way to accurately detect overcrowded PTPT in real time. Therefore, the algorithm should have an acceptable accuracy and inference speed in the said detection task when using existing traffic cameras. Currently, there is no model trained specifically for this task. Therefore, to bridge this gap, we propose training a model to detect the PTPT. Many peer-reviewed papers recommend the YOLOv5 for real-time object detection tasks [9–11]. We have compared all the pretrained YOLOv5 (version 6) models, such as models N, S, M, L, and X, to find an acceptable one to classify a unique characteristic of Thai public vehicles and their usage concerning public safety. Precisely, the model aims to identify whether or not public pickup trucks used for transportation are overcrowded. We have used the transfer learning technique on our manually labeled 1,239 images in the YOLOv5 PyTorch format [12] in order to recognize the overcrowded and the normal ones. The use of the model is expected to aid in the enforcement of traffic laws, reducing severe traffic mortality. The aforementioned contributions of this study can be summarized as follows:
1. We proposed a real-time deep learning model to detect overcrowded PTPT using existing traffic cameras.
2. We compared the existing state-of-the-art networks of deep learning for real-time Thai public pickup truck detection.
3. We open-sourced our manually labeled dataset of regular PTPT and overcrowded ones.
Traditional methods in computer vision are known approaches that do not rely on machine learning but on mathematical algorithms; often, they are outperformed by deep learning methods [13]. An example of these classic algorithms is the Canny edge detector [14], which is used to find curves in an image. Another study using classical approaches was conducted on Thai roadways in 2013 using various techniques, such as background subtraction, edge detection, and graph matching, which obtained 87.24% accuracy with effectiveness of five cars per second [15].
In 2019, a more recent study with a similar environment used a CNN to classify vehicle color and type, i.e., small, medium, large, and unknown. The models were trained on 917 images and achieved color and type classification accuracy of 70.09% and 81.62%, respectively [16].
Roecker et al. [17] used a CNN on the Beijing Institute of Technology-Vehicle dataset, which comprised 9,850 high-resolution vehicle images and obtained approximately 95% of precision, recall, and f-measure for truck classification tasks.
Cristiani et al. [18] proposed a traffic flow classification method based on image processing in conjunction with a luminosity sensor to overcome lighting issues at night and in other low-light environments, such as fog and rain. They used an Adaboost Classifier image processing technique to categorize road congestion. They achieved an overall accuracy of 92% in traffic flow classification tasks.
Meanwhile, Piniarski et al. [19] proposed a method to speed up pedestrian detection in infrared images, resulting in a 74% reduction in classification time. The classifiers analyzed in this study were a HOG with an SVM, an aggregate channel feature, and a deep CNN. The authors confirmed that their CNN model obtained the best accuracies for various databases.
Roy et al. [20] proposed the use of Tree-CNN to address a “catastrophic forgetting” problem in which adding new information, such as transfer learning techniques, tends to complicate the trained model. The tree-like architecture can grow and learn to accommodate new classes or data adaptively.
As mentioned in the previous section, recent approaches in object detection can be broadly categorized into two categories, namely, single-stage (YOLO) and two-stage algorithms (Faster R-CNN). Several studies have concluded that the YOLO algorithm outperformed the Faster R-CNN in terms of accuracy and inference time.
A study conducted by Kwan et al. [10] on real-time vehicle detection and classification adopted a method called pixel-wise coded exposure to condense multiple frames into a single frame. They directly captured sample videos from pixel-wise coded aperture cameras. The input image was resized to 448 × 448 pixels and input into a YOLOv1. The authors achieved decent results for real-time tasks in terms of speed and accuracy.
In 2020, Kim [21] introduced techniques to detect vehicles driving ahead in tunnel environments. The techniques used past object detection (YOLOv2) and discovered noise reduction and illuminance smoothing, which was applied to image frames obtained from dashcams. The authors reported a 94.1% improvement in vehicle detection accuracy. There is another study conducted by Zhu et al. [22] on moving vehicles (airplane, car, and person) detection using the YOLOv3 in conjunction with background subtraction image frames in videos. They reported 91% mAP and 27 frames per second (FPS).
In Bangladesh, researchers used the YOLO to detect their native vehicles, such as trucks and achieved a 73% IOU (intersect over union) at 55 FPS [23].
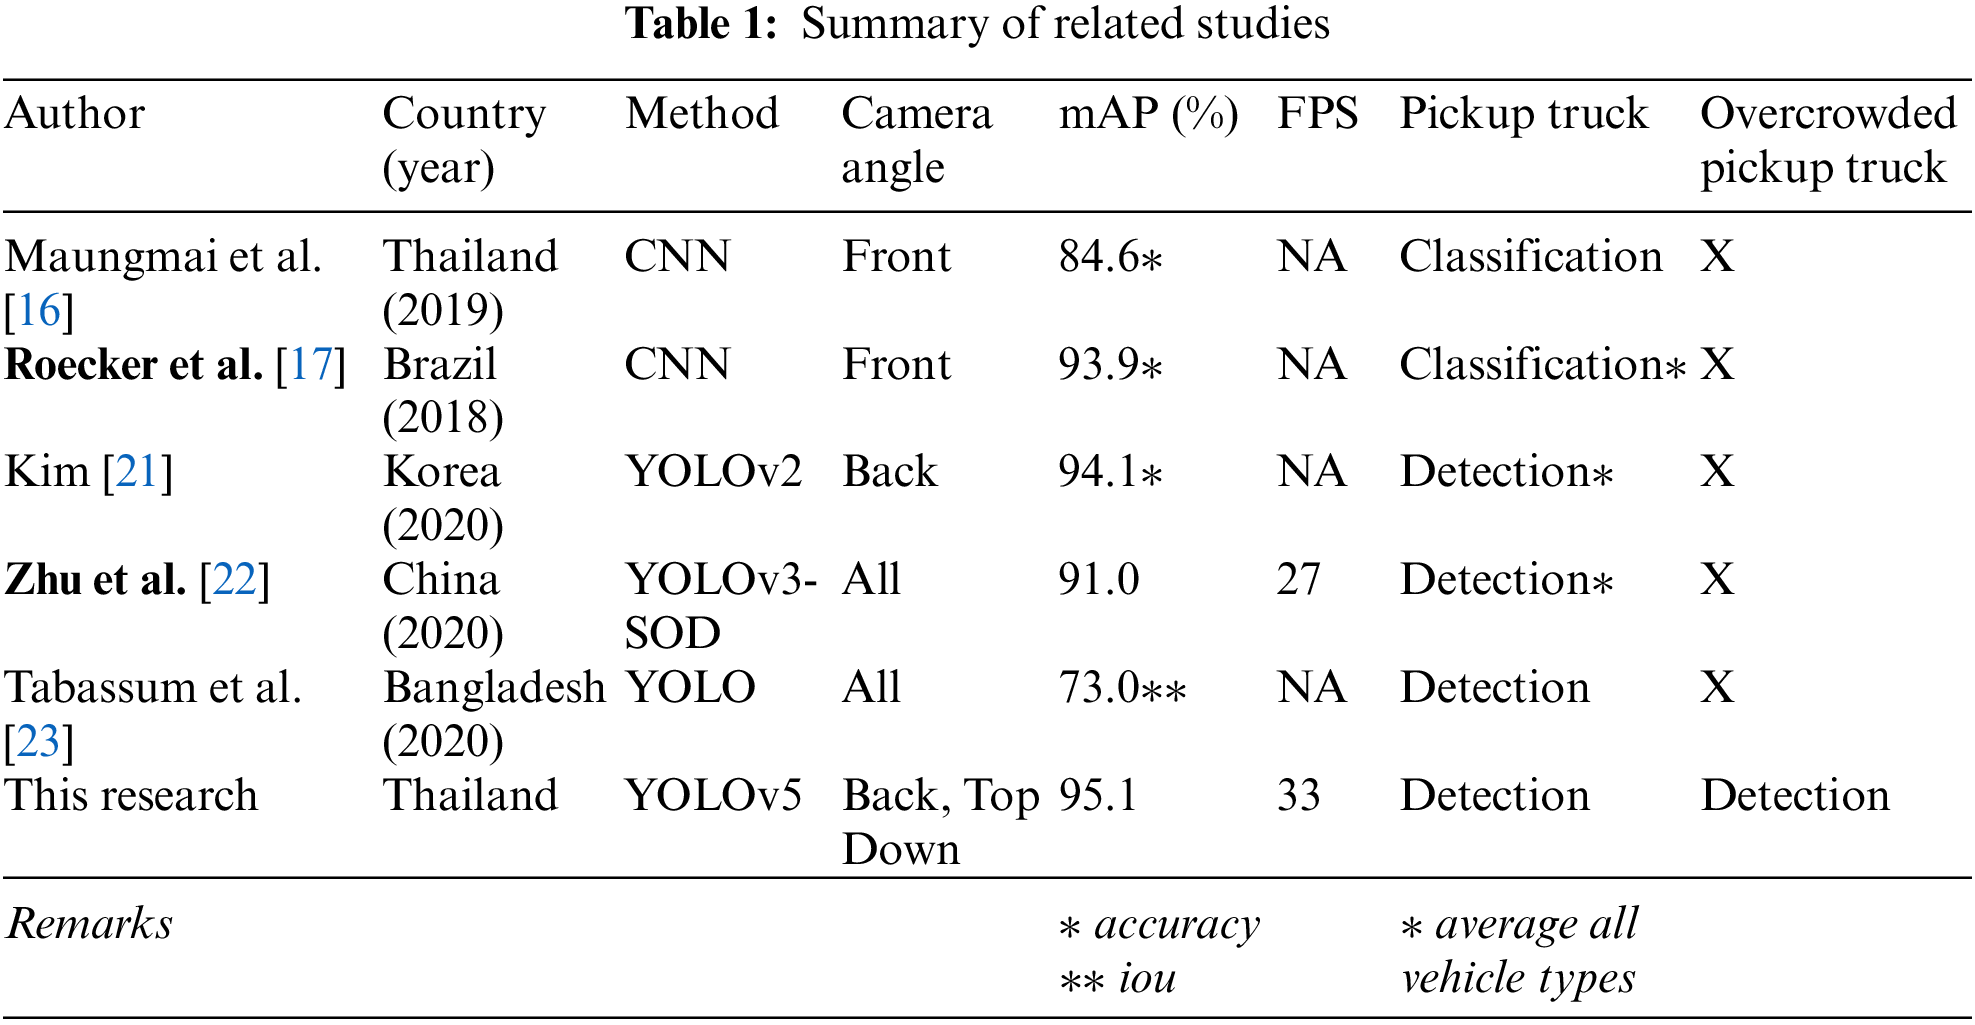
In Table 1, we have tabulated existing works that are closely related to this study. As previously stated, there is no existing detection model to identify pickup trucks that are overloaded with passengers. Consequently, the authors have developed a model to accomplish the said task.
The procedures of this study are summarized, as shown in Fig. 1. We began constructing our dataset as described in the next section by collecting various images and videos. Subsequently, we proceeded to annotate parts of still images that represent two classes of normal and overcrowded PTPT. Once we obtained the dataset, we augmented the originals by applying various techniques, as listed in Table 2. In the training phase, we finetuned the pretrained YOLOv5 models obtained from the authors’ official GitHub [24]. Following that, we compared all finetuned models for the mAP and speed in terms of FPS for our inference task.
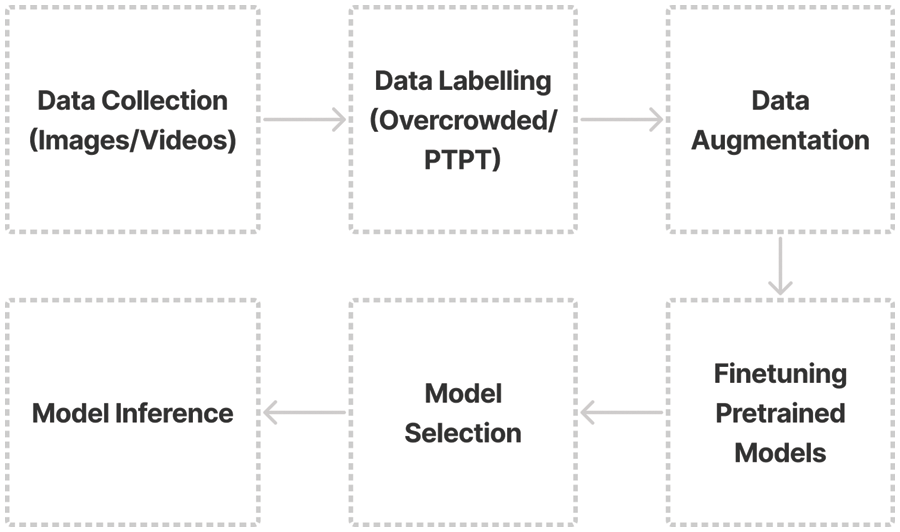
Figure 1: Process flow diagram
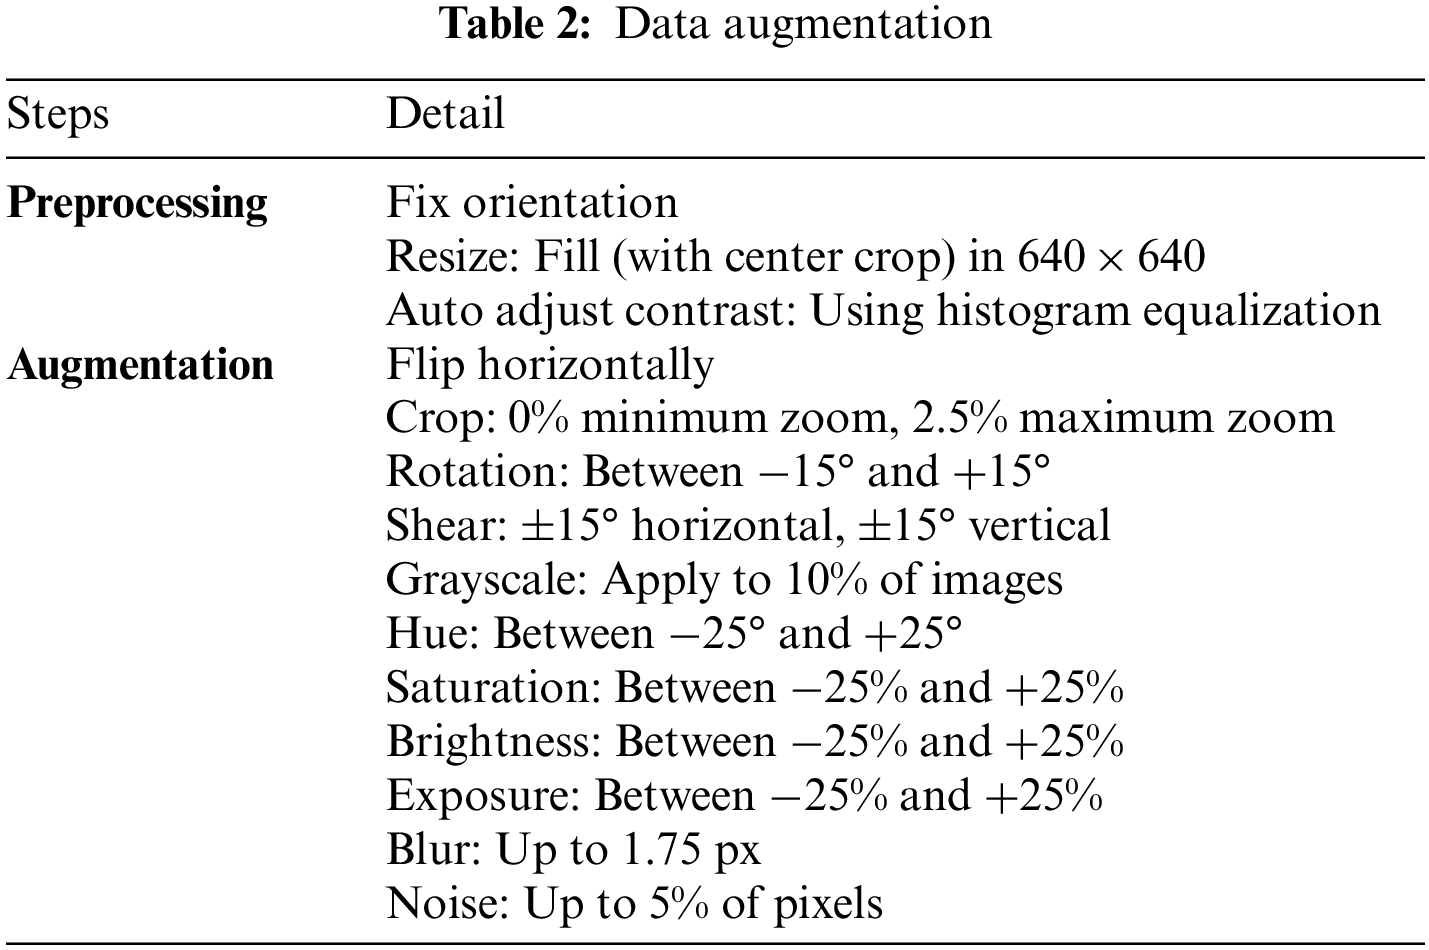
The sample images were obtained from Google Image Search, photos taken by the authors in local city areas, video clips from news media, and traffic cameras (Hikvision 4 MP Bullet Network Camera) installed approximately 12 m high on three different pedestrian bridges above highways in nearby cities. A sample image from the traffic camera can be observed in Fig. 2. The authors used an Apple iPhone 12’s main camera (12 million pixels) to capture still images and 1080 p video at 30 FPS from a car’s dashboard level. The sample comprised two main categories of PTPT: 512 images of the modified pickups (PTPT), 431 images of the crowed ones (overcrowded PTPT), and 346 background images, which resulted in a total of 1,289 images. We manually annotated each image in a YOLOv5 PyTorch TXT format (class_id center_x center_y width height). As shown in Table 2, the input images were augmented per item and batch to a final total of 2,975 images. The dataset was randomly separated into 80% training set, 10% validation set, and 10% test set. An example of both datasets is shown in Figs. 3 and 4.
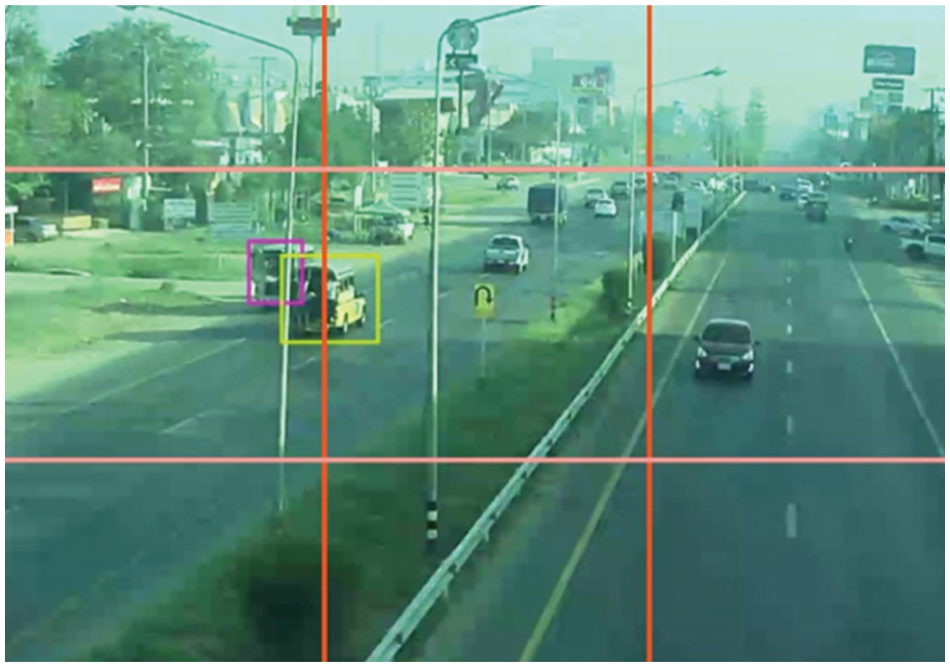
Figure 2: S × S grid
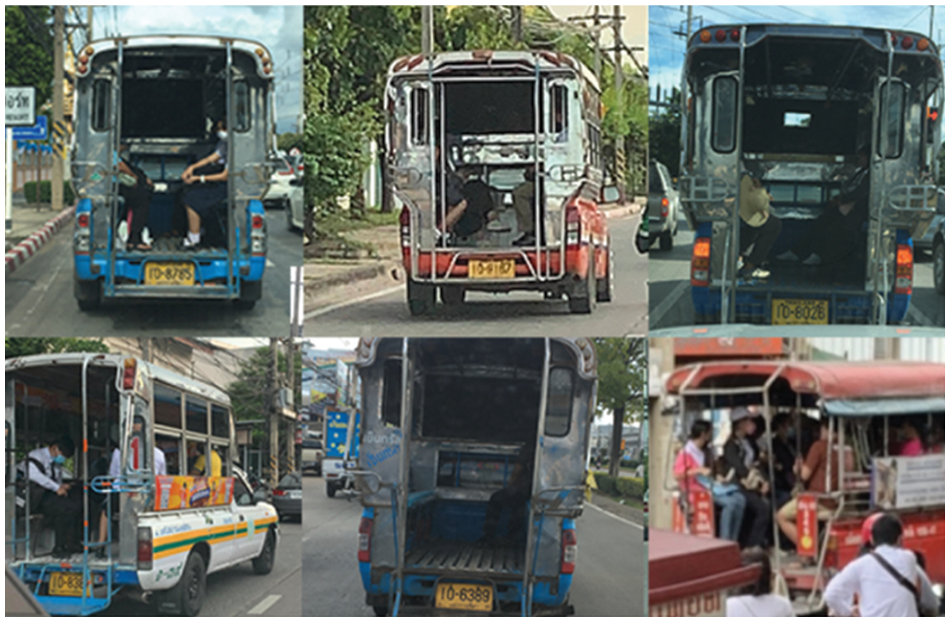
Figure 3: Public transport pickup trucks (PTPT)
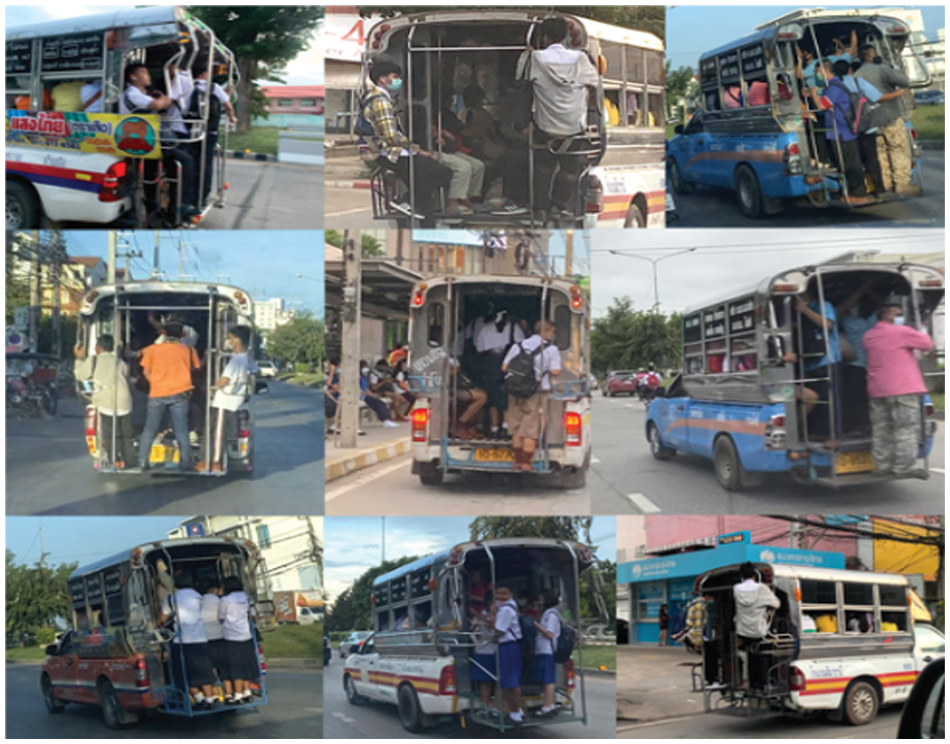
Figure 4: Overcrowded public transportation pickup trucks (Overcrowded PTPT)
YOLO, which was first introduced by Redmon et al. [25] in 2015, uses a CNN for object detection and bounding box prediction all at once in a single forward propagation. YOLO takes an input image and divides it into an equal grid (s × s size), as shown in Fig. 2. Furthermore, image classification and bounding box prediction are applied to each grid. The algorithm then outputs the corresponding class probabilities (i.e., overcrowded or PTPT), coordinates of the predicted object, and the confidence score of the boxes. In the subsequent YOLOv2, Redmond et al. added batch normalization, which was initially introduced by Ioffe et al. [26], and a few other techniques to improve the mean average precision [27]. They Redmon et al. have also used Darknet-53 in the feature extraction layers of the network, improving detection speed and accuracy [28]. YOLOv4 was then proposed to use CSP-Darknet53 as a backbone to address YOLOv4’s issue in detecting large objects [29].
The YOLOv5 (v6.0/6.1) continued to use CSPDarknet53 as a backbone and replaced the Focus layer, which was introduced in the earlier version to a 6 × 6 Conv2d. Furthermore, the spatial pyramid pooling was then replaced with the SPPF (F for fast). The SPPF layer increases the receptive field and separates the most important features from the backbone. The YOLOv5 version 6.0/6.1 [24] used the same head as in YOLOv3 and YOLOv4. Fig. 5 shows the architecture of the latest YOLOv5 model L. In summary, Yolov5 now consists of three parts, namely, backbone (new CSP-Darknet53) for feature formation, neck (SPPF, new CSP-PAN) for feature extraction, and head (YOLOv3 Head) for detection. C3 denoted in backbone and neck comprises three convolutional layers and a module cascaded by two types of bottlenecks. Finally, the last three convolution layers in the head of the network are detection modules that generate three different feature maps. It is worth mentioning that since the YOLOv5 version 4.0 [30], all activation functions (LeakyReLU or Leaky rectified linear unit [31] and HardSwish [32]) used in convolutional layers are replaced by the Sigmoid linear unit [33] to simplify the architecture.
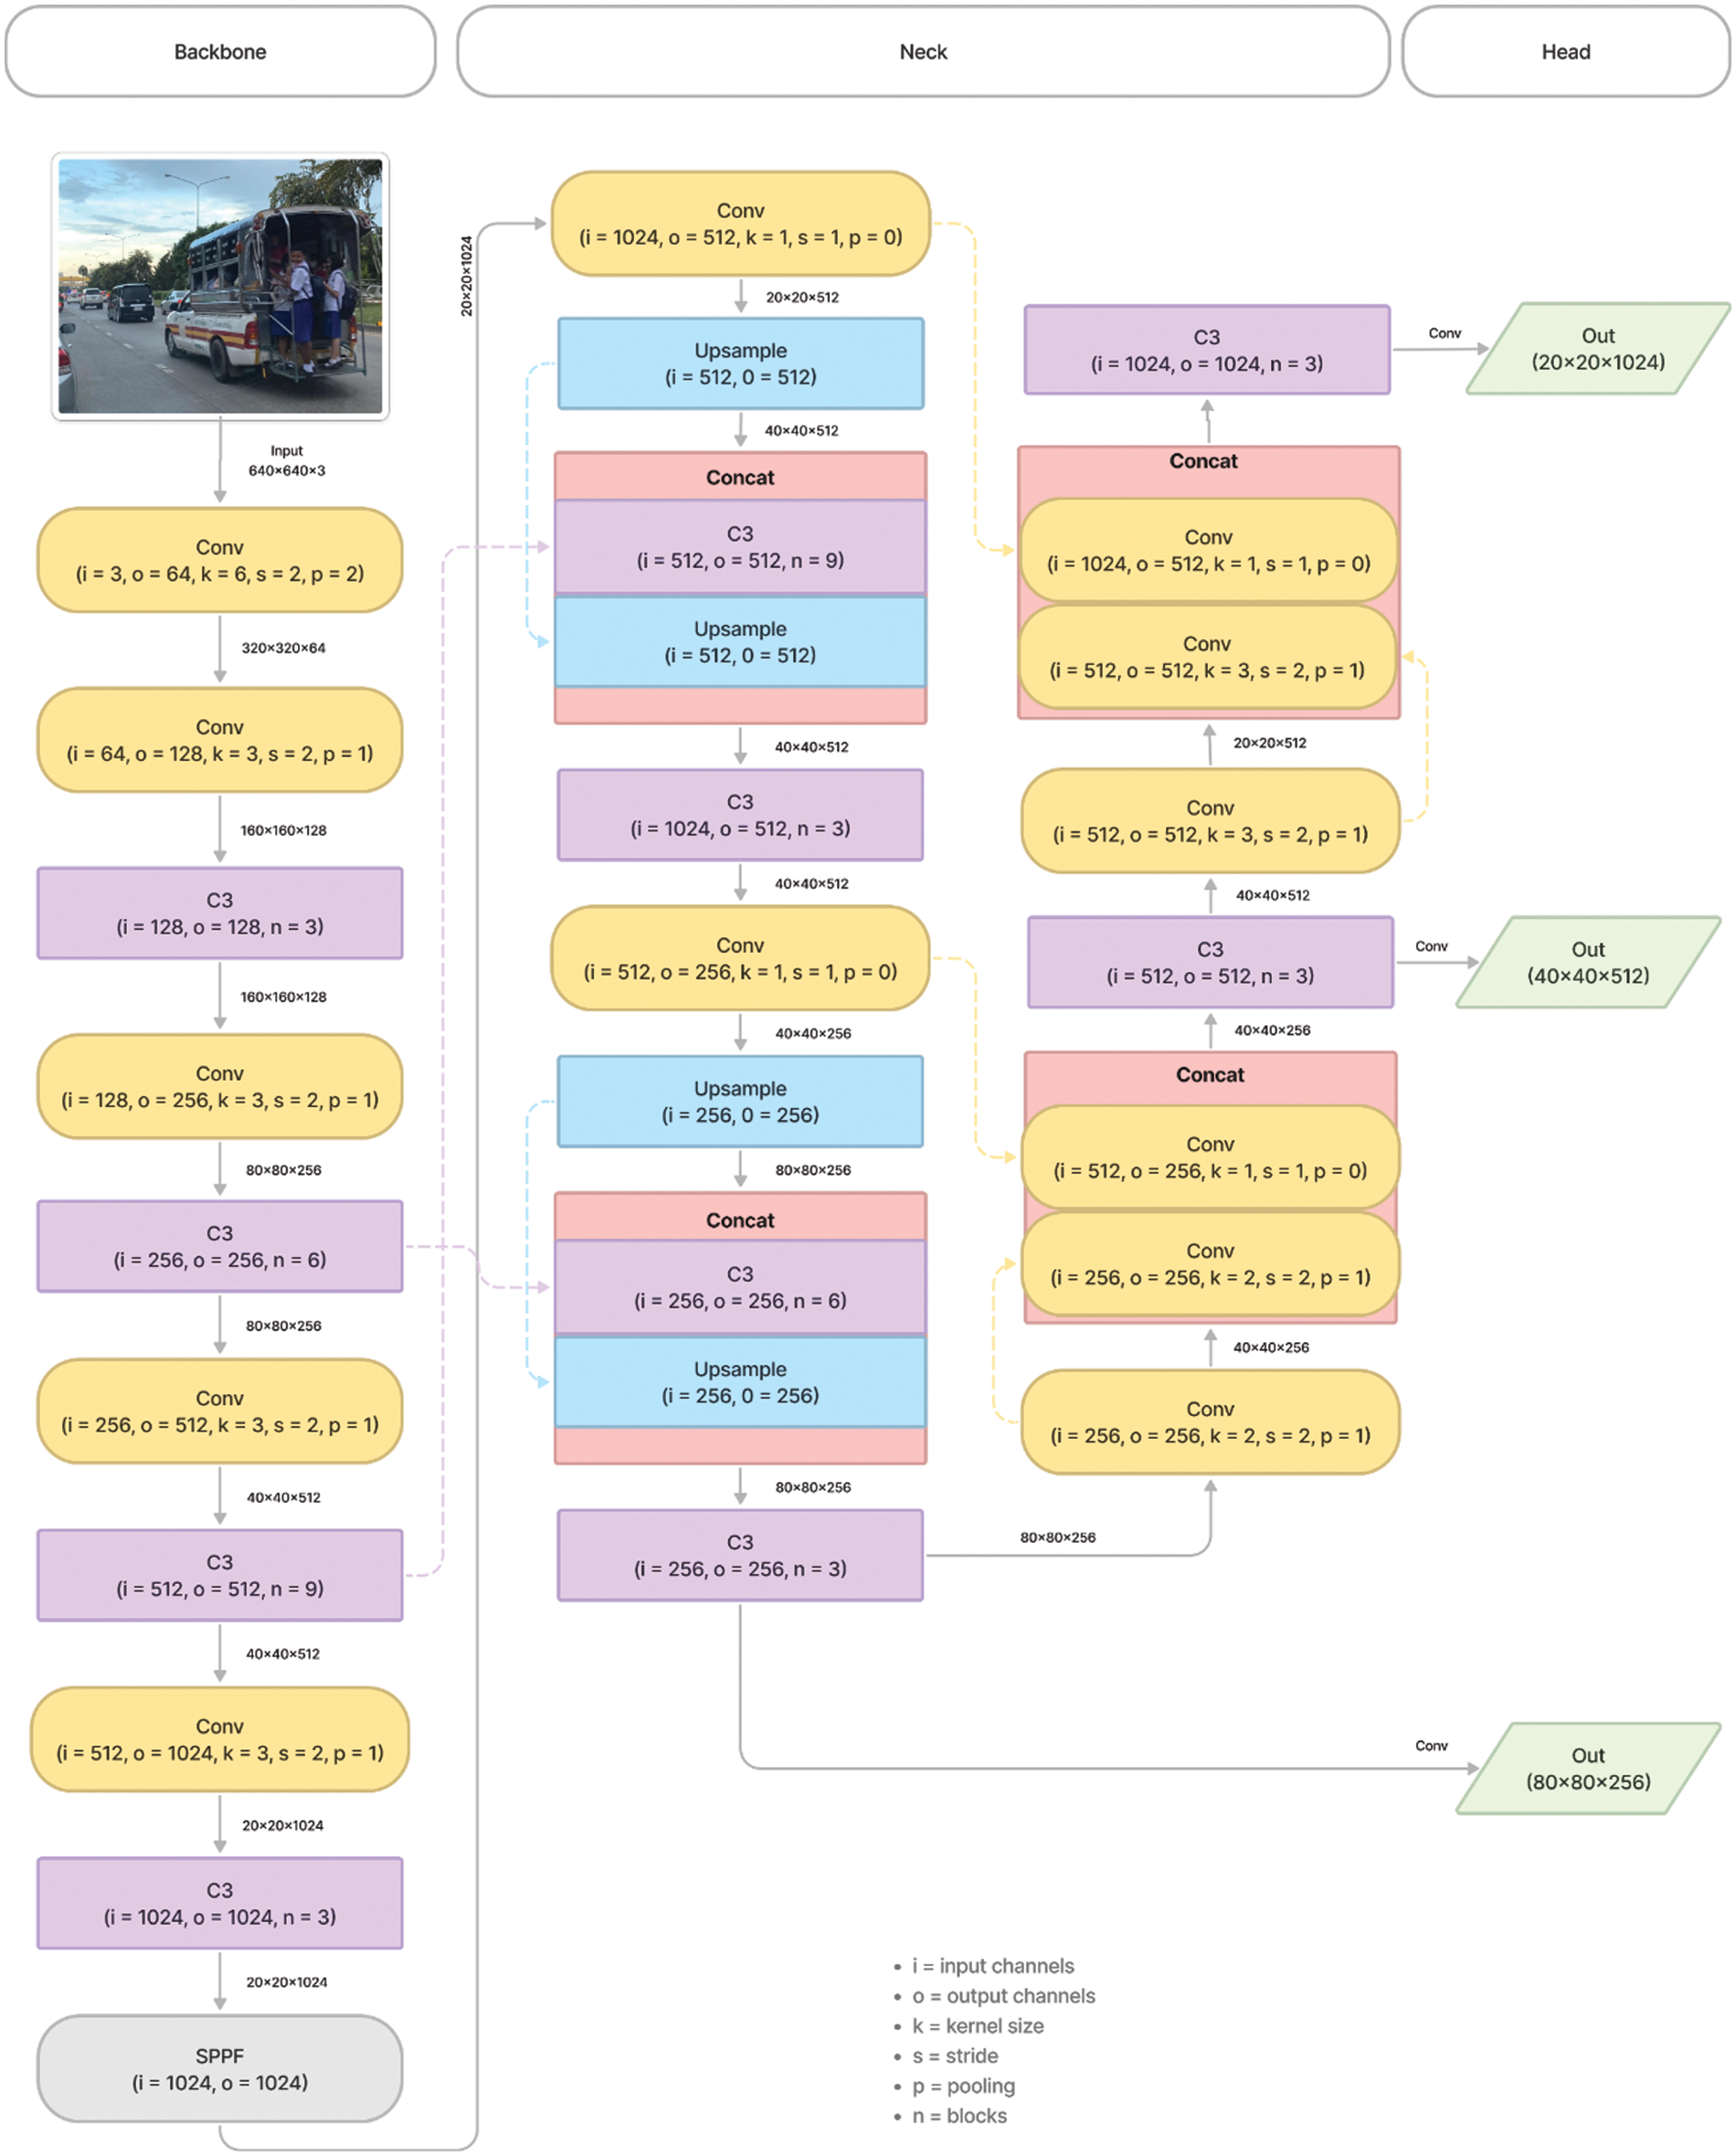
Figure 5: Model structure of YOLOv5L (You Only Look Once)
The authors employed a transfer learning technique to train the models because of its simplicity and shorter training time. We have used the pretrained YOLOv5 models N, S, M, L, and X to recognize overcrowded PTPT. All pretrained weights were obtained from the official GitHub repository. All models were trained and inferred to Ubuntu 21.04 with PyTorch 1.8 on an NVIDIA GeForce RTX2070. We then set the training hyperparameters to default without freezing the backbone (F = 0) for 1,200 epochs with early stopping. The training batch size was set to the maximum number to fully use the GPU memory. Furthermore, the image size was set to 640 × 640 to match the pretrained models. The number of classes was then set to 2.
To test and compare the models, we used standard evaluation indicators of precision, recall, f1 score, average precision (AP), mAP, and FPS. Precision is the ratio of correctly detected to all detected labels, how many retrieved items are relevant. Recall is the ratio of correctly detected to all positive targets, how many relevant items are retrieved. F1 score is the harmonic mean of precision and recall. The AP metric is known to be a way to describe a precision-recall curve representing the average of all precision. The mean average precision is simply an average of the AP of all classes. The final evaluation metric is the FPS, which describes the number of images that can be processed in one second. Eqs. (1)–(5) define the formulas as follows:
where TP = true positive, FP = false positive, FN = false negative
In this section, we compare the five pretrained YOLO models, which include YOLOv5n, YOLOv5s, YOLOv5 m, YOLOv5L, and YOLOv5x. These pretrained weights can be found and downloaded directly from GitHub [34]. The standard metric used to evaluate the object detection model is the mean AP, as described in Eq. (5). Higher mAP values were noted to imply better accuracy. All five models were trained for 1,200 epochs with early stopping, as seen in the “Best epoch” column shown in Table 3. The precision, recall, and F1 values are also shown in the same table and plotted in Fig. 6. As shown in Fig. 7, our models dropped in losses steeply in the early steps and gradually converged. This coincided with an increase in accuracy.
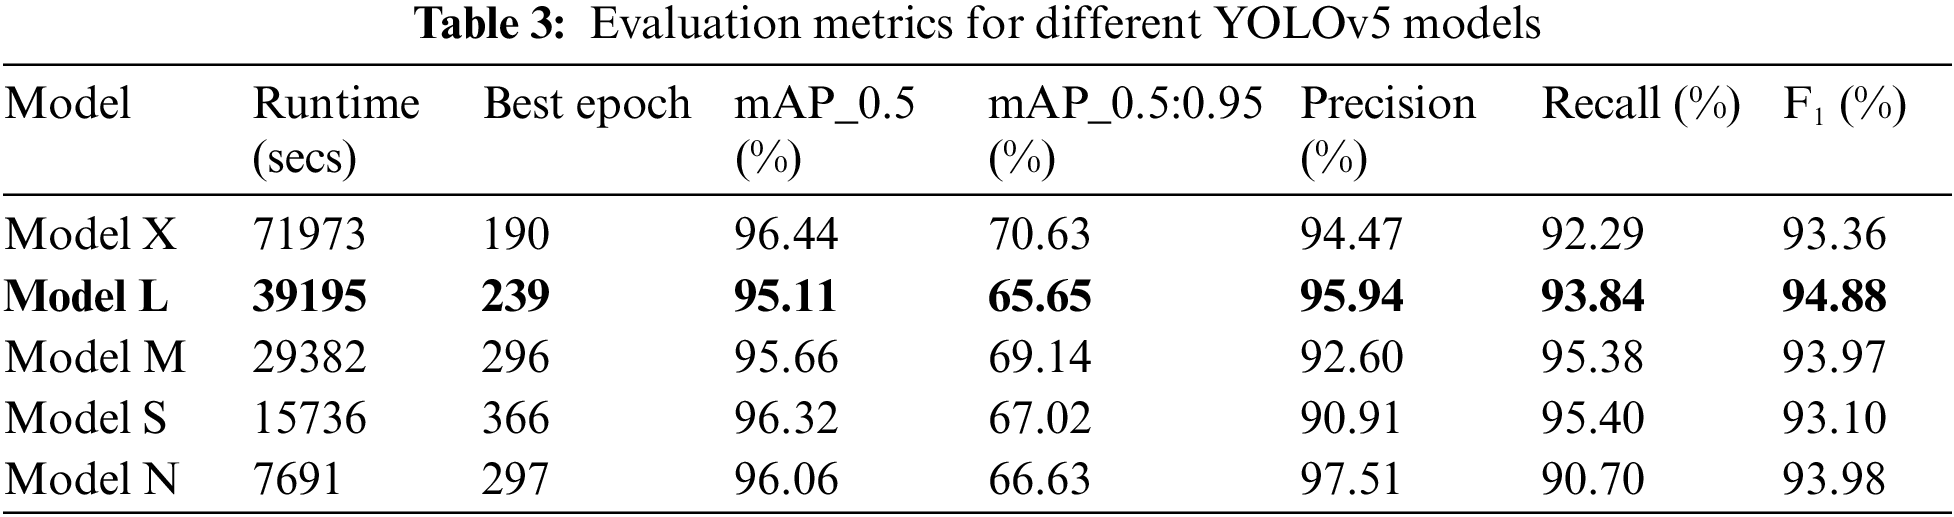
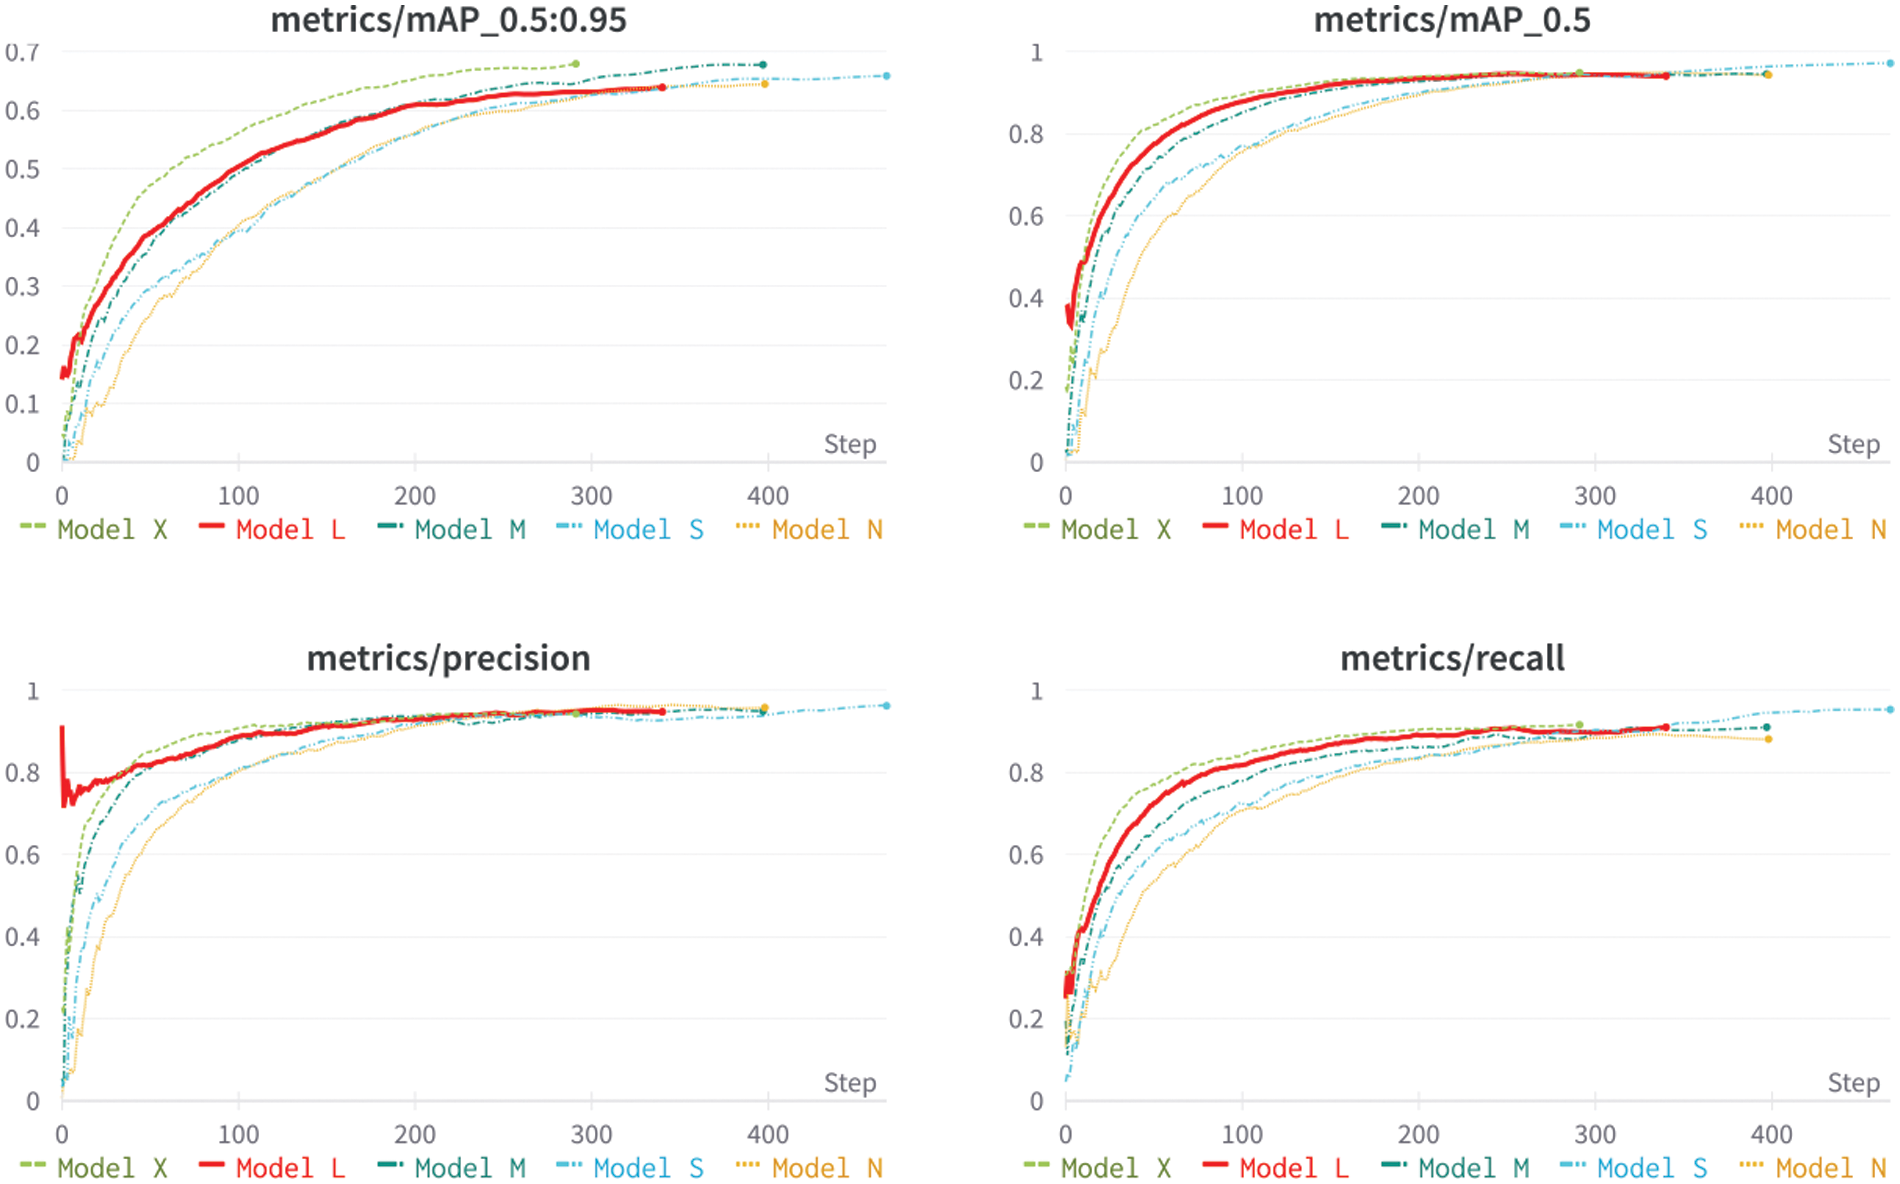
Figure 6: Precision, recall, and mean average precision on five YOLOv5 models
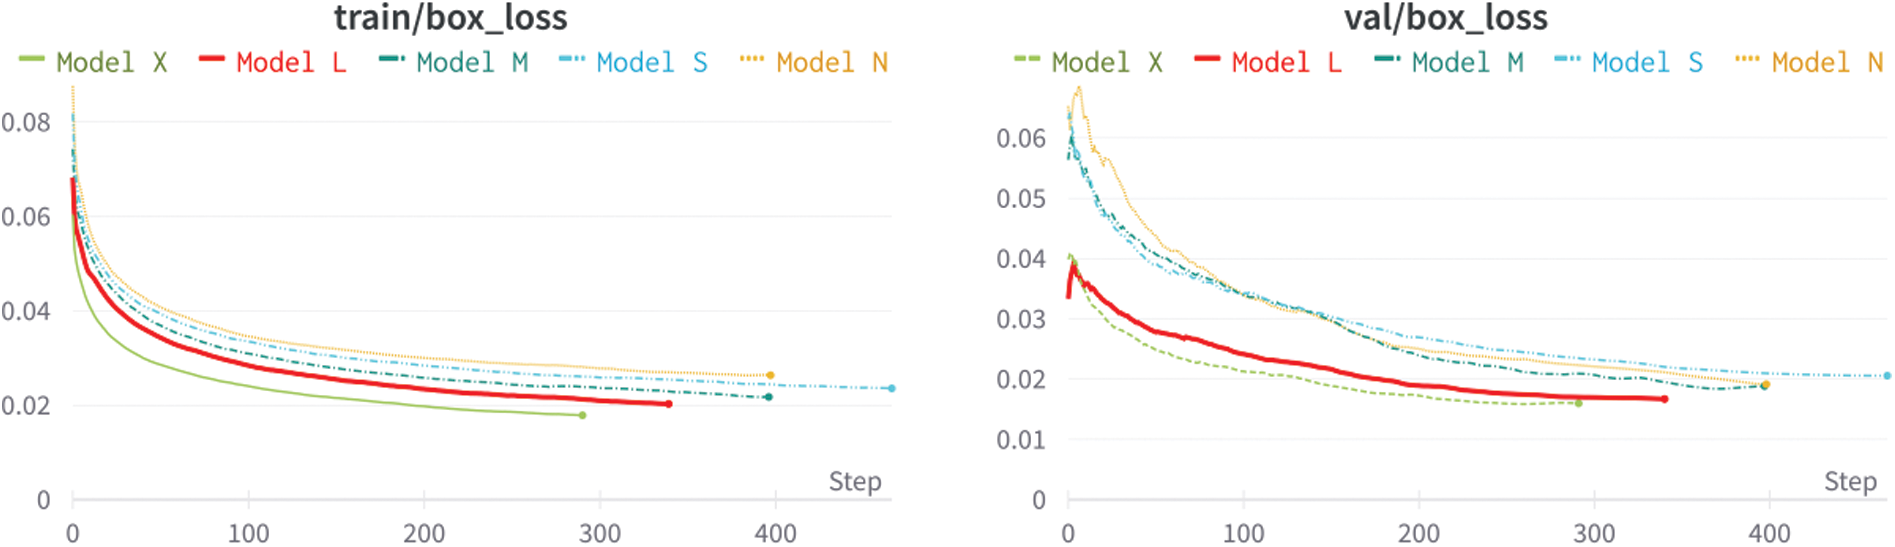
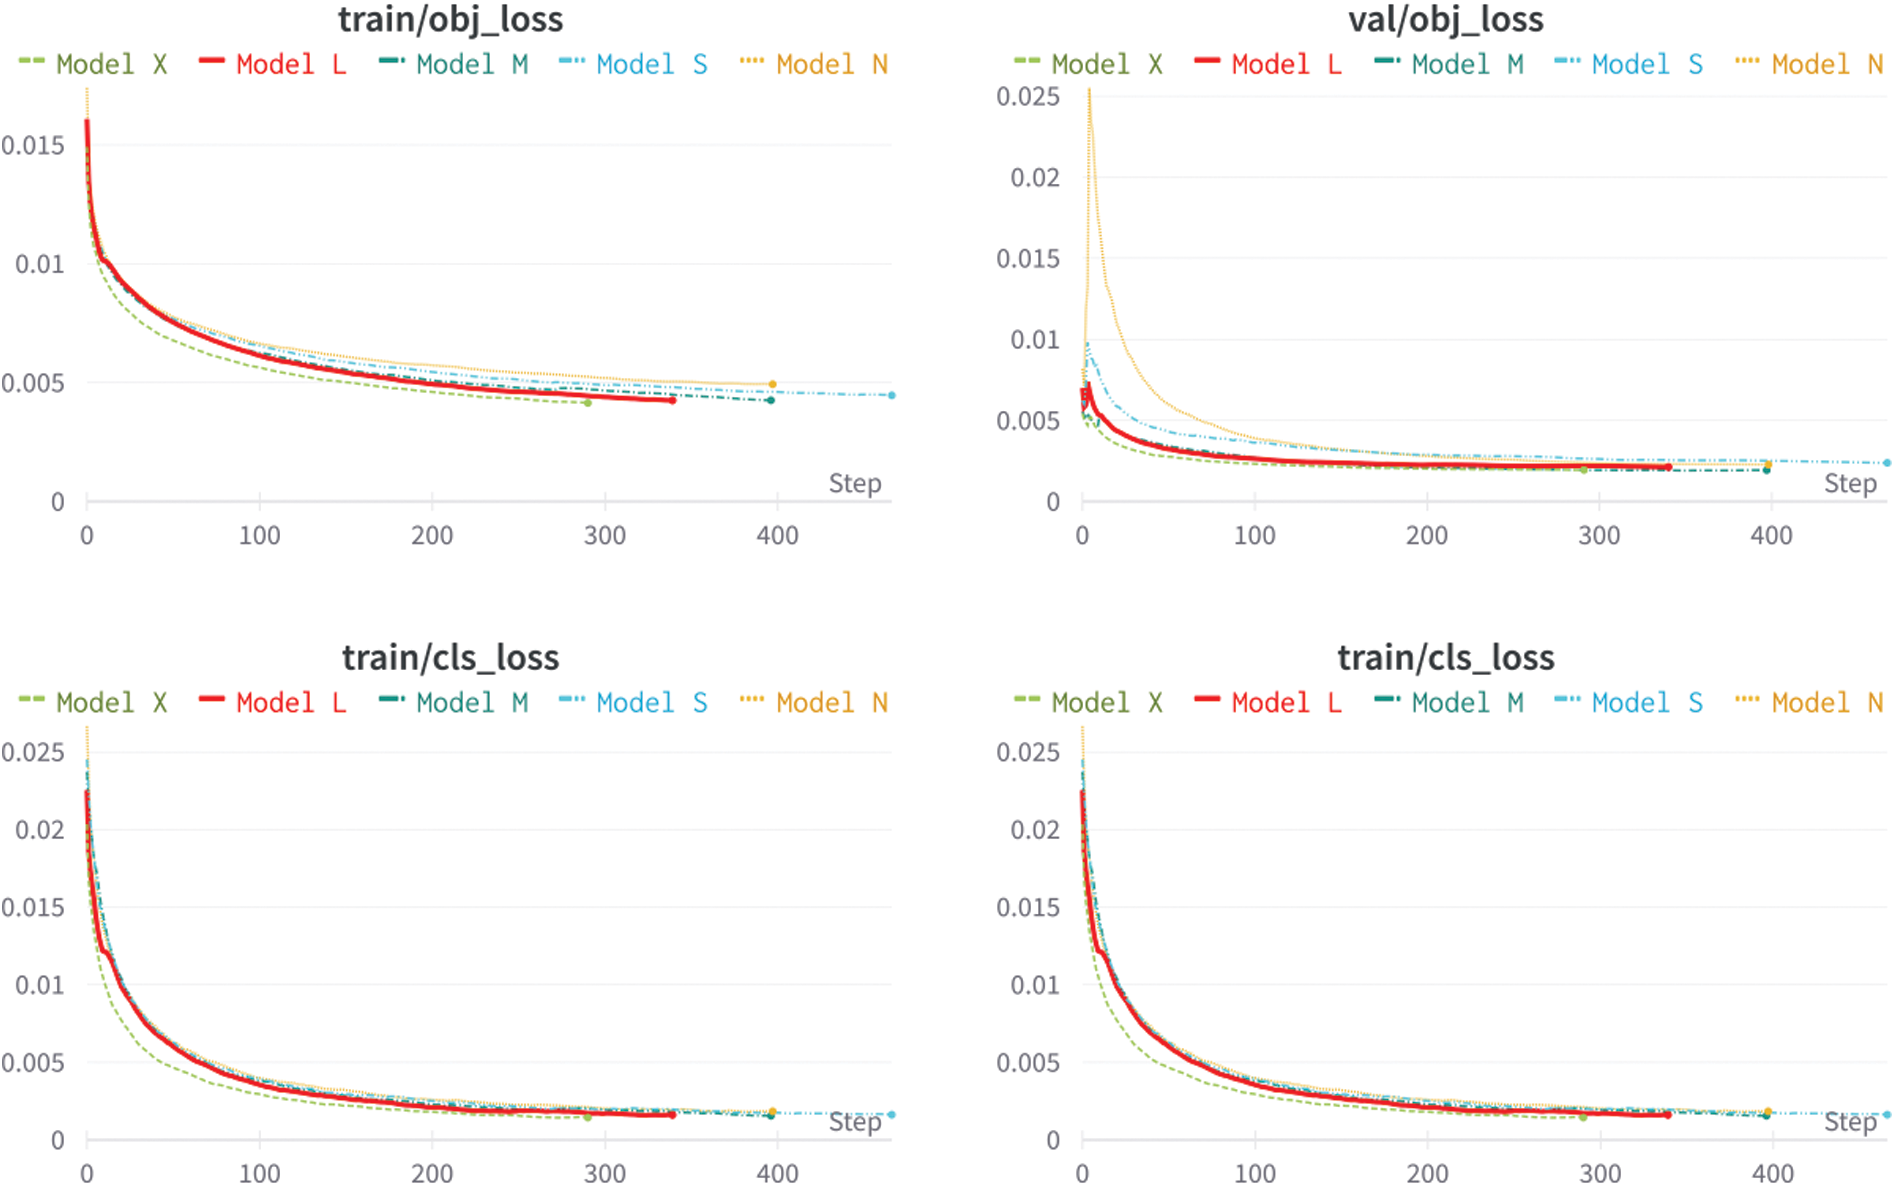
Figure 7: Train and validation loss
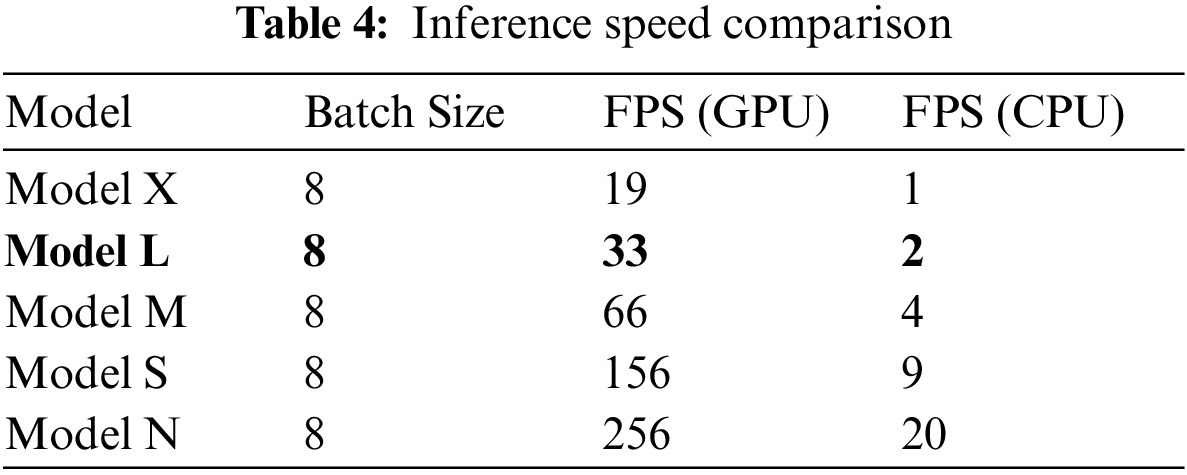
Because our application calls for real-time use, we need to also measure the FPS. The FPS is a reciprocal of the inference time taken by the model per image and is summarized in Table 4. As can be seen, the selected model should not be used on an edge device because the FPS is too low for real-time applications. It is also worth mentioning that different batch sizes and computer environment settings will result in different detection speeds.
All trained models were similar in terms of precision and recall (see Fig. 8) as well as F1 score (see Fig. 9). The models showed similar results in confusion matrix diagrams (see Fig. 10). Therefore, selecting the model to use was a trial-and-error process. In this study, we chose YOLOv5L with a confidence threshold of 0.60 and an IOU threshold of 0.55. These results were satisfied on both the GPU and CPU based on the accuracy, as shown in Figs. 11 and 12.
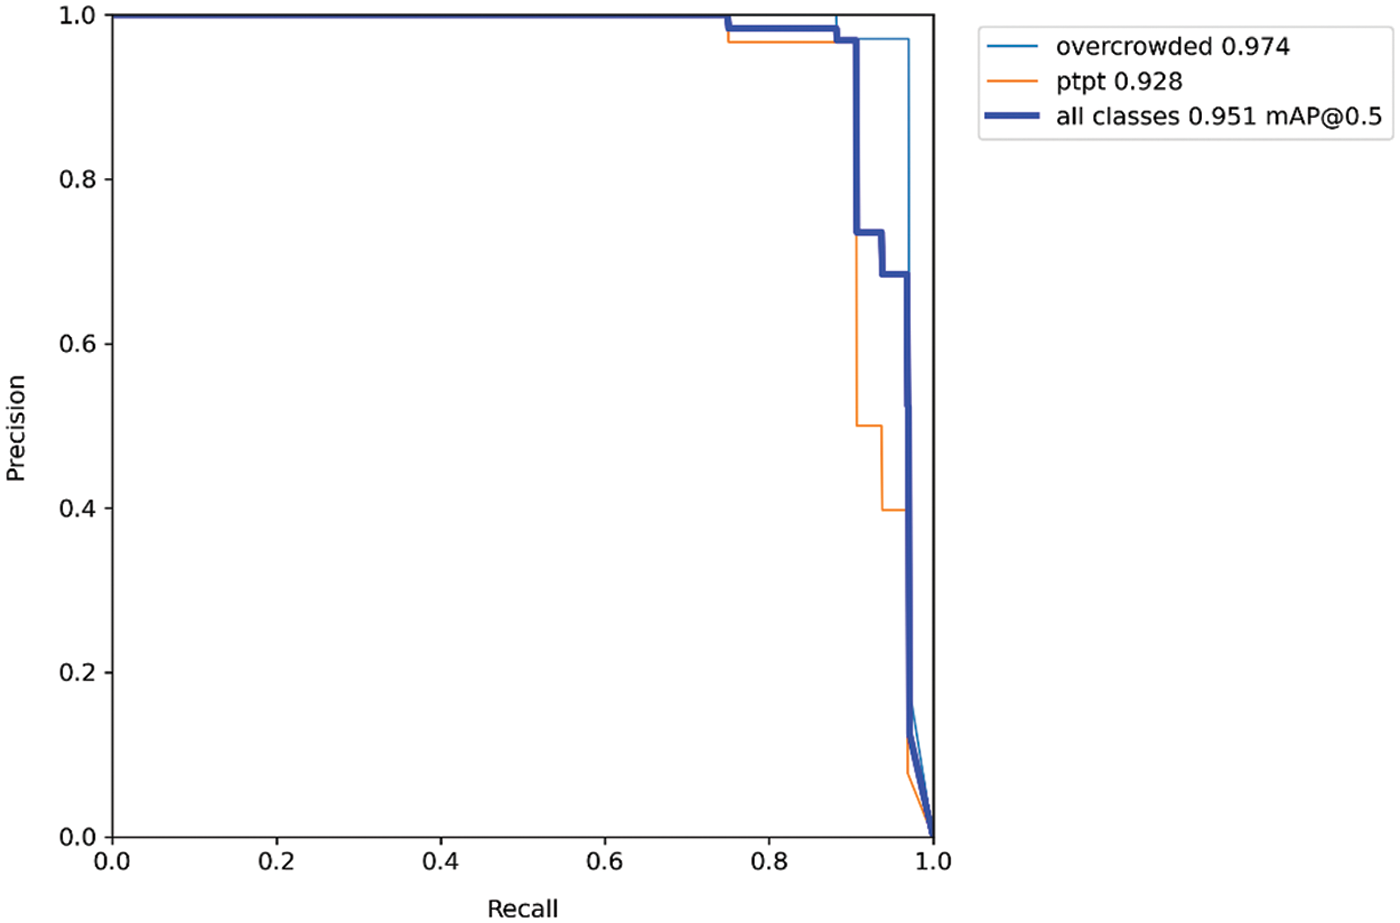
Figure 8: Precision-recall curve of YOLOv5L
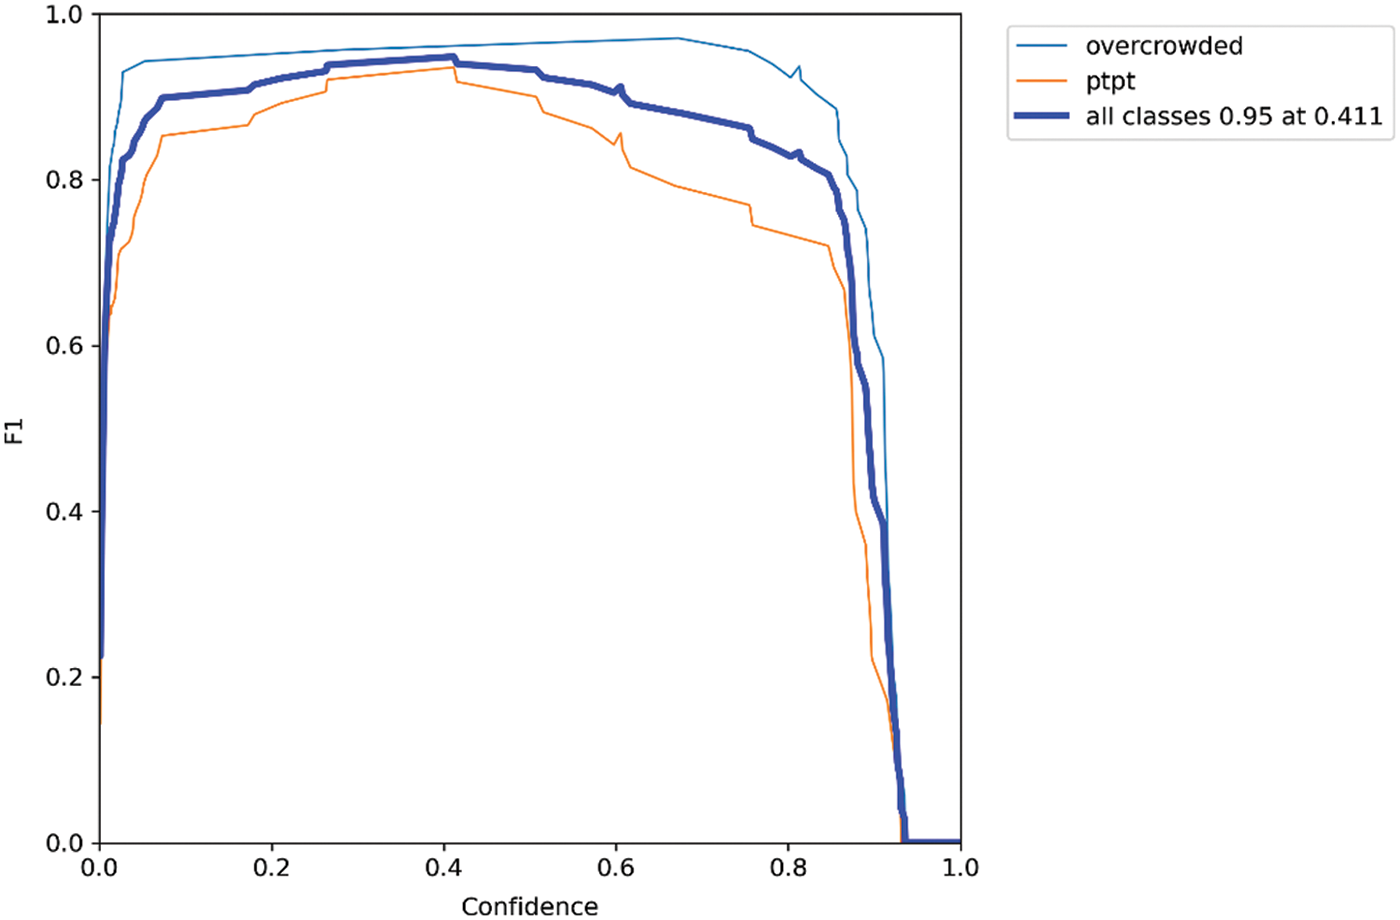
Figure 9: F1 plot of YOLOv5L
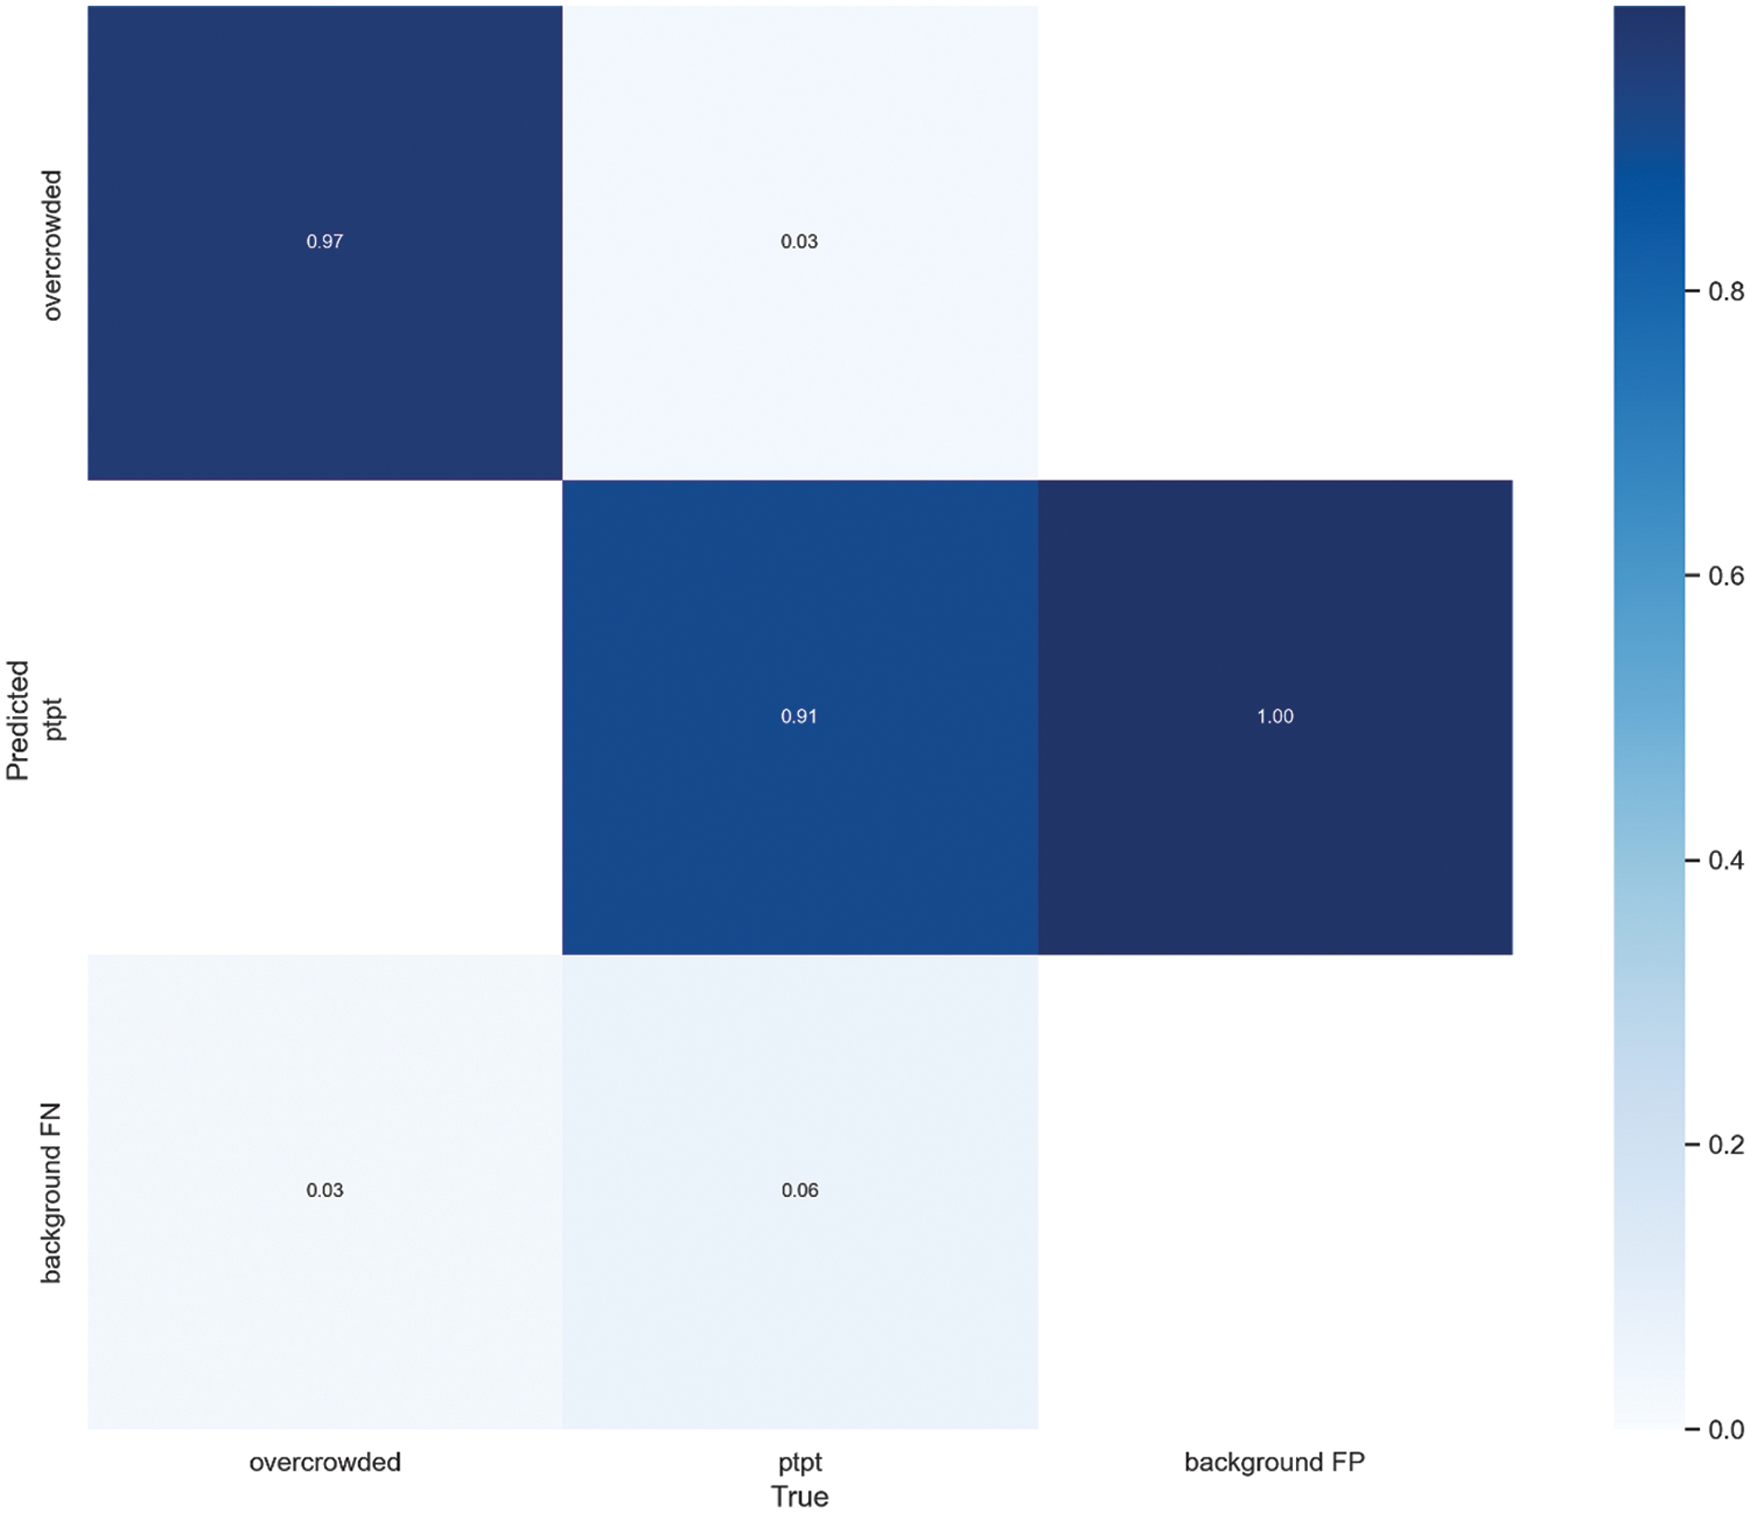
Figure 10: Confusion matrix of YOLOv5L
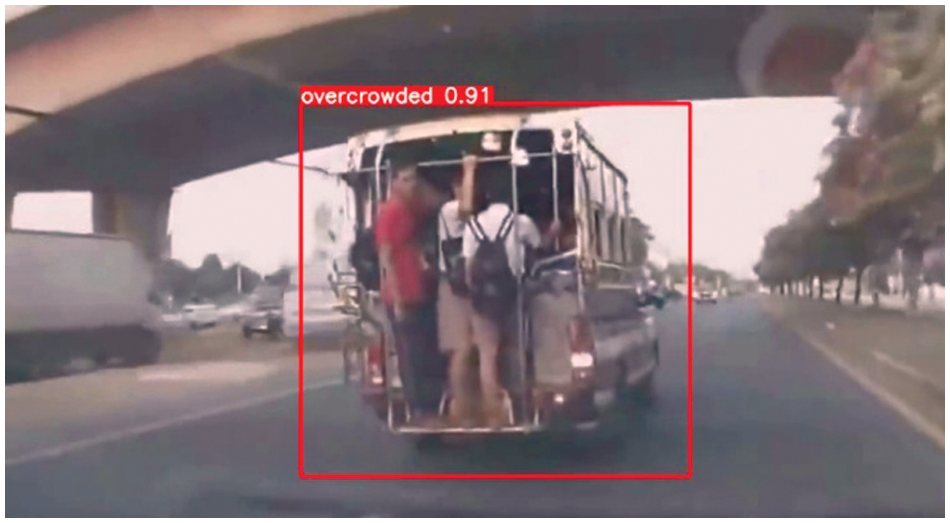
Figure 11: Overcrowded detection by YOLOv5L [35]

Figure 12: Multiclass detection by YOLOv5L [36]
In this study, we have focused in developing an object detection system to detect the illegal use of public light pickup trucks that could lead to road injury and fatality. We labeled our image dataset by hand and trained on well-known and up-to-date YOLOv5 (You Only Look Once) pretrained models from the smallest (N) to the biggest (X). We compared the finetuned models in terms of both accuracy and speed. We selected the large version (L) because it provided the best balance of speed and accuracy compared with the other models. The chosen model was tested on a video and displayed in the previous section. As per our findings, we conclude that using the YOLOv5L algorithm with our custom dataset is the best option for detecting overcrowded trucks and ensuring road safety. However, our model was performed at about 2 FPS on the CPU which considered too low for a real-time detection task. GPU utilization could be used to gain better FPS in the meantime. An optimization to achieve higher frame rate is recommended in the future. Furthermore, standing passengers in the back of an overcrowded PTPT could obscure the license plate from camera view. This would then obstruct a traffic enforcement system from capturing photographic evidence of violating vehicles. Improvements should thus be addressed in the future.
Acknowledgement: We are grateful to the people behind the libraries and frameworks used in this study, specifically Ultralytics and Facebook PyTorch, which provided all the tools needed in the modern deep learning industry.
Funding Statement: This work was supported by (i) Suranaree University of Technology, (ii) Thailand Science Research and Innovation, and (iii) National Science Research and Innovation Fund (Grant Number: RU-7-706-59-03).
Conflicts of Interest: The authors declare that they have no conflicts of interest to report regarding this study.
References
1. World Health Organization, “Global status report on road safety,” Geneva, Switzerland, 7 November 2018. [Google Scholar]
2. K. Lurstwut, W. Phothiyod and C. Ounban, “Development model of participation to prevent road traffic accident by engaging multilateral networks in lamphun province,” Lanna Public Health Journal, vol. 14, no. 1, pp. 59, 2018. [Google Scholar]
3. Department of Land Transportation, “Transport statistics report in 2021,” Bangkok, Thailand, 2021. [Google Scholar]
4. A. M. Kayid, “Performance of cpus/gpus for deep learning workloads,” Research report, Faculty of Media Engineering and Technology, The German University in Cairo, Cairo, Egypt, 2018. [Google Scholar]
5. T. Carneiro, R. V. Medeiros Da Nobrega, T. Nepomuceno, G. -B. Bian, V. H. C. De Albuquerque et al., “Performance analysis of google colaboratory as a tool for accelerating deep learning applications,” IEEE Access, vol. 6, pp. 61677–61685, 2018. [Google Scholar]
6. C. -Y. Wang, I. -H. Yeh and H. -Y. M. Liao, “You only learn one representation: Unified network for multiple tasks,” arXiv:2105.04206, pp. 1–11, 2021. [Google Scholar]
7. Z. Ge, S. Liu, F. Wang, Z. Li and J. Sun, “Yolox: Exceeding yolo series in 2021,” arXiv:2107.08430, pp. 1–7, 2021. [Google Scholar]
8. M. Carranza-García, J. Torres-Mateo, P. Lara-Benítez and J. García-Gutiérrez, “On the performance of one-stage and two-stage object detectors in autonomous vehicles using camera data,” Remote Sensing, vol. 13, no. 1, pp. 89, 2021. [Google Scholar]
9. J. -a. Kim, J. -Y. Sung and S. -h. Park, “Comparison of faster-rcnn, yolo, and ssd for real-time vehicle type recognition,” in 2020 IEEE Int. Conf. on Consumer Electronics-Asia (ICCE-Asia), Seoul, Korea, pp. 1–4, 2020. [Google Scholar]
10. C. Kwan, D. Gribben, B. Chou, B. Budavari, J. Larkin et al., “Real-time and deep learning based vehicle detection and classification using pixel-wise code exposure measurements,” Electronics, vol. 9, no. 6, 1014, pp. 1–21, 2020. [Google Scholar]
11. U. Nepal and H. Eslamiat, “Comparing yolov3, yolov4 and yolov5 for autonomous landing spot detection in faulty uavs,” Sensors, vol. 22, no. 2, pp. 464, 2022. [Google Scholar]
12. A. Paszke, S. Gross, F. Massa, A. Lerer, J. Bradbury et al., “Pytorch: An imperative style, high-performance deep learning library,” arXiv:1912.01703, pp. 1–12, 2019. [Google Scholar]
13. N. Ofir and J. -C. Nebel, “Classic versus deep learning approaches to address computer vision challenges,” arXiv:2101.09744, pp. 1–6, 2021. [Google Scholar]
14. J. Canny, “A computational approach to edge detection,” IEEE Transactions on Pattern Analysis and Machine Intelligence, vol. PAMI-8, no. 6, pp. 679–698, 1986. [Google Scholar]
15. T. Intachak and K. Wacharin, “Vehicle detection and classification system for traffic video surveillance,” in The 5th Conf. on Application Research and Development (ECTI-CARD), Bangkok, Thailand, 2013. [Google Scholar]
16. W. Maungmai and C. Nuthong, “Vehicle classification with deep learning,” in 2019 IEEE 4th Int. Conf. on Computer and Communication Systems (ICCCS), Singapore, pp. 294–298, 23–25 February 2019. [Google Scholar]
17. M. N. Roecker, Y. M. G. Costa, J. L. R. Almeida and G. H. G. Matsushita, “Automatic vehicle type classification with convolutional neural networks,” in 2018 25th Int. Conf. on Systems, Signals and Image Proc. (IWSSIP), Maribor, Slovenia, pp. 1–5, 2018. [Google Scholar]
18. A. L. Cristiani, R. Immich, A. T. Akabane, E. R. M. Madeira, L. A. Villas et al., “Atrip: Architecture for traffic classification based on image processing,” Vehicles, vol. 2, no. 2, pp. 303–317, 2020. [Google Scholar]
19. K. Piniarski, P. Pawłowski and A. Dąbrowski, “Tuning of classifiers to speed-up detection of pedestrians in infrared images,” Sensors, vol. 20, no. 16, pp. 4363, 2020. [Google Scholar]
20. D. Roy, P. Panda and K. Roy, “Tree-cnn: A hierarchical deep convolutional neural network for incremental learning,” Neural Netw, vol. 121, pp. 148–160, Jan 2020. [Google Scholar]
21. J. Kim, “Vehicle detection using deep learning technique in tunnel road environments,” Symmetry, vol. 12, no. 12, 2012, 2020. [Google Scholar]
22. J. Zhu, Z. Wang, S. Wang and S. Chen, “Moving object detection based on background compensation and deep learning,” Symmetry, vol. 12, no. 12, 1965, pp. 1–17, 2020. [Google Scholar]
23. M. S. U. S. Tabassum, N. H. Al-Nur and S. Shatabda, “Native vehicles classification on Bangladeshi roads using cnn with transfer learning,” in 2020 IEEE Region 10 Symp. (TENSYMP), Dhaka, Bangladesh, pp. 40–43, 2020. [Google Scholar]
24. WZMIAOMIAO, “Yolov5 (6.0/6.1) brief summary #6998,” Github. https://github.com/ultralytics/yolov5/issues/6998 (accessed on 03 March 2022). [Google Scholar]
25. J. Redmon, S. Divvala, R. Girshick and A. Farhadi, “You only look once: Unified, real-time object detection,” arXiv:1506.02640, pp. 1–10, 2015. [Google Scholar]
26. S. Ioffe and C. Szegedy, “Batch normalization accelerating deep network training by reducing internal covariate shift,” in 32nd Int. Conf. on Machine Learning, ICML, Lille, France, pp. 448–456, 2015. [Google Scholar]
27. J. Redmon and A. Farhadi, “Yolo9000: Better, faster, stronger,” arXiv:1612.08242, pp. 1–9, 2016. [Google Scholar]
28. J. Redmon and A. Farhadi, “Yolov3: An incremental improvement,” arXiv:1804.02767, pp. 1–6, 2018. [Google Scholar]
29. A. Bochkovskiy, C. -Y. Wang and H. -Y. M. Liao, “Yolov4: Optimal speed and accuracy of object detection,” arXiv:2004.10934, pp. 1–17, 2020. [Google Scholar]
30. G. Jocher. “V4.0-nn.Silu() activations, weights & biases logging, pytorch hub integration.” https://github.com/ultralytics/yolov5/releases/tag/v4.0 (accessed on 07 Jan 2022). [Google Scholar]
31. B. Xu, N. Wang, T. Chen and M. Li, “Empirical evaluation of rectified activations in convolutional network,” arXiv:1505.00853, pp. 1–5, 2015. [Google Scholar]
32. A. Howard, M. Sandler, G. Chu, L. -C. Chen, B. Chen et al., “Searching for mobilenetv3,” arXiv:1905.02244, pp. 1–11, 2019. [Google Scholar]
33. S. Elfwing, E. Uchibe and K. Doya, “Sigmoid-weighted linear units for neural network function approximation in reinforcement learning,” arXiv:1702.03118, pp. 1–18, 2017. [Google Scholar]
34. WZMIAOMIAO, “V6.1-tensorrt, tensorflow edge tpu and openvino export and inference,” Github. https://github.com/ultralytics/yolov5/releases (accessed on 11 Aug 2022). [Google Scholar]
35. Thairath Online. Arrest of a minibus driving across a traffic lane in nakhon ratchasima claiming to hurry (in thai), Youtube. https://youtu.be/KZSGL1kDedE, September 22, 2019. [Google Scholar]
36. Thairath Online. Establishment of an ad hoc working group to arrest song-taews equipped with audio equipment (in thai), Youtube. https://youtu.be/ouJskQP6bDw, October 11, 2016. [Google Scholar]
Cite This Article
 Copyright © 2023 The Author(s). Published by Tech Science Press.
This work is licensed under a Creative Commons Attribution 4.0 International License , which permits unrestricted use, distribution, and reproduction in any medium, provided the original work is properly cited.
 Downloads
 Citation Tools