
 Submit a Paper
 Propose a Special lssue
 Open Access
ARTICLE

Explainable Anomaly Detection Using Vision Transformer Based SVDD
1 Department of Computer Science, Kyonggi University, Suwon-si 16227, Korea
2 Division of AI Computer Science and Engineering, Kyonggi University, Suwon-si 16227, Korea
* Corresponding Author: Kyungyong Chung. Email:
Computers, Materials & Continua 2023, 74(3), 6573-6586. https://doi.org/10.32604/cmc.2023.035246
Received 13 August 2022; Accepted 01 November 2022; Issue published 28 December 2022
 View Full Text
 Download PDF
Abstract
Explainable AI extracts a variety of patterns of data in the learning process and draws hidden information through the discovery of semantic relationships. It is possible to offer the explainable basis of decision-making for inference results. Through the causality of risk factors that have an ambiguous association in big medical data, it is possible to increase transparency and reliability of explainable decision-making that helps to diagnose disease status. In addition, the technique makes it possible to accurately predict disease risk for anomaly detection. Vision transformer for anomaly detection from image data makes classification through MLP. Unfortunately, in MLP, a vector value depends on patch sequence information, and thus a weight changes. This should solve the problem that there is a difference in the result value according to the change in the weight. In addition, since the deep learning model is a black box model, there is a problem that it is difficult to interpret the results determined by the model. Therefore, there is a need for an explainable method for the part where the disease exists. To solve the problem, this study proposes explainable anomaly detection using vision transformer-based Deep Support Vector Data Description (SVDD). The proposed method applies the SVDD to solve the problem of MLP in which a result value is different depending on a weight change that is influenced by patch sequence information used in the vision transformer. In order to draw the explain-ability of model results, it visualizes normal parts through Grad-CAM. In health data, both medical staff and patients are able to identify abnormal parts easily. In addition, it is possible to improve the reliability of models and medical staff. For performance evaluation normal/abnormal classification accuracy and f-measure are evaluated, according to whether to apply SVDD. Evaluation Results The results of classification by applying the proposed SVDD are evaluated excellently. Therefore, through the proposed method, it is possible to improve the reliability of decision-making by identifying the location of the disease and deriving consistent results.Keywords
In medical big data, there has been an increase in the demand for transparency and reliability of decision-making that helps to diagnose the status of disease risk. For the improvement in the healthcare of people in the latent high-risk groups, predictive modeling and semantic relationship discovery based on interpretable machine learning are researched [1]. In order to overcome the limitations of the conventional decision-making model based on deep learning, it is necessary to make metacognition for modals through machine learning from objects with different modalities. That is a technique of promoting the next-generation AI to share meta knowledge through relation extraction or inference. As for decision-making, knowledge is generated on the basis of data sampling and mathematical statistic models, so it is impossible to find the evidence or process to draw a result. For these reasons, there is a lack of transparency and explainability, and the issue of reliability continues to arise in the diagnosis process [2].
Machine learning-based anomaly detection finds a particular pattern different from most data features, and thereby separates normality from abnormality. The technique is applicable to various areas, including healthcare, finance, cyber security, and manufacturing. For example, in the healthcare area, anomaly detection in Computed Tomography (CT), X-ray, and Electrocardiogram (ECG) data is used to predict and diagnose health anomalies [2,3]. Anomaly detection classifies learning into supervised, unsupervised, and semi-supervised learning types depending on whether there is a sample. Since unsupervised learning needs no data labels, it takes less time and cost to generate samples but there is an unstable performance of accuracy [4]. Supervised learning-based anomaly detection features with high accuracy. Since the technique needs both data and labels of normal and abnormal samples, it takes a lot of time and cost to generate samples, and class imbalance can occur [5]. In reality, sample data of normal class outnumber those of abnormal class. It is necessary to devise a method of solving the problem and improving the performance of model prediction. Semi-supervised learning makes use of normal samples only for model learning if a class imbalance occurs. The technique supports model learning only with the use of normal samples but has lower accuracy than supervised learning [6]. Therefore, it is necessary to develop a method of improving accuracy on the basis of normal samples only.
With the development of AI technology, the performance of prediction models has been improved. The model has become complex, and the amount of learning data has been large continuously, and accordingly, a user has more difficulty interpreting the result extracted by the model [7]. To solve the problem, eXplainable Artificial Intelligence (XAI) is researched. The XAI has explainability added to understand the process of extracting a result and the process of making a decision in the AI model [8]. In the healthcare area, patients have difficulty understanding the position, treatment, and diagnosis method of their diseases. Therefore, AI, which provides support for diagnosis and treatment decision-making, needs explanatory/interpretable artificial intelligence that medical staff and patients can fully understand [9].
Therefore, this study proposes explainable anomaly detection using vision transformer-based SVDD. The proposed method solves the problem of the cost of saving data by resizing chest x-ray data as a preprocess in order to make the decision as to whether there is pneumonia. As for anomaly detection, Deep Support Vector Data Description (SVDD) is applied to the classification of the Vision Transformer (ViT) model in order to improve the accuracy of normal and abnormal classification. For explainable SVDD, a grad-cam is used to visualize normal and abnormal areas. In this way, it is possible to detect and identify the position and evidence of pneumonia and establish a decision-making model that is reliable and interpretable. The contribution of the proposed method is as follows.
• Improve accuracy by using only normal samples for model training.
• The MLP of the existing vision transformer applies SVDD to solve the problem of the difference in the result value according to the weight change. Therefore, it extracts consistent results.
• To create an explanatory decision-making model, visually interpretable grad-cam is applied to visualize the normal/abnormal region to construct a reliable model.
This thesis is composed as follows: in chapter 2 are described Deep Support Vector Data Description (SVDD) and meta knowledge based explainable decision-making modeling; chapter 3 is described the explainable anomaly detection using vision transformer-based SVDD; chapter 4 are described the result and performance evaluation of the proposed method; in chapter 5 is the conclusion of this study drawn.
2.1 Classification Using Deep Support Vector Data Description
Deep SVDD provides the description of a sphere form for a target data set and describes the data usable for anomaly detection and classification. It is also used for one-class classification [10]. The method learns a feature space on the basis of deep learning and finds the optimal hypersphere with a small radius, which encloses normal data in the feature space. Based on the boundary of the hypersphere, it classifies and expresses normal and abnormal data [10,11]. Fig. 1 shows the structure of Deep SVDD.

Figure 1: Deep SVDD configuration diagram [10]
As shown in Fig. 1, data is classified into normal class and abnormal class in the Data Space. In SVDD, the kernel function ∅ is used to map data in different dimensions to classify data into normal and abnormal classes. In Deep SVDD, the kernel function is changed to deep learning to learn weight values for data mapping. In the data-mapped dimensions through the learned weight values, a classifier is applied. The purposes of Deep SVDD are to minimize the volume of the sphere enclosing the data in the output space F where the center c is specified in a feature space if its radius is larger than 0 and to learn the parameter W of the network jointly. That ends up mapping the normal samples of data to the center c closely. Abnormal samples are mapped far away from the center or outside of the sphere.
Eq. (1) shows the objective function of Deep SVDD. The equation ∅ means neural network and ∅(wi:W) means the neural network with the weight W for the sample data x.
In all network expressions ∅ (wi:W) of Deep SVDD in Eq. (1), the secondary loss is used in order to apply a penalty to the distance to the center c of feature space. In the second term, the weight decay of the network with a positive hyper-parameter λ is normalized. Deep SVDD minimizes the average distance of all data expressions to the center and makes a sphere small. Accordingly, the anomaly score is defined as the distance to the center of the sphere. Eq. (2) shows the anomaly score. In the equation, as means anomaly score, x means test data, and W* means the network parameter of the trained model (which is learned completely).
In Eq. (2), anomaly score means how far the output feature of the neural network model completely learned is distant from the center of a sphere. The closer to the center of the sphere, the more normal; the farther from the center of the sphere, the more abnormal.
2.2 Meta-Knowledge-Based Explanatory Decision-Making Modeling
Generally, an explanation helps to understand something or find something ambiguous and clear. Interpretation helps users figure out the meaning of a certain thing. Interpretation means something beyond explanation so that it requires a deeper explanation [7]. Explainable Artificial Intelligence (XAI) helps users understand and trust the output result of an AI model [7,8]. Features of objects are converted and normalized depending on data features. After that, the association is learned on the basis of semantic analysis of models, and thus a meaningful result is drawn. In reality, for transparency, classification, prediction, time-series analysis, regression analysis, hierarchical clustering, and association are applied. In decision-making modeling, with the use of meta knowledge, it is possible to increase the inference performance for drawing semantic correlations, finding useful rules, and processing explainable cognition for disease risk. In this way, it is possible to find causal relations between disease risk factors whose associations are obscure. Fig. 2 shows the meta-knowledge-based explainable decision-making modeling process.

Figure 2: Meta-knowledge-based explainable decision-making modeling process
As explainable AI algorithms, there are such techniques as tree, feature importance, and visualization. The decision tree is capable of classifying or predicting a group by answering questions repeatedly. Through visualization, it has its own power of interpretation, and ordinary people are able to make interpretations. In addition, the result drawn by a model can be understood stepwise. Feature importance is the technique of analyzing how much data features influence the accuracy of algorithm classification [12]. A representative method for visualization is Gradient-weighted Class Activation Mapping (Grad-CAM). CAM provides visual explanation power when a class is determined in the CNN-based network. It needs a Global Average Pooling (GAP) Layer. A CNN model flattens the last feature map and converts it into a fully connected layer before learning. In this case, if the flattened map is learned, information on the original feature map is lost. For this reason, CAM uses GAP. If CNN has no GAP, it is necessary to add the layer. In this case, it is required to add a new layer and do fine-tuning. This technique causes a performance change. To solve the problem, Grad-CAM, which is based on a weight value, is applied [13]. Since Grad-CAM can maintain an existing model structure, it needs no model change and solves the problem of structure limitation. In addition, it is applicable to a variety of CNN models [14].
3 Explainable Anomaly Detection Using Vision Transformer Based SVDD
The explainable anomaly detection using vision transformer-based Deep SVDD proposed in this study is the method of detecting any pneumonia symptom in chest X-rays. By collecting data, it designs binary classification in which data with symptoms are classified into abnormal data, and data without symptoms into normal data. It preprocesses an image by resizing it in the same size, extracts an object, and generates embedding in vector space. After that, data learning occurs sufficiently in the vision transformer model, and thereby causal relations between disease risk factors whose associations are obscure are taken into account. In the final classification model of the vision transformer, the SVDD model, rather than the MLP of VIT is applied for classification. In the last step, whether to have any symptoms is determined on the basis of the result of SVDD. In order to make a decision easily in the abnormal area that is the evidence of classification, Grad-CAM is used to achieve transformation in a visually recognizable space. Fig. 3 shows the explainable anomaly detection process using vision transformer-based SVDD process.

Figure 3: Explainable anomaly detection process using vision transformer-based SVDD process
3.1 Data Collection and Preprocessing
Pneumonia is a bacteria-induced infection that inflames and indurates the air sacs in the lungs. This disease is caused by the infection of bacteria and viruses. It generates such symptoms as cough, phlegm, fever, and dyspnea [15]. Pneumonia is diagnosed through a chest x-ray. If a patient has a symptom of pneumonia, consolidation appears in the chest x-ray. It means that the lung tissues are filled with liquid, rather than air. The pneumatized normal lung is indurated, and an opaque shade appears in the chest x-ray [15,16]. The data used in this study are chest x-ray data for finding whether to have pneumonia. Pediatric patients’ chest x-ray [17] images are used, and 5,863 data are classified into train, test, and val data sets. Each image is also classified into Normal and Abnormal depending on whether it has any symptoms of pneumonia. Table 1 shows examples of normal and abnormal chest x-ray images. Normal means an image without symptoms of pneumonia, and Abnormal is an image with symptoms of pneumonia.
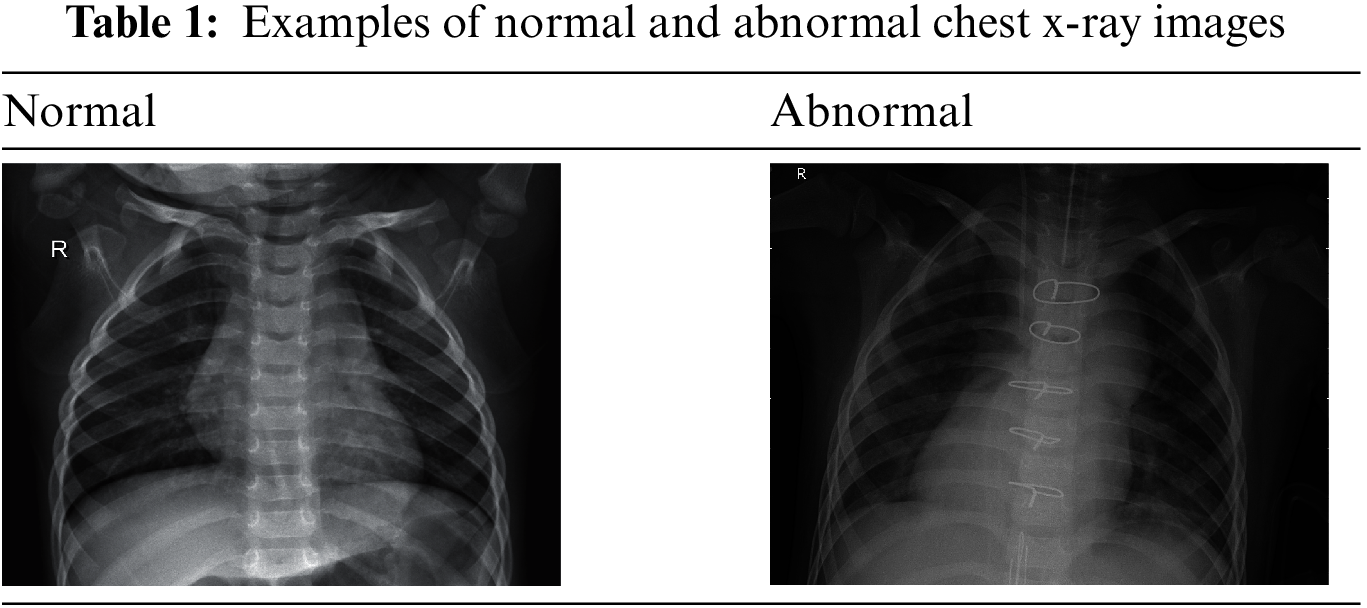
In the case of the Normal x-ray image in Table 1, the lung has no opaque areas and is clear. In the case of the Abnormal x-ray image, any opaque area is found.
Chest x-ray [17] data have different sizes so that images with diverse resolutions are saved. It causes an increase in the cost of saving images. Therefore, images are resized to the size 384 × 384 equally. Since data channels have grayscale and RGB mixed, it is difficult to analyze data in the same criteria. For this reason, all data channels are converted into RGB. By converting white & black x-ray data into RGB, it is possible to check pixel differences in more detail. Bilateral Filter [18] is applied to make the contours of pneumonia areas clear and accurate. It can make edges sharp and reduce noise. In this way, it is possible to define relations between modeling factors whose associations are unclear.
3.2 Vision Transformer Based SVDD Model
Vision Transformer is a model with highly improved performance by applying vision domain to the transformer learned with a large corpus through the cognitive process like BERT, which is a pre-learning language model, in Natural Language Processing (NLP). Objects are extracted through image preprocessing, and mapping is made in the way of generating embedding in the vector space of the same space. As for embedding, meaning is reflected in order to find a causal relationship between risk factors whose associations are unclear [19]. Fig. 4 shows the structure of the standard transformer.

Figure 4: Structure of standard transformer
In terms of image patches, the standard transformer in Fig. 4, redesigns each pixel sequentially in order to process an image. At this time, an input image is split into small patches and is flattened linearly. Each one of the generated image patches is used as input data for the encoder of the transformer. When the class token is extracted as the final output of the encoder layer of the transformer, it is used as the one-dimensional expression vector for the image. To inform a model of a sequence of patches, position embedding gives sequence information to patches. The patches with sequence information are used as input data for the encoder of the transformer. The encoder of the transformer consists of Layer normalization, Multi-head self-attention, Residual connection, Multi-Layer perceptron (MLP), and MLP head. Layer normalization is the step of normalizing all embedding. With the use of patches that have sequence information, Multi-head self-attention (MSA) calculates each embedding’s query, key, and value for self-attention in consideration of learning weights. Accordingly, an attention value is calculated and gets concatenated in the dimension direction. With an increase in an attention value, soft-max function prevents gradient vanishing. In this way, multi-head attention is generated. At this time, multi-head learns the local and global dependence of image. Two residual connections are applied. The first residual connection supports direct performance without passing non-linear activation function. It is capable of reducing model complexity and solving the problems of overfitting and gradient vanishing. The second residual connection merges the matrix generated in MLP with the matrix created in the first residual connection and generates a final output feature. Multi-Layer perceptron (MLP) consists of two linear layers. The first layer plays a role in enlarging an embedding size. The second one serves a role in returning the embedding size to its original one. MLP head is the output step of the transformer. In this step, classification is made with the class token to express the embedding of the whole image [19,20].
However, the value of the flatten vector is changed along with the sequence information of the patch. Accordingly, since a weight value in MLP changes during fully connected operation, the result value is different. To solve the problem, MLP is replaced by SVDD in order for classifier redesign. Fig. 5 shows the structure of the proposed SVDD model based on a vision transformer.

Figure 5: Structure of the proposed SVDD model based on a vision transformer
The vision transformer of the vision transformer-based SVDD in Fig. 5 is based on the ViT-base-16-384 models that showed the best performance in a previous study. When a model is designed, MLP, which has the classification function in ViT, is replaced by SVDD which is used for the classification of normality and abnormality. It makes a sphere’s radius as small as possible and determines that the data in the sphere are normal. For anomaly detection, it determines that the data out of the sphere are abnormal. For pre-learning, it is necessary to improve the performance of the proposed model. Therefore, chest x-ray data are fine-tuned to a ViT model in high resolution.
3.3 Explainable Anomaly Detection Using Grad-CAM
A deep learning model has excellent performance. Since the model has a complex structure, it is difficult to break it up into intuitive and understanding components, and thus to conduct model analysis. To solve the problem, visually explainable Grad-CAM is applied [21]. Grad-CAM assigns an important value in order to decide on a particular region of interest. In order to understand the importance of such a decision, it uses the gradient information on the movement to the last convolution layer of the convolution network. Therefore, Grad-CAM focuses on the explanation of the evidence for the decision made by the network. It is applicable to diverse CNN models with no need for structural change or re-training [13,14]. In order to use the output result drawn by ViT based SVDD model in an explainable model, Grad-CAM is applied to add explanatory power to the model. Fig. 6 shows the process of explainable anomaly detection using Grad-CAM.

Figure 6: Process of explainable anomaly detection using Grad-CAM
As shown in Fig. 6, Grad-CAM visualizes the output result of vit-based SVDD anomaly detection in order for easier analysis. The output image of SVDD is used as the input image of the convolution network. The feature map drawn by the convolution network is flattened, and its gradient score is extracted. Accordingly, in the FC layer, the weight of the feature map is calculated with the use of the gradient, and then the importance of the feature map is determined. In the last output, relu function generates heat-map that is applied to the feature influencing a region of interest. By visualizing the results of anomaly detection that are determined to be classified as Abnormal, it is possible to interpret them.
4 Results and Performance Evaluation
The data used in this study are chest x-ray data [17]. These 5,863 chest x-ray data consist of train, test, and validation data sets. They are classified into normality and abnormality. Abnormality means pneumonia. Abnormal train data number 3,233, and normal data 1,109. There is a little bias. Generally, since x-ray data have a low resolution and unclear contours, it is hard for a model to learn them accurately. Therefore, Bilateral Filter is applied to make the contours of the areas of pneumonia sharp and clear. In addition, since the vision transformer is based on the vit-B-16-384 model that has the best performance, images are resized to the size 384 × 384.
SVDD generates sphere-shaped boundaries in order for binary classification. Normal data exist in the sphere, whereas abnormal data remain out of the sphere. With a support vector, a radius of the sphere is calculated. Through the repeated testing of such parameters as the sphere’s center (C), radius (R), and soft margin, SVDD extracts the result with the most accuracy. With the use of Grad-CAM, the SVDD result is visualized in the areas for pneumonia decision in abnormal data, along the center C of the sphere. With the use of the gradient of a target area, Grad-CAM generates the localization map to emphasize a significant area in the image. It supports visualization to determine normality or abnormality. Fig. 7 shows the visualization result of the proposed anomaly detection.

Figure 7: Visualization result of the proposed anomaly detection
The visualization result of anomaly detection in Fig. 7 shows the explainable result drawn from Grad-CAM for abnormal chest x-ray data. It almost always presents the feature of a relatively bright area. In the first result, the features of many areas are expressed well. In the second result, relatively many areas are not expressed. Nevertheless, the areas of pneumonia are expressed as a result. Therefore, by drawing explainable results through Grad-CAM, it is possible to offer information on decision-making for diagnosis to medical staff. Aside from that, it is possible to give disease information to patients without medical knowledge.
For the evaluation of the performance and validity of the proposed method, accuracy of classification into normality and abnormality depending on whether to apply SVDD and f-measure are evaluated. For the evaluation of generalization ability, accuracy and f-measure are evaluated with a variety of data sets.
Firstly, the accuracy of classification depending on whether to apply SVDD is evaluated. In the confusion matrix, the f-measure is evaluated with the use of accuracy, recall, and precision. Disease prediction performance is evaluated in terms of specificity and sensitivity. The confusion matrix shows a prediction degree on the basis of predicted value and actual value [22,23]. Table 2 shows the confusion matrix.
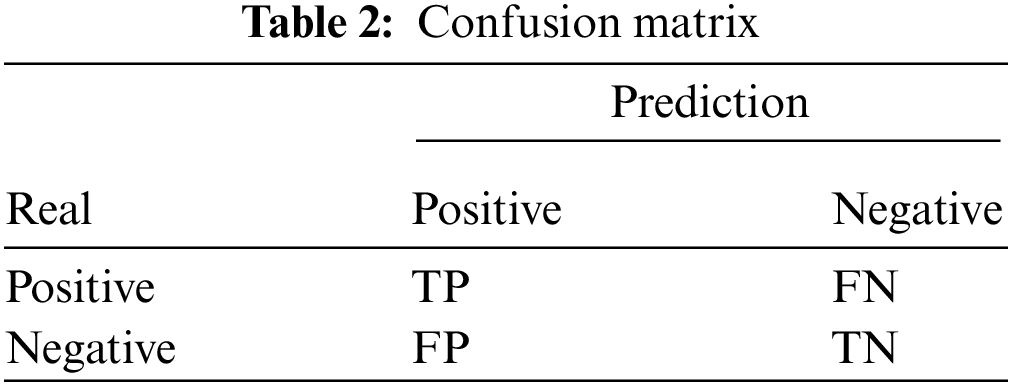
In Table 2, True means a case where an actual value is accurately predicted, and False means a case where an actual value is not accurately predicted. Positive and Negative are expressed on the basis of a predicted value. Accordingly, True Positive (TP) means the accurate prediction of the case where an actual value is Positive; True Negative (TN) means the accurate prediction of the case where an actual value is Negative; False Positive (FP) means the inaccurate prediction of the case where an actual value is Negative (which is predicted to be Positive incorrectly); False Negative (FN) means the inaccurate prediction of the case where an actual value is Positive (which is predicted to be Negative incorrectly). With the use of the confusion matrix, it is possible to evaluate the accuracy, precision, recall, and f-measure [24,25]. An accuracy value ranges from 0 to 1, representing how much an actual value is accurately predicted. Eq. (3) shows accuracy.
Precision represents how much an actual value is accurately predicted when it is Positive. It focuses on the reduction in the number of inaccurate prediction ‘Positive’ cases. Eq. (4) shows precision.
Recall represents the accurate prediction of the case where an actual value is Positive when a predicted value is Positive. Eq. (5) shows recall.
Since recall and precision have a trade-off relationship, it is hard to compare them in a separate decision. To solve the problem, the f-measure is applied. Eq. (6) shows the f-measure.
Table 3 shows the results of performance evaluation depending on whether to apply SVDD.
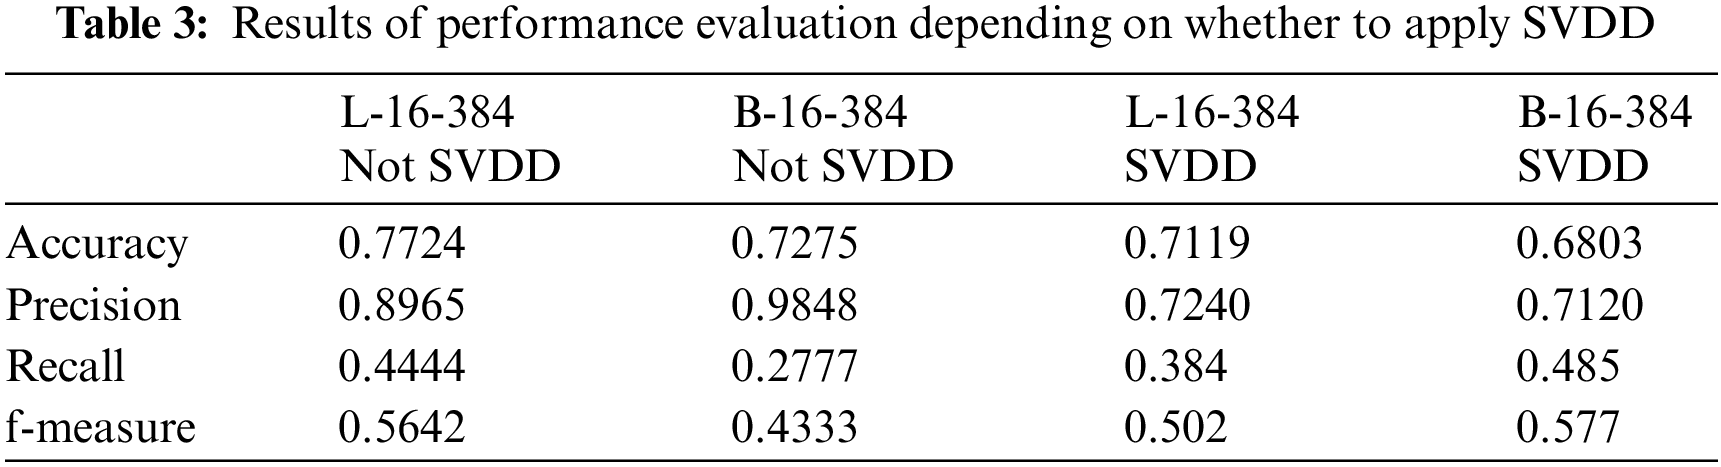
As shown in Table 3, the proposed model is evaluated to have low accuracy but is excellent in f-measure evaluation. Since the normal and abnormal data used in this study have bias, the reliability of accuracy is low. For this reason, accuracy is judged to be insignificant. If the data label has an imbalance structure, the f-measure can be measured for performance. Therefore, the proposed method is determined to have excellent performance.
Secondly, for the evaluation of generalization, the model is evaluated with various data sets. For the performance evaluation of anomaly detection, MV-Tech AD data set [26] as well as a chest x-ray is used. Table 4 shows the results of performance evaluation depending on data sets.
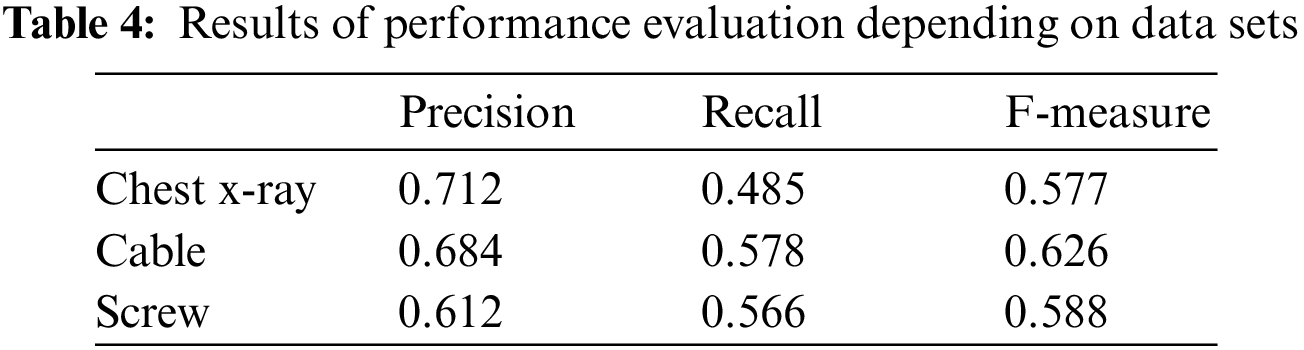
As shown in Table 4, the generalization of the model is evaluated to be the lowest in chest x-ray data. X-ray data depend on a patient’s body size, position, or others so it is difficult to take into account all [27]. Generally, the proposed model tends to have low performance. Its performance is judged to be improved if partial features of the image are more intensively taken into consideration.
In order to solve the decision-making problem with latent high-risk groups and to overcome the limitations of deep learning-based AI data, this study proposed the explainable anomaly detection using vision transformer-based SVDD. It developed the decision-making support method of predicting the disease risk of the latent high-risk group and providing treatment guidelines by applying vision transformer based SVDD to chest x-ray data. Since chest x-ray data have no clear contours, the proposed method applied Bilateral Filter. It did preprocess to reduce noises of low-quality data and make contours sharp. In MLP of vision transformer, since a vector value changes along with the sequence information of patches, a weight value is changed. A result value is different as a weight value is changed. To solve the problem, SVDD was applied. In order to draw the explain-ability of the result of the proposed model, Grad-CAM was applied for the visualization of abnormal areas. In this way, the reliability and transparency of the results extracted by the model were improved. The performance of the proposed method was evaluated according to whether to apply SVDD. In the first evaluation of performance, although the proposed method had low accuracy due to data bias, its f-measure was excellent. In the second evaluation of generalization, performance was evaluated not only with chest x-ray data but cable and screw data. According to the performance evaluation, the f-measure was evaluated to be low, or about 57--62%. Therefore, in the future, it will be planned to solve data bias and to design and research a model with an excellent performance by applying attention to abnormal areas.
Funding Statement: This research was supported by Basic Science Research Program through the National Research Foundation of Korea (NRF) funded by the Ministry of Education (2020R1A6A1A03040583).
Conflicts of Interest: The authors declare that they have no conflicts of interest to report regarding the present study.
References
1. H. Yoo and K. Chung, “Deep learning-based evolutionary recommendation model for heterogeneous big data integration,” KSII Transactions on Internet and Information Systems (TIIS), vol. 14, no. 9, pp. 3730–3744, 2020. [Google Scholar]
2. J. C. Kim and K. Chung, “Prediction model of user physical activity using data characteristics-based long short-term memory recurrent neural networks,” KSII Transactions on Internet and Information Systems (TIIS), vol. 13, no. 4, pp. 2060–2077, 2019. [Google Scholar]
3. H. Zhao, Y. Li, N. He, K. Ma, L. Fang et al., “Anomaly detection for medical images using self-supervised and translation-consistent features,” IEEE Transactions on Medical Imaging, vol. 40, no. 12, pp. 3641–3651, 2021. [Google Scholar]
4. G. Pang, C. Shen, L. Cao and A. V. D. Hengel, “Deep learning for anomaly detection: A review,” ACM Computing Surveys (CSUR), vol. 54, no. 2, pp. 1–38, 2021. [Google Scholar]
5. Y. Kawachi, Y. Koizumi and N. Harada, “Complementary set variational autoencoder for supervised anomaly detection,” in Int. Conf. on Acoustics, Speech, and Signal Processing (ICASSP), Taipei, Taiwan, pp. 2366–2370, 2018. [Google Scholar]
6. B. R. Kiran, D. M. Thomas and R. Parakkal, “An overview of deep learning based methods for unsupervised and semi-supervised anomaly detection in videos,” Journal of Imaging, vol. 4, no. 2, pp. 36–60, 2018. [Google Scholar]
7. A. Adadi and M. Berrada, “Peeking inside the black-box: A survey on explainable artificial intelligence (XAI),” IEEE Access, vol. 6, pp. 52138–52160, 2018. [Google Scholar]
8. A. B. Arrieta, N. Díaz-Rodríguez, J. Del Ser, A. Bennetot, S. Tabik et al., “Explainable artificial intelligence (XAIConcepts, taxonomies, opportunities and challenges toward responsible AI,” Information Fusion, vol. 58, no. 3, pp. 82–115, 2020. [Google Scholar]
9. E. Tjoa and C. Guan, “A survey on explainable artificial intelligence (xaiToward medical xai,” IEEE Transactions on Neural Networks and Learning Systems, vol. 32, no. 11, pp. 4793–4813, 2020. [Google Scholar]
10. L. Ruff, R. Vandermeulen, N. Goernitz, L. Deecke, S. A. Siddiqui et al., “Deep one-class classification,” in Proc. of Machine Learning Research, Stockholm, Sweden, vol. 80, pp. 4393–4402, 2018. [Google Scholar]
11. R. Chalapathy, A. K. Menon and S. Chawla, “Anomaly detection using one-class neural networks,” [online]. Available: arXiv.1802.06360, 2018. [Google Scholar]
12. A. Altmann, L. Toloşi, O. Sander and T. Lengauer, “Permutation importance: A corrected feature importance measure,” Bioinformatics, vol. 26, no. 10, pp. 1340–1347, 2010. [Google Scholar]
13. R. R. Selvaraju, M. Cogswell, A. Das, R. Vedantam, D. Parikh et al., “Grad-CAM: Visual explanations from deep networks via gradient-based localization,” in Int. Conf. on Computer Vision, Venice, Italy, pp. 618–626, 2017. [Google Scholar]
14. R. Fu, Q. Hu, X. Dong, Y. Guo, Y. Gao et al., “Axiom-based grad-cam: Towards accurate visualization and explanation of cnns,” [online]. Available: arXiv preprint arXiv:2008.02312, 2020. [Google Scholar]
15. Korea Centers for Disease Control and Prevention National Health Information Portal, 2022. [Online]. Available: https://health.kdca.go.kr/. [Google Scholar]
16. Yonsei University Health System, 2022. [Online]. Available: https://yuhs.severance.healthcare/. [Google Scholar]
17. D. Kermany, K. Zhang and M. Goldbaum, “Labeled optical coherence tomography (oct) and chest x-ray images for classification,” 2018. [Online]. Available: https://doi.org/10.17632/rscbjbr9sj.2. [Google Scholar]
18. M. Elhoseny and K. Shankar, “Optimal bilateral filter and convolutional neural network based denoising method of medical image measurements,” Measurement, vol. 143, no. 9, pp. 125–135, 2019. [Google Scholar]
19. A. Dosovitskiy, L. Beyer, A. Kolesnikov, D. Weissenborn, X. Zhai et al., “An image is worth 16 × 16 words: Transformers for image recognition at scale,” [online]. Available: arXiv preprint arXiv:2010.11929, 2020. [Google Scholar]
20. A. Arnab, M. Dehghani, G. Heigold, C. Sun, M. Lučić et al., “Vivit: A video vision transformer,” in Int. Conf. on Computer Vision, Montreal, QC, Canada, pp. 6836–6846, 2021. [Google Scholar]
21. T. Chakraborty, U. Trehan, K. Mallat and J. L. Dugelay, “Generalizing adversarial explanations with grad-CAM,” in Conf. on Computer Vision and Pattern Recognition, New Orleans, Louisiana, pp. 187–193, 2022. [Google Scholar]
22. D. Chicco, N. Tötsch and G. Jurman, “The Matthews correlation coefficient (MCC) is more reliable than balanced accuracy, bookmaker informedness, and markedness in two-class confusion matrix evaluation,” BioData Mining, vol. 14, no. 1, pp. 1–22, 2021. [Google Scholar]
23. D. H. Shin, K. Chung and R. C. Park, “Prediction of traffic congestion based on LSTM through correction of missing temporal and spatial data,” IEEE Access, vol. 8, no. 1, pp. 150784–150796, 2020. [Google Scholar]
24. S. Y. Choi and K. Chung, “Knowledge process of health big data using MapReduce-based associative mining,” Personal and Ubiquitous Computing, vol. 24, no. 5, pp. 571–581, 2020. [Google Scholar]
25. J. S. Kang, J. W. Baek and K. Chung, “PrefixSpan based pattern mining using time sliding weight for streaming data,” IEEE Access, vol. 8, no. 1, pp. 124833–124844, 2020. [Google Scholar]
26. P. Bergmann, K. Batzner, M. Fauser, D. Sattlegger and C. Steger, “The MVTec anomaly detection dataset: A comprehensive real-world dataset for unsupervised anomaly detection,” International Journal of Computer Vision, vol. 129, no. 4, pp. 1038–1059, 2021. [Google Scholar]
27. H. Yoo, R. C. Park and K. Chung, “IoT-based health big-data process technologies: A survey,” KSII Transactions on Internet and Information Systems (TIIS), vol. 15, no. 3, pp. 974–992, 2021. [Google Scholar]
Cite This Article
 Copyright © 2023 The Author(s). Published by Tech Science Press.
This work is licensed under a Creative Commons Attribution 4.0 International License , which permits unrestricted use, distribution, and reproduction in any medium, provided the original work is properly cited.
 Downloads
 Citation Tools