
 Submit a Paper
 Propose a Special lssue
 Open Access
ARTICLE

Automated Brain Hemorrhage Classification and Volume Analysis
1 Department of Computer Science, Air University Multan Campus, Multan, 60000, Pakistan
2 Department of Information Technology, Bahauddin Zakariya University, Multan, 60800, Pakistan
3 Department of Engineering and Computer Science, College of Computer Science and Information Technology, Al Baha University, Al Baha, Saudi Arabia
4 School of Computer Science & Information Technology, King Abdulaziz University, Jeddah, Saudi Arabia
5 Department of Intelligent Mechatronics Engineering, Sejong University, Seoul, 05006, Korea
* Corresponding Author: Muhammad Mateen. Email:
Computers, Materials & Continua 2023, 75(1), 2283-2299. https://doi.org/10.32604/cmc.2023.030706
Received 31 March 2022; Accepted 14 July 2022; Issue published 06 February 2023
 View Full Text
 Download PDF
Abstract
Brain hemorrhage is a serious and life-threatening condition. It can cause permanent and lifelong disability even when it is not fatal. The word hemorrhage denotes leakage of blood within the brain and this leakage of blood from capillaries causes stroke and adequate supply of oxygen to the brain is hindered. Modern imaging methods such as computed tomography (CT) and magnetic resonance imaging (MRI) are employed to get an idea regarding the extent of the damage. An early diagnosis and treatment can save lives and limit the adverse effects of a brain hemorrhage. In this case, a deep neural network (DNN) is an effective choice for the early identification and classification of brain hemorrhage for the timely recovery and treatment of an affected person. In this paper, the proposed research work is divided into two novel approaches, where, one for the classification and the other for volume calculation of brain hemorrhage. Two different datasets are used for two different techniques classification and volume. A novel algorithm is proposed to calculate the volume of hemorrhage using CT scan images. In the first approach, the ‘RSNA’ dataset is used to classify the brain hemorrhage types using transfer learning and achieved an accuracy of 93.77%. Furthermore, in the second approach, a novel algorithm has been proposed to calculate the volume of brain hemorrhage and achieved tremendous results as 1035.91 mm3 and 9.25 cm3, using the PhysioNet CT scan tomography dataset.Keywords
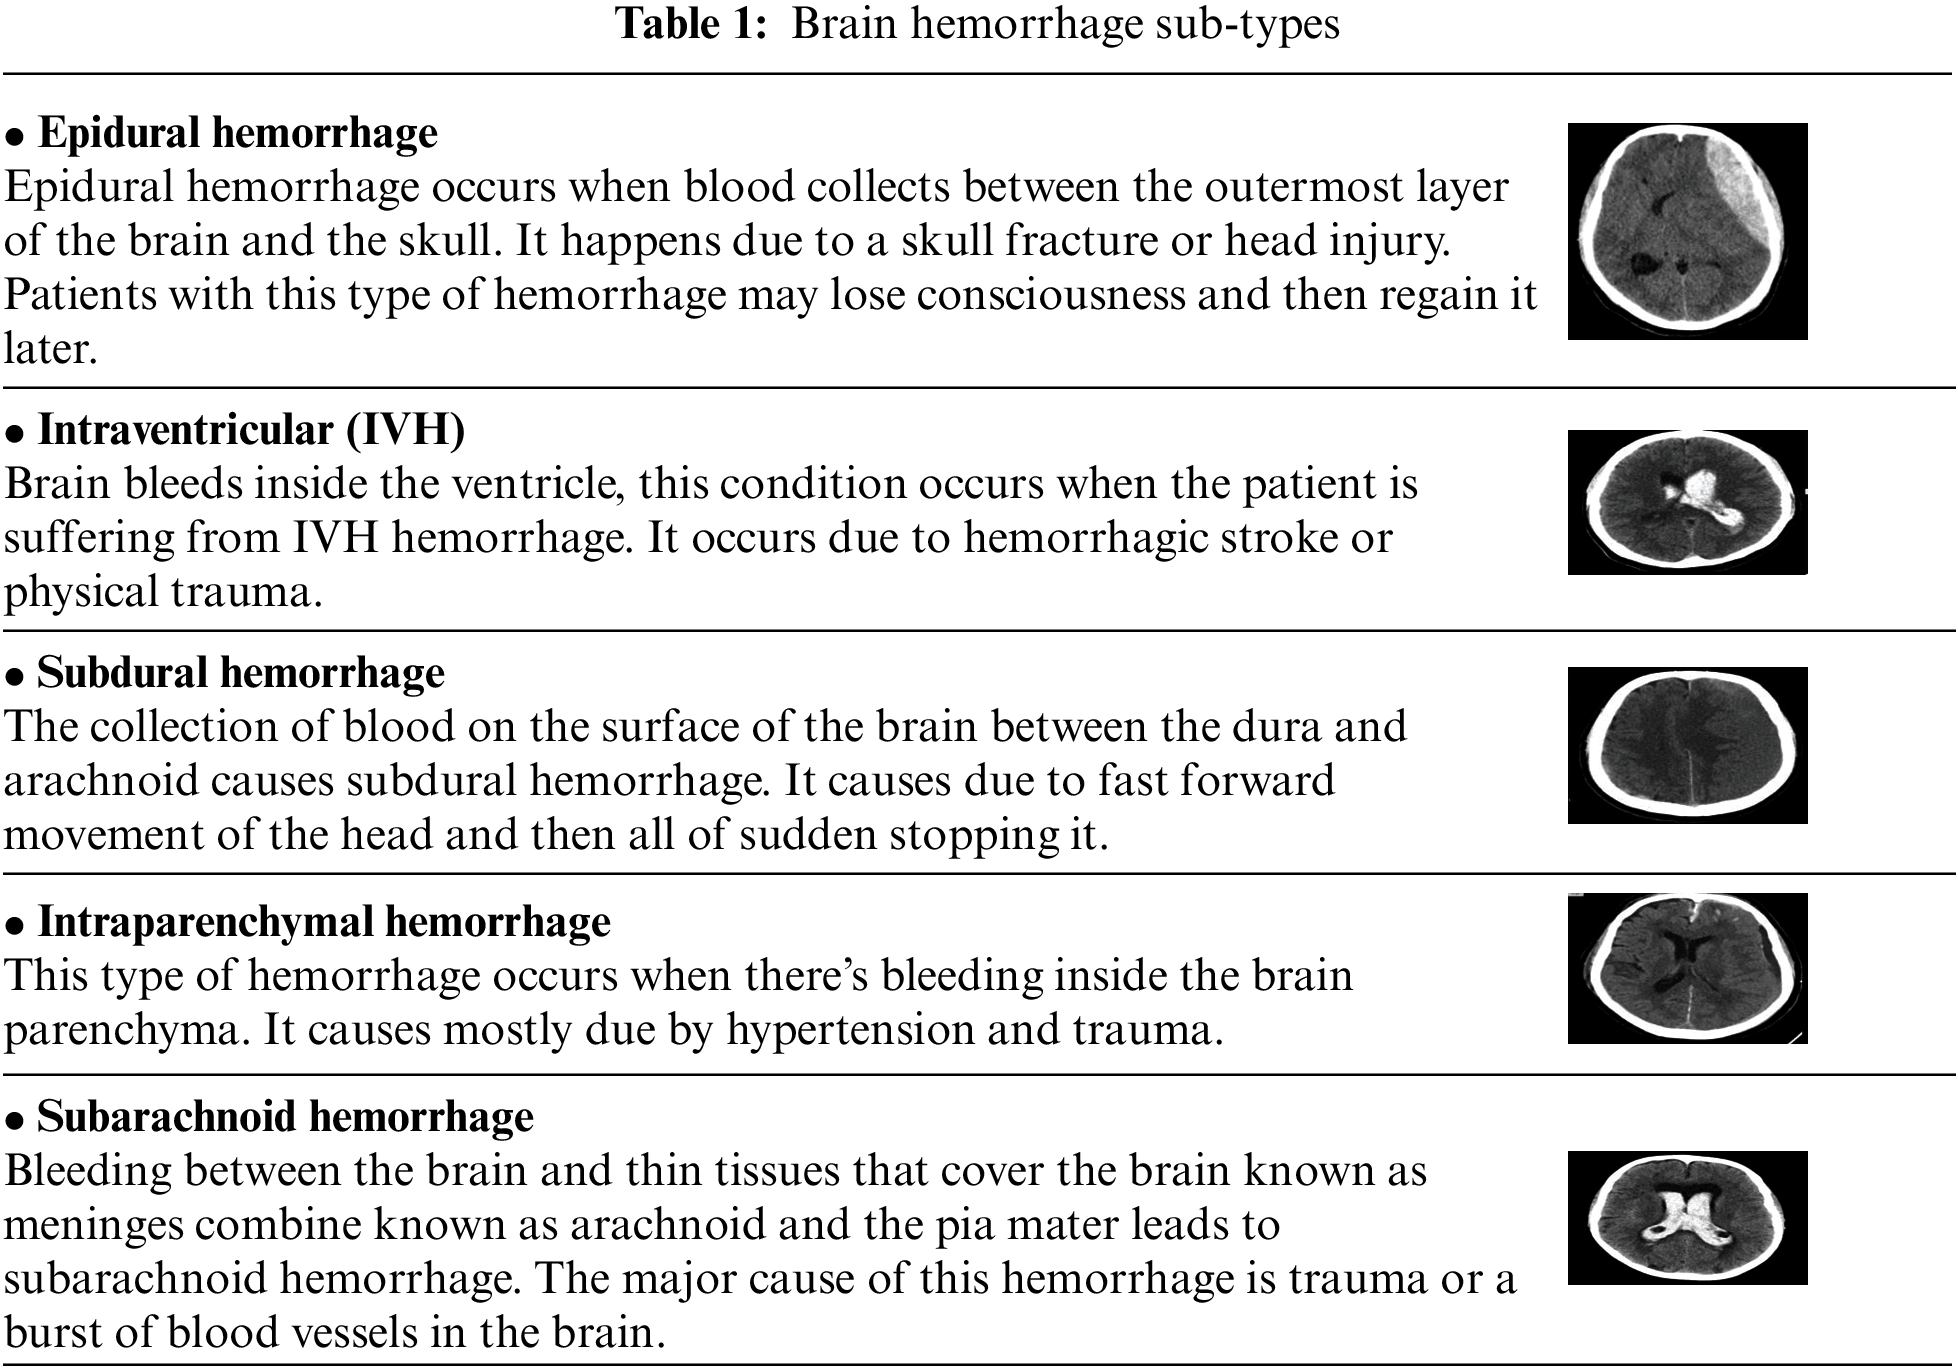
In each application field, machine-learning (ML) technologies have tumbled down and healthcare is not far behind. The realization that using these strategies may assist greatly in obtaining valuable insights into a medical domain that is tough to decrypt with a specialist, is what helps a lot of medical and non-medical staff. Deep learning has the ability to change the future of health services with successful trials and novel applications. In the span of medical treatment, every item from fundamental patient records to x-ray or computed tomography (CT) scans has progressed in obtaining and preserving data [1]. The CT scan is faster and gives a pictorial view of organs, and skeletal structure and the machine learning techniques may catch minute disparities that can be overlooked by the human eye. Brain imaging is one application that uses deep neural networks (DNNs) and ML algorithms to detect numerous significant head injuries, which can in turn cause brain damage if not properly treated. An intracranial hemorrhage (ICH) is a form of bleeding that occurs in the headache that is responsible for a number of different causes from head trauma, blockage of the artery, cerebral aneurysm, malformations of arteries or venous tract, bleeding tumors, illegitimate medicines, hypertension and disorders of blood clotting [2]. The neurosurgeon detects hemorrhage and identifies the subtype of hemorrhage, depending on where the bleeding is located inside the brain. In the computing tomography (CT), the bleeding looks intense (white), the important elements to determine the hemorrhage may be taken and its subspecies can rely on location, form and vicinity [3]. Brain hemorrhage occurs due to the increase of blood flow in the brain or skull suddenly. A sudden blow can also lead to brain hemorrhage. Eventually, transfer learning has also a great impact on the world through their great performance. We aim to use transfer learning to classify hemorrhage types. Before getting into hemorrhage classification, we need to know about hemorrhage types. The term used for bleeding in the skull is known as intracranial hemorrhage (ICH), which is further divided into five subtypes shown in Table 1 [4,5].
Nowadays, machine learning and deep learning techniques are helpful for the detection and classification of brain hemorrhage [6–8]. Several machine learning techniques and deep learning have gained attention for the segmentation and classification of a brain hemorrhage in recent years. Convolutional Neural Networks (CNNs) are very reliable and efficient, thus giving much support in the medical field. CNNs types are very helpful in detecting brain hemorrhage and for this purpose Inception- Residual Neural Network (ResNet), Yann LeCun’s Le-Network, Google-Network (GoogleNet), and U-Network (U-Net) are used. Getting an accurate prediction of a brain hemorrhage, has become a popular topic in the medical research field. For this purpose, several algorithms and neural networks are in progress.
Image processing is a way to improve image quality in various applications and domains after extracting irrelevant image data from the image. Even medical images contain many parts of the scanned image in its present format, which are irrelevant and unwanted. Some techniques of picture pre-processing are required to remove certain irritating sections so that pictures are viewed correctly until the diseases are found. The major aim is to apply pre-processing techniques to prepare the photos and to improve image accuracy. Noise reduction and filtering algorithms help in improving the quality of the image. The pixel intensity and picture quality improvements were performed after preprocessing. After preprocessing, image quality is increased [9]. Low-level image processing is utilized for contrast improvement and noise reduction, threshold segmentation, gradient, area and mid-level image processing techniques [10].
Training data is the assumption of conventional methods of machine learning and test data gathered from the same field, such that the space input function and data distribution features are identical. However, in certain real-world learning circumstances, this assertion does not apply. There are occasions when it is expensive or difficult to receive training information. High-performance learners educated with data from different areas require this to be created more readily, this strategy is called transfer learning [11]. The main contributions are as follows:
1. Proposed novel classification technique using transfer learning to classify brain hemorrhage and its types.
2. Use two different datasets RSNA and PhysioNet dataset for two different techniques by proposing a novel algorithm.
3. Proposed techniques will help medical professionals for early diagnosis of brain hemorrhage and calculations of volume.
The rest of the paper is organized in the upcoming sections. The next section presents the related work to provide the background of the research. Section 3 describes the materials and methods used to achieve the results. The results are discussed in Section 4 and the last section presents the conclusion for future work.
Several techniques of deep learning, machine learning, and image processing are available for brain hemorrhage detection and classification. Some image processing techniques involve preprocessing, color filtering, median filtering, segmentation and feature extraction, etc. Deep learning techniques cover CNN architectures, UNet, Alex Network (Alex-Net), recurrent neural network (RNN), fully connected neural networks (FCNNs) etc. Support vector machine (SVM), random forests and other machine learning models are also used for the detection of hemorrhage.
In the previous studies, Bhadauria et al. proposed different segmentation techniques to detect brain hemorrhage from CT scan images. The methods used are region growing, thresholding, active contour, and fuzzy clustering. Dataset collected from GE medical systems. The last technique was the active contour method, which provides better results in accuracy than other approaches. Its performance depends upon con-tour initialization and propagation controlling parameters [12]. In another study in 2017, Hidayatullah et al. aimed to detect cerebral hemorrhage by segmenting CT scan images. The major goal for this paper was to achieve higher accuracy by the image segmentation technique of brain bleeding. Pre-processing techniques like erosion, filtering, and dilation method were performed on CT scan images. In the last step, the authors calculate the percentage volume and area of bleeding in the brain. The bleeding areas and percentage of bleeding area’s average error were 11.17% and 1.13% respectively [13].
Furthermore, Lee et al. worked on detecting ICH and classifying its five subtypes from CT scan images. A minimal dataset consists of a few cases less than 1000 or 904 cases to build their model. In 2018, Algorithm development helps build a variety of clinical applications, which used deep learning systems [14]. In past 2019, Ye et al. developed a novel technique comprised of a combination of 3-Dimensional CNN-RNN for detecting intracranial hemorrhage (ICH) and its types, i.e., intraparenchymal hemorrhage (IPH), intraventricular hemorrhage (IVH), subdural hematoma (SDH), subarachnoid hemorrhage (SAH), and epidural hematoma (EDH) in CT scan images. They collected data from three institutions, 2836 subjects. 90% of data was used for training, and 10% for testing. Proposed framework CNN-RNN used for classification. For the prediction of bleeding or not, they achieved accuracy above 98% for the detection of hemorrhage, and for hemorrhage subtypes classification, their algorithm achieved accuracy greater than 80% [15]. Furthermore, Okashi et al. implement an ensemble-learning approach to identify hemorrhage from MRI images. They developed an intelligent and automatic model that can show an axial view of the MRI of the affected area in the brain, which helps the doctors make decisions. The boosting algorithm performed feature texture analysis and achieved an accuracy of 89.2% in detecting affected brain areas [16]. Similarly, another author Ginat reveals the detection of intracranial hemorrhage. Non-contrast computerized tomography (NCCT) scan by neural network and achieved an accuracy of 96.5% in 2019, and their study helps in optimizing artificial intelligence clinical workflow [17].
Togacar et al. used the AlexNet convolutional neural network to detect brain hemorrhage using CT scan images. Cerebral hemorrhage is classified using a dataset, restructured with the “Auto-Encoder Network Model” and generates a heat map of every image to improve the classification. Data augmentation was applied to increase images ten times. SVM helps in performing classification. They achieved an accuracy of 98.57% by using this technique [18]. In 2020, another study by Li et al. introduced U-Net architecture for detecting and segmenting the hemorrhage region in CT scan of the brain and used two different datasets to achieve an accuracy of 0.9859. The reported model detects lesion hemorrhage and introduces a tool, which helps in stroke diagnosis [19]. Recent studies by Hssayeni et al. reveal that they developed a protocol and collected a dataset of 82 CT scans with traumatic brain injury because they detected a brain hemorrhage type caused by traumatic brain injury known as intracranial hemorrhage (ICH). The authors used Physio Net dataset for comparisons and analysis purposes. Deep fully convolutional neural networks (FCNs), known as U-Net, automatically segment ICT regions from CT scan images. Five-fold cross-validations used and achieved a dice coefficient of 0.31 [1].
Furthermore, Efficient Net architecture was suggested Chaudhary and Prasad using Group Normalization rather than Batch Normalization for the classification of hemorrhage. They proposed another Model called U Net for the detection of hemorrhage regions using the segmentation technique. They used two different datasets for performing these tasks. Their evaluation criterion of model and segmentation is loss function and extracting hemorrhage region respectively [20]. A review of the literature undertaken by Rane and War-hade introduces deep learning approaches in 2021 to detect hemorrhage and its subtypes. They used the RSNA dataset that is publicly available on Kaggle. They preprocess digital imaging and communications in medicine (DICOM) images before feeding them to the network. They perform transfer learning to detect hemorrhage subtypes. Their evaluation metrics are loss functions. They used visual geometry group-16 (VGG-16) and the performance of the model was evaluated based on the receiver operating characteristic-area under the curve (ROC-AUC) curve [21]. The study reveals that Lee et al. proposed a deep learning algorithm for artificial neural network (ANN) to detect ICH hemorrhage and its subtype’s classification but without using CNN. They used a Computed Tomography dataset. Their evaluation metrics are ROC-AUC curve, sensitivity and specificity. They use a fully automated approach and achieve results of 0.859%, 78.0%, and 80.0% respectively [22].
Group of authors Wang et al. proposed a modified U-Net, which is a semi-supervised attention model to segment CT scan images. They use 80% training data and the model gives a 0.67 Dice coefficient value, while previously 0.61 dice coefficient value was achieved by the supervised model. They used a small-labeled dataset and a large unlabeled dataset. Pre-trained U-Net model and supervised version of the segmentation model was tested and trained regardless of the size of the data [23]. Dawud et al. presented an approach to detect the hemorrhage at its early stage, which was a difficult task and achieved this solution using CNN, AlexNet Neural Network, and a combination of AlexNet and SVM, i.e., (AlexNet-SVM). In 2019, they classified brain hemorrhage images from non-hemorrhage images using brain CT scan images. The authors compared three DNNs: Neural Network from scratch, pertained model, and AlexNet-SVM. The same numbers of CT images were used for all of these networks. After comparing and analyzing their results, “AlexNet-SVM” performs best among these three Networks; “AlexNet-SVM” achieved an accuracy of 93.48% [24]. Furthermore, Li et al. proposed a deep learning framework called U-Net for the detection of brain hemorrhage from CT scan brain images. Data augmentation and normalization were performed on data before feeding it to the model. U-Net helps to get the hemorrhage lesions with low contrast. For the improvement of accuracy in segmentation, U-Net trained so aggressively. Results proved that the U-Net model has more advantages over the human diagnosis of hemorrhage. They achieve an accuracy of 0.9859 for detection of hemorrhage, 0.6919 intersections over union (IOU) for segmentation and 0.8033 dice coefficient value [25]. Like previous studies, Chen et al. introduce a novel brain hemorrhage detection system, which is based on the Internet of Things (IoT). Automatic detection of brain hemorrhage is a difficult task, which may result in long-term injury or death. They use SVM and FNN in their system and achieve accuracy of 80.67% and 86.7% respectively. FNN outperforms the SVM, which can later use in the future to enhance the research perceptive [26]. Lewicki et al. developed a model based on CT scans. Dataset used by them was RSNA. The huge dataset consists of 752803 images used to train the model. They preprocess these images, which were initially in DICOM format. They use CNN based on ResNet for classification. The weighted loss function is used to train the model; they achieve an accuracy of 93.3% per image [27]. Zhang et al. presents a method by replacing position-sensitive region of interest (PS-RoI) pooling with position-sensitive precise region of interest (PS-Pr-RoI) pooling, which avoids coordinate quantization and directly calculates two-order integrals for position-sensitive score maps, the presented technique improves detection accuracy and eliminates localization misalignment. The results revealed a 3.7 percent boost in accuracy for object identification tasks and a 6.0 percent increase for tiny items [28]. Wang et al. to adapt decrease latency and cost, and propose the enhanced information multiple distillations networks (EIMDN). When compared to existing lightweight super-resolution methods, experimental findings reveal that our suggested method achieves quicker convergence with fewer parameters and processing. The performance of network reconstruction picture texture and target contour is greatly increased when the peak signal-to-noise ratio (PSNR) and structural similarity (SSIM) is better [29]. Jauludgeludge and Reservoir describe how reservoir computing characteristics may be used to standard forecasting techniques to expedite the learning process, as well as a new methodology that allows hardware implementation of typical machine learning algorithms feasible in electrical and photonic systems [30]. Khushi et al. discover the best imbalance strategies suited for medical datasets, this study compares the performance of 23 class imbalance methods (resampling and hybrid systems) with three traditional classifiers (logistic regression, random forest, and linear support vector classifier SVC) [31]. Srinivas et al., compare the performance of CNN-pretrained transfer learning-based VGG-16, ResNet-50, and Inception-v3 models for automated prediction of tumor cells in the brain. Pretrained models are presented using a dataset of 233 MRI brain tumor pictures. The purpose of this work is to use the VGG-16 pretrained CNN model to detect brain cancers. The correctness of our model’s performance will be assessed. As a consequence, we may estimate that the pre-trained model VGG-16 produces extremely sufficient results with an improvement in training and validation accuracy [32]. Tharek et al., introduced a model without any adjustment, the deep learning model for cerebral hemorrhage classification based on ResNexT architecture demonstrated detection accuracy of more than 0.81 for every category of bleeding [33].
This section is describing the two different types of datasets used for the experiments of the proposed methodologies for classification and the overall methodology of volume calculation of brain hemorrhage.
The accurate diagnosis of brain hemorrhage is an important task in the research of the medical field. The goal of this research is to resolve the issue of misdiagnosis of hemorrhage when symptoms are severe like loss of consciousness or headaches. Using the transfer-learning approach, we intend to create a model that can detect brain hemorrhages and classify them into five sub-types. Knowing where the hemorrhage is located accurately can be beneficial to performing volume analysis on the hemorrhage region using pure image processing techniques. Volume indicates the depth of hemorrhage in the brain. As a result, we will get probabilities of hemorrhage classification using transfer learning and volume of hemorrhage using image processing on CT scan image slices. To make our work unique we use two different datasets. One is used for classification and the other is used for volume calculation.
3.2 RSNA Intracranial Hemorrhage Detection
RSNA dataset is publicly available on Kaggle specially designed for a challenge in 2019 to detect hemorrhage and its types. This dataset is quite large having a size of 427 GB. Processing large data on local machines is very difficult. Therefore, we also utilize Kaggle, which provides a useful platform to process this data. It gives a 16 GB GPU facility to train and process our model. This dataset consists of CT scan images among which most of the patient’s data is normal or without hemorrhage few suspected with hemorrhage, (0, represents normal and 1, represents hemorrhage patient’s data). The dataset contains the metadata of images in DICOM format, which is known as digital imaging and communications in medicine. This format is used for medical images to get all the information regarding patients and images. This dataset has five major types of hemorrhages: IVH, IPH, EDH, SAH, SDH and any. Any sample image from training data is shown in Fig. 1a. After exploring images in the dataset, we got some samples from all types of hemorrhages shown in Figs. 1b–1d.
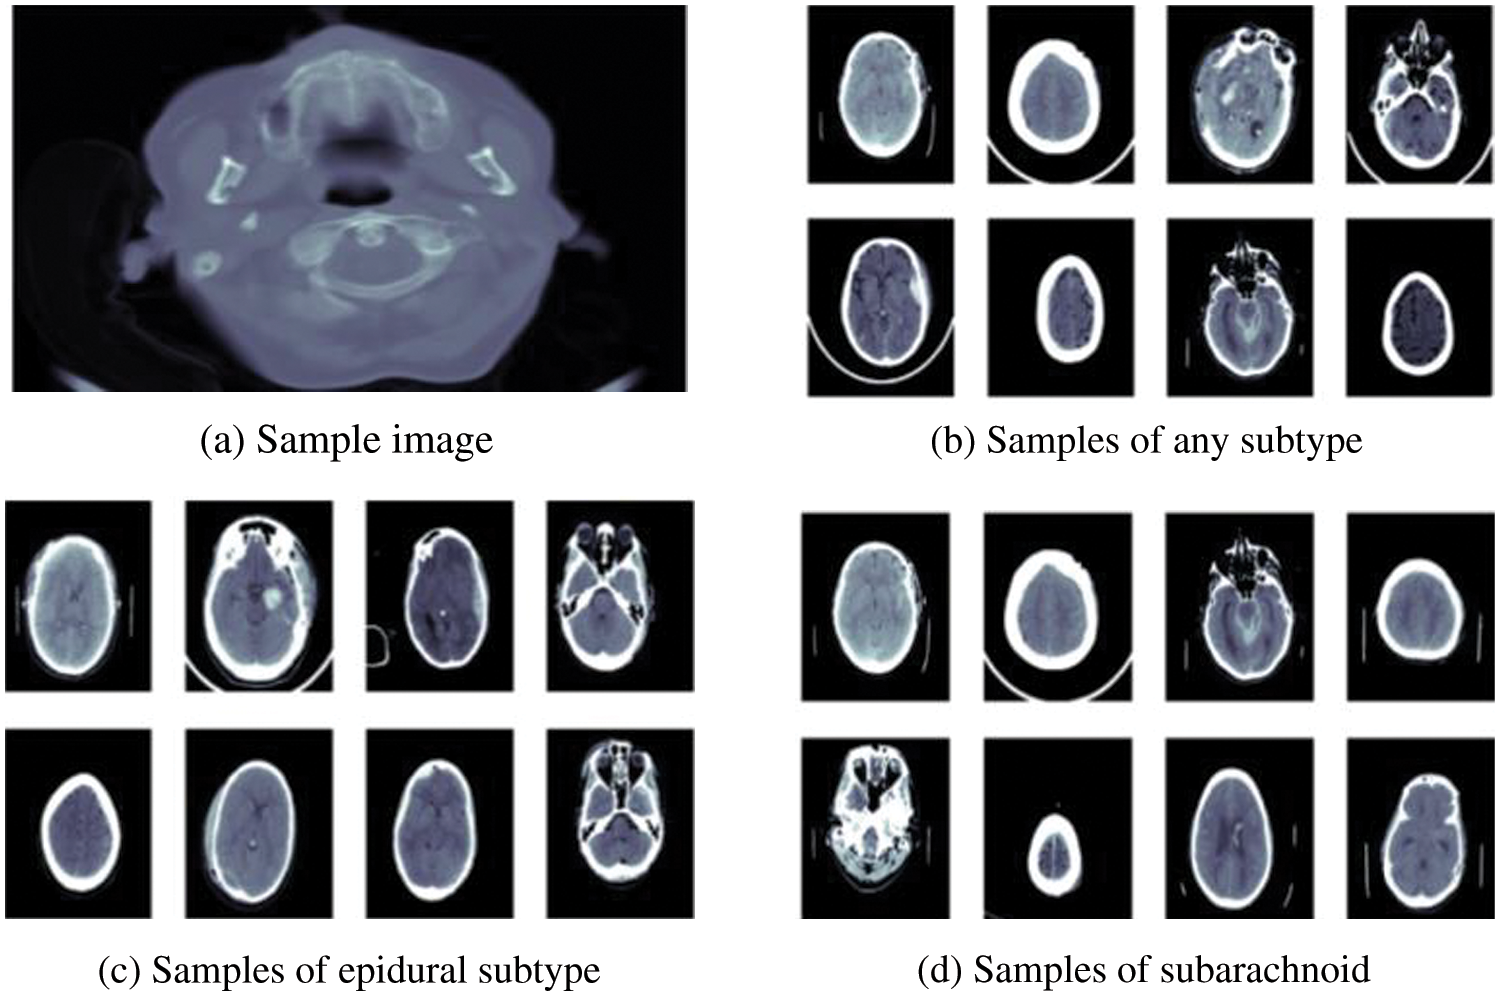
Figure 1: Sample of brain hemorrhages taken from RSNA dataset
3.3 Computed Tomography Images for ICH and Segmentation
The second dataset we used for volume calculation of hemorrhage region is the computed tomography dataset available at the physionet website. This dataset was created for segmentation purposes. Our concern for using this dataset is to utilize CT scan slices for hemorrhage volume calculation, as there are good quality CT scan slices, which were first stored in DICOM format, and later on, researchers converted those to .jpg format for ease us to calculate volume. Samples with complete 33 CT scan slices and only hemorrhage slices are shown in Figs. 2a and 2b respectively.
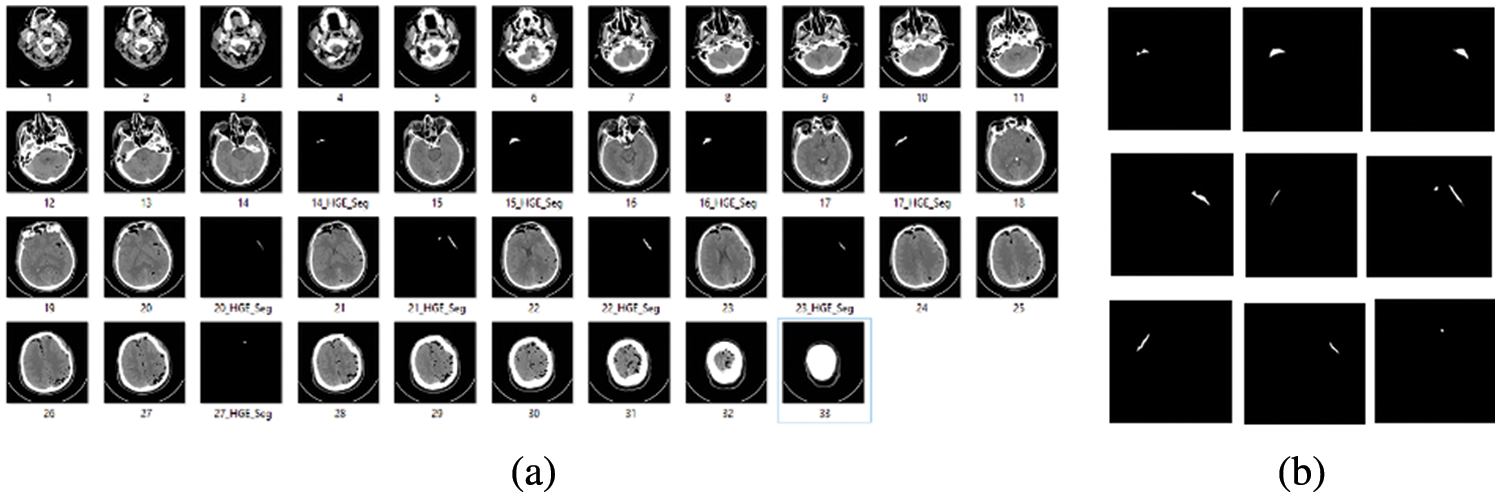
Figure 2: (a) Complete 33 CT scan slices (b) Hemorrhage slice
In this paper, the proposed methodology is based on two different approaches evaluated with various datasets discussed in the previous section to complete the brain hemorrhage classification and volume calculation tasks. The first dataset used is RSNA challenge 2019 for the classification of brain hemorrhage types and the second, is the Physionet dataset for volume calculation. In the first approach, the RSNA dataset is used and the preprocessing is applied before feeding it to the pre-trained model. In the proposed methodology, pre-trained Convolutional neural networks are used for feature extraction to detect the hemorrhage and then classify its subtypes. After classification, the second approach has been applied and took CT scan image slices from the second dataset to calculate the volume the of hemorrhage region. For this purpose, image-processing techniques are used to perform volume estimation. The proposed methodology for both approaches is illustrated in Figs. 3 and 4.

Figure 3: The proposed methodology for brain hemorrhage classification
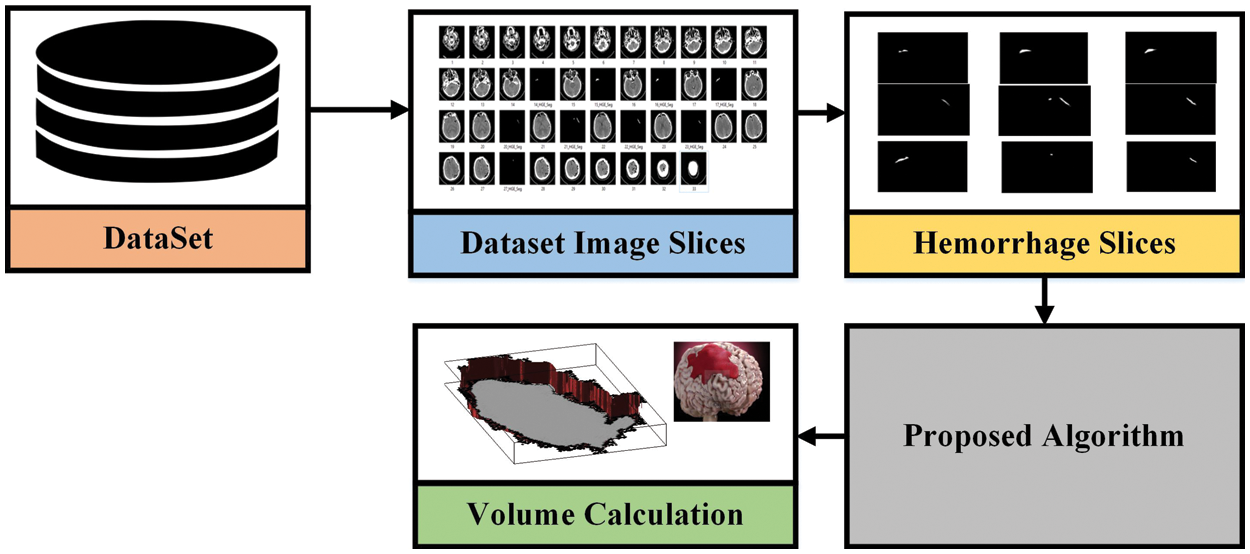
Figure 4: The proposed methodology for volume analysis
Inception Resnet V2 is a CNN, ImageNet repository used to train this model on millions of images. 164 layers deeper network provides facility to classify thousands of classes. Its input image size is 299 × 299 and as a result, we get class probabilities. Resnet 50 is a variation of the Resnet model that has 64 different kernel of size 7 × 7 and stride sizes of two. It is a CNN-type network consisting of 50 deep layers. ImageNet repository is used to train this model on millions of images. It can classify 1000 different classes.
3.5 Image Processing for Segmentation Volume Calculation
To calculate the volume estimation, the physionet dataset is used for experiments, which has approximately 33 CT Scan slices per patient. Slice thickness is 0.5 cm or 5 mm. The idea behind this is to calculate the total volume of hemorrhage. For this, we took data from one patient from a dataset consisting of 33 CT scan image slices and separated hemorrhage slices from the rest of the slices. The hemorrhage image is of black and white pixels and we need to be careful while performing calculations. The white area represents the hemorrhage region as shown in Fig. 4. After this, we have designed our algorithm to calculate the volume that is discussed in Fig. 5.
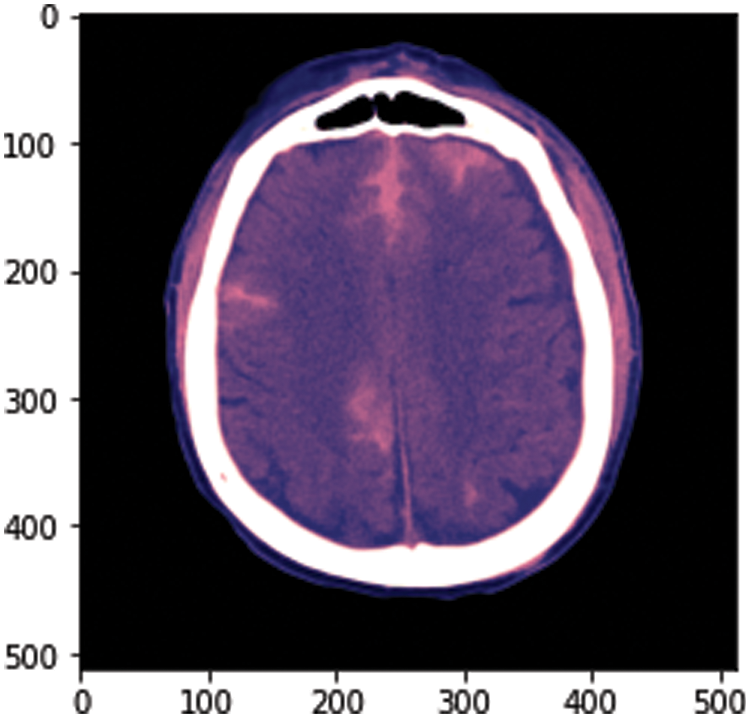
Figure 5: Sample image from the dataset
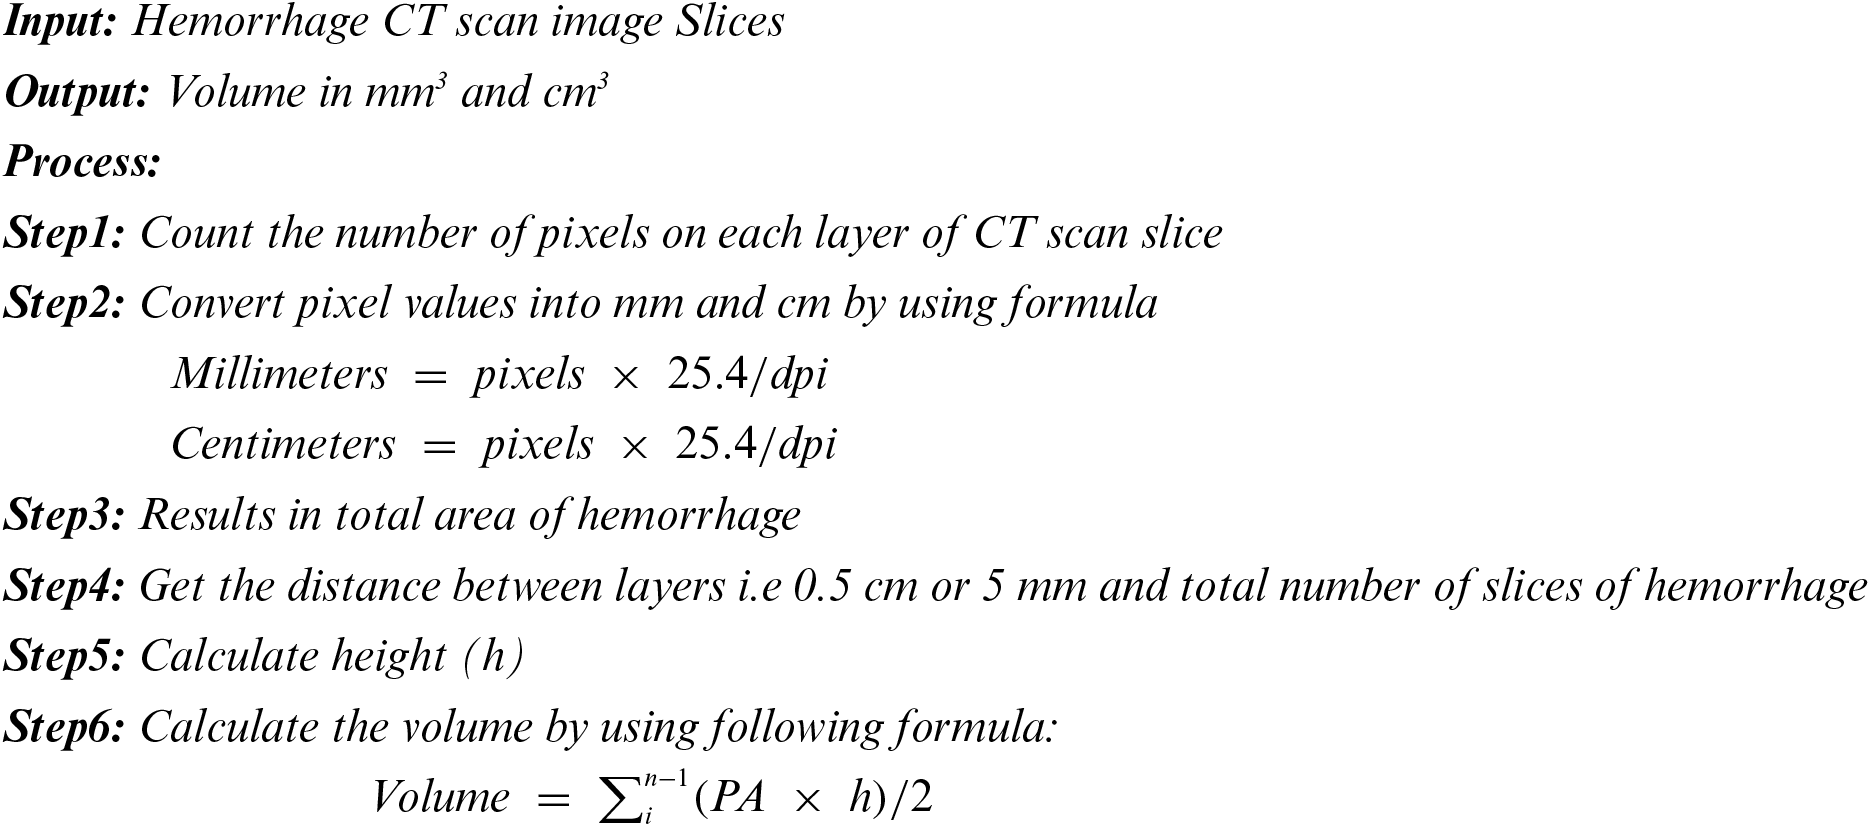
The volume of bleeding in the brain is to be calculated. It requires finding bleeding on each layer of the CT scan with hemorrhage. The thickness of each CT scan is 5 millimeters (mm) or 0.5 centimeters (cm) and there are 30 slices per image. For segmentation purposes, we consider hemorrhage image slices and run our algorithm on those slices. Workflow for volume calculation is depicted in Fig. 4. After getting hemorrhage CT slices, we performed some basic steps of the proposed algorithm to calculate hemorrhage volume. The pixel area (PA) represents the area in mm2 or cm2 in the proposed formula, where h is the height in mm or cm, n is the number of layers and i represents iteration from 1 to n-1.
In this section, we discussed the results as we have implemented our work in two different approaches. In the first approach, we have done classification by using transfer learning. We have used two pre-trained models Inception ResNetV2 and ResNet50 to extract the probability of all five subtypes present in the RSNA dataset, which is publicly available. In the second approach, volume is calculated using image processing MATLAB techniques. The proposed algorithm to calculate the volume of brain hemorrhage is given below:
At the start of this approach, we convert .dcm image to .png. The dataset RSNA has DICOM format images, which have metadata of images. There is an uneven distribution of data in the dataset. The major portion of the dataset includes the data of patients without hemorrhage. We have converted one image from .dcm to .png to show the sample image from our dataset and after converting, we got the result shown in Fig. 5.
4.1.1 Confusion Matrix for All Classes
We train our model on 10 epochs and achieved 93.7% accuracy. After training, we plot a confusion matrix for all types of hemorrhage and a universal type “any”. Multi-label confusion matrix (MLCM) is based on true negative, false negative, true positive and false positive which can be represented as MLCM (0, 0), MLCM (1, 0), MLCM (1, 1) and MLCM (0, 1). Multi-label confusion matrix returned in terms of unique labels y_true and y_pred. Confusion matrixes for all the types of hemorrhage are depicted in Figs. 6a–6f.
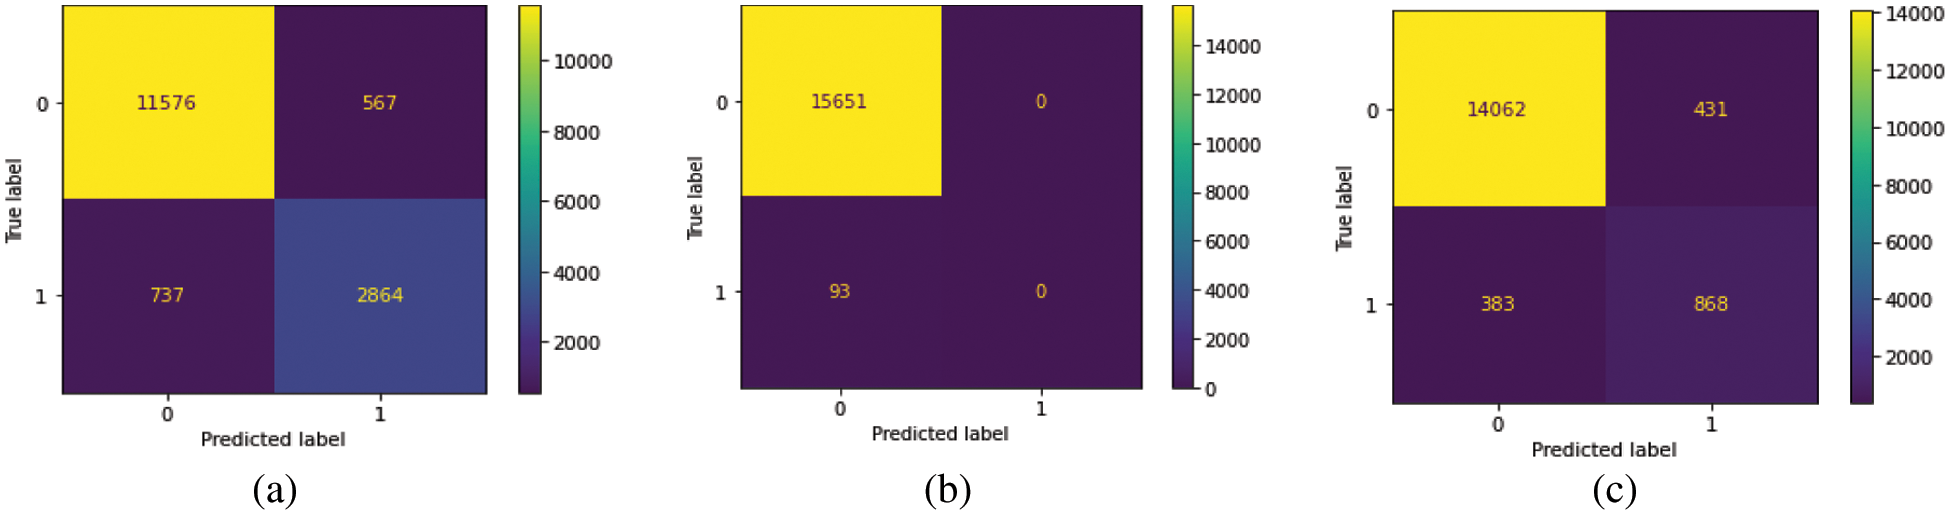
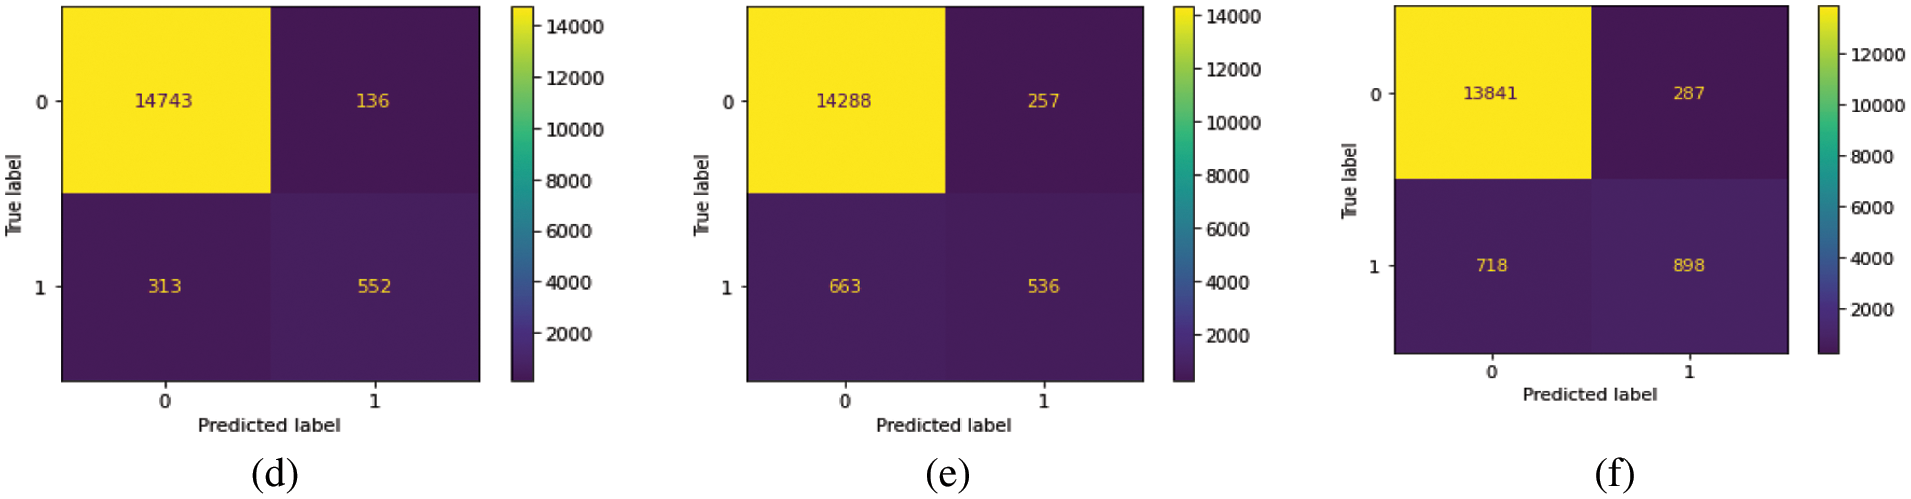
Figure 6: Confusion matrixes
4.1.2 Model Training and Results
We have trained our model on 10 epochs due to the limited resource of the graphics processing unit (GPU) available on Kaggle and achieved an accuracy of 93.77%. Metrics used to evaluate models are accuracy and loss. After this weighted loss value is saved after every epoch in model checkpoints. The weighted loss value after 10 epochs ends at 0.17454. Model accuracy and loss result for the last 4 epochs is shown in Table 2 and the model accuracy and loss graph is depicted in Figs. 7a and 7b.
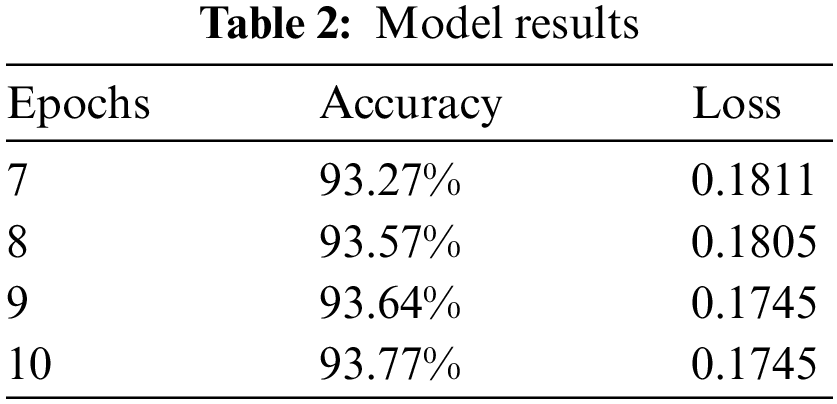
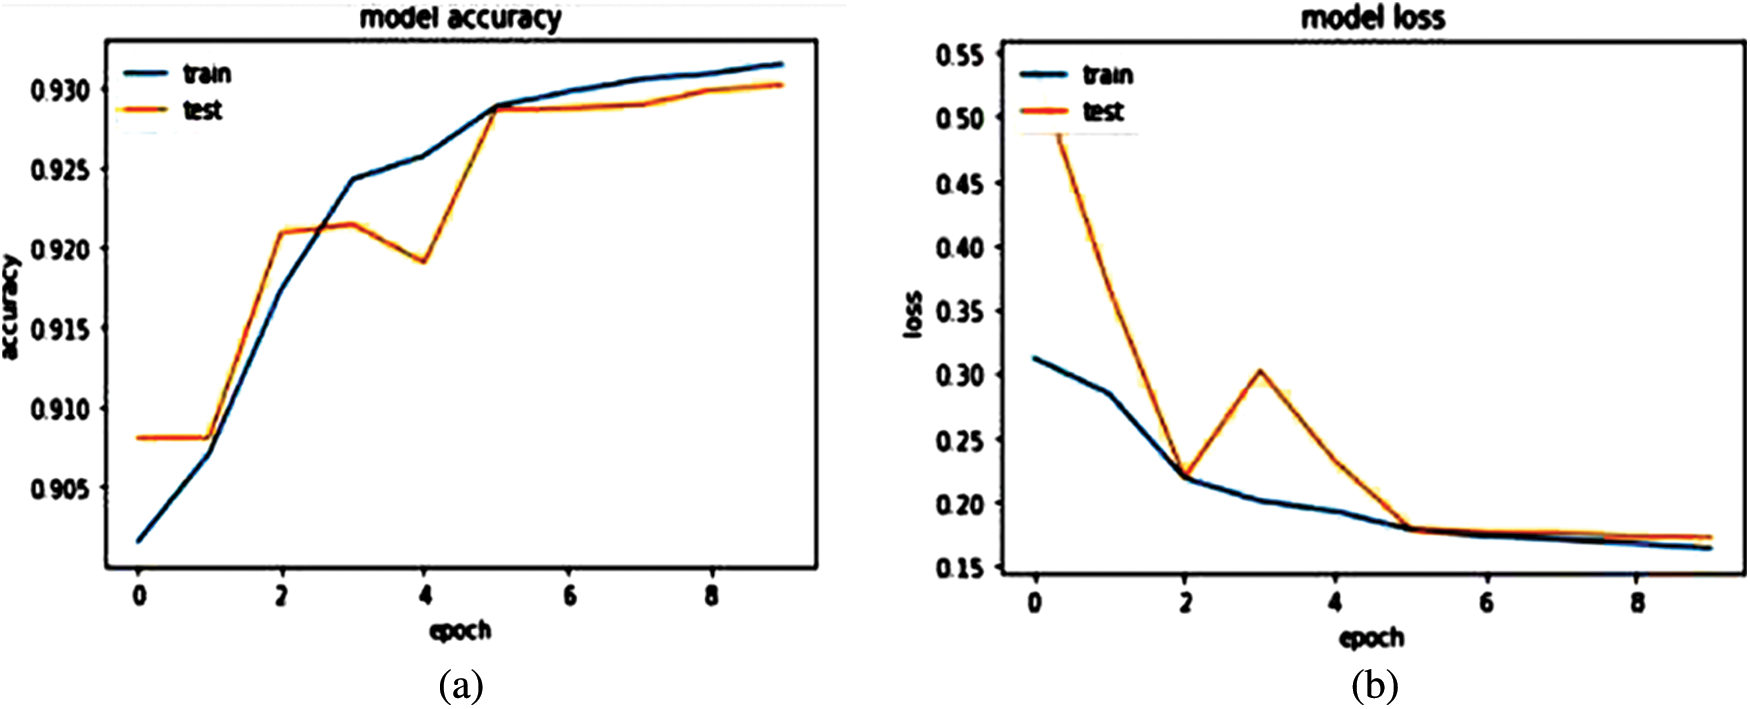
Figure 7: (a) Model accuracy (b) Model loss
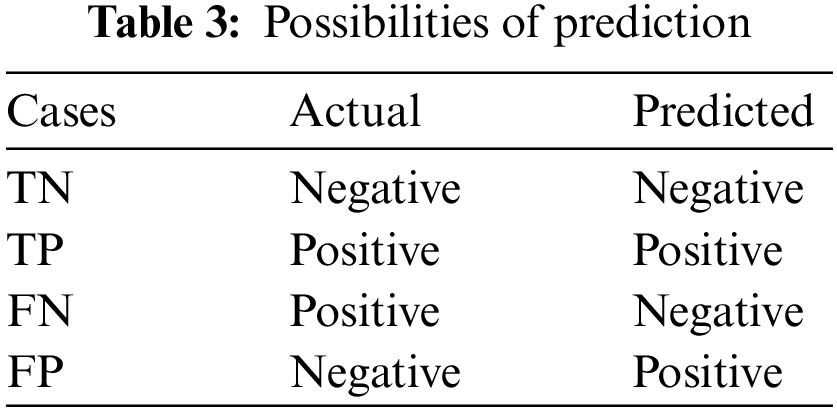
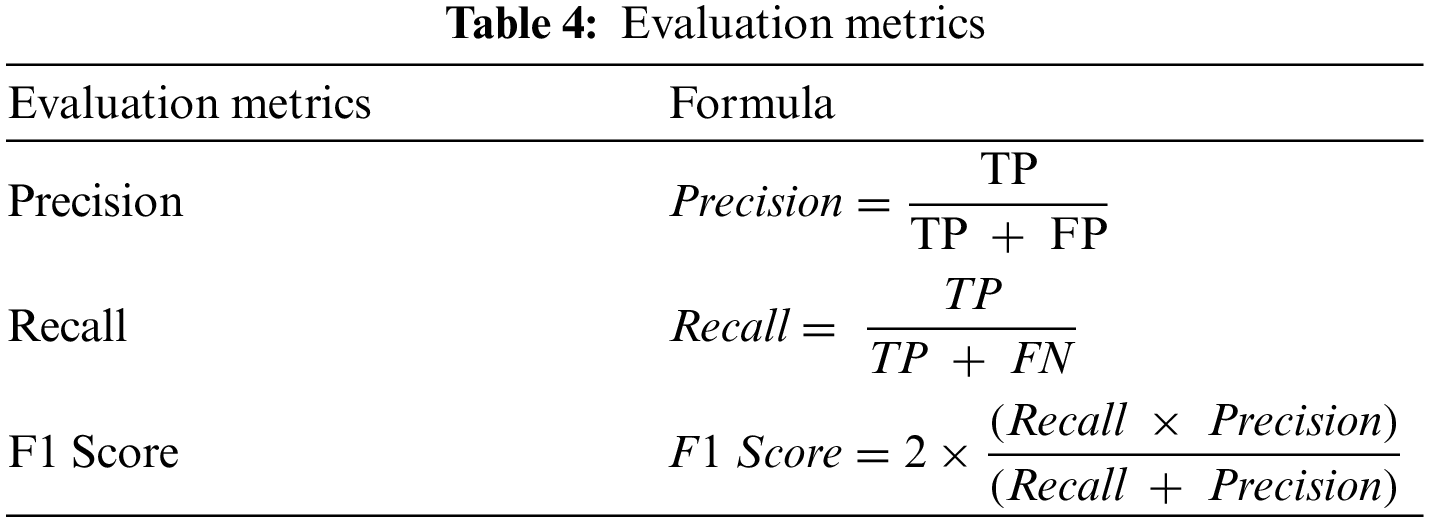
There is a total of four possibilities of our prediction shown in Table 3. Classification report includes precision, recall, F1-Score and calculated as Table 4.
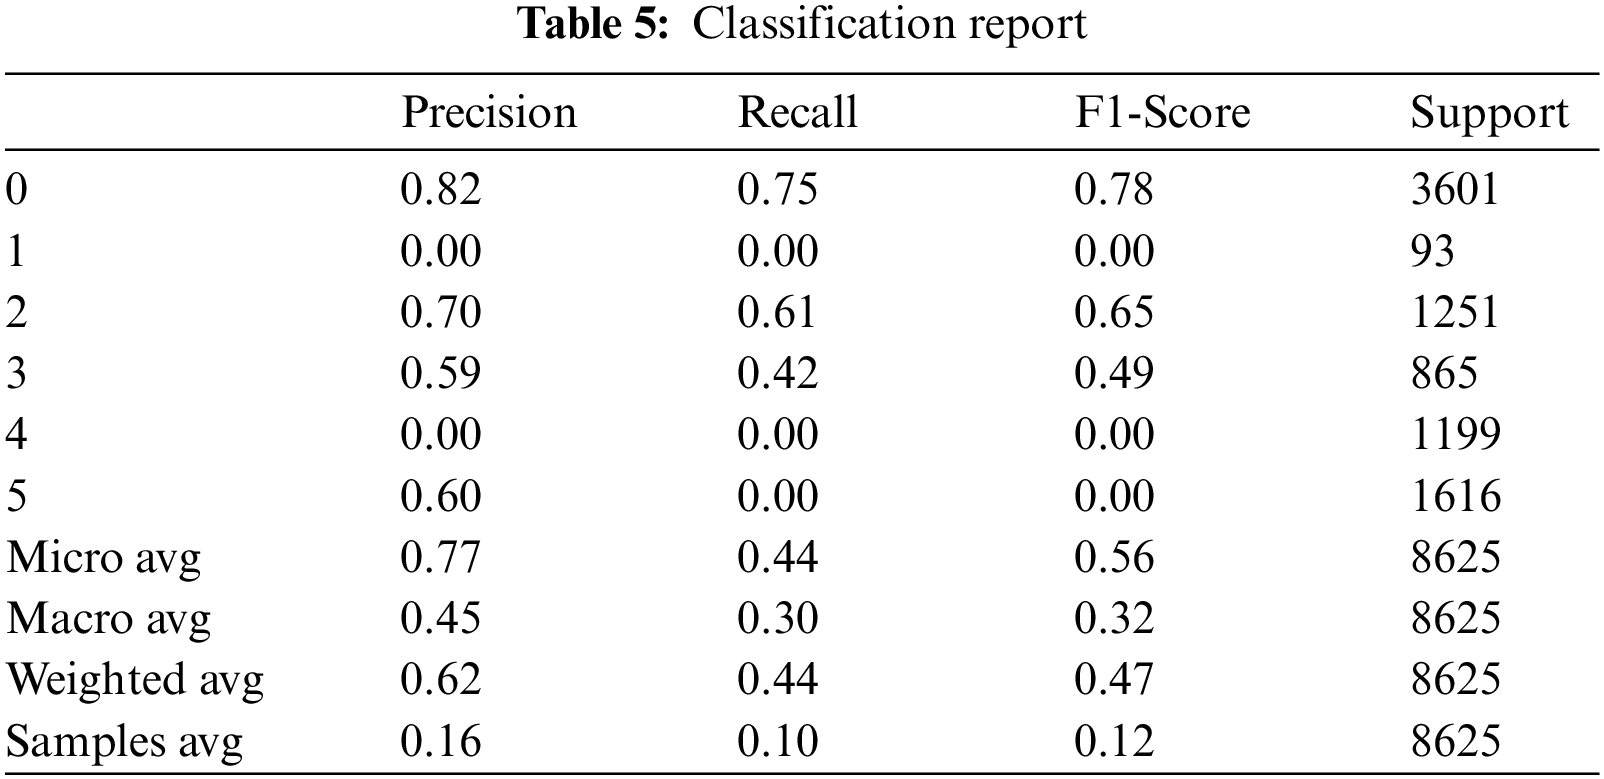
The support is the actual number of instances present in the dataset. Imbalanced support in the dataset may result in structured weakness. The classification performance of the proposed method is presented in Table 5.
As a result, we got comma-separated values (CSV) file having probabilities of hemorrhage against each ID shown in Fig. 8.
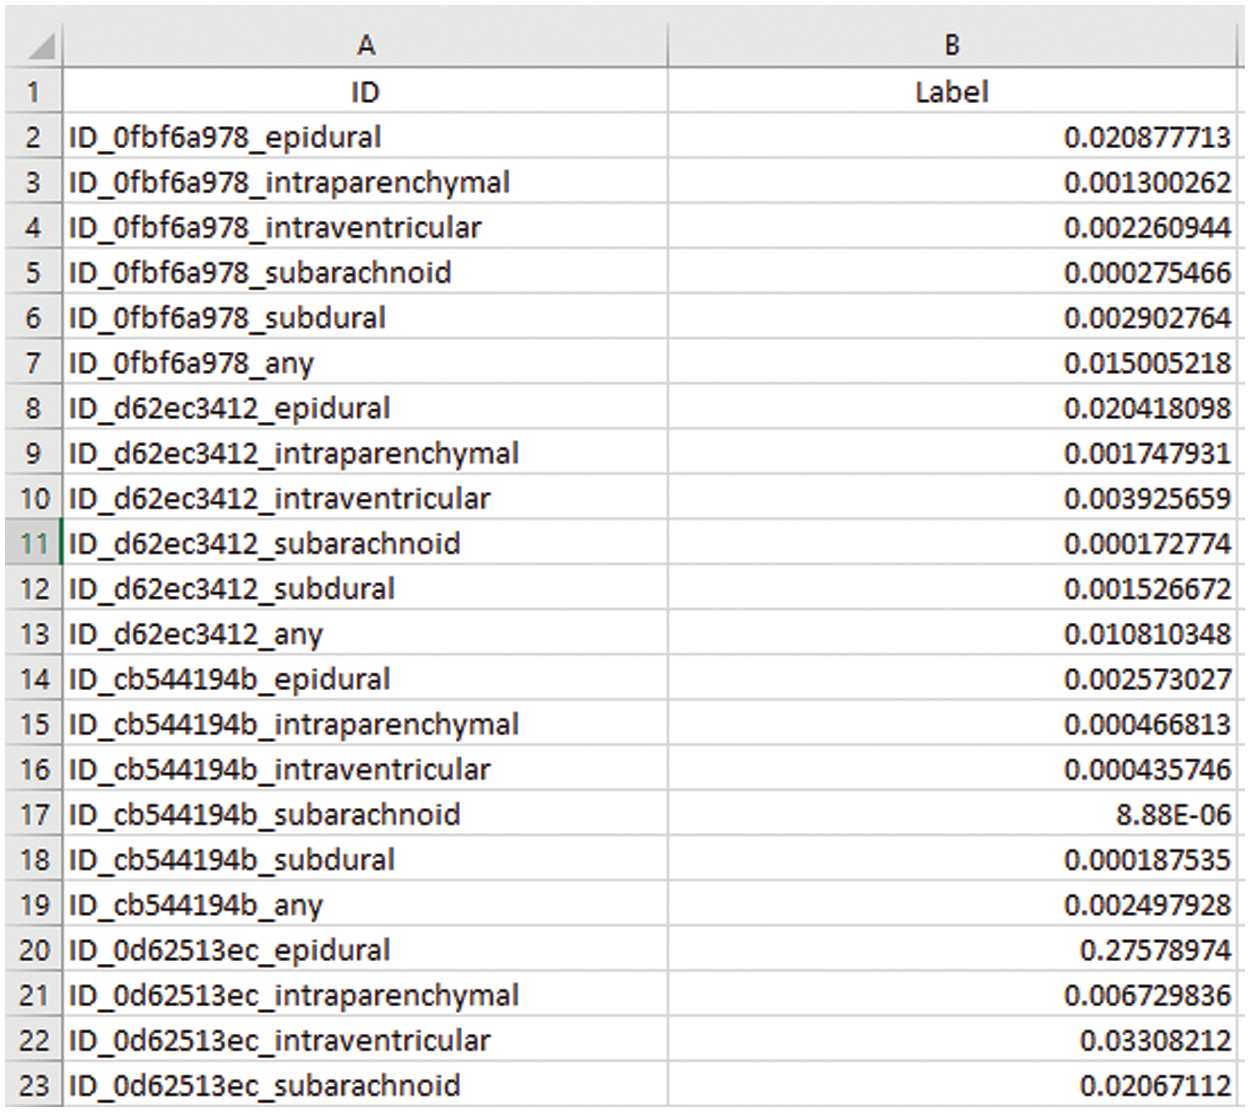
Figure 8: List of probabilities
Maximum Predicted Probability among all types is shown in Fig. 9.

Figure 9: Maximum probability
In approach II, we use the Physionet Computed Tomography dataset comprises of 82 CT scans. This data was previously in DICOM format and researchers convert it into jpg format each of size 650 × 650. There are a total of 30 slices of each patient and the slice thickness is about 5 mm or 0.5 cm. We have taken one patient data and run our algorithm on that data to calculate the depth of hemorrhage. Brain hemorrhage is a basically serious medical condition. If not treated timely it can lead to death. That’s why we designed an algorithm that calculates the hemorrhage volume in terms of its depth so that the patient could be treated timely. Volume is calculated in cm or mm depending on pixel values of the hemorrhage area. Sample slices of one patient are shown in Fig. 2a. According to our algorithm in the next step, we need to calculate the pixels of the brain hemorrhage area. We calculate the pixel values of white area hemorrhage image slices found in Fig. 2. Hemorrhage slices are depicted in Fig. 2b.
Volume Calculation
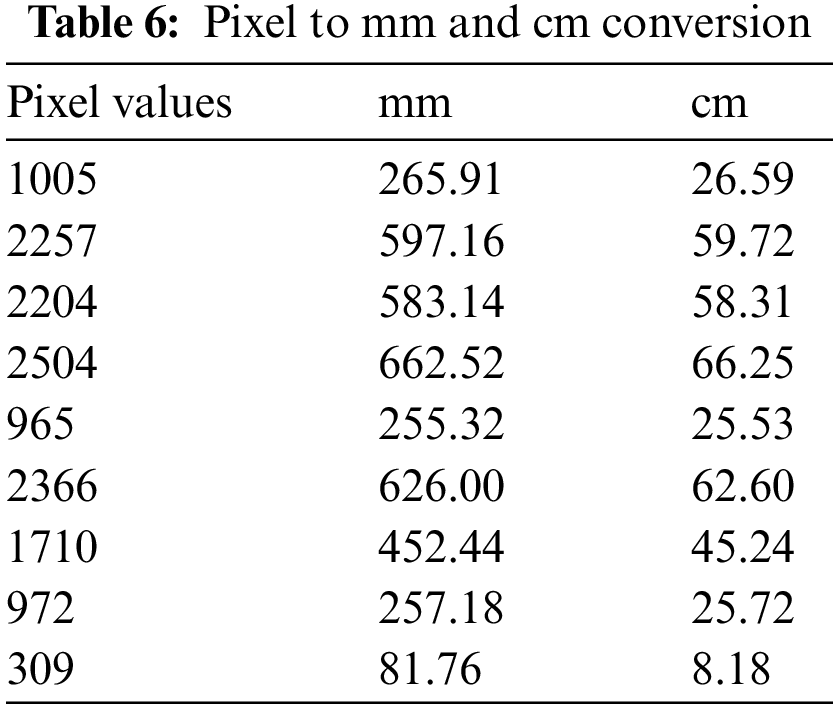
Volume is calculated in mm3 or cm3 using Eq. (1) and we are working on pixels of image slices to convert pixel values into mm or cm units. Conversion of pixel values is represented into mm and cm provided in Table 6.
To calculate the volume, the height (h) of CT scan slices can be measured in millimeters (mm) or centimeters (cm) which are calculated as follows:
Height = Slice thickness/CT scan slices
h = 0.56 mm h = 0.05 cm
Putting in formula, we get:
Volume of Hemorrhage in mm3 = 1035.91 mm3
Volume of Hemorrhage in cm3 = 9.25 cm3
Discussion:
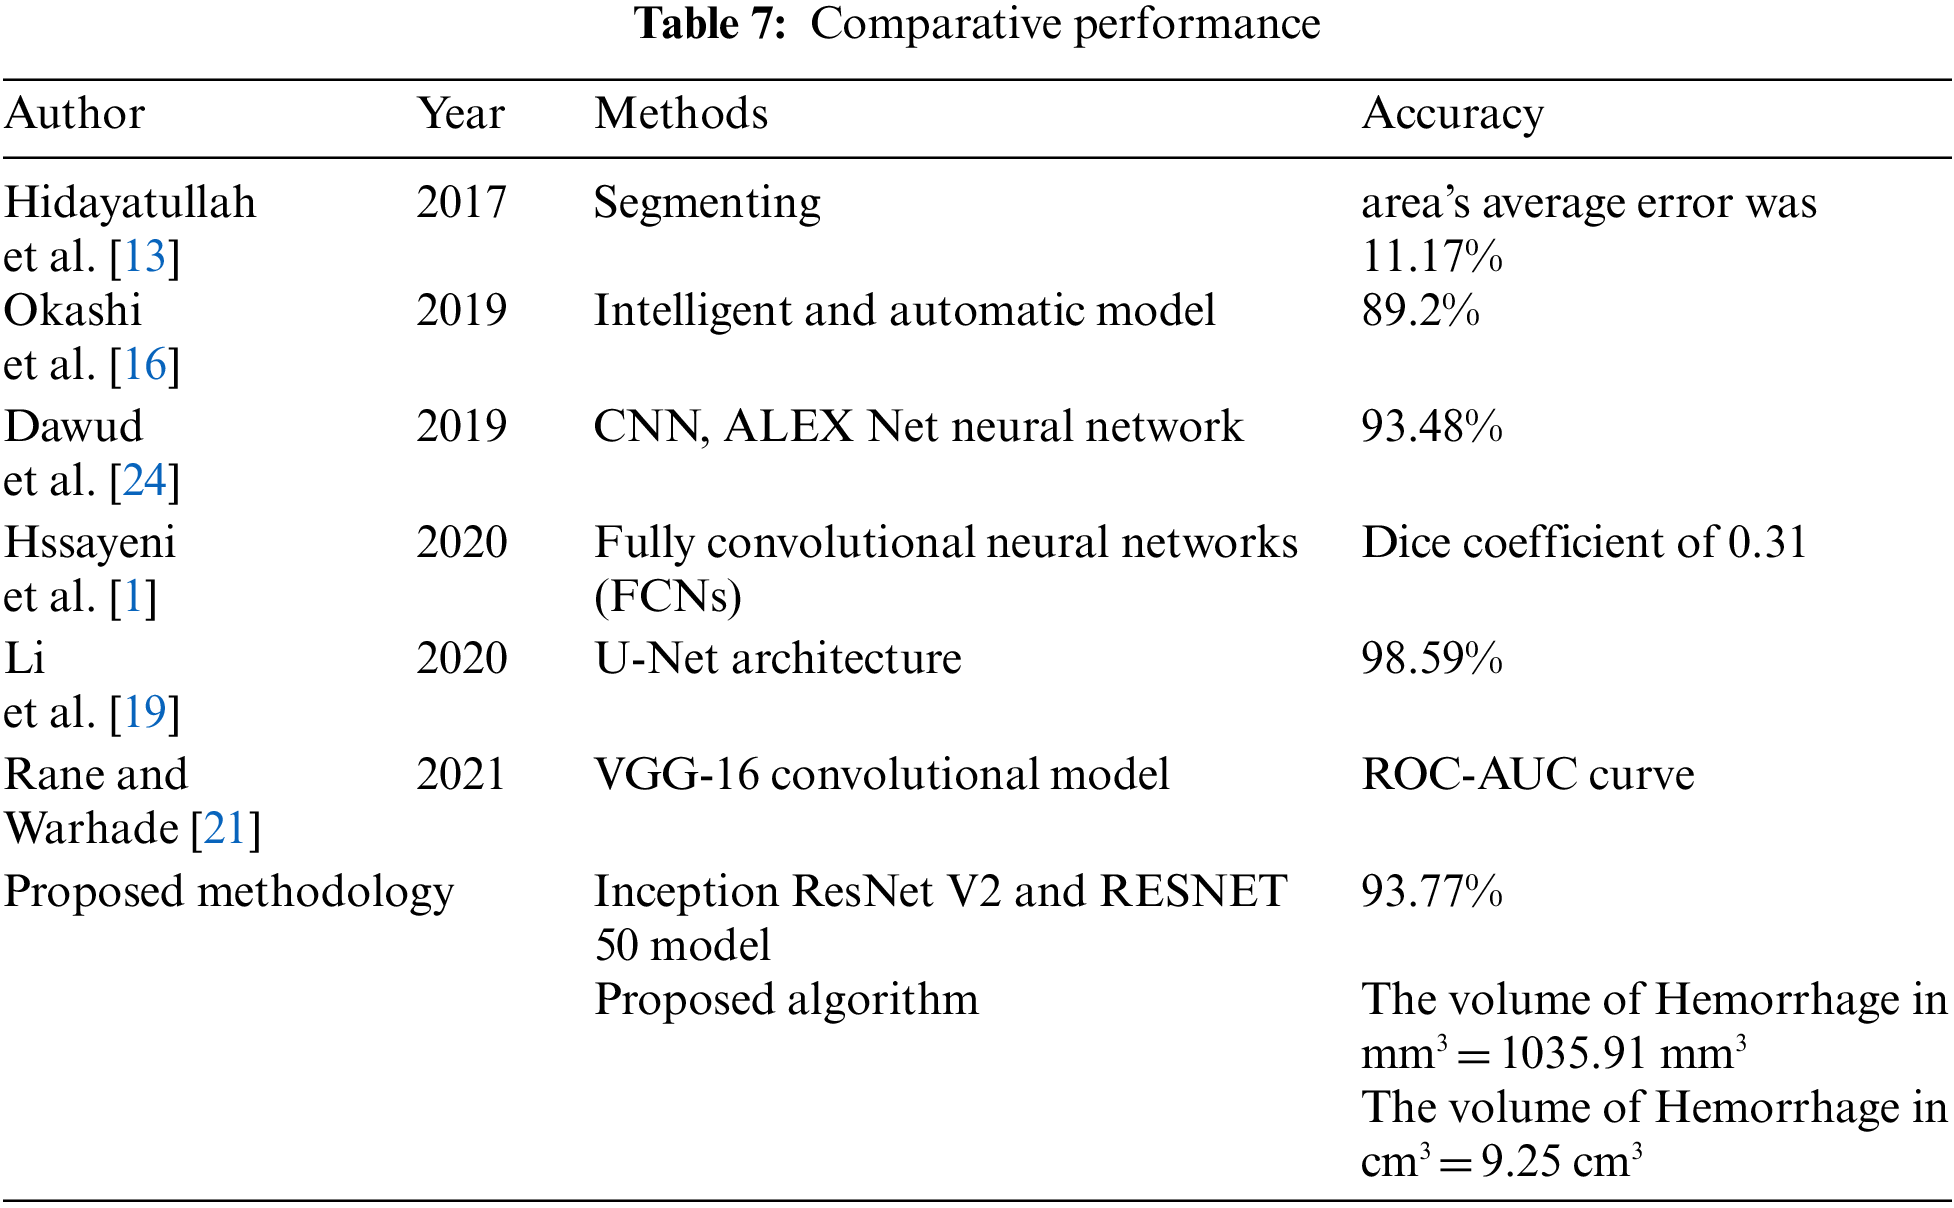
For volume calculation, we took 30 ICH CT scan slices of one patient from the Physionet Computed Tomography dataset to perform our calculations. The volume calculated is very close to the volume calculated by the physician manually. We have calculated the volume of bleeding in mm3 and cm3 as well. We have computed the height of slices and the area of slices to calculate volume. Our algorithm shows complete systematic guidance to calculate volume. Doctors calculated volume by using the ABC/2 formula for one slice; by following the same idea, we can calculate the depth of hemorrhage. We have calculated values after getting complete details of slices and CT scans from a doctor at a government hospital. The formula used by them is converted into ours for all the slices to calculate the total depth of hemorrhage. After that, we put the area and height in the formula to get the volume of brain hemorrhages 1035.91 in mm3 and 9.25 in cm3. Comparison of our technique with previous techniques are listed below: The Comparative performance of the proposed methodology is shown in Table 7.
Limitations:
There are some limitations of the RSNA dataset which is used in our research work is huge data and working on such a huge dataset is a challenging task. Training data has approximately 6.7% with hemorrhage label and the remaining is without hemorrhage, which has a great difference in values. Due to huge data, we use the Kaggle platform, which provides us the facility to train models using online GPU resources. However, it has limited access; it only provides 30 h per week. That is why we train our model on 10 epochs and achieved an accuracy of 93.77% and a loss value of 0.1745. We could improve our model accuracy by training it on more epochs but did not perform because of the long-time duration required for training. Overall, we have achieved good results. Our model gives us a list of probabilities for each class of hemorrhage shown in Fig. 8 and all the maximum probability we got is shown in Fig. 9.
Accurate diagnosis of brain hemorrhage is an important task in the research medical field. A major goal of this research is to resolve the issue of misdiagnosis of hemorrhage when symptoms are severe like loss of consciousness or headaches and to calculate the volume of hemorrhage. We use transfer learning and create a model that can detect brain hemorrhages and classify them into five sub-types. Secondly, we calculated the volume of hemorrhage using one patient data from the physionet dataset. In terms of volume, we mean depth of hemorrhage. As a result, we will get probabilities of hemorrhage classification using transfer learning and volume of hemorrhage using image processing on CT scan image slices. Future research work can start by increasing the model accuracy for the classification phase, which we limit to 10 epochs due to limited resources. Furthermore, future work for the volumeThe maximum phase can be to perform experiments on our algorithm using any other private or publicly available dataset.
Funding Statement: The authors received no specific funding for this study.
Conflicts of Interest: The authors declare that they have no conflicts of interest to report regarding the present study.
References
1. M. Hssayeni, M. Croock, A. Salman, H. Al-Khafaji, Z. Yahya et al., “Intracranial hemorrhage segmentation using a deep convolutional model,” Data, vol. 5, no. 1, pp. 1–14, 2020. [Google Scholar]
2. J. Caceres and J. Goldstein, “Intracranial hemorrhage,” Emergency Medicine Clinics of North America, vol. 30, no. 3, pp. 771–794, 2012. [Google Scholar]
3. Brain bleed/hemorrhage (intracranial hemorrhageCauses, symptoms, treatment, 2021. [online], Available: https://my.clevelandclinic.org/health/diseases/14480-brain-bleed-hemorrhage-intracranial-hemorrhage. [Google Scholar]
4. Intracranial hemorrhages: Types, risk factors, and symptoms, 2021. [Online], Available: https://www.healthline.com/health/extradural-hemorrhage. [Google Scholar]
5. Intraventricular HemorrhageRadiology, 2021. [Online], Available: https://radiopaedia.org/articles/intraventricular-haemorrhage. [Google Scholar]
6. Z. Zhao, Y. Zhang, Z. Comert and Y. Deng, “Computer-aided diagnosis system of fetal hypoxia incorporating recurrence plot with convolutional neural network,” Frontiers in Physiology, vol. 10, no. 255, pp. 1–14, 2019. [Google Scholar]
7. Z. Cömert, A. Şengür, Ü. Budak and A. Kocamaz, “Prediction of intrapartum fetal hypoxia considering feature selection algorithms and machine learning models,” Health Information Science and Systems, vol. 7, no. 1, pp. 131–139, 2019. [Google Scholar]
8. Z. Cömert and A. Kocamaz, “Fetal hypoxia detection based on deep convolutional neural network with transfer learning approach,” Advances in Intelligent Systems and Computing, vol. 763, pp. 239–248, 2018. [Google Scholar]
9. S. Perumal and T. Velmurugan, “Preprocessing by contrast enhancement techniques for medical images,” International Journal of Pure and Applied Mathematics, vol. 118, no. 18, pp. 3681–3688, 2018. [Google Scholar]
10. V. Nek and S. Da-Wen, “Image processing techniques for computer vision in the food and beverage industries,” Computer Vision Technology in the Food and Beverage Industries, vol. 1, pp. 01–16, 2012. [Google Scholar]
11. K. Weiss, T. M. Khoshgoftaar and D. Wang, “A survey of transfer learning,” Journal of Big Data, vol. 3, no. 9, pp. 1–40, 2016. [Google Scholar]
12. N. Bhadauria, R. Patel, M. Bist and H. Bhadauria, “Comparative analysis of various segmentation methods for brain hemorrhage detection using CT images,” in Proc.9th Int. Conf. on Industrial and Information Systems (ICIIS), India, pp. 1–5, 2014. [Google Scholar]
13. R. Hidayatullah, R. Sigit and S. Wasista, “Segmentation of head CT-scan to calculate percentage of brain hemorrhage volume,” in Proc. Int. Electronics Symp. on Knowledge Creation and Intelligent Computing (IES-KCIC), Indonesia, pp. 301–306, 2017. [Google Scholar]
14. H. Lee, S. Yune, M. Mansouri, M. Kim, S. Tajmir et al., “An explainable deep-learning algorithm for the detection of acute intracranial haemorrhage from small datasets,” Nature Biomedical Engineering, vol. 3, no. 3, pp. 173–182. 2018. [Google Scholar]
15. H. Ye, F. Gao, Y. Yin, D. Guo, P. Zhao et al., “Precise diagnosis of intracranial hemorrhage and subtypes using a three-dimensional joint convolutional and recurrent neural network,” European Radiology, vol. 29, no. 11, pp. 6191–6201, 2019. [Google Scholar]
16. O. Okashi, F. Mohammed and A. Aljaaf, “An ensemble learning approach for automatic brain hemorrhage detection from MRIs,” in Proc. 12th Int. Conf. on Developments in eSystems Engineering (DeSE), Russia, pp. 929–932, 2019. [Google Scholar]
17. D. Ginat, “Analysis of head CT scans flagged by deep learning software for acute intracranial hemorrhage,” Neuroradiology, vol. 62, no. 3, pp. 335–340, 2019. [Google Scholar]
18. M. Togacar, Z. Comert, B. Ergen and U. Budak, “Brain hemorrhage detection based on heat maps, autoencoder and cnn architecture,” in Proc. 1st Int. Informatics and Software Engineering Conf. (UBMYKTurkey, pp. 1–5, 2019. [Google Scholar]
19. L. Li, M. Wei, B. Liu, K. Atchaneeyasakul, F. Zhou et al., “Deep learning for hemorrhagic lesion detection and segmentation on brain ct images,” IEEE Journal of Biomedical and Health Informatics, vol. 25, no. 5, pp. 1646–1659, 2021. [Google Scholar]
20. H. Rane and K. Warhade, “A survey on deep learning for intracranial hemorrhage detection,” in Proc. Int. Conf. on Emerging Smart Computing and Informatics (ESCI), India, pp. 38–42, 2021. [Google Scholar]
21. J. Lee, J. Kim, T. Kim and Y. Kim, “Detection and classification of intracranial hemorrhage on CT images using a novel deep-learning algorithm,” Scientific Reports, vol. 10, no. 1, pp. 1–7, 2020. [Google Scholar]
22. J. Wang, H. Farooq, H. Zhuang and A. Ibrahim, “Segmentation of intracranial hemorrhage using semi-supervised multi-task attention-based u-net,” Applied Sciences, vol. 10, no. 9, pp. 3297, 2020. [Google Scholar]
23. A. Dawud, K. Yurtkan and H. Oztoprak, “Application of deep learning in neuroradiology: Brain hemorrhage classification using transfer learning,” Computational Intelligence and Neuroscience, vol. 2019, pp. 1–12, 2019. [Google Scholar]
24. H. Chen, S. Khan, B. Kou, S. Nazir, W. Liu et al., “A smart machine learning model for the detection of brain hemorrhage diagnosis-based internet of things in smart cities,” Complexity, vol. 2020, article ID. 3047869, pp. 1–10, 2020. [Google Scholar]
25. T. Lewick, M. Kumar, R. Hong and W. Wu, “Intracranial hemorrhage detection in ct scans using deep learning,” in Proc. IEEE Sixth Int. Conf. on Big Data Computing Service and Applications (BigDataService), UK, pp. 169–172, 2020. [Google Scholar]
26. DICOM library-about DICOM format, Dicomlibrary.com, 2022. [Google Scholar]
27. M. Hssayeni, “Computed tomography images for intracranial hemorrhage detection and segmentation,” Physionet, vol. 5, pp. e215–e220, 2021. [Google Scholar]
28. D. Zhang, J. Hu, F. Li, X. Ding, A. K. Sangaiah et al., “Small object detection via precise region-based fully convolutional networks,” Computers, Materials and Continua, vol. 69, no. 2, pp. 1503–1517, 2021. [Google Scholar]
29. J. Wang, Y. Wu, S. He, P. K. Sharma, X. Yu et al., “Lightweight single image super-resolution convolution neural network in portable device,” KSII Transactions on Internet and Information Systems (TIIS), vol. 15, no. 11, pp. 4065–4083, 2021. [Google Scholar]
30. L. Jaurigue and K. Lüdge, “Connecting reservoir computing with statistical forecasting and deep neural networks,” Nature Communications, vol. 13, no. 1, pp. 1–3, 2022. [Google Scholar]
31. M. Khushi, K. Shaukat, T. M. Alam, I. A. Hameed, S. Uddin et al., “A comparative performance analysis of data resampling methods on imbalance medical data,” IEEE Access, vol. 9, pp. 109960–109975, 2021. [Google Scholar]
32. C. Srinivas, K. S. N. Prasad, M. Zakariah, Y. A. Alothaibi, K. Shaukat et al., “Deep transfer learning approaches in performance analysis of brain tumor classification using MRI images,” Journal of Healthcare Engineering, vol. 2022, pp. 1–17, 2022. [Google Scholar]
33. A. Tharek, A. Muda and A. B. Hudi, “Intracranial hemorrhage detection in CT scan using deep learning,” Asian Journal of Medical Technology, vol. 2, no. 1, pp. 1–18, 2022. [Google Scholar]
Cite This Article
 Copyright © 2023 The Author(s). Published by Tech Science Press.
This work is licensed under a Creative Commons Attribution 4.0 International License , which permits unrestricted use, distribution, and reproduction in any medium, provided the original work is properly cited.
 Downloads
 Citation Tools