
 Submit a Paper
 Propose a Special lssue
 Open Access
ARTICLE

Symbiotic Organisms Search with Deep Learning Driven Biomedical Osteosarcoma Detection and Classification
1 Faculty of Economics and Administration, King Abdulaziz University, Jeddah, Saudi Arabia
2 E-Commerce Department, College of Administrative and Financial Sciences, Saudi Electronic University, Jeddah, Saudi Arabia
3 Department of Management Information Systems, College of Business Administration, Taibah University, Al-Madinah, Saudi Arabia
4 Department of Computer Science and Engineering, GITAM School of Technology, Visakhapatnam Campus, GITAM (Deemed to be a University), India
5 Department of Computer Science and Engineering, GMR Institute of Technology, Andhra Pradesh, Rajam, India
* Corresponding Author: E. Laxmi Lydia. Email:
Computers, Materials & Continua 2023, 75(1), 133-148. https://doi.org/10.32604/cmc.2023.031786
Received 27 April 2022; Accepted 24 June 2022; Issue published 06 February 2023
 View Full Text
 Download PDF
Abstract
Osteosarcoma is one of the rare bone cancers that affect the individuals aged between 10 and 30 and it incurs high death rate. Early diagnosis of osteosarcoma is essential to improve the survivability rate and treatment protocols. Traditional physical examination procedure is not only a time-consuming process, but it also primarily relies upon the expert’s knowledge. In this background, the recently developed Deep Learning (DL) models can be applied to perform decision making. At the same time, hyperparameter optimization of DL models also plays an important role in influencing overall classification performance. The current study introduces a novel Symbiotic Organisms Search with Deep Learning-driven Osteosarcoma Detection and Classification (SOSDL-ODC) model. The presented SOSDL-ODC technique primarily focuses on recognition and classification of osteosarcoma using histopathological images. In order to achieve this, the presented SOSDL-ODC technique initially applies image pre-processing approach to enhance the quality of image. Also, MobileNetv2 model is applied to generate a suitable group of feature vectors whereas hyperparameter tuning of MobileNetv2 model is performed using SOS algorithm. At last, Gated Recurrent Unit (GRU) technique is applied as a classification model to determine proper class labels. In order to validate the enhanced osteosarcoma classification performance of the proposed SOSDL-ODC technique, a comprehensive comparative analysis was conducted. The obtained outcomes confirmed the betterment of SOSDL-ODC approach than the existing approaches as the former achieved a maximum accuracy of 97.73%.Keywords
Osteosarcoma or Osteogenic Sarcoma is a type of bone cancer that commonly starts developing from long bones of arms and legs [1]. Though its growth can be observed in any of the bone cells within bones, it rarely affects the soft tissues adjacent to bones. Though it has been prevalently diagnosed among teenage or young people, it also affects other age categories. Multiple reasons are cited behind the occurrence of osteosarcoma. Alike other cancer types, it occurs due to genetic disorder and is not mostly connected to familial traits [2]. However, in one of the studies conducted earlier, osteosarcoma was found to have association with familial retinoblastoma cases i.e., family history is concerned with adolescent cancer in eye [3]. The symptoms of osteosarcoma disease include aches from the affected bone in the beginning while as time goes by, the low level of pain occurs and the patient’s agony increases. Bone fracture is another important symptom since the affected bones become weak owing to infection and lose its strength [4]. Magnetic Resonance Imaging (MRI), X-rays and histological biopsy test are necessary for diagnosis of osteosarcoma. In recent times, the prognosis of osteosarcoma demands a comprehensive history of the patient and their physical checks [5]. The common indications include constant gnawing pain and swelling at the site of infection, deep-seated, etc., ache in many parts which might portend skeletal metastasis; thus, these symptoms must be properly examined [6].
Earlier, the histopathological images are scrutinized physically or through image processing technologies to find the clusters of nuclei, osteoblasts, development plates, fibrous tissue, blood vessels, nuclei sizes, calcified bone sections, adipocytes, cartilage, marrow cells and osteoid. This is not only a time-consuming process, but also tend to err [7]. At present, advanced Artificial Intelligence (AI) techniques can be applied for cancer cell recognition using simple datasets. The features can be identified automatically within a limited period of time. Additionally, the utilization of AI offers good support for patients as well as doctors by prognosing the symptoms [8]. Besides, the utilization of AI in histopathology domain helps in achieving superior prognosis, categorization, and identification of distinct forms of cancer [9]. At present, Computer-Aided Detection (CAD) algorithms have been developed by researchers to diagnose osteosarcoma through medical images. These techniques particularly make use of Computed Tomography (CT) and MRI scan images. But the outcomes from such systems are confined owing to constraints found in CT and MRI scans [10].
The authors in the literature [11] executed a pipeline for automatic segmentation of Region of Interest (ROI). In this study, a nomogram was utilized combining MRI-based radiomics’ score and medicinal variables so as to predict the responses for Neo-Adjuvant Chemotherapy (NAC) among osteosarcoma patients. After normalization, ROIs is segmented by DL segmentation method to preoperative MRI and is trained with nnU-Net using two independent manual segmentation labels. Radiomics feature is employed to automatically extract the segmented ROIs. In literature [12], the authors presented an automatic recognition model named Integrated Features-Feature Selection Model for Classification (IF-FSM-C) which diagnoses osteosarcoma in high-resolution Whole Slide Images (WSIs). In order to perform FS, two binary variations were used for the newly-presented Arithmetic Optimization Algorithm (AOA) such as BAOA-S and BAOA-V. The chosen features were then provided for classification during when the WSI is classified as Non-Tumor (NT), Viable Tumor (VT), and Non-Viable Tumor (NVT).
In literature [13], a new and more important structure W-net++ was presented based on two cascaded U-Nets and dense skip links so as to realize automatic and correct segmentation of osteosarcoma lesion from CT scan image. In this network, multiscale input was used to structure the missing spatial details, due to several encoders and encoding subsamples. In the study conducted earlier [14], Transfer Learning (TL) approaches like pre-trained Convolutional Neural Network (CNN) were altered in public data set on osteosarcoma histological image to detect the necrotic image in non-necrotic and healthy tissues. At that time, TL techniques that contain Visual Geometry Group (VGG19) and Inception V3 were utilized and trained on WSIs without patches so as to enhance the accuracy of output. The authors in literature [15] presented CNN as a tool to enhance the efficacy and precision of osteosarcoma tumor classification under tumor classes (VT, necrosis) and non-tumor classes.
The current study introduces a novel Symbiotic Organisms Search with Deep Learning-driven Osteosarcoma Detection and Classification (SOSDL-ODC) model. The presented SOSDL-ODC technique applies image pre-processing approach to enhance the quality of image. In addition, MobileNetv2 model is applied to generate a suitable group of feature vectors and the hyperparameter tuning of MobileNetv2 model is performed using SOS algorithm. At last, Gated Recurrent Unit (GRU) technique is applied as a classification model to determine suitable class labels. In order to validate the enhanced osteosarcoma classification performance of the proposed SOSDL-ODC technique, the authors conducted a comprehensive comparative analysis and the results were validated.
In this work, a new SOSDL-ODC approach has been developed for recognition and classification of osteosarcoma using histopathological images. The presented SOSDL-ODC system initially applies image pre-processing approach to enhance the quality of image. After image pre-processing, SOS-MobileNetv2 model is applied to generate a suitable group of feature vectors. Finally, GRU method is applied as a classification model to determine the appropriate class labels. Fig. 1 depicts the overall block diagram of SOSDL-ODC technique.
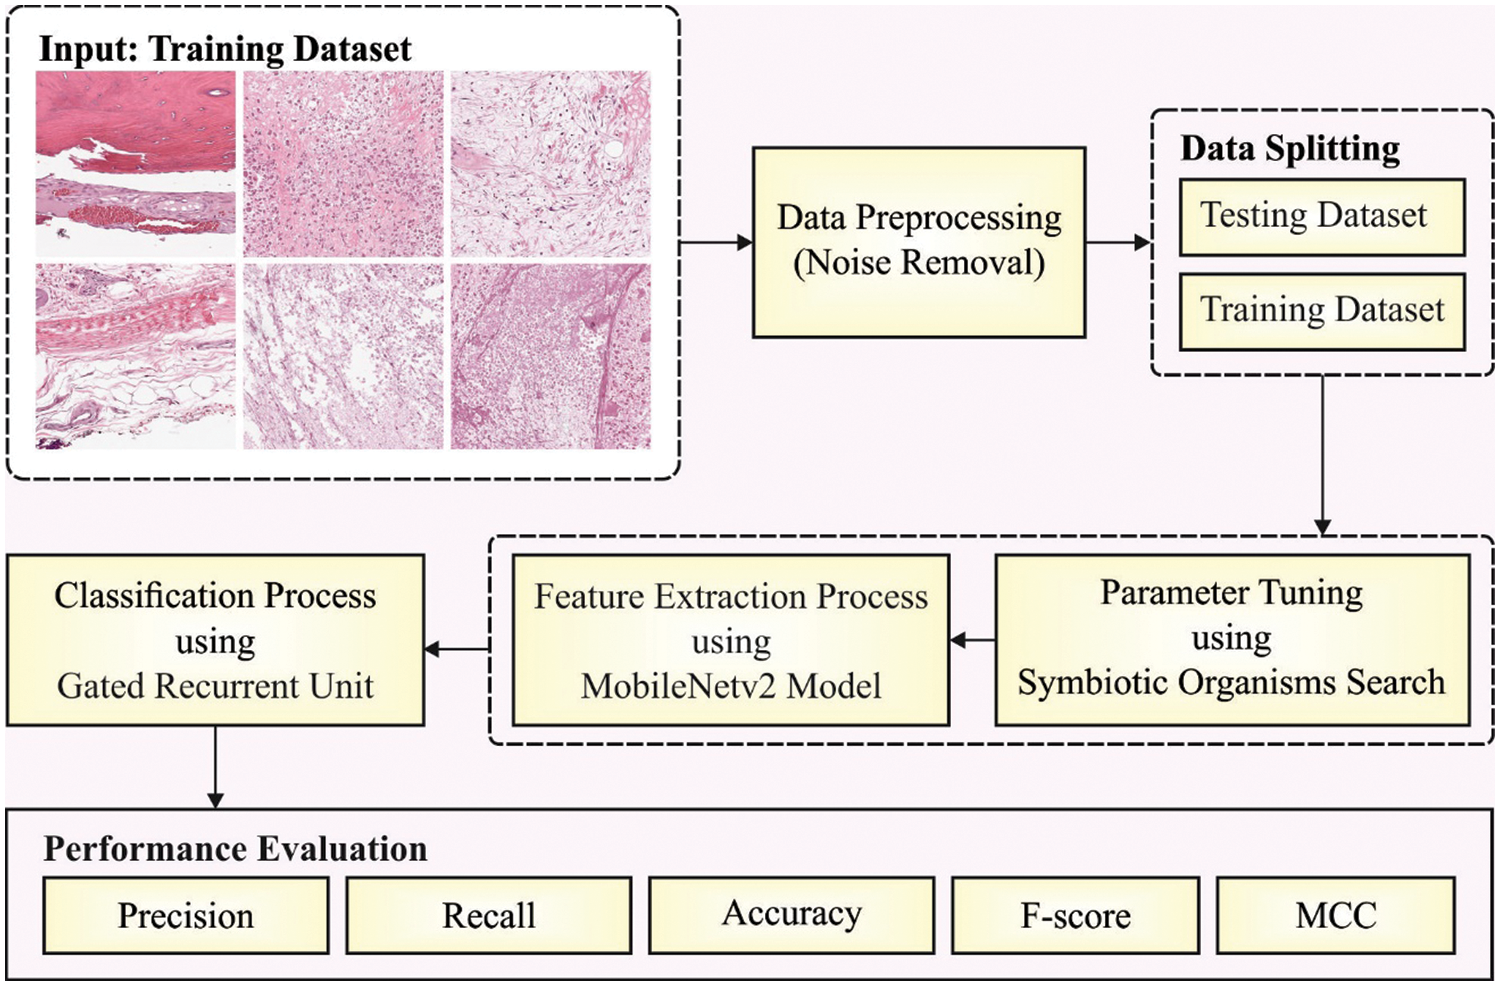
Figure 1: Block diagram of SOSDL-ODC technique
The presented SOSDL-ODC technique initially applies image pre-processing approach to enhance the quality of image. Wiener Filter (WF) is utilized in this study to filter noisy signals. This is achieved by employing the spectral feature of the chosen signals whereas the noise present in the signals is assumed to undergo stochastic procedures with linear properties.
Linear filter is executed with a co-efficient
The resultant signal
whereas,
A
Wiener-Hopf formula that computes the optimum weight is one of the important features of WFs.
Here,
2.2 Feature Extraction: MobileNetv2 Model
After image pre-processing, MobileNetv2 technique is leveraged to generate a suitable set of feature vectors [16]. MobileNetV1 is developed based on conventional VGG structure and is used to construct a system by stacking the convolutional layers so as to enhance the performance. But, gradient vanishing problem arises after stacking multiple convolution layers. The residual blocks present in ResNet make it easy for the dataset to stream among the layers. This process gets rid of the gradient exploring problems in backpropagation while the features are reused in forwarding propagation. In addition to continuing with in-depth separable convolutional layers of MobileNetV1, the MobileNetV2 technique draws on ResNet architecture too. In comparison with MobileNetV1, the major development found in MobileNetV2 is that it comprises of two points such as the accomplishment of inverted residual block and linear bottleneck in the networks. A certain conceptual framework feature is attained from the expansion factor t in N to M networks with stride, s. This bottleneck includes a 1 × 1 convolutional layer before depth-wise convolution layers and employs linear activation instead of non-linear activation after point-wise convolution layers. Further, it determines the down-sampling process by setting the variable, ‘s’ in depth-wise convolution layers.
In the entire architecture of MobileNetV2, conv2d refers to a typical convolution, avgpool indicates the average pooling,
2.3 Hyperparameter Optimization: SOS Algorithm
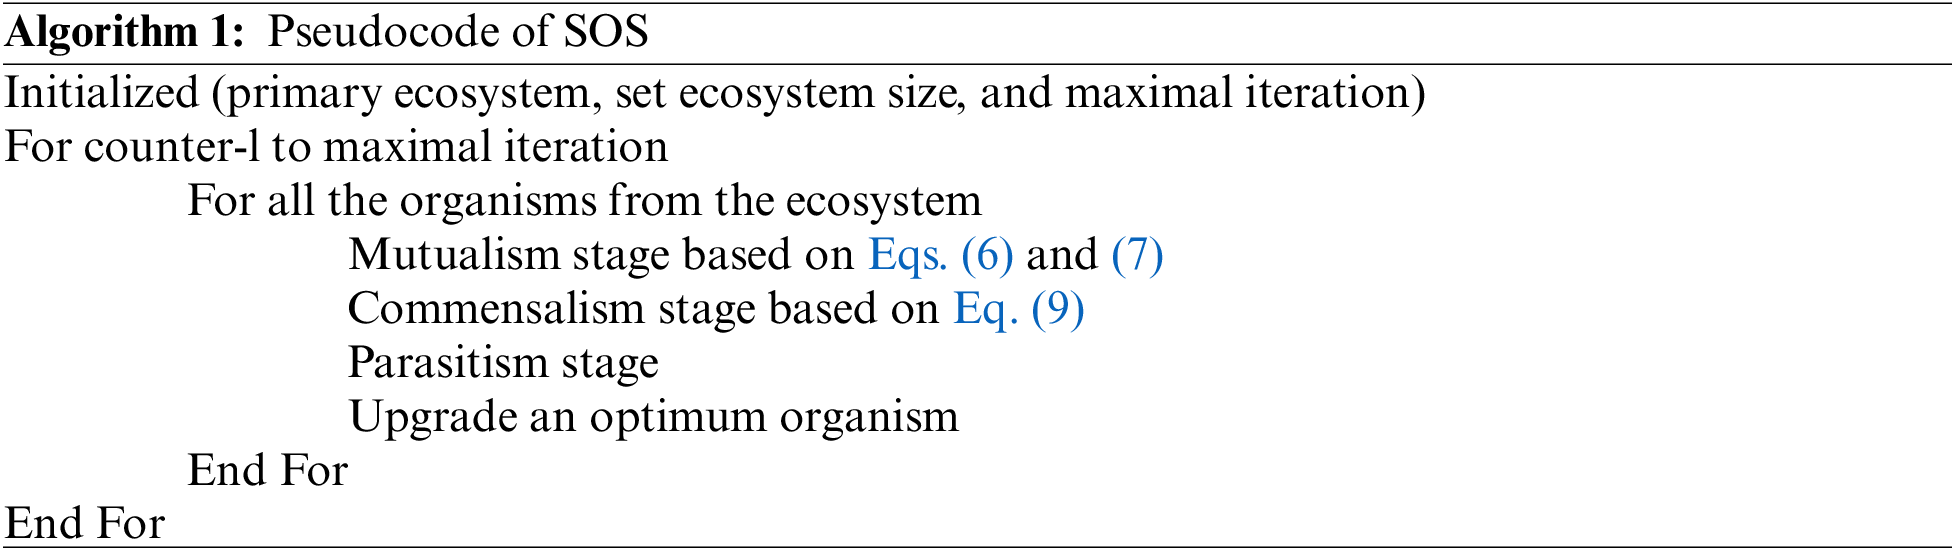
In this work, the hyperparameter involved [17–19] in MobileNetv2 model are fine-tuned using SOS algorithm [20]. Being an advanced method, SOS algorithm is used to resolve the optimization problems according to the interaction among organisms in nature. In general, organisms hardly live in isolation because each organism is dependent upon another for both survival and nutrition. These relationships mainly exist on the basis of trust. In other terms, this relationship is called symbiotic relationship. SOS approach initiates in the presence of ecosystem with initial population. At first, a collection of organisms is arbitrarily created. These arbitrarily-created organisms denote the solution for the presented problem. SOS approach yields a novel solution based on stimulation of living relations between two ecosystems. The pseudocode of the SOS algorithm includes parasitism, mutualism, and commensalism of natural biological relations.
Mutualism
In this type of relationship, both the organisms benefit from each other. For instance, assume the relationship between honeybees and flowers. The bees fly over flowers to collect the nectar needed for honey production. On the other hand, it is advantageous for the flowers since bees smatter the pollen and simplify the pollination process. During SOS process,
In the above equation,
Commensalism
Here, one of the organisms gains benefits without harming the other organism in the relationship. For instance, in the relationship between sharks and sticky fish, the sticky fish sticks around the shark and feed on residual foods; the shark gains small or no benefits. In this Mutualism process, the
In Eq. (9),
Parasitism
In this relationship type, one organism gains the benefit out of the other organism while the second one faces loss. For instance, malarial blood parasites attack the human body and proliferate which, at times, cause death also. In SOS process, Xi, viz., malaria mosquito generates an artificial parasite named ‘Parasite-Vector’. It is generated in the searching region with the replication of
:
2.4 Image Classification: GRU Model
In this final stage, GRU technique is executed as a classification model to determine suitable class labels [21]. GRU is an efficient memory cell that can be used for different kinds of applications. It is viewed as an improvement of Long Short Term Memory (LSTM) and its performance can be compared and generalized. In order to define a GRU evidently, the researchers proposed LSTM. In Recurrent Neural Network (RNN), hidden unit is a major element since it is accountable for forgetting or remembering certain datasets. LSTM, presented by Hochreiter and Schmidhuber, is an effective enforcement and has several alternatives to its credit. The connection relationship is shown in the following equation.
In this formula,
From the equation given below,
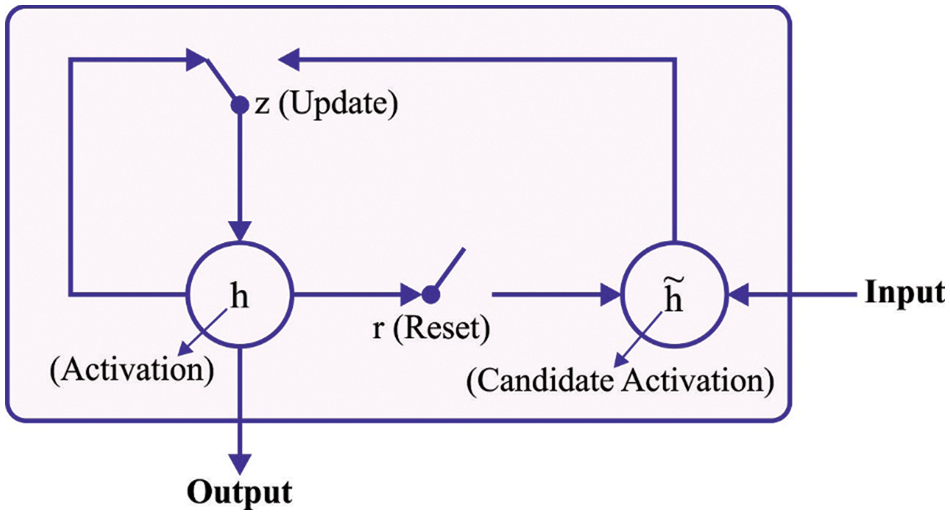
Figure 2: Structure of GRU
The performance of the proposed SOSDL-ODC method was validated using a dataset [22] that comprises of 1,144 images under three classes. Table 1 shows the details of the dataset considered for the study. Some of the sample images are illustrated in Fig. 3.

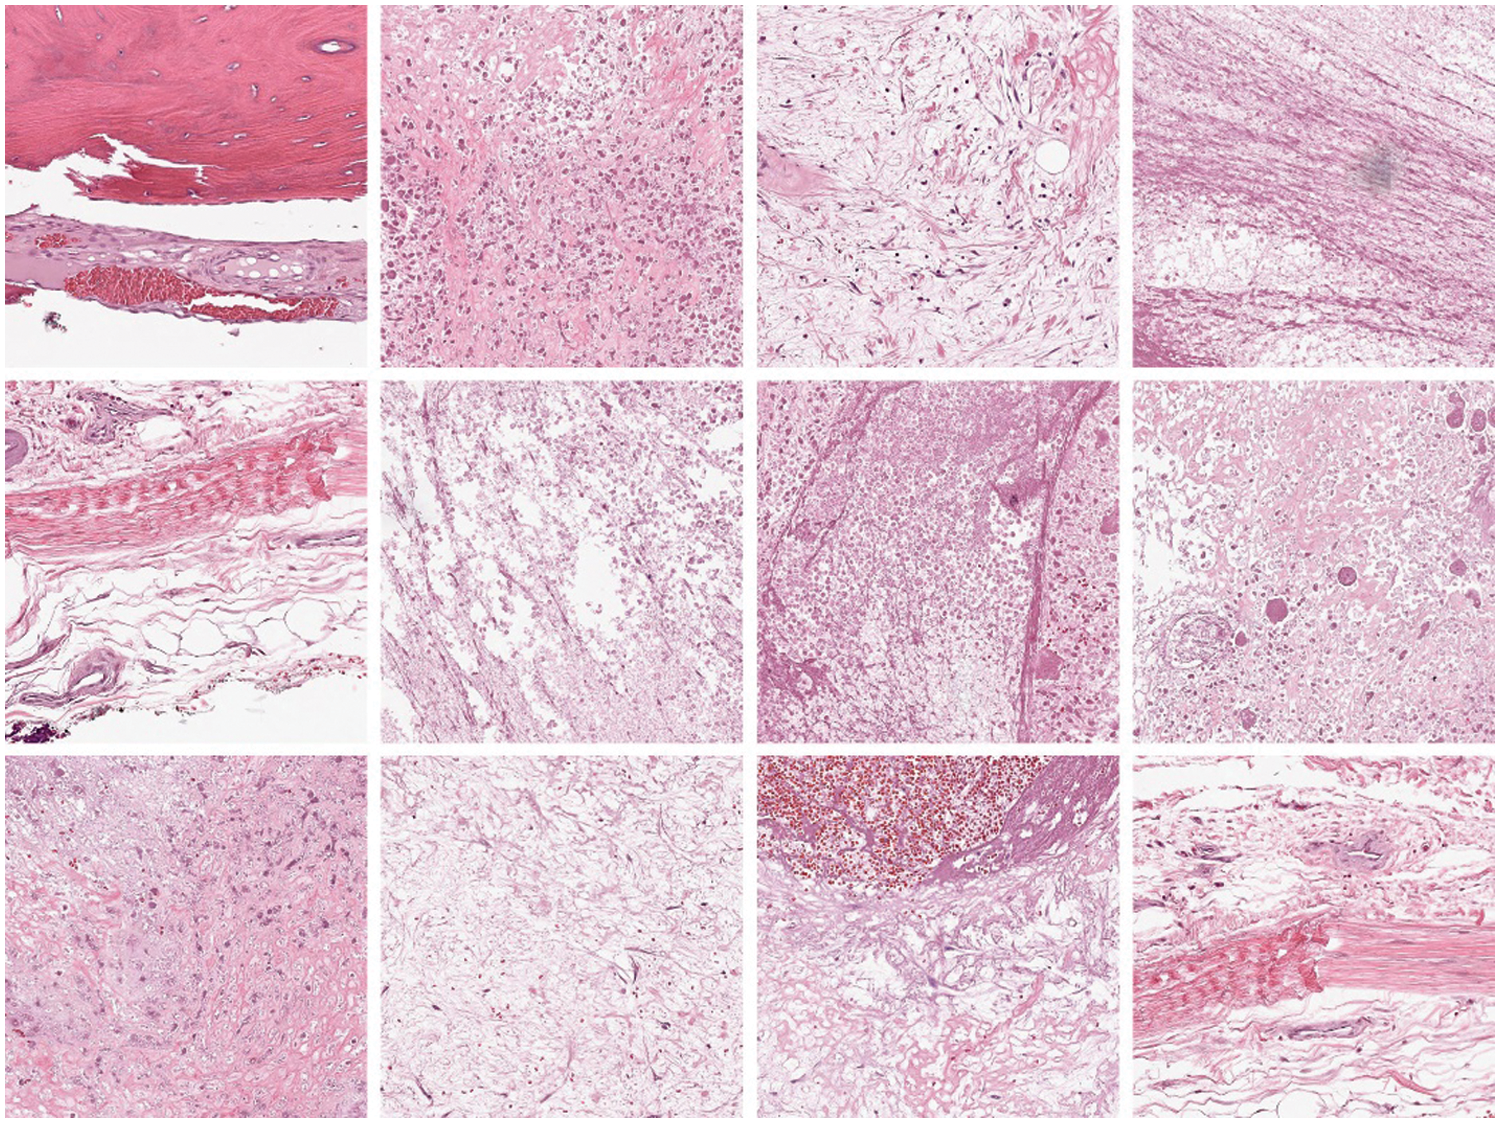
Figure 3: Sample images
Fig. 4 displays a set of confusion matrices generated by the proposed SOSDL-ODC method on the applied dataset under distinct number of epochs. The figures imply that the proposed SOSDL-ODC method achieved high performance under every epoch. For samples, with 200 epochs, the proposed SOSDL-ODC method classified 310 samples under VT, 241 samples under NVT, and 513 samples under NT class. Along with that, with 400 epochs, the proposed SOSDL-ODC approach categorized 313 samples under VT, 241 samples under NVT, and 512 samples under NT classes. Followed by, with 600 epochs, SOSDL-ODC algorithm identified 327 samples under VT, 252 samples under NVT, and 525 samples under NT classes. In line with this, with 800 epochs, the proposed SOSDL-ODC system identified 327 samples under VT, 252 samples under NVT, and 526 samples under NT classes.
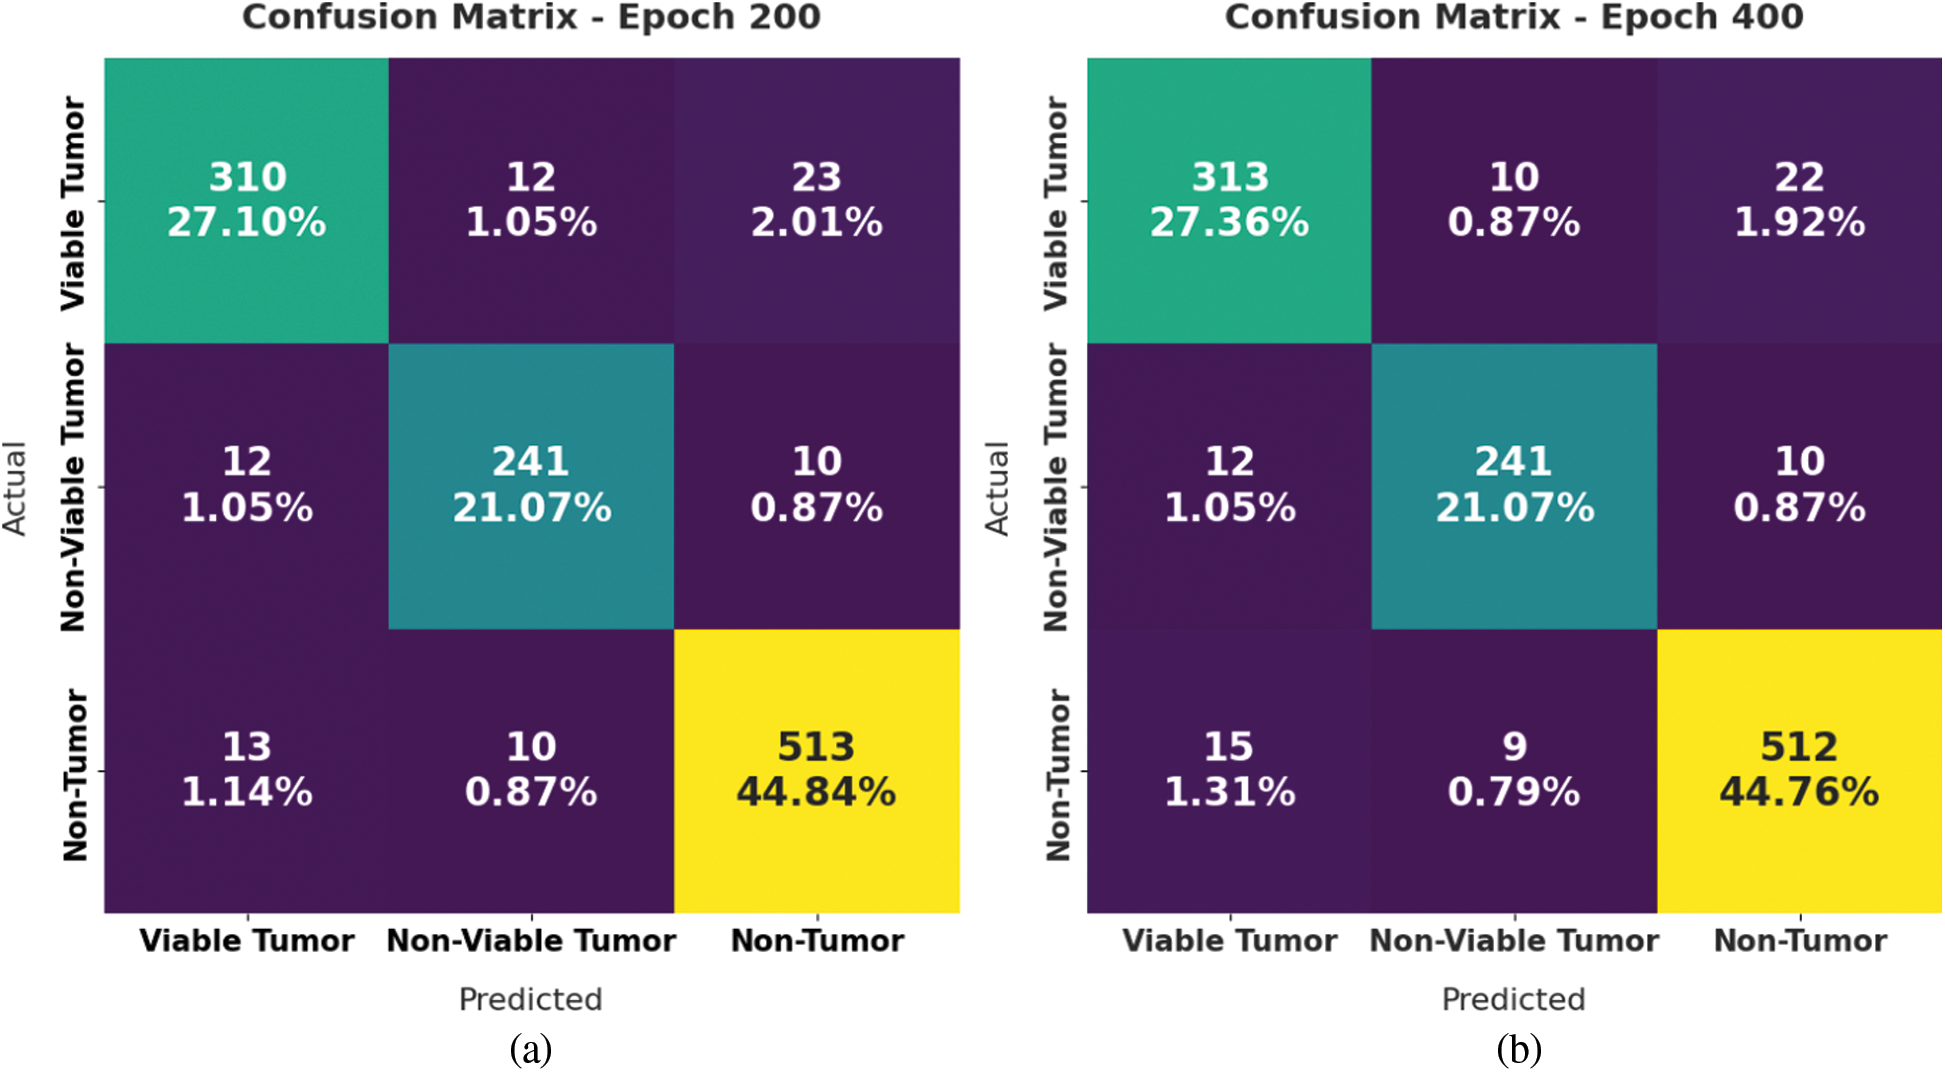
Figure 4: Confusion matrices generated by SOSDL-ODC technique at (a) epoch-200, (b) epoch-400, (c) epoch-600, and (d) epoch-800
Tab. 2 and Fig. 5 shows the analysis results accomplished by SOSDL-ODC method under distinct number of classes and epochs. The experimental outcomes imply that the proposed SOSDL-ODC method has the ability to attain effectual outcomes under all classes and epochs. For sample, with 200 epochs, SOSDL-ODC methodology gained average
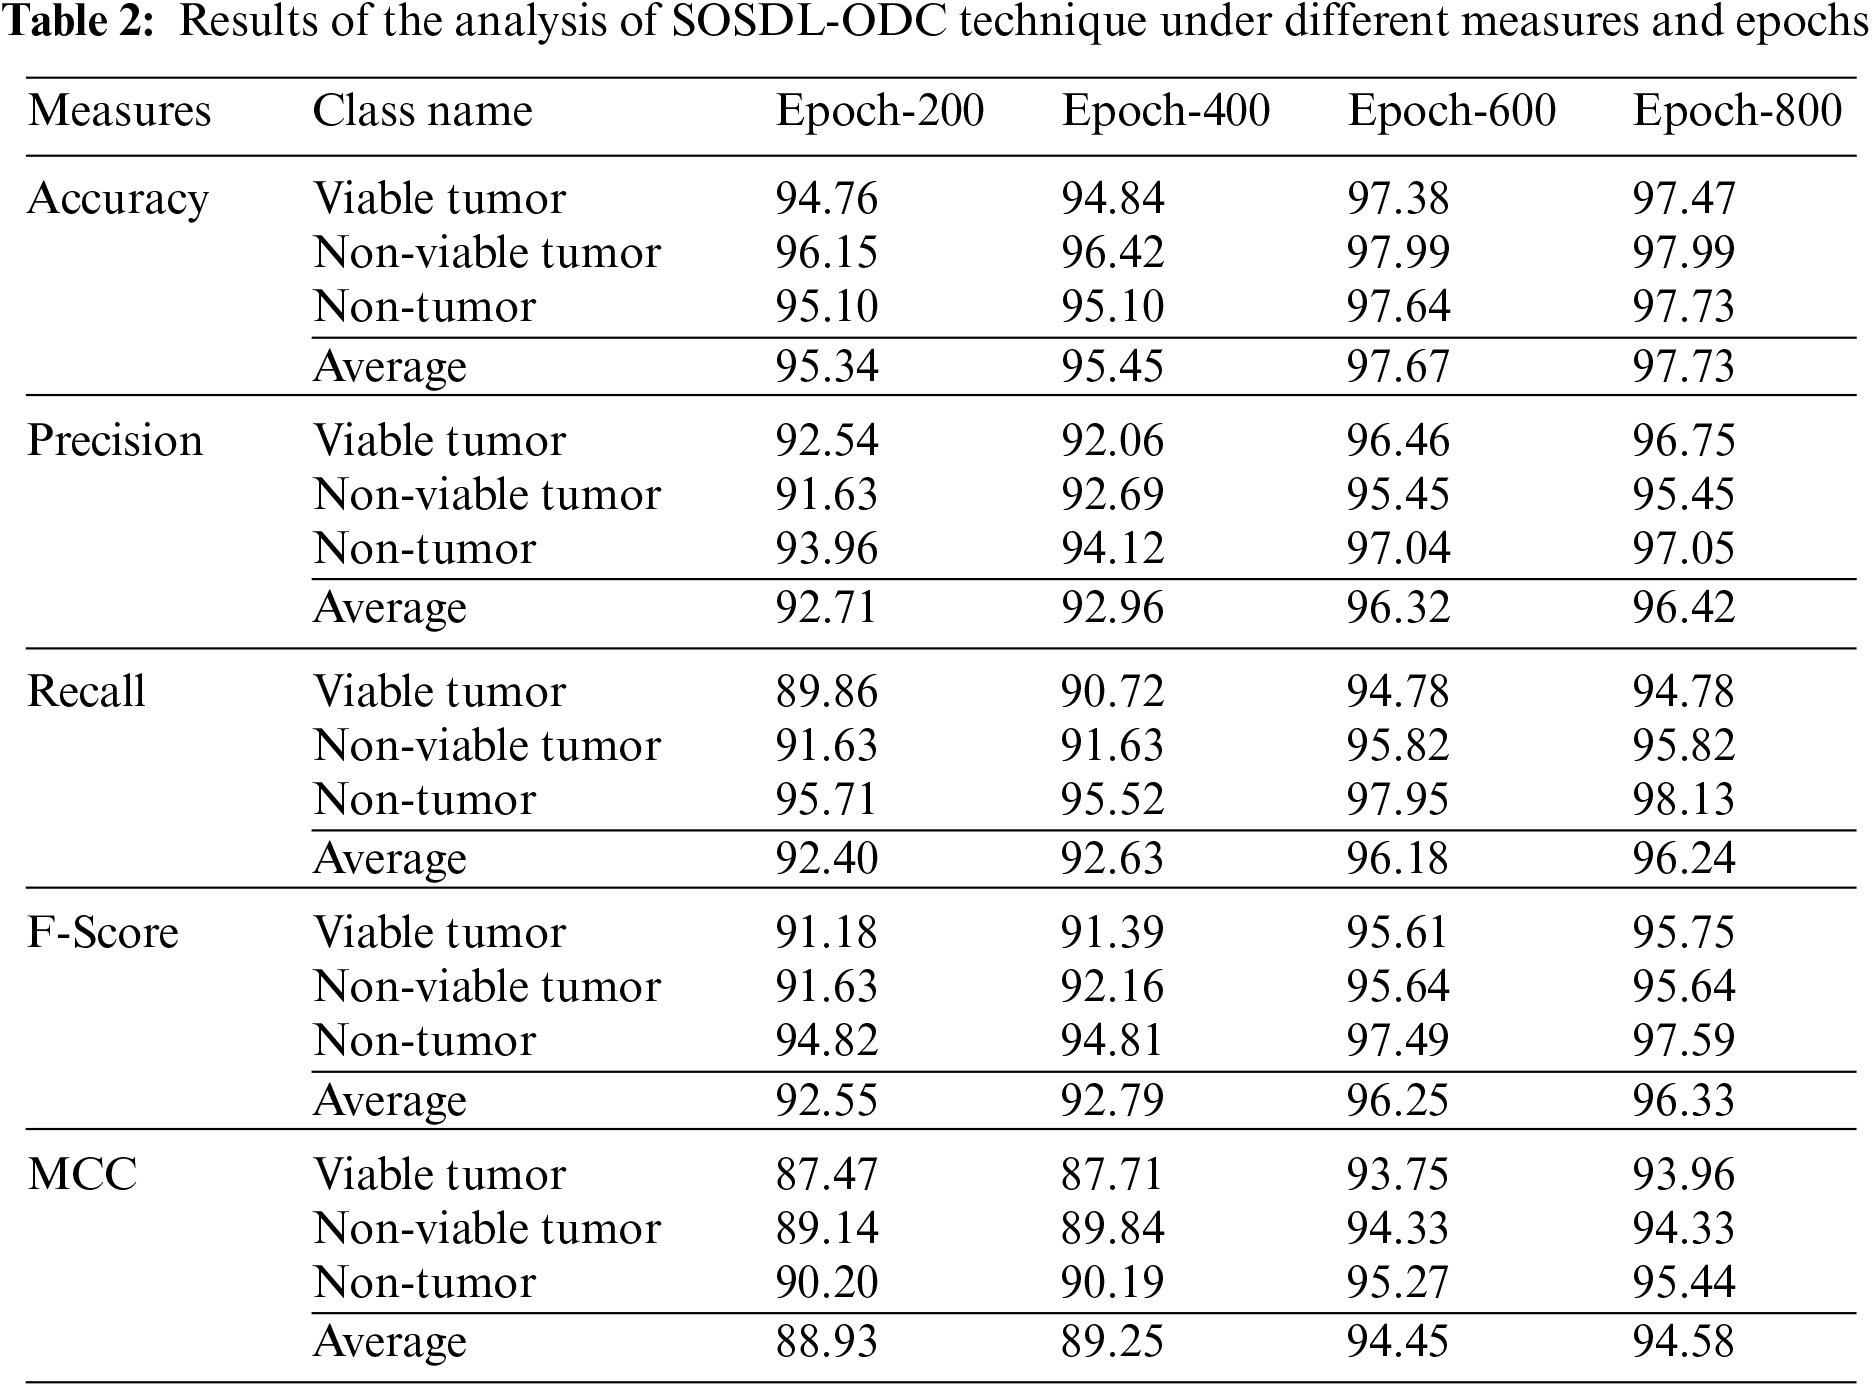
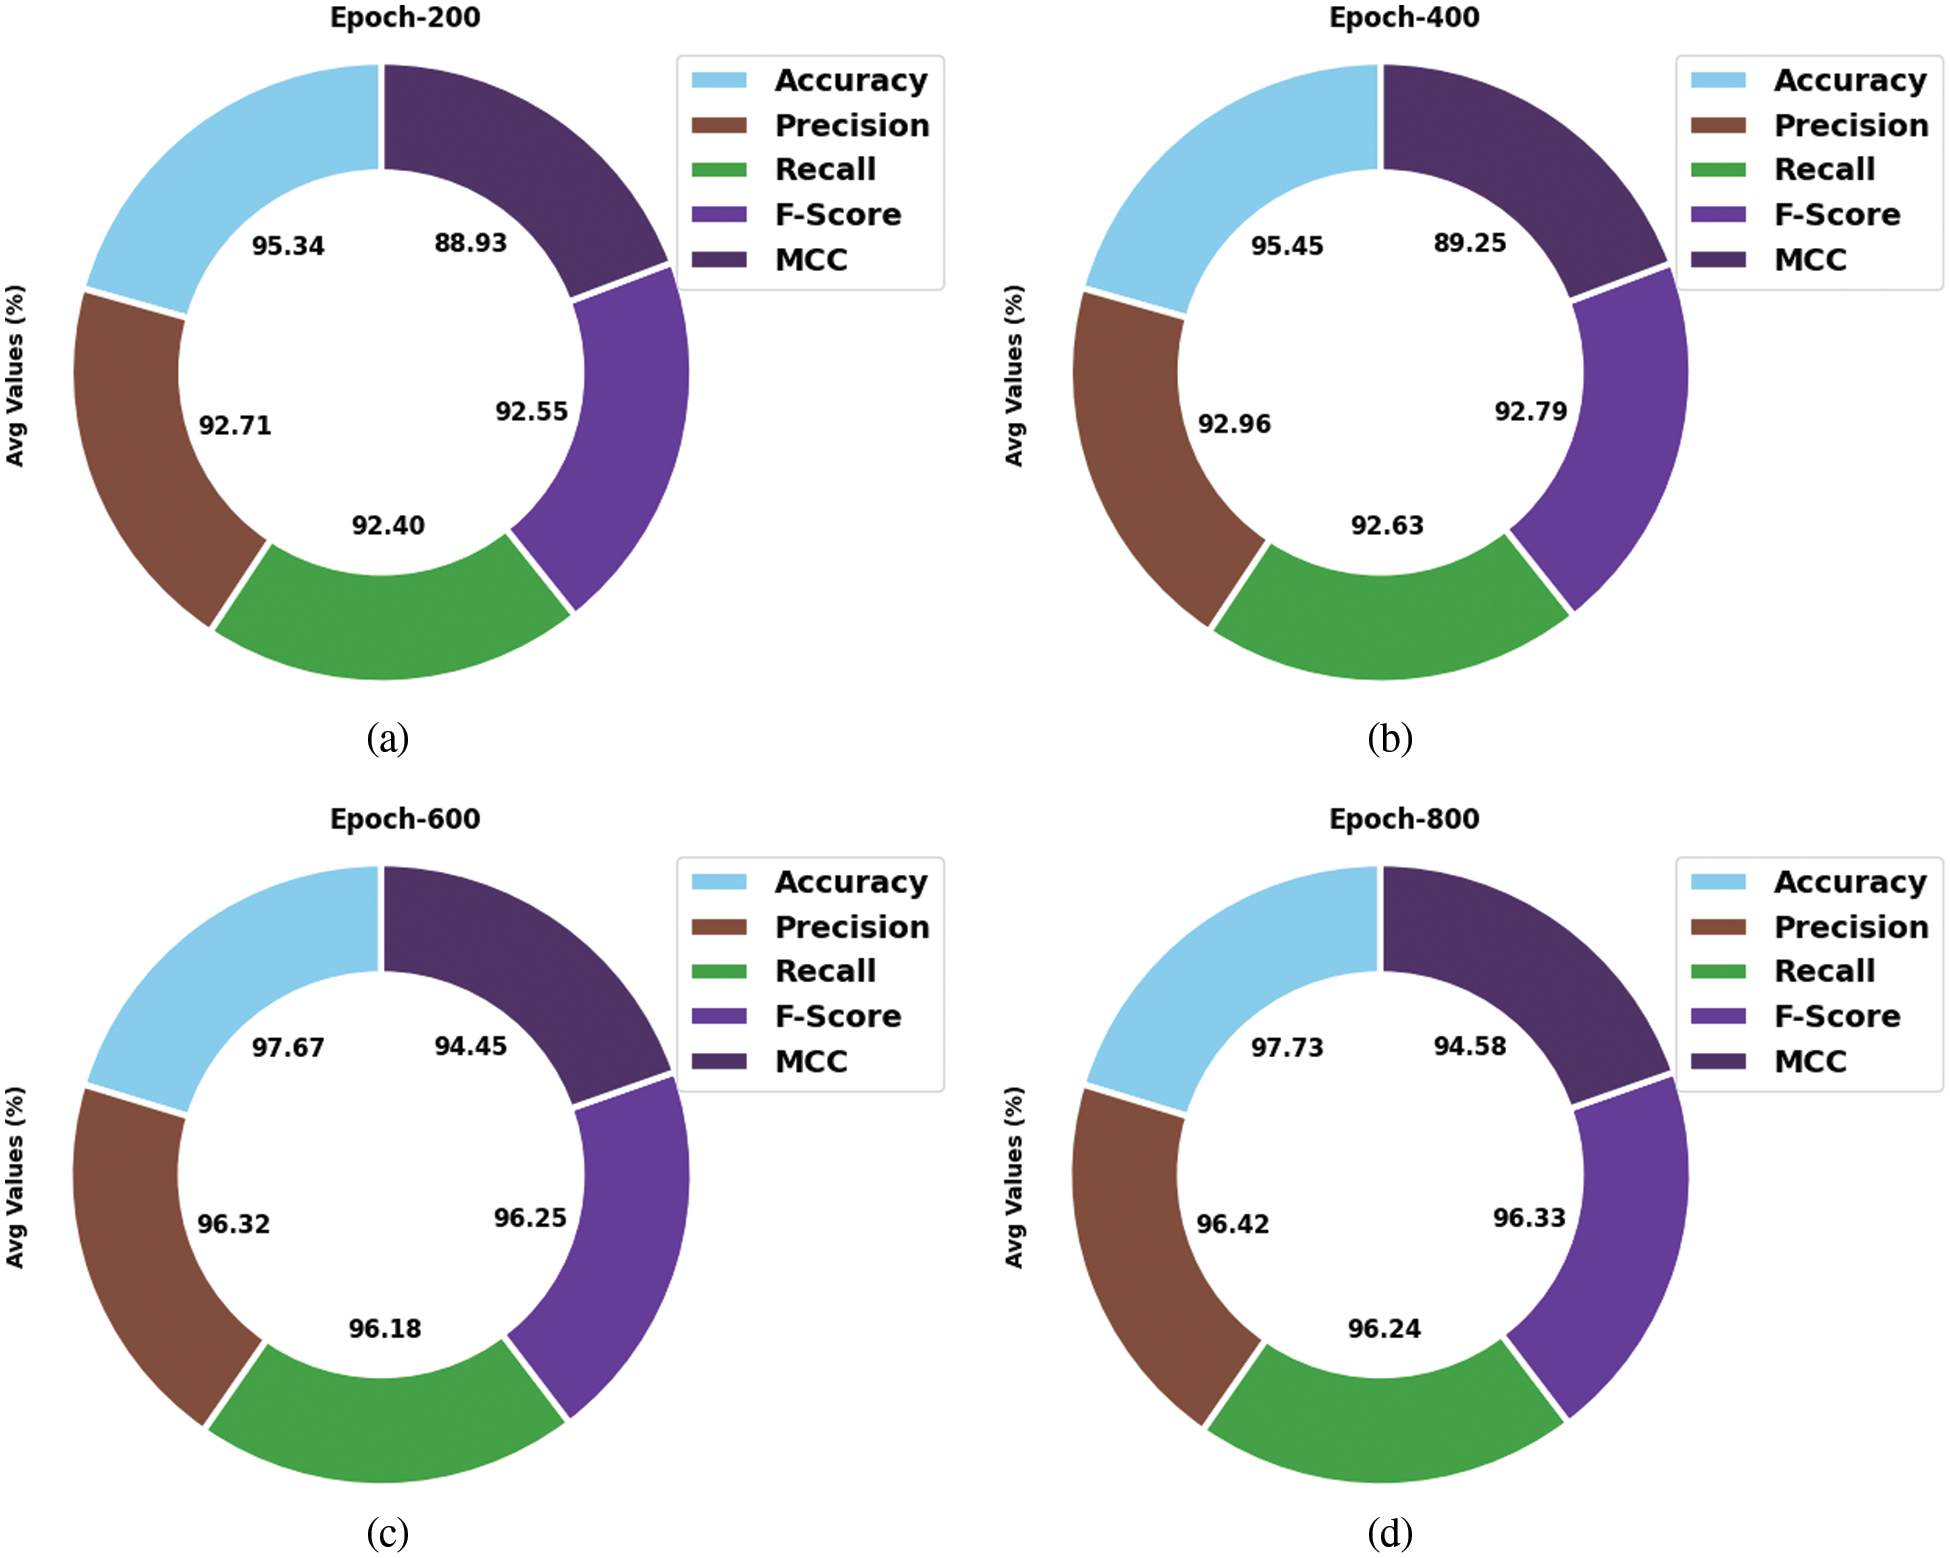
Figure 5: Average analysis results of SOSDL-ODC technique at (a) epoch-200, (b) epoch-400, (c) epoch-600, and (d) epoch-800
Both Training Accuracy (TA) and Validation Accuracy (VA) values, attained by the proposed SOSDL-ODC approach on test dataset, are demonstrated in Fig. 6. The experimental outcomes imply that the proposed SOSDL-ODC method gained the maximum TA and vA values. To be specific, VA is superior to TA.
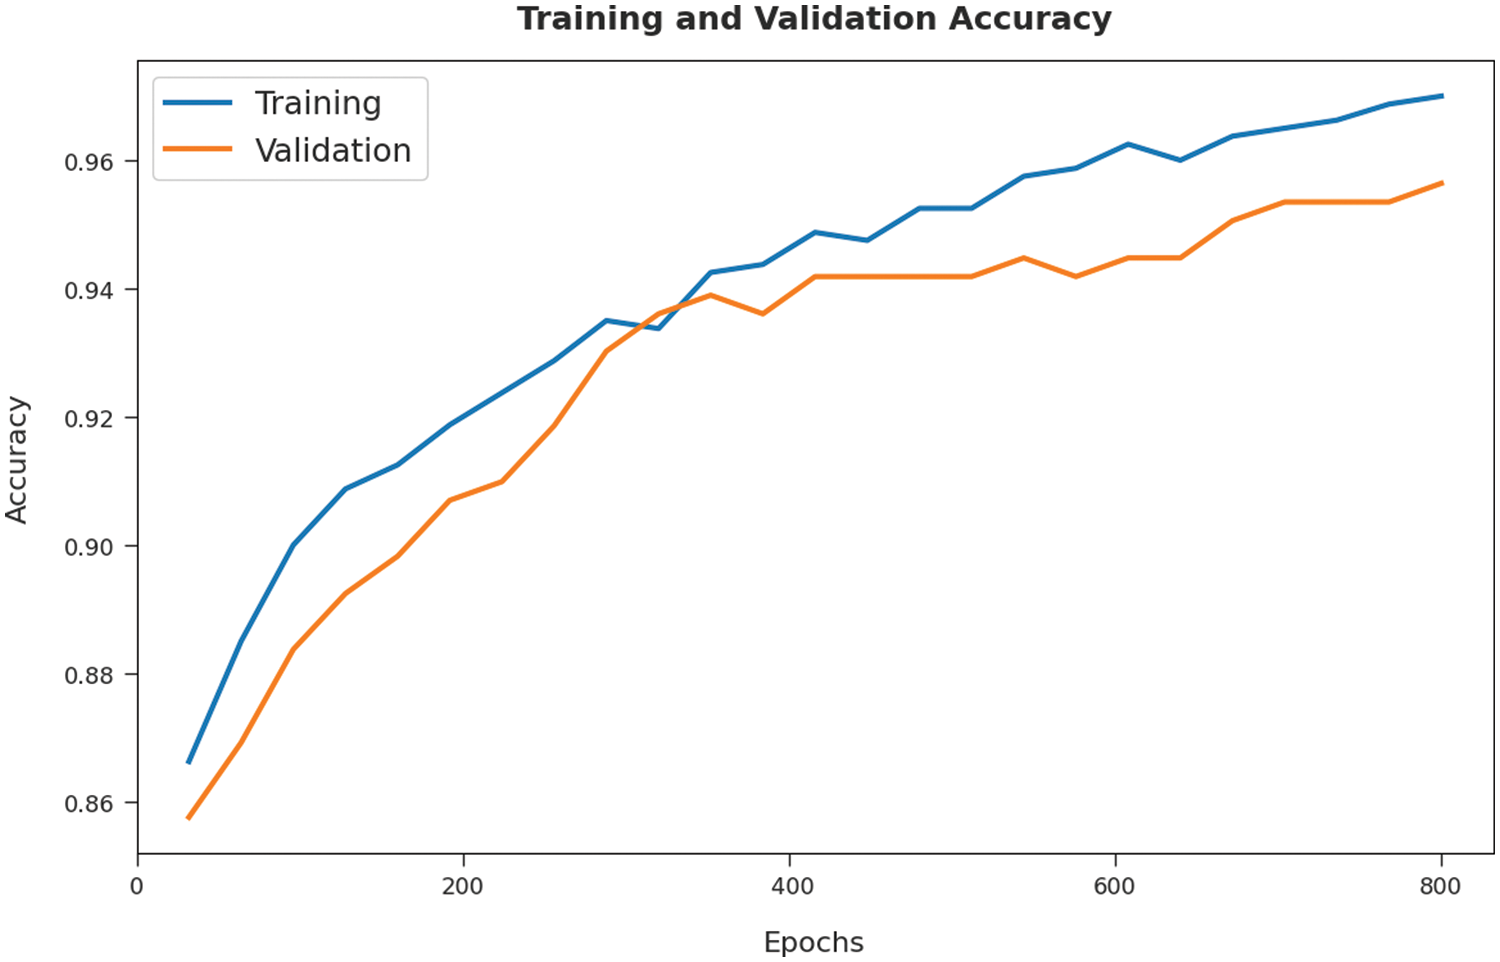
Figure 6: TA and VA analyses results of SOSDL-ODC technique
Both Training Loss (TL) and Validation Loss (VL) values, achieved by SOSDL-ODC methodology on test dataset, are shown in Fig. 7. The experimental outcomes infer that the proposed SOSDL-ODC system achieved the least TL and VL values. To be specific, VL seemed to be lower than TL.
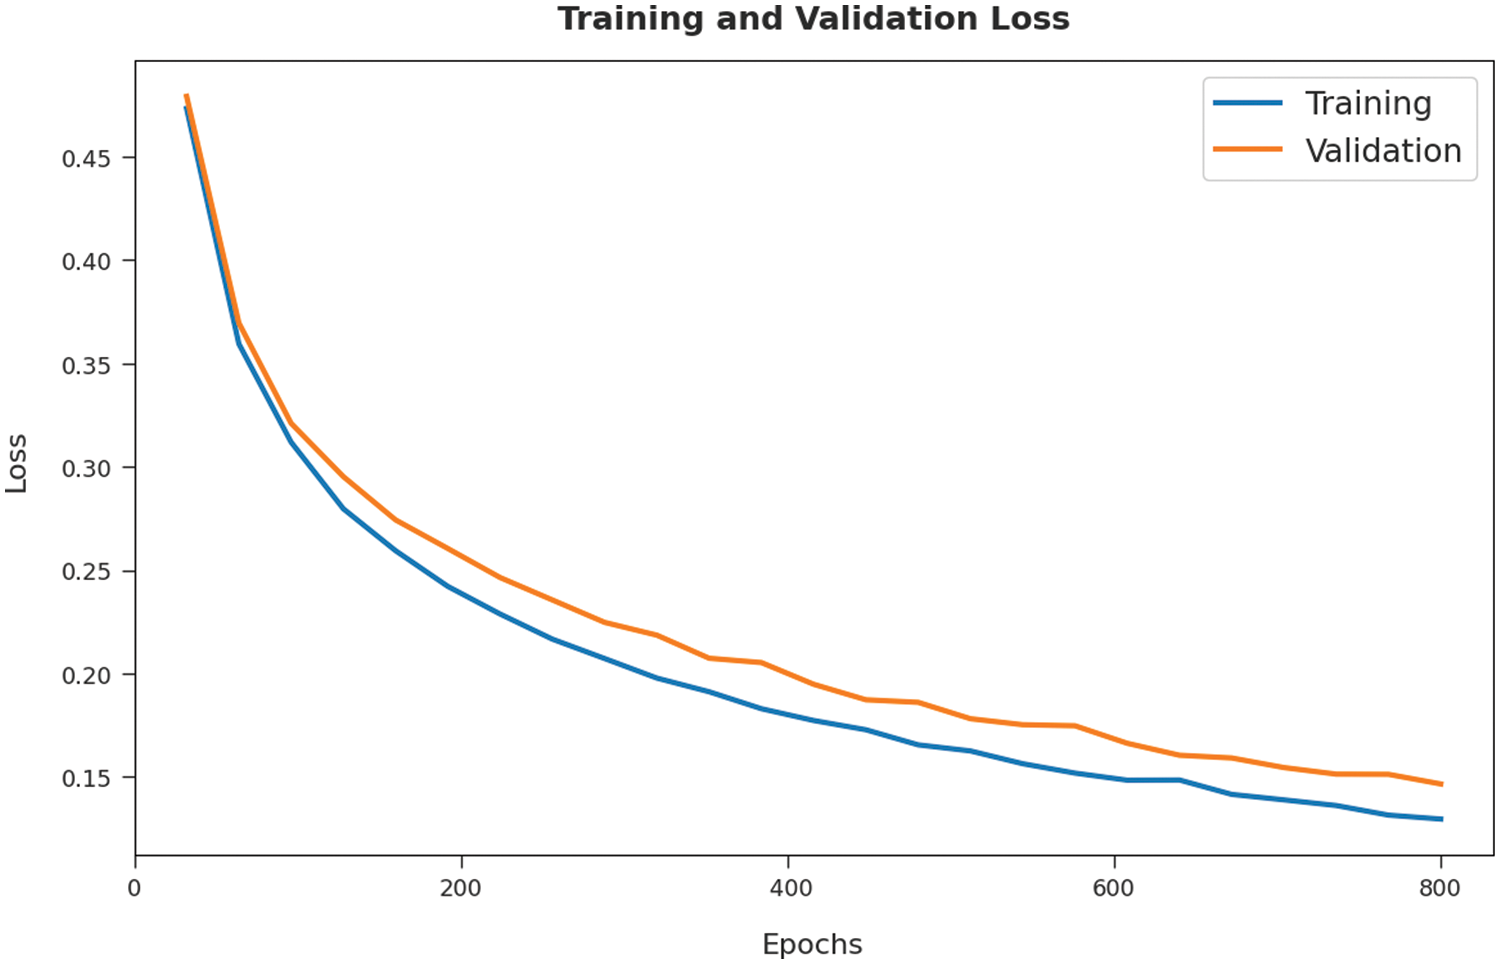
Figure 7: TL and VL analyses results of SOSDL-ODC technique
A brief precision-recall inspection was conducted upon SOSDL-ODC method on test dataset and the results are depicted in Fig. 8. By observing the figure, it can be inferred that the proposed SOSDL-ODC model accomplished high precision-recall performance under all the classes.
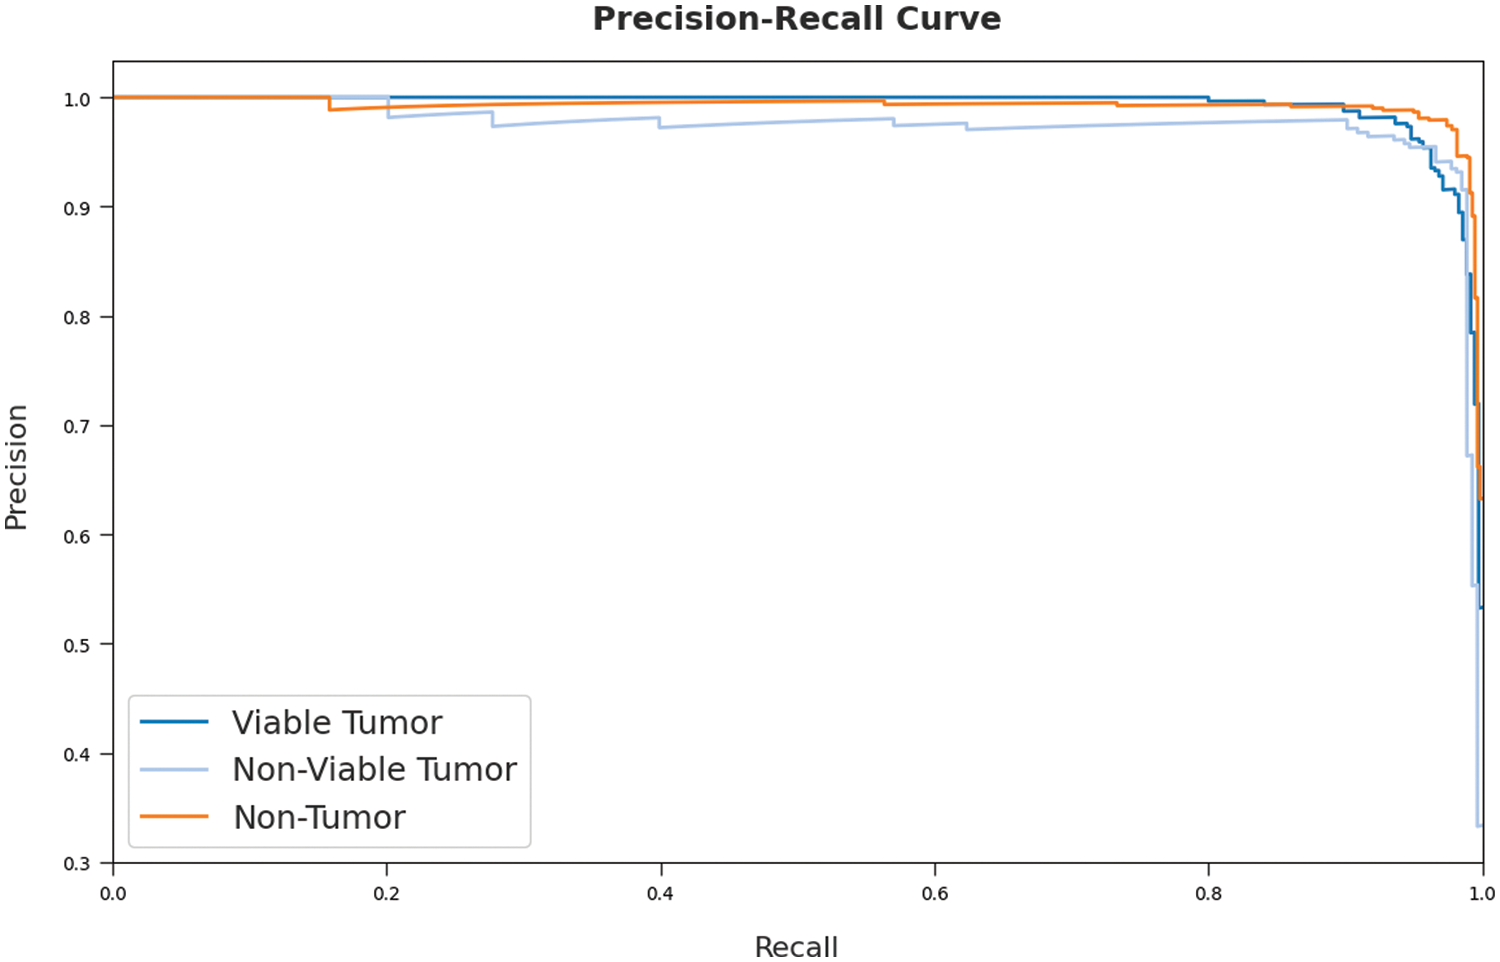
Figure 8: Precision-recall curve analysis results of SOSDL-ODC technique
A detailed ROC investigation was conducted upon SOSDL-ODC approach on test dataset and the results are showcased in Fig. 9. The results indicate that the proposed SOSDL-ODC algorithm exhibited its ability to categorize three different classes such as VT, NVT, and NT on test dataset. In order to validate the enhanced performance of SOSDL-ODC method, a detailed comparative analysis was conducted and the results are shown in Tab. 3 [23,24].
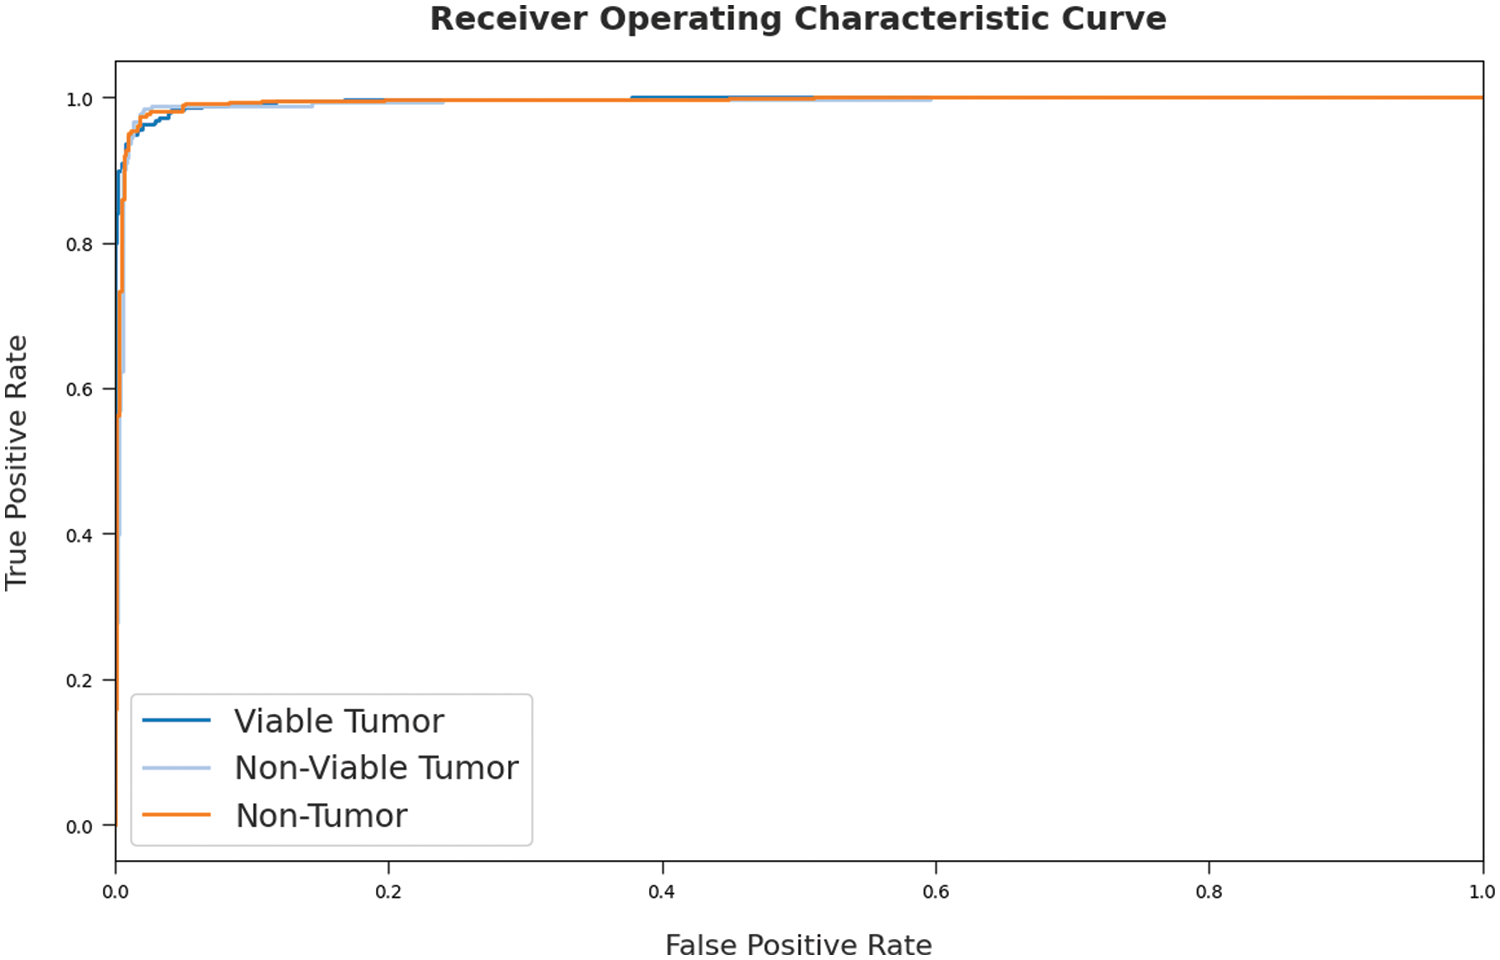
Figure 9: ROC curve analysis results of SOSDL-ODC technique

A detailed
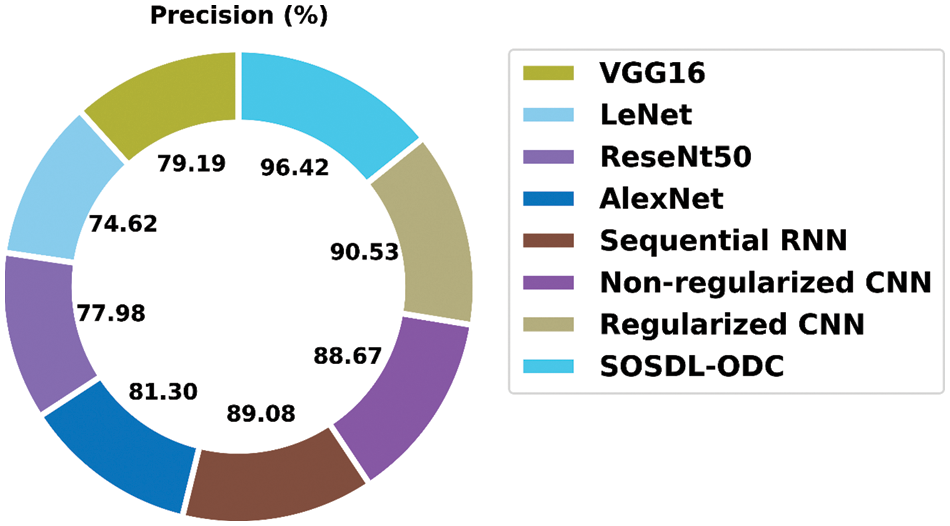
Figure 10:
A brief
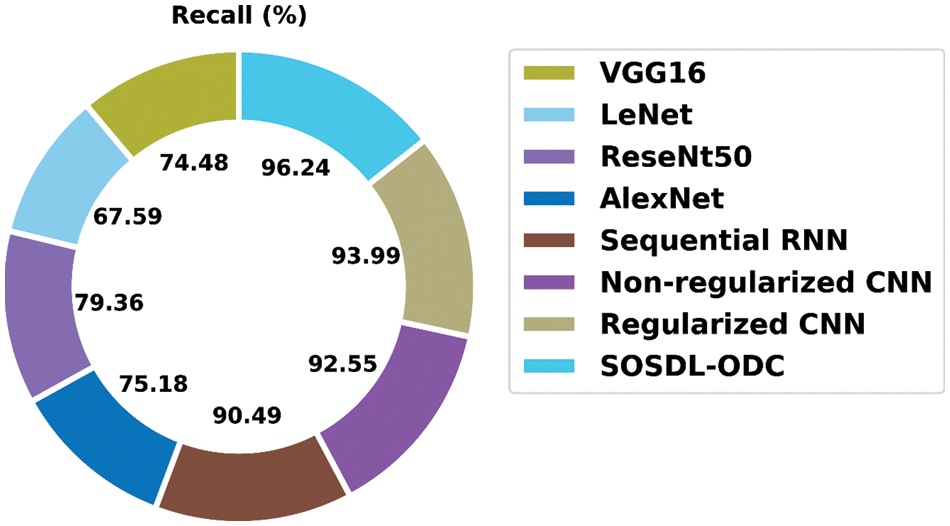
Figure 11:
A detailed
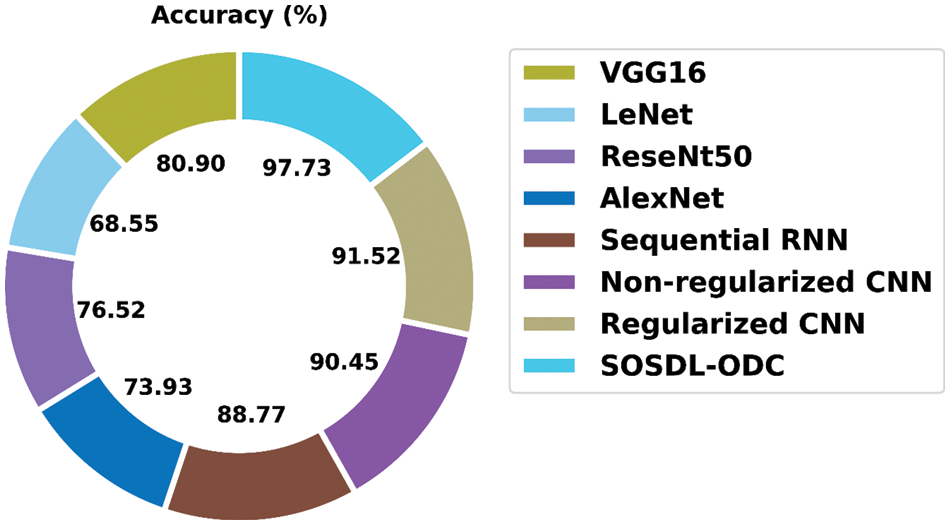
Figure 12:
In this work, a new SOSDL-ODC approach has been developed for recognition and classification of osteosarcoma with the help of histopathological images. The presented SOSDL-ODC approach initially applies pre-processing technique to enhance the quality of images. Then, MobileNetv2 model is applied to generate a suitable group of feature vectors and hyperparameter tuning of MobileNetv2 model is performed using SOS algorithm. Lastly, GRU technique is applied as a classification model to determine the suitable class labels. In order to validate the enhanced osteosarcoma classification performance of the proposed SOSDL-ODC technique, a comprehensive comparative study was conducted. The obtained outcomes established the supremacy of the proposed OSDL-ODC algorithm over other existing approaches. In future, an ensemble of DL-based models can be developed to significantly boost the classification results of SOSDL-ODC model.
Funding Statement: The Deanship of Scientific Research (DSR) at King Abdulaziz University (KAU), Jeddah, Saudi Arabia has funded this project, under grant no KEP-1-120-42.
Conflicts of Interest: The authors declare that they have no conflicts of interest to report regarding the present study.
References
1. X. Wang, L. Wang, W. Xu, X. Wang, D. Ke et al., “Classification of osteosarcoma based on immunogenomic profiling,” Frontiers in Cell and Developmental Biology, vol. 9, pp. 696878, 2021. [Google Scholar]
2. M. D’Acunto, M. Martinelli and D. Moroni, “From human mesenchymal stromal cells to osteosarcoma cells classification by deep learning,” Journal of Intelligent & Fuzzy Systems, vol. 37, no. 6, pp. 7199–7206, 2019. [Google Scholar]
3. G. Djuričić, J. S. Vasiljević, D. J. Ristić, R. Z. Kovačević, D. V. Ristić et al., “Prediction of chemotherapy response in primary osteosarcoma by use of the multifractal analysis of magnetic resonance images,” Iranian Journal of Radiology, vol. 15, no. 2, pp. 174, 2018. [Google Scholar]
4. J. Wang, Z. Du, R. Yang, X. Tang and W. Guo, “Lateral malleolus en bloc resection for the distal fibula osteosarcoma based on a new classification and proposed reconstruction choice: Analysis of 6 cases prognosis and literature review,” Foot and Ankle Surgery, vol. 26, no. 8, pp. 855–863, 2020. [Google Scholar]
5. J. Zhong, L. Si, J. Geng, Y. Xing, Y. Hu et al., “Chondromyxoid fibroma-like osteosarcoma: A case series and literature review,” BMC Musculoskeletal Disorders, vol. 21, no. 1, pp. 53, 2020. [Google Scholar]
6. S. J. Badashah, S. S. Basha, S. R. Ahamed and S. P. V. Subba Rao, “Fractional-harris hawks optimization-based generative adversarial network for osteosarcoma detection using renyi entropy-hybrid fusion,” International Journal of Intelligent Systems, vol. 36, no. 10, pp. 6007–6031, 2021. [Google Scholar]
7. H. B. Arunachalam, R. Mishra, O. Daescu, K. Cederberg, D. Rakheja et al., “Viable and necrotic tumor assessment from whole slide images of osteosarcoma using machine-learning and deep-learning models,” PLOS ONE, vol. 14, no. 4, pp. e0210706, 2019. [Google Scholar]
8. K. Shankar, E. Perumal, M. Elhoseny, F. Taher, B. B. Gupta et al., “Synergic deep learning for smart health diagnosis of COVID-19 for connected living and smart cities,” ACM Transactions on Internet Technology, vol. 22, no. 3, pp. 1–14, 2022. [Google Scholar]
9. K. Shankar, E. Perumal, V. GarcíaDíaz, P. Tiwari, D. Gupta et al., “An optimal cascaded recurrent neural network for intelligent COVID-19 detection using Chest X-ray images,” Applied Soft Computing, vol. 113, no. 8, pp. 107878, 2021. [Google Scholar]
10. D. N. Le, V. S. Parvathy, D. Gupta, A. Khanna, J. J. P. C. Rodrigues et al., “IoT enabled depthwise separable convolution neural network with deep support vector machine for COVID-19 diagnosis and classification,” International Journal of Machine Learning and Cybernetics, vol. 12, no. 11, pp. 3235–3248, 2021. [Google Scholar]
11. J. Zhong, C. Zhang, Y. Hu, J. Zhang, Y. Liu et al., “Automated prediction of the neoadjuvant chemotherapy response in osteosarcoma with deep learning and an MRI-based radiomics nomogram,” European Radiology, vol. 36, no. 2, pp. 188, 2022. [Google Scholar]
12. P. Bansal, K. Gehlot, A. Singhal and A. Gupta, “Automatic detection of osteosarcoma based on integrated features and feature selection using binary arithmetic optimization algorithm,” Multimedia Tools and Applications, vol. 81, no. 6, pp. 8807–8834, 2022. [Google Scholar]
13. L. Shuai, X. Gao and J. Wang, “Wnet ++: A nested w-shaped network with multiscale input and adaptive deep supervision for osteosarcoma segmentation,” in 2021 IEEE 4th Int. Conf. on Electronic Information and Communication Technology (ICEICT), Xi’an, China, pp. 93–99, 2021. [Google Scholar]
14. D. M. Anisuzzaman, H. Barzekar, L. Tong, J. Luo and Z. Yu, “A deep learning study on osteosarcoma detection from histological images,” Biomedical Signal Processing and Control, vol. 69, no. 5, pp. 102931, 2021. [Google Scholar]
15. R. Mishra, O. Daescu, P. Leavey, D. Rakheja and A. Sengupta, “Convolutional neural network for histopathological analysis of osteosarcoma,” Journal of Computational Biology, vol. 25, no. 3, pp. 313–325, 2018. [Google Scholar]
16. Q. Xiang, X. Wang, R. Li, G. Zhang, J. Lai et al., “Fruit image classification based on Mobilenetv2 with transfer learning technique,” in Proc. of the 3rd Int. Conf. on Computer Science and Application Engineering, New York, United States, pp. 1–7, 2019. [Google Scholar]
17. N. Metawa, I. V. Pustokhina, D. A. Pustokhin, K. Shankar and M. Elhoseny, “Computational intelligence-based financial crisis prediction model using feature subset selection with optimal deep belief network,” Big Data, vol. 9, no. 2, pp. 100–115, 2021. [Google Scholar]
18. K. Shankar, S. N. Mohanty, K. Yadav, T. Gopalakrishnan and A. M. Elmisery, “Automated COVID-19 diagnosis and classification using convolutional neural network with fusion based feature extraction model,” Cognitive Neurodynamics, vol. 51, no. 2, pp. 854, 2021. [Google Scholar]
19. I. V. Pustokhina, D. A. Pustokhin, E. L. Lydia, P. Garg, A. Kadian et al., “Hyperparameter search based convolution neural network with Bi‐LSTM model for intrusion detection system in multimedia big data environment,” Multimedia Tools and Applications, vol. 13, no. 5, pp. 111, 2021. [Google Scholar]
20. A. E. Ezugwu and D. Prayogo, “Symbiotic organisms search algorithm: Theory, recent advances and applications,” Expert Systems with Applications, vol. 119, no. 6, pp. 184–209, 2019. [Google Scholar]
21. C. Xu, J. Shen, X. Du and F. Zhang, “An intrusion detection system using a deep neural network with gated recurrent units,” IEEE Access, vol. 6, pp. 48697–48707, 2018. [Google Scholar]
22. P. Leavey, A. Sengupta, D. Rakheja, O. Daescu, H. B. Arunachalam et al., “Osteosarcoma data from ut southwestern/ut dallas for viable and necrotic tumor assessment [Data set],” The Cancer Imaging, vol. 14, 2019. [Google Scholar]
23. R. A. Nabid, M. L. Rahman and M. F. Hossain, “Classification of osteosarcoma tumor from histological image using sequential RCNN,” in 2020 11th Int. Conf. on Electrical and Computer Engineering (ICECE), Dhaka, Bangladesh, 2020. [Google Scholar]
24. I. Ahmed, H. Sardar, H. Aljuaid, F. A. Khan, M. Nawaz et al., “Convolutional neural network for histopathological osteosarcoma image classification,” Computers, Materials & Continua, vol. 69, no. 3, pp. 3365–3381, 2021. [Google Scholar]
Cite This Article
 Copyright © 2023 The Author(s). Published by Tech Science Press.
This work is licensed under a Creative Commons Attribution 4.0 International License , which permits unrestricted use, distribution, and reproduction in any medium, provided the original work is properly cited.
 Downloads
 Citation Tools