
 Submit a Paper
 Propose a Special lssue
 Open Access
ARTICLE

A Three-Dimensional Real-Time Gait-Based Age Detection System Using Machine Learning
1 Department of Computer Science & IT, University of Malakand, Chakdara, 18800, Pakistan
2 Department of Software Engineering, University of Malakand, Chakdara, 18800, Pakistan
3 College of Computer Science, King Khalid University, Abha, 62529, Saudi Arabia
4 Faculty of Computer and Information Systems, Islamic University of Madinah, Madinah, 42351, Saudi Arabia
5 Department of Statistics, Abdul Wali Khan University, Mardan, 23200, Pakistan
* Corresponding Author: Muhammad Azhar. Email:
Computers, Materials & Continua 2023, 75(1), 165-182. https://doi.org/10.32604/cmc.2023.034605
Received 21 July 2022; Accepted 12 October 2022; Issue published 06 February 2023
 View Full Text
 Download PDF
Abstract
Human biometric analysis has gotten much attention due to its widespread use in different research areas, such as security, surveillance, health, human identification, and classification. Human gait is one of the key human traits that can identify and classify humans based on their age, gender, and ethnicity. Different approaches have been proposed for the estimation of human age based on gait so far. However, challenges are there, for which an efficient, low-cost technique or algorithm is needed. In this paper, we propose a three-dimensional real-time gait-based age detection system using a machine learning approach. The proposed system consists of training and testing phases. The proposed training phase consists of gait features extraction using the Microsoft Kinect (MS Kinect) controller, dataset generation based on joints’ position, pre-processing of gait features, feature selection by calculating the Standard error and Standard deviation of the arithmetic mean and best model selection using R2 and adjusted R2 techniques. T-test and ANOVA techniques show that nine joints (right shoulder, right elbow, right hand, left knee, right knee, right ankle, left ankle, left, and right foot) are statistically significant at a 5% level of significance for age estimation. The proposed testing phase correctly predicts the age of a walking person using the results obtained from the training phase. The proposed approach is evaluated on the data that is experimentally recorded from the user in a real-time scenario. Fifty (50) volunteers of different ages participated in the experimental study. Using the limited features, the proposed method estimates the age with 98.0% accuracy on experimental images acquired in real-time via a classical general linear regression model.Keywords
Age is a significant human characteristic that can be used to evaluate a person’s identification, security, and health [1]. Because of its significance, age evaluation cannot be based solely on human perception [2]. Automatic age evaluation uses a person’s physical characteristics to determine their appropriate age or range of ages [3]. A person’s age can be classified into two categories: apparent age, which is based on physical characteristics and the person’s real age, which is the person’s actual age [4]. For age classification using biometric features, a lot of research has been carried out via face images [5–12] and gait [13–21]. Age Classification using face images has many applications in a variety of fields, like the prevention and age verification of cybercrime in the gaming industry. Face-based age estimation is divided into two categories, such as age prediction and face representation. Face representation uses shallow appearance, local binary patterns, and bionic features [22–25]. This is a classification or regression problem to obtain feature representations of each facial image for age estimation. As a result, age estimation using a facial image presents challenges for the traditional age estimation technique. The primary drawback of the current method is that face-based prediction performance depends on image quality and face exposure. Face-based age estimation has applications in security, entertainment, human-computer interface, and audiovisual. However, due to factors like a mask covering the face, face makeup, and plastic surgery, existing face-based age detection algorithms are not very accurate. Age estimation using face images is not feasible for live surveillance because most security cameras only produce limited texture information. On the other hand, human gait is unique and recognized as a behavioral biometric feature. Human gait is defined by two essential characteristics: walking style and posture [26]. Walking is a voluntary activity, although the overall gait is controlled by the nervous system [27]. A type of behavioral biometric that can be trained to predict human age is gait. Gait age is the age determined by a person’s gait, as compared to chronological age, which reflects the person’s actual age [27]. Gait has received a lot of attention recently due to the invasiveness of video monitoring. Comparing gait to other biometrics, there are a number of benefits. For instance, it can be recognized from a distance. Additionally, gait patterns discovered through videos and images is difficult to conceal. The gait-based features don’t require subject cooperation or high-resolution images. However, using gait to extract gait features is a challenging task. For age estimation using gait, different systems have been proposed so far [28–32]. The research work carried out in the area has certain limitations, like specific age limits and image- or video-based classification. Some of the researchers have classified the age group into children, adults, and older people, which is obviously a restricted age-based classification [33]. Similarly, Davis [28] categorized the age group into children and adults, while Begg et al. [34] categorized them into younger and elder people. Due to increasing age variances, which have a negative effect on the estimation’s accuracy, all of these works have produced significant estimation errors. The proposed efforts must overcome these constraints and produce an accurate estimation of the age group in the real environment in order to be effective. This is due to the limited scope of these research works. It ensures real-based estimation while overcoming the issues with image/video-based estimation and a limited age range.
The structure of this paper is as follows: In Section 2, the literature review is covered, Section 3 presents the proposed system, and Experimental work is described in Part 4. Section 5 describes the comparison to the state of the art, and finally, Section 6 described the conclusion.
Age Calculation using gait is a modern research, therefore, limited investigations have been carried out so far. The first study on this area was published by Lu et al. [35]. An effective encoding strategy is used to transform individual age values into binary format. A multi-label guided (MLG) technique was developed using gait energy images (GEIs) to combine the age information for age estimation. In order to estimate age using face images, the authors reported a baseline algorithm [32,36]. Lu et al. [37] presented a manifold analysis technique to estimate age. Similarly, another study estimates human age by integrating gait and facial data [38]. These Studies all used a single-group independent estimating model, which increased estimation errors as the age variation increases. To achieve better accuracy and to handle the problems faced by a single group independent estimation model, the authors in [39] proposed a group dependent method for Estimating human age using gait. Similarly, Davis [28] estimated human age using different gait features, such as stride width, frequency, and leg length. Human ages have been classified by Begg et al. [34] into younger (28.4 mean age) and old (69.2 mean age) people. Through many features, such as height, leg length, and the relationship between the head and body, the authors in [40] categorized human ages into children and adults. Similarly, the authors in [40] divided human ages into three categories: young children (under 15), adults (15–65), and the elderly (after 65 years). Through the use of computer vision methods, gait features can be extracted from images or videos, including the walking patterns of people. Model-based or model-free features based on computer vision. Model-based features are achieved through testing Body parameters in the images or video. Different approaches have been proposed so far using a model-based approach. The authors in [40,41] used many biological studies and various features for age classification. Children’s upper limbs are shorter and closer to the ground than those of adults, according to age classifications performed on children by Ince et al. [30]. For the first time, Davis [28] took the opportunity to categorize ages using just 15 participants. Begg et al. [34] used Support Vector Machines (SVM) to classify Ages based on minimum foot clearance. For the purpose of classifying a person as a kid or an adult, Lu et al. [35] retrieved various parameters, including stride length, speed, body length, leg length, and head-to-body ratio. Aderinola et al. [42] retrieved many parameters for age identification with 96% accuracy, including step length, upper limbs, gait speed, and length of lower limps. In contrast, model-free gait features are referred to as Appearance-based features since they stress a person’s physical characteristics in videos or images. The two fundamental methods used in model-free feature extraction are background subtraction and silhouette generation. Different approaches for age Estimations have been proposed by the researchers so far using model-free approaches. Sakata et al. [15] used a large gait dataset, which contained more than 60,000 people for the age estimation. Makihara et al. [32] used a deep residual network for the multitasking classification of subjects depends on gender and age. Sakata et al. [15] proposed a method for age prediction using confidence score. Xu et al. [43] used age estimation to discover participants and count age groupings. Abirami et al. [44] provided a technique for estimating age using height data. The age regression task was presented by Zhu et al. [45] as a sequence of binary age classifiers. Xu et al. [46] used the gait cycle’s silhouette for a small image to estimate age. The previous research mostly proposed facial/camera-based age estimation, and hence produce low accuracy due to limited texture information when face covered by mask. Because of the limited age range and high estimation errors in image-based estimation, the researchers recommended estimating age using gait.
The main contributions of the proposed research work as follows: (1) preparation of a new dataset for age estimation; (2) Extraction and selection of features using different statistical analyses such as T-test, ANOVA technique, R2 and adjusted R2 (adj-R2) techniques; (3) Using a simple linear regression model for the complex problem of age estimation. The proposed model is computationally optimal with very low computational cost and highest accuracy; (4) the proposed method can be applied in a real-time scenario for the new user, with data extracted from MS Kinect; (5) the proposed system is compared with the state-of-the-art system using different parameters such as accuracy, technique, and dataset used.
The proposed system consists of two main parts: training and testing. The proposed training phase consists of different components, i.e., extraction of Skeletal information through Microsoft Kinect (MS Kinect), dataset generation, Pre-processing, feature selection method, best model selection, and finally age Estimation is carried out using the best-fit model (see Fig. 1).
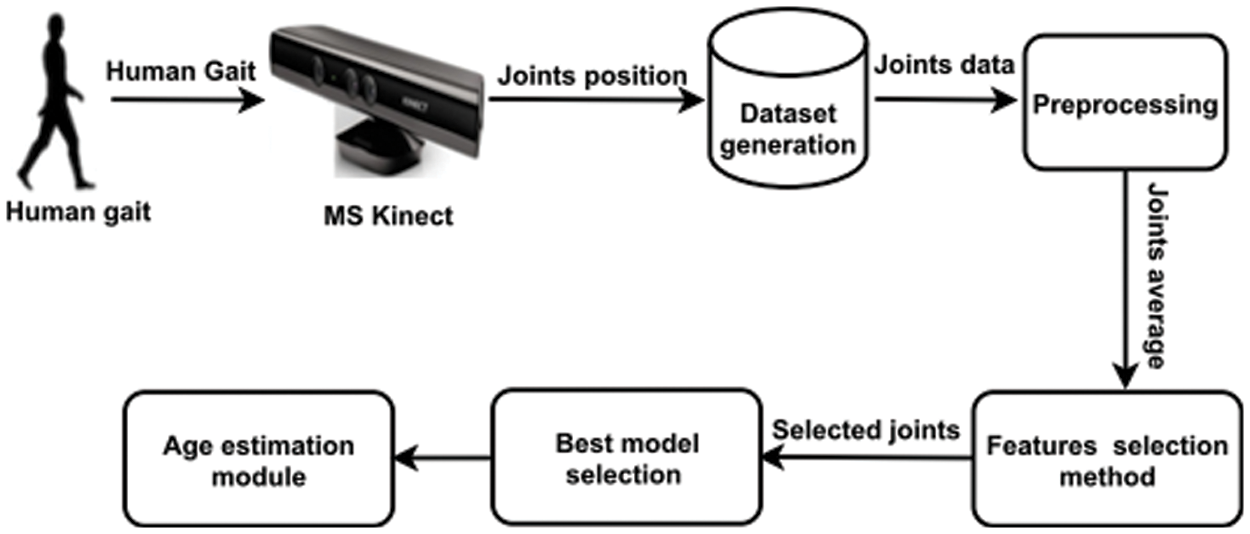
Figure 1: Detail system model of the proposed system
The proposed testing phase automatically estimates the age of a walking person in real-time using the results obtained from the training phase (See Fig. 2).
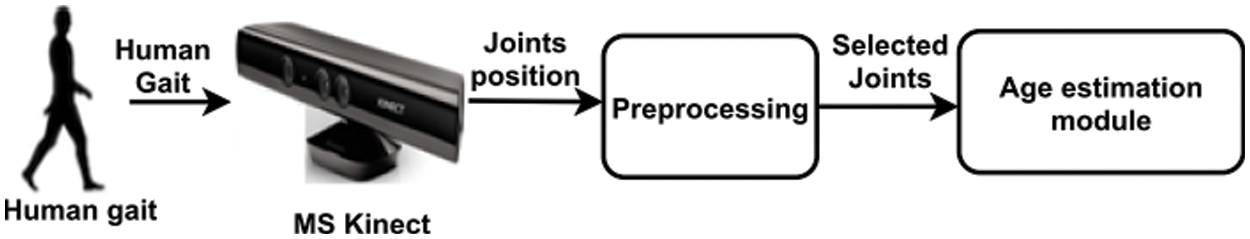
Figure 2: Schematic of our proposed system model

We created our own dataset because there were no other datasets that contained both skeleton joint position and were large enough gender information. In this research work, 273 individuals, all 7–70 years old, participated in the experiment. The authors asked each volunteer to walk in a free pose in different directions inside the Kinect recognition space (see Fig. 3).
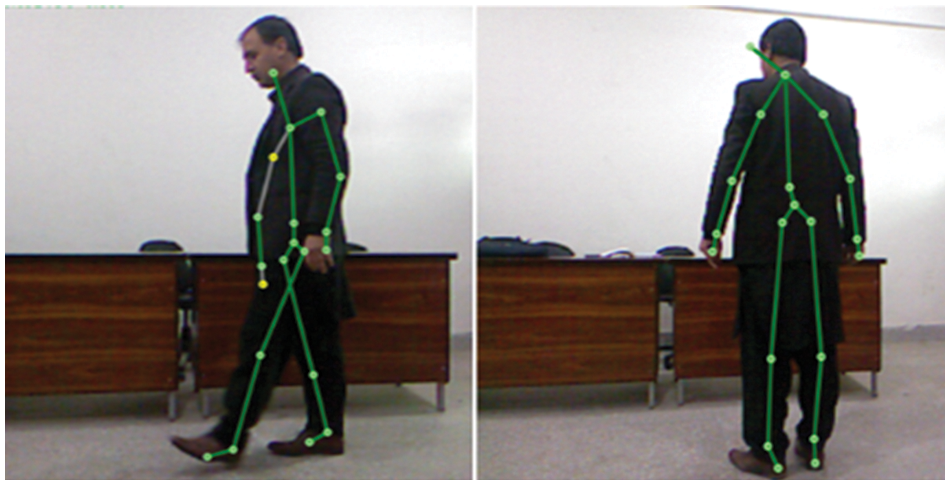
Figure 3: Walking directions of subjects from different directions
To record the 3D joints position from volunteers, a low-cost Microsoft Kinect V1 camera is used. The specification of the Kinect camera used in terms of resolution is (640 × 480). The depth information between the objects and the camera is captured by this sensor in addition to the conventional RGB image of the depicted object. The MS Kinect consists of a 3D depth sensor, a RGB camera, a tilt motor, and a Microsoft array as shown in Fig. 4a. Microsoft Kinect provides the complete set with 20 useful joints from head to feet as shown in Fig. 4b.
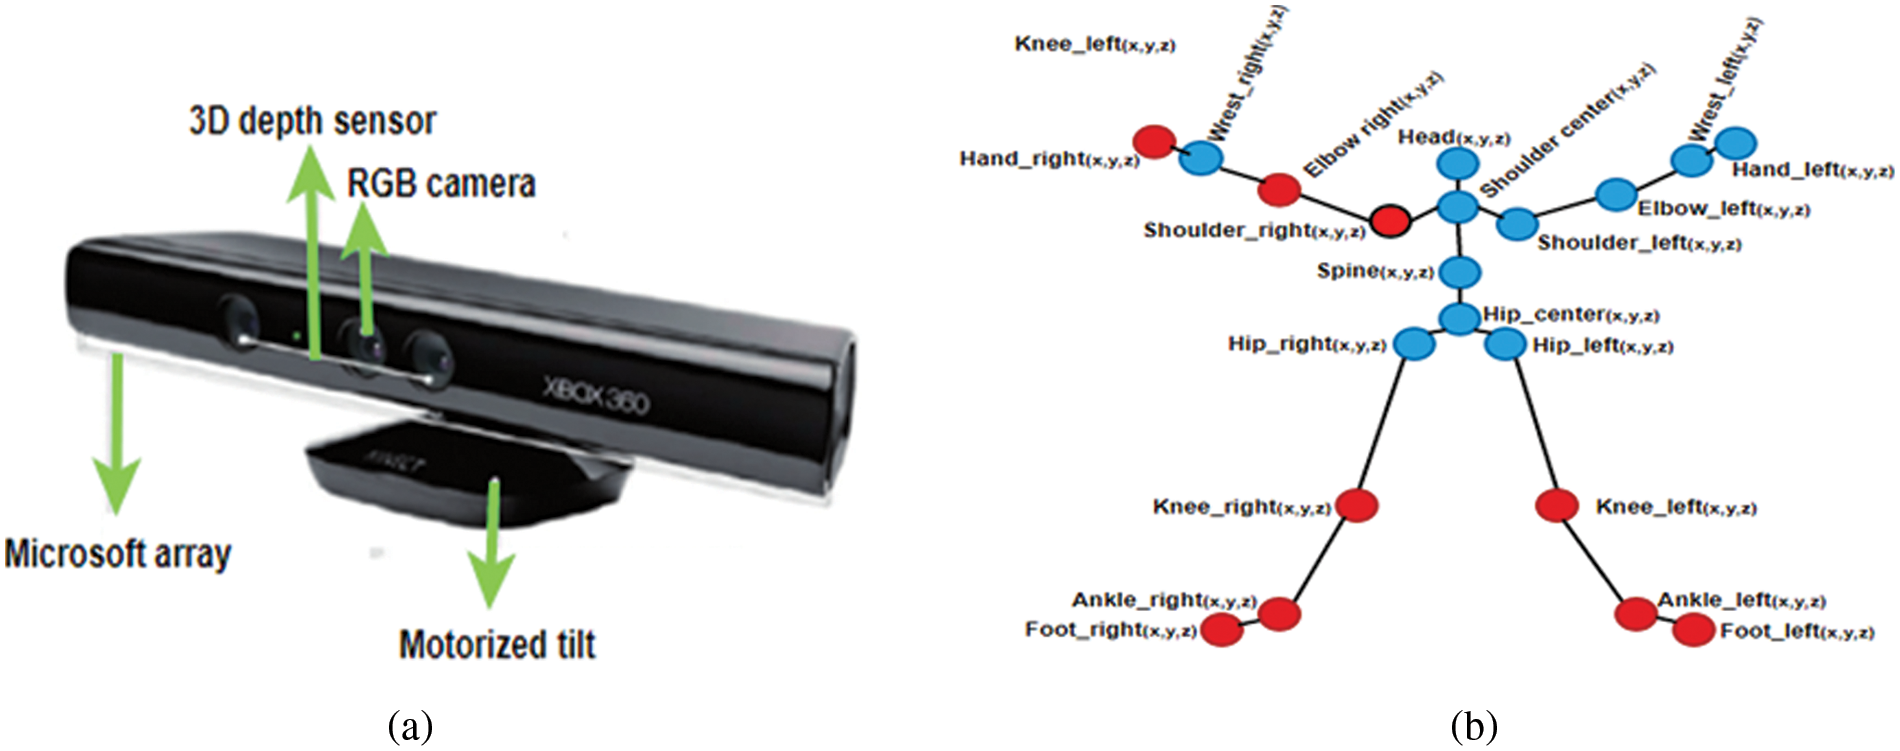
Figure 4: (a) Microsoft kinect sensor, (b) Different human joints
The accuracy of MS Kinect was tested by recording multiple records for each of the subjects. The measurement was determined from different distances and the optimal distance was determined to be 6 feet. The height and angle of the MS Kinect were 3.4 feet and 0 degrees at 30 frames per second (fps), respectively. All volunteers were free to take any action or position at any time. Because the average of all frames was used to extract the feature, there was no time limit.
The authors used 20 joints to capture the functionality in the classification phase. The position of the joint Pj is defined as: Pj = xi + yi + zi, where Pj = 1, 2, 3…20 and i = 1, 2, 3…n. In this phase, the extracted data is pre-processed before feeding the machine learning tools. Pre-processing includes calculating the arithmetic mean of joints for each axis, and then calculating the combined arithmetic mean for each joint.
3.2.1 Arithmetic Mean and Grand Arithmetic Mean of Joints
As the Kinect sensor provides 30 frames per second, approximately, and each joint position is represented in X, Y, and Z coordinates for each frame. Therefore, the arithmetic mean for joints is computed as
where
where,
All body features were evaluated collectively and individually for each classification method throughout the classification phase. However, using all body features in the classification can result in a lower percentage of accuracy. As each joint moves in X, Y, and Z coordinates, therefore all the combinations of 60 features were tested. On the other hand, to improve classification accuracy, it is important to combine the features according to best model selection criteria R2 and adjusted R2. The best model was identified based on the percentage of accuracy for most contributing joints. We checked each percentage of accuracy in the classification based on standard error. If the accuracy rate exceeds 90%, the individually classified feature will be selected and combined with the other selected features. Otherwise, the features were not added to the selected set of features. The standard error measures accuracy. Higher standard errors cause less accuracy. The standard error of the arithmetic mean for shoulder right-joint can be calculated as
where n is the size of data and S.E (
The standard error and standard deviation can be represented in the same way using Eqs. (3) and (4). The standard error shows the consistency of joints and P-value shows the significance of the joints. The lower the standard error, the higher will be the consistency. Similarly, the lower the p-value, the higher the significant level of joints. The standard errors and P-value of the joints: right shoulder, right elbow, left knee, right hand, left ankle, right knee, right ankle, right foot, and left foot are low, therefore, these joints are consistent and significant.
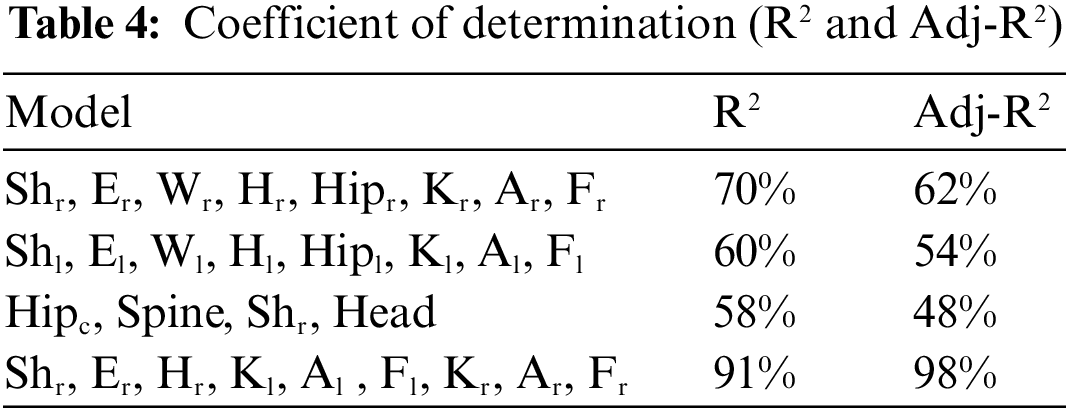
The coefficient of determination (R2) and (Adj – R2) techniques are used to select the best fitted model for age estimation. To determine the best fitted model for which R2 is high i.e., if R2 = 90%, then 90% age is explained by joints and 10% due to other factors such as height, etc. Mathematically, R2 can be written as
where
Where yi is the value of a walking person age,
where n is the size of persons and k is the number of parameters included in the model. The ranges of R2 and Adj-R2 lie between 0 and 1. When results of R2 and Adj-R2 are near to zero, tells us weak relationship and near to one, tells us strong relation between dependent (Joints) and independent variables (age).
The classification table for CLRM is used to find which human joints contribute the most to age detection. The most-contributed joints will be determined based on their accuracy. The most-contributed joints with an accuracy rate of more than 90% will be considered on the basis of standard error. Normally, the relationship among variables is direct, inverse and curving. To capture the relationship between variables, classical linear regression models (CLRM) are widely used. The linear relationship between one of the dependent variables, and one or more of the independent variables is known as regression. The CLRM is used when the dependent variable is continuous and follows normal distribution. In this study, the dependent variable is the age of a walking person and is continuous, which satisfies the important assumption of normality. Also, the Independent variables are the contributions or movements of 20 different human joints during gait. The results show that only nine joints out of twenty joints are the most heavily contributed joints in age estimation.
The CLRM is mathematically defined as
where Yi is the dependent variable, β0 is intercept form, βi are the slop parameter, Xi s are independent variables, and
3.5.1 Estimation of Model Procedures
Estimating the model parameters of the classical linear model (CLM) is one of the key requirements. The least square is used because the least square estimators are more accurate and effective for estimating a model’s unknown parameters. We can write the CLRM in the form of matrices as
Taking β0, β1, β2…βp common
where
Also
Now the least squares normal equations
By solving Eqs. (16)–(18), will give the OLS (ordinary least square) estimators.
3.5.2 Testing Hypothesis of Regression Coefficients
The hypothesis about regression coefficients is either significant or insignificant, i.e.,
To predict the age of a walking person on the basis of data obtained form 3D Kinect and regression, the CLRM is used. For calculating the age of a single subject, CLRM can be written as
where β0 ,β1 . . . β9 are the least square estimators and
An experimental study is conducted on a self-created dataset that contains gait features of 273 subjects. As we are interested in age factors, this dataset has age ranges from 7 to 70 years. There are several advantages of this dataset. This dataset is larger in size than the other self created dataset, providing enough subject detail for almost all the tests. Beside, a wide range of ages also gives an ideal dataset for testing the result. Furthermore, the dataset is consisted of 3D joint positions, while other contains 2D joint data. Therefore, the proposed dataset is ideal and verify the reliability of the proposed system. We carried out experimental analyses to assess the accuracy of different joints set for the age classification.
To ensure that the proposed system is feasible, we carried out an experiment via MS Kinect. We placed Kinect on a table of 3.0 feet height. Fifty (50) volunteer subjects participated in the experimental study. The path and direction to be followed during the experiment were initially demonstrated to the subjects. The task consisted of casual walking of a subject in front of the MS Kinect in a horizontal direction while following a predetermined path in the Kinect recognition space (see Fig. 5).
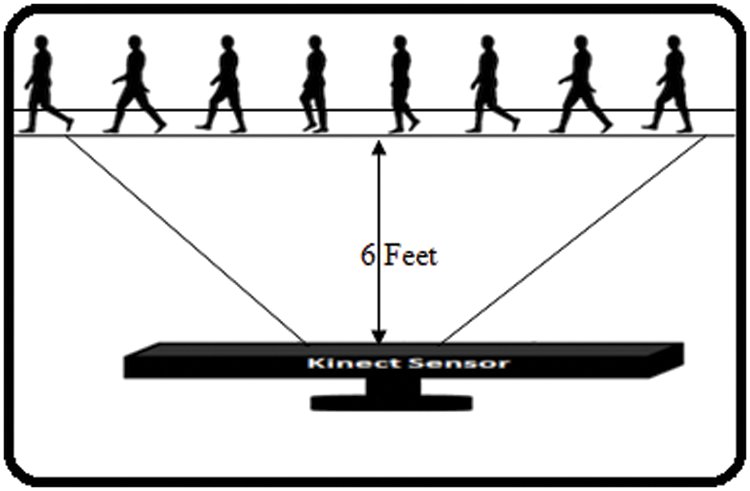
Figure 5: Walking directions of subject
As a classification method, we used CLRM because age is a continuous variable. For testing the validity of the CLRM, the ANOVA test is used, and all our data seem relevant and highly significant.
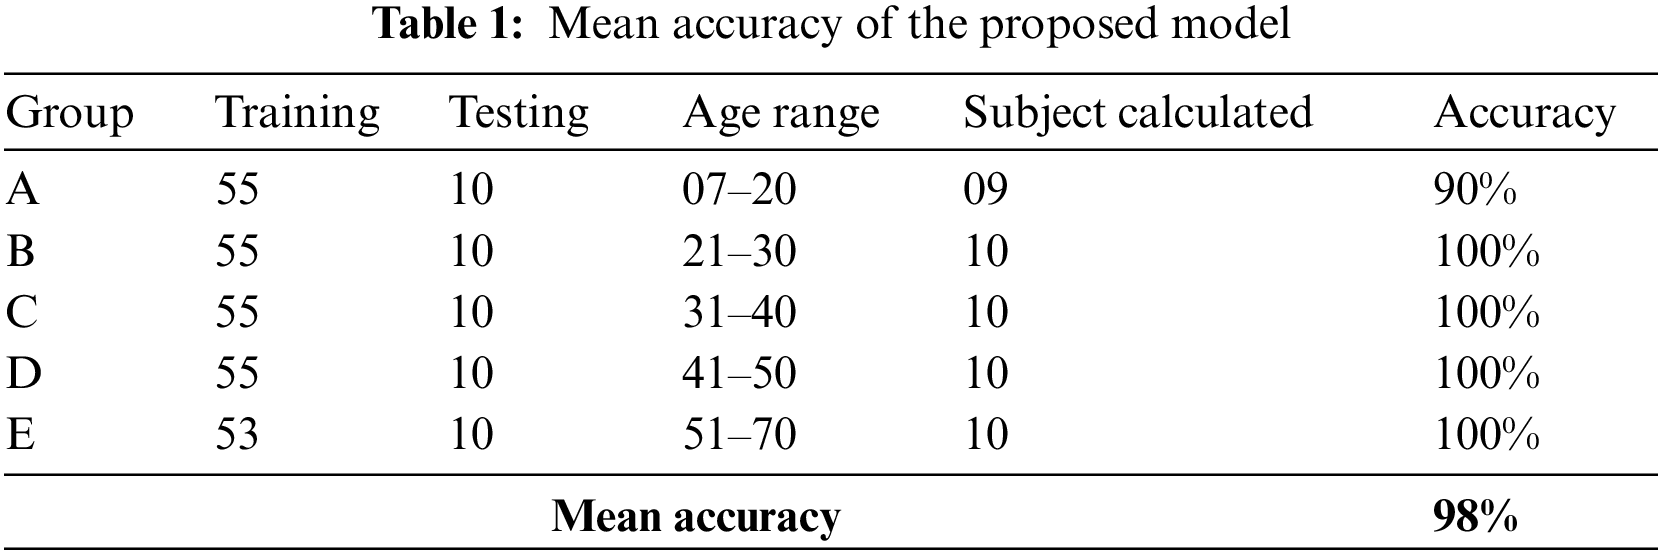
The results are presented in this section from the experimental evaluation. To test the validity of the proposed system, we performed different experiments using 50 walking subjects in different directions inside the Kinect recognition space. Before starting the experiment, the actual ages of the subjects were recorded. All of the subjects were assigned to one of five groups: A, B, C, D, or E (See Table 1). Each group consisted of 10 subjects each with an age range of 7 to 70 years.
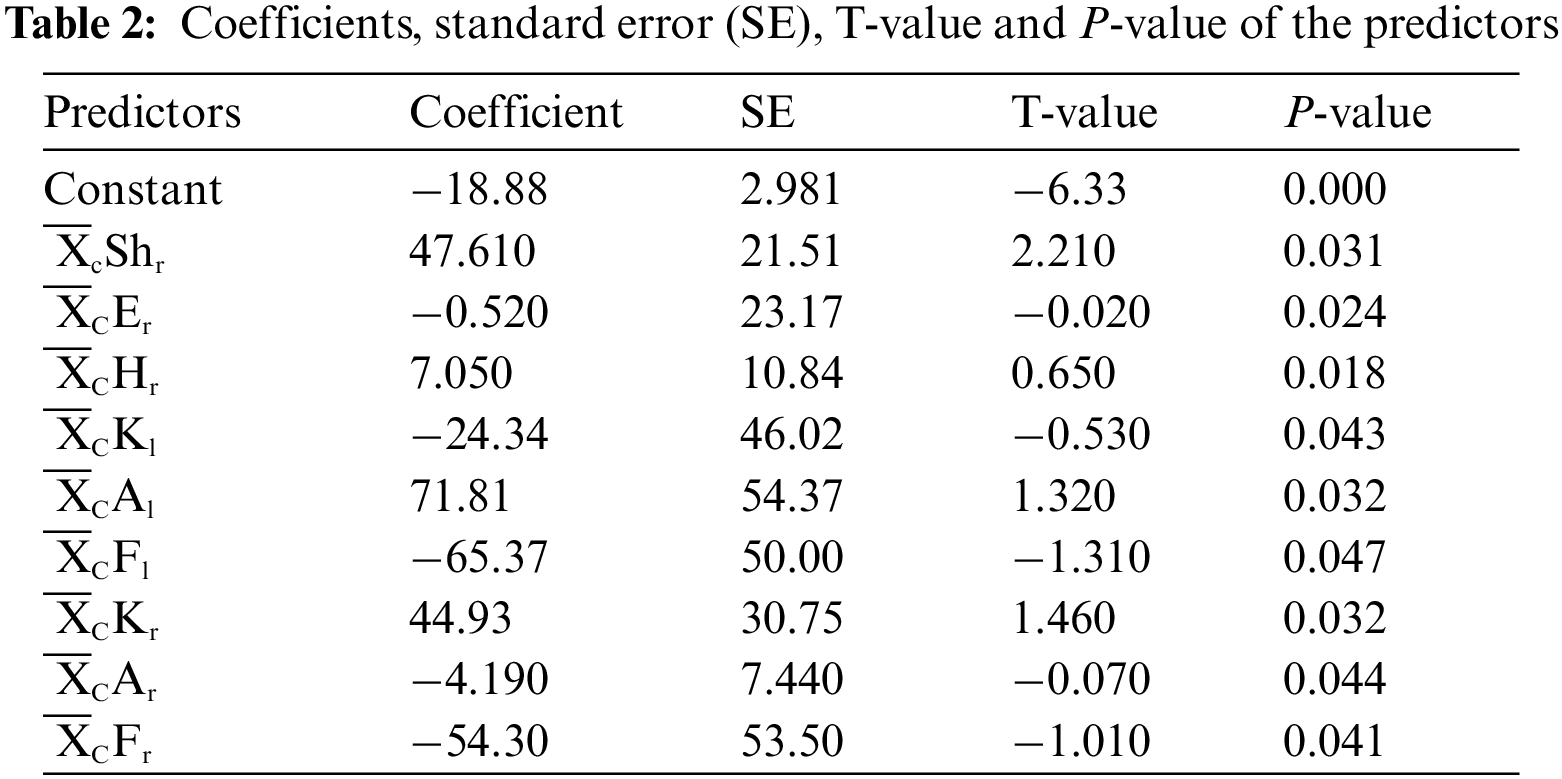
4.2.1 Analysis Based on T-Test
The T-test is used to determine the importance of a specific joints. In Table 2,
4.2.2 Analysis of Variance (ANOVA) for the Best Fitted Model
To test the significance of more than two joints simultaneously, ANOVA technique is used. From Table 3, all joints included in the model are significant because the P-value for the over all model is 0.000. It suggests that these 9 joints play an important role in the age estimation.
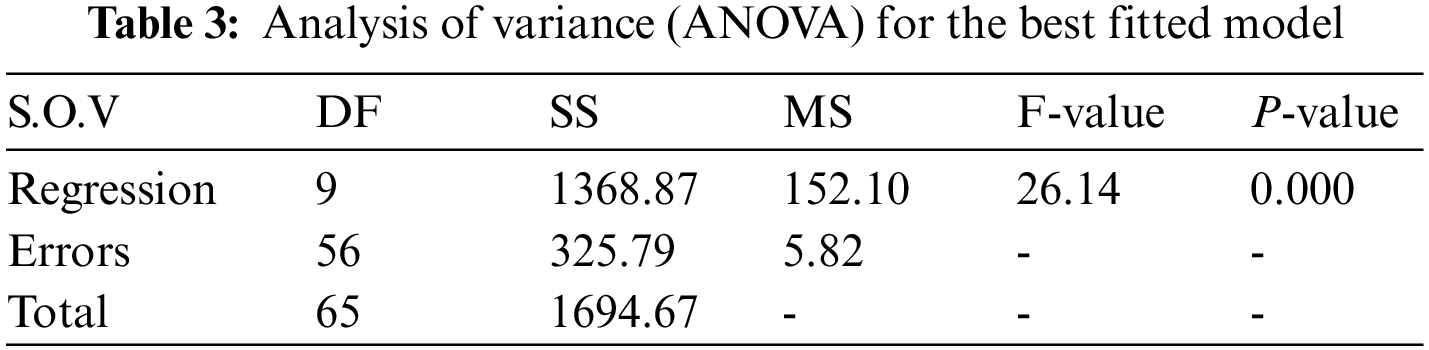
Where, DF is the degree of freedom and SS is the sum of square for regression, MS is the mean square, and F-value is the calculated value of F-statistic. In Table 4, the results of the models are compared by R2 and Adj-R2, which show higher accuracy of 88% and 91%, respectively. It means that only nine joints play significant role in the age estimation of a walking person.
The screen shorts of experiments 1, 2, 3 and 4 are shown in Fig. 6a, while experiment 5 is shown in Fig. 6b. In experiment 1, the subject walked in front of the MS Kinect from left to right. The program recorded the values of the most-contributed joints as 0.9910, 0.8631, 0.7292, 0.6613, 0.5884, 0.5515, 0.7116, 1.6217 and 0.5828 respectively; therefore, the age of the walking subject is recorded as 17 years. In experiment 2, the subject walked in front of the MS Kinect and the program recorded the age of a walking subject as 19 years. In experiment 3, the subject walked from right to left and the recorded age is 26 years. Similarly, in experiment 4, the recorded age is 34 years. In experiment 5, the walking subject in the real environment is shown and the recorded age is 40 years (Fig. 6b).
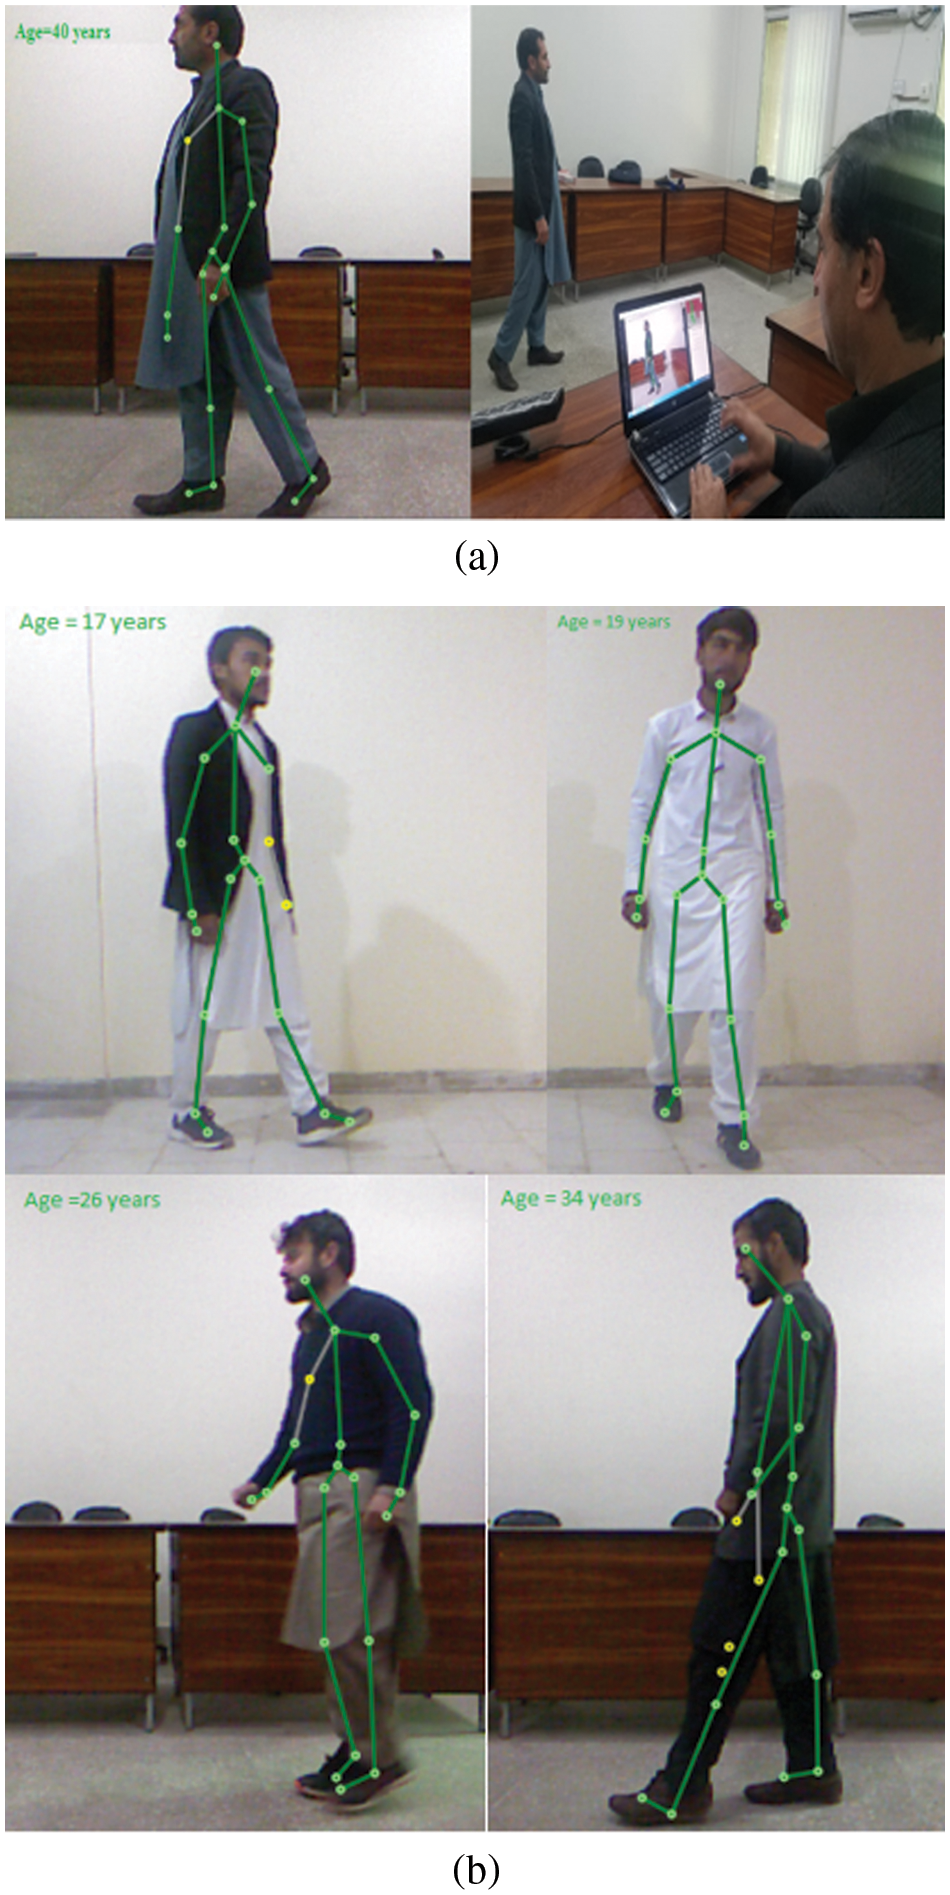
Figure 6: (a) Age calculation of walking subject, (b) Age calculation in real environment
The difference between observed age yi and estimated age
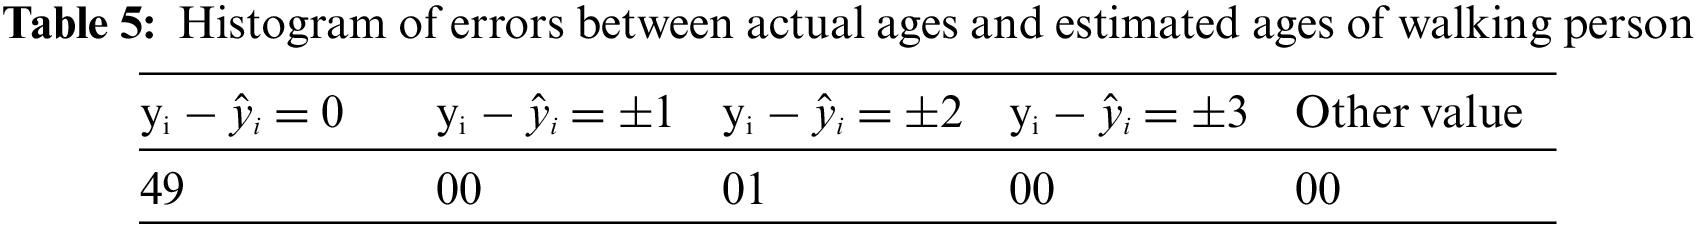
There are forty-nine observations for which the difference is zero between the observed value and the estimated age of a walking person. On the other hand, there is one observation for which the difference is 2. The results indicate the applicability of the model for age estimation of the walking persons.
The relationship between the estimated ages of a walking person with the most-contributed joints is shown in Fig. 7.
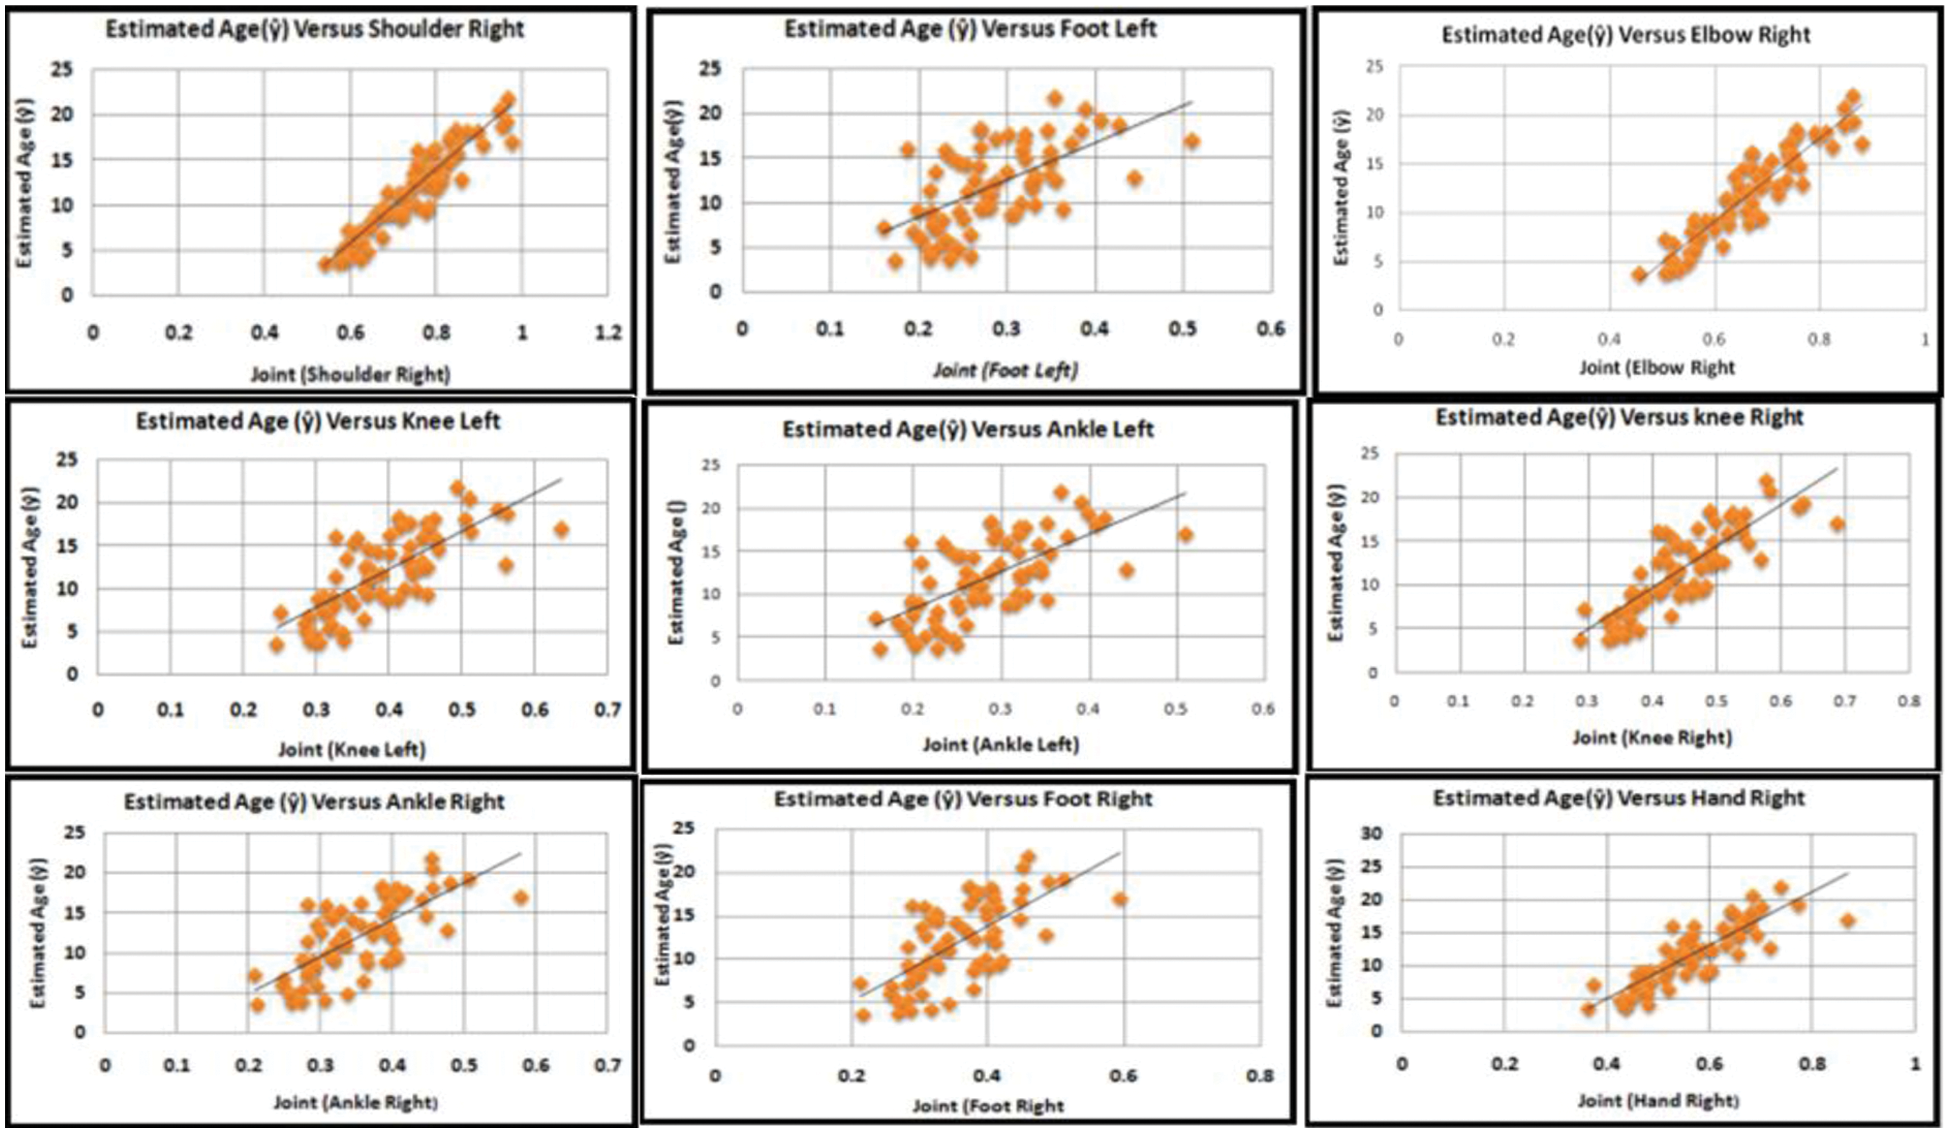
Figure 7: Scatter plot against the most-contributed joints
The model shows a linear relationship between estimated ages,
From Fig. 7, the fitted general linear model shows a linear and positive relationship between the estimated ages of a walking person and the joint ankle-right, while the observations are spread about the line and show a slight variation between the age of a walking person and the joint ankle-right. On the other hand, age of a walking person increases with the increase in average value of joint foot. There is a direct relationship between age and joint foot right and also observations are spread about the straight line
Similarly, there is a linear and direct relationship between estimated age and the right hand joint during walking. As the average value of the right hand joint, increases with the increase in age of a walking person. Also, the observations are clustered around the fitted line and show less variation as compared to other joints. There is a linear and direct relationship between the estimated age and all the joints under consideration. This means that the average value of joints increases with the increase in age of a walking person.
This research work aims to calculate the age of a walking person on the basis of the 3D Kinect and general linear regression models. First, the authors have considered all the possible joints for the age prediction of walkers. With the help of the best model selection criteria R2 and adjusted R2, the authors then used the most significant or contributing joints of a walking person for the estimation of age. The highly contributed joints are shoulder right, hand right, elbow right, knee right, knee left, ankle right, ankle left, foot left and right, which predict the age of a walking person. Table 3 provides the individual joint results as coefficients of model, sum of squares, mean squares, and P-value. The coefficient of determination (R2) for the proposed model is 91% and the adjusted R2 is 88% (see Table 4). The model shows higher accuracy for the age estimation of a walking person. The best model is one for which R2 is high, which is decided on the basis of R2. As the P-value for all joints is less than 0.05, this means that these joints are significant at a 5% level of significance. For the analysis, the authors consider only 50 walking persons. The method of ordinary least squares and the matrix approach were used to estimate the model parameters. A scatter diagram shows a linear relationship between estimated age and the most significant joints of a walking person.
5 Comparative Studies with the State-of-the-Art System
We compared the proposed system with the existing approaches of gait-based age classification according to dataset, technique, and accuracy. All the existing approaches generated their own dataset, but Zhang et al. [47], produced comparatively large dataset with a maximum of 205 subjects (see Table 6).
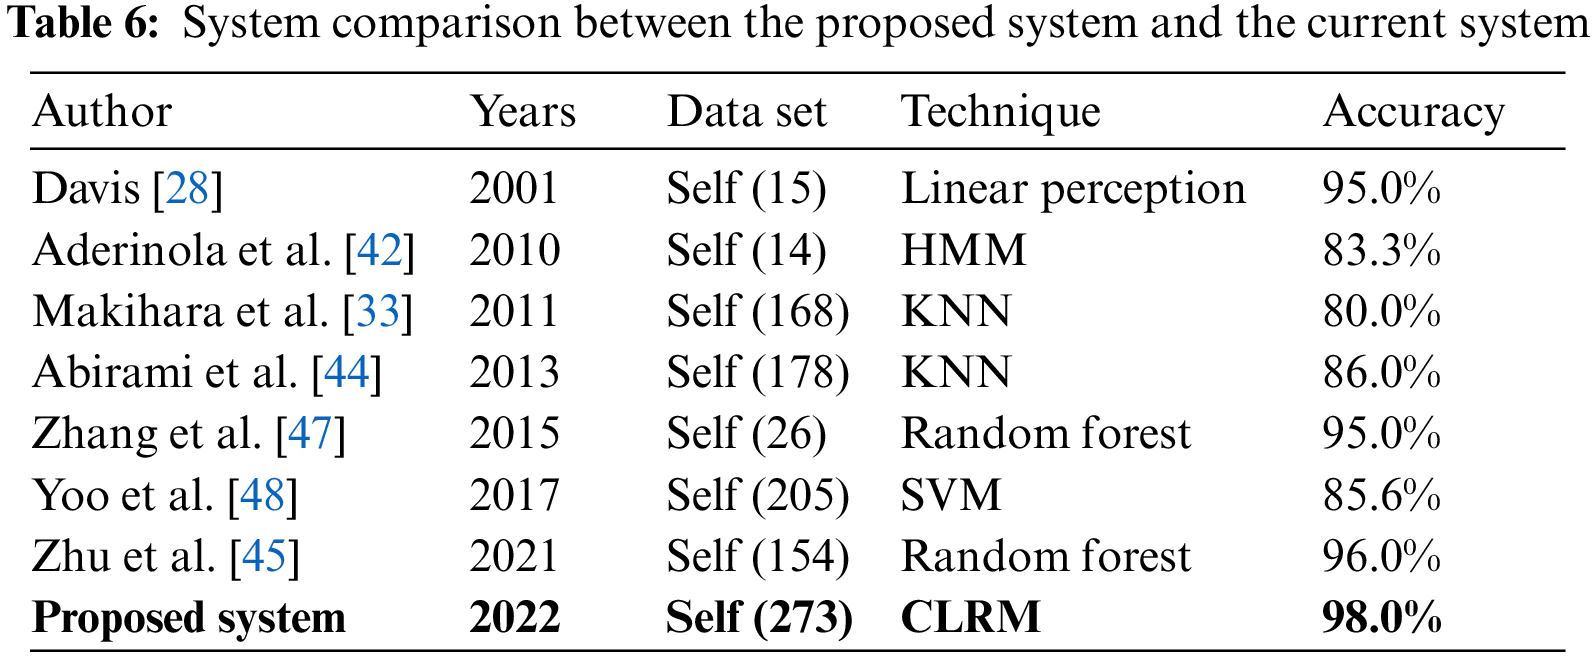
The proposed method presented a large dataset with 273 subjects. The maximum accuracy in the existing approaches is 96%, while the proposed system shows 98.0% accuracy. Therefore, the proposed system is efficient in terms of accuracy and the dataset used.
This research paper proposes a novel method for age detection via gait-based 3D joint position. Our main contribution is that the age of walking subject is automatically detected in real-time via MS Kinect. The second contribution is the collection of a unique dataset of 3D skeleton joint position data, which is available on request. On the basis of a dataset generated from 273 people ranging in age from 7 to 70 years, the best age detection performance of 98.0% was achieved using CLRM, and 9 selected features (right shoulder, right elbow, right hand, left knee, right knee, right ankle, left ankle, left foot and right foot). The experimental result of the proposed approach proved that the proposed system was different from the existing approaches in terms of large datasets used, limited features, and high accuracy. Moreover, in future, the security measures can be further improved through intensive investigations of both gender and age of the walker with a single and limited set of joints. The study recommends the use of the same model for the exact identification of the person in future works apart from the recognition of age and gender only.
Acknowledgement: The authors acknowledge the support from the Deanship of Scientific Research, King Khalid University for funding this work through Large Groups RGP.2/212/1443.
Funding Statement: The authors extend their appreciation to the Deanship of Scientific Research at King Khalid University for funding this work through Large Groups RGP.2/212/1443.
Conflicts of Interest: The authors declare that they have no conflicts of interest to report regarding the present study.
References
1. T. B. Aderinola, T. Connie, T. S. Ong, W. C. Yau and A. B. J. Teoh, “Learning age from gait: A survey,” IEEE Access, vol. 9, pp. 100352–100368, 2021. [Google Scholar]
2. S. Chen, M. Dong, J. Le and S. Barbat, “Understanding human aging patterns from a machine perspective,” in IEEE Conf. on Multimedia Information Processing and Retrieval (MIPR), Miami, FL, USA, pp. 226–231, 2018. [Google Scholar]
3. V. Vasavi, P. Vineela and S. V. Raman, “Age detection in a surveillance video using deep learning technique,” SN Computer Science, vol. 2, no. 4, pp. 1–11, 2021. [Google Scholar]
4. J. C. Xie and C. M. Pun, “Chronological age estimation under the guidance of age-related facial attributes,” IEEE Transactions on Information Forensics and Security, vol. 14, no. 9, pp. 2500–2511, 2019. [Google Scholar]
5. K. Y. Chang and C. S. Chen, “A learning framework for age rank estimation based on face images with scattering transform,” IEEE Transactions on Image Processing, vol. 24, no. 3, pp. 785–798, 2015. [Google Scholar]
6. Y. Dong, C. Lang and S. Feng, “General structured sparse learning for human facial age estimation,” Multimedia Systems, vol. 25, no. 1, pp. 49–57, 2019. [Google Scholar]
7. G. Guo, Y. Fu, C. R. Dyer and T. S. Huang, “Image-based human age estimation by manifold learning and locally adjusted robust regression,” IEEE Transactions on Image Processing, vol. 17, no. 7, pp. 1178–1188, 2008. [Google Scholar]
8. G. Guo, G. Mu, Y. Fu and T. S. Huang, “Human age estimation using bio-inspired features,” in IEEE Conf. on Computer Vision and Pattern Recognition, Miami, FL, USA, pp. 112–119, 2009. [Google Scholar]
9. H. T. Huynh and H. Nguyen, “Joint age estimation and gender classification of Asian faces using wide ResNet,” SN Computer Science, vol. 1, no. 5, pp. 1–9, 2020. [Google Scholar]
10. Q. Tian, W. Zhang, J. Mao and H. Yin, “Real-time human cross-race aging-related face appearance detection with deep convolution architecture,” Journal of Real-Time Image Processing, vol. 17, no. 1, pp. 83–93, 2020. [Google Scholar]
11. L. Wang, Z. He, B. Meng, K. Liu, Q. Dou et al., “Two-pathway attention network for real-time facial expression recognition,” Journal of Real-Time Image Processing, vol. 18, no. 4, pp. 1173–1182, 2021. [Google Scholar]
12. Y. Zhang and D. Y. Yeung, “Multi-task warped Gaussian process for personalized age estimation,” in IEEE Computer Society Conf. on Computer Vision and Pattern Recognition, San Juan, PR, USA, pp. 2622–2629, 2010. [Google Scholar]
13. X. Li, Y. Makihara, C. Xu, D. Muramatsu, Y. Yagi et al., “Gait energy response function for clothing-invariant gait recognition,” in Asian Conf. on Computer Vision, Taipei, Taiwan, pp. 257–272, 2016. [Google Scholar]
14. M. S. Nixon, T. Tan and R. Chellappa, “Human identification based on gait,” Springer Science & Business Media, vol. 4, pp. 176–188, 2010. [Google Scholar]
15. A. Sakata, Y. Makihara, N. Takemura, D. Muramatsu, Y. Yagi et al., “How confident are you in your estimate of a human age? Uncertainty-aware gait-based age estimation by label distribution learning,” in IEEE Int. Joint Conf. on Biometrics (IJCB), Houston, TX, USA, pp. 1–10, 2020. [Google Scholar]
16. A. Sakata, N. Takemura and Y. Yagi, “Gait-based age estimation using multi-stage convolutional neural network,” IPSJ Transactions on Computer Vision and Applications, vol. 11, no. 1, pp. 1–10, 2019. [Google Scholar]
17. S. Sarkar, P. J. Phillips, Z. Liu, I. R. Vega, P. Grother et al., “The humanid gait challenge problem: Data sets, performance, and analysis,” IEEE Transactions on Pattern Analysis and Machine Intelligence, vol. 27, no. 2, pp. 162–177, 2005. [Google Scholar]
18. W. Shen, Y. Guo, Y. Wang, K. Zhao, B. Wang et al., “Deep regression forests for age estimation,” in Proc. of the IEEE Conf. on Computer Vision and Pattern Recognition, Paris, France, pp. 2304–2313, 2018. [Google Scholar]
19. L. Wang, T. Tan, W. Hu and H. Ning, “Automatic gait recognition based on statistical shape analysis,” IEEE Transactions on Image Processing, vol. 12, no. 9, pp. 1120–1131, 2003. [Google Scholar]
20. C. Xu, Y. Makihara, X. Li, Y. Yagi and J. Lu, “Speed invariance vs. stability: Cross-speed gait recognition using single-support gait energy image,” in Asian Conf. on Computer Vision, Perth, Australia, pp. 52–67, 2016. [Google Scholar]
21. K. Zhang, N. Liu, X. Yuan, X. Guod, C. Gao et al., “Fine-grained age estimation in the wild with attention LSTM networks,” IEEE Transactions on Circuits and Systems for Video Technology, vol. 30, no. 9, pp. 3140–3152, 2019. [Google Scholar]
22. A. Günay and V. V. Nabiyev, “Age estimation based on AAM and 2D-DCT features of facial images,” International Journal of Computer Science and Applications, vol. 6, no. 2, pp. 113–119, 2015. [Google Scholar]
23. I. Huerta, C. Fernández, C. Segura, J. Hernando and A. Prati, “A deep analysis on age estimation,” Pattern Recognition Letters, vol. 68, pp. 239–249, 2015. [Google Scholar]
24. J. Lu, V. E. Liong and J. Zhou, “Cost-sensitive local binary feature learning for facial age estimation,” IEEE Transactions on Image Processing, vol. 24, no. 12, pp. 5356–5368, 2015. [Google Scholar]
25. A. S. Spizhevoi and A. V. Bovyrin, “Estimating human age using bio-inspired features and the ranking method,” Pattern Recognition and Image Analysis, vol. 25, no. 3, pp. 547–552, 2015. [Google Scholar]
26. C. Prakash, R. Kumar and N. Mittal, “Recent developments in human gait research: Parameters, approaches, applications, machine learning techniques, datasets and challenges,” Artificial Intelligence Review, vol. 49, no. 1, pp. 1–40, 2018. [Google Scholar]
27. Y. Ashkenazy, J. M. Hausdorff, P. C. Ivanov and H. E. Stanley, “A stochastic model of human gait dynamics,” Physica A: Statistical Mechanics and its Applications, vol. 316, no. 1–4, pp. 662–670, 2002. [Google Scholar]
28. J. W. Davis, “Visual categorization of children and adult walking styles,” in Int. Conf. on Audio-and Video-Based Biometric Person Authentication, Heidelberg, Germany, pp. 295–300, 2001. [Google Scholar]
29. J. Han and B. Bhanu, “Individual recognition using gait energy image,” IEEE Transactions on Pattern Analysis and Machine Intelligence, vol. 28, no. 2, pp. 316–322, 2005. [Google Scholar]
30. O. F. Ince, J. S. Park, J. Song and B. W. Yoon, “Child and adult classification using ratio of head and body heights in images,” International Journal of Computer and Communication Engineering, vol. 3, no. 2, pp. 106–120, 2014. [Google Scholar]
31. Z. Liu and S. Sarkar, “Simplest representation yet for gait recognition: Averaged silhouette,” in Proc. of the 17th Int. Conf. on Pattern Recognition, Cambridge, UK, vol. 4, pp. 211–214, 2004. [Google Scholar]
32. Y. Makihara, M. Okumura, H. Iwama and Y. Yagi, “Gait-based age estimation using a whole-generation gait database,” in Int. Joint Conf. on Biometrics (IJCB), Washington, DC, USA, pp. 1–6, 2011. [Google Scholar]
33. Y. Makihara, H. Mannami and Y. Yagi, “Gait analysis of gender and age using a large-scale multi-view gait database,” in Asian Conf. on Computer Vision, Beijing, China, pp. 440–451, 2010. [Google Scholar]
34. R. K. Begg, M. Palaniswami and B. Owen, “Support vector machines for automated gait classification,” IEEE Transactions on Biomedical Engineering, vol. 52, no. 5, pp. 828–838, 2005. [Google Scholar]
35. J. Lu and Y. P. Tan, “Gait-based human age estimation,” IEEE Transactions on Information Forensics and Security, vol. 5, no. 4, pp. 761–770, 2010. [Google Scholar]
36. C. E. Rasmussen and H. Nickisch, “Gaussian processes for machine learning (GPML) toolbox,” The Journal of Machine Learning Research, vol. 11, pp. 3011–3015, 2010. [Google Scholar]
37. J. Lu and Y. P. Tan, “Ordinary preserving manifold analysis for human age and head pose estimation,” IEEE Transactions on Human-Machine Systems, vol. 43, no. 2, pp. 249–258, 2012. [Google Scholar]
38. P. Punyani, R. Gupta and A. Kumar, “Human age-estimation system based on double-level feature fusion of face and gait images,” International Journal of Image and Data Fusion, vol. 9, no. 3, pp. 222–236, 2018. [Google Scholar]
39. X. Li, Y. Makihara, C. Xu, Y. Yagi and M. Ren, “Gait-based human age estimation using age group-dependent manifold learning and regression,” Multimedia Tools and Applications, vol. 77, no. 21, pp. 28333–28354, 2018. [Google Scholar]
40. B. K. Y. Chuen, T. Connie, O. T. Song and M. Goh, “A preliminary study of gait-based age estimation techniques,” in Asia-Pacific Signal and Information Processing Association Annual Summit and Conf. (APSIPA), Hong Kong China, pp. 800–806, 2015. [Google Scholar]
41. J. B. Pittenger, “Body proportions as information for age and cuteness: Animals in illustrated children’s books,” Perception & Psychophysics, vol. 48, no. 2, pp. 124–130, 1990. [Google Scholar]
42. T. B. Aderinola, T. Connie, T. S. Ong and K. O. M. Goh, “Automatic extraction of spatio-temporal gait features for age group classification,” in Int. Conf. on Innovations in Information and Communication Technologies, Kathmandu, Nepal, pp. 71–78, 2020. [Google Scholar]
43. C. Xu, A. Sakata, Y. Makihara, N. Takemura, D. Muramatsu et al., “Uncertainty-aware gait-based age estimation and its applications,” IEEE Transactions on Biometrics, Behavior, and Identity Science, vol. 3, no. 4, pp. 479–494, 2021. [Google Scholar]
44. B. Abirami, T. S. Subashini and V. Mahavaishnavi, “Automatic age-group estimation from gait energy images,” Materials Today: Proceedings, vol. 33, pp. 4646–4649, 2020. [Google Scholar]
45. H. Zhu, Y. Zhang, G. Li, J. Zhang and H. Shan, “Ordinal distribution regression for gait-based age estimation,” Science China Information Sciences, vol. 63, no. 2, pp. 1–14, 2020. [Google Scholar]
46. C. Xu, Y. Makihara, R. Liao, H. Niitsuma, X. Li et al., “Real-time gait-based age estimation and gender classification from a single image,” in Proc. of the IEEE/CVF Winter Conf. on Applications of Computer Vision, Hawaii, USA, pp. 3460–3470, 2021. [Google Scholar]
47. H. Zhang, D. Xu, X. Zhang, Q. Chen, H. Zie et al., “Model-based angular scan error correction of an electrothermally-actuated MEMS mirror,” Sensors, vol. 15, no. 12, pp. 30991–31004, 2015. [Google Scholar]
48. H. W. Yoo and K. Y. Kwon, “Method for classification of age and gender using gait recognition,” Transactions of the Korean Society of Mechanical Engineers A, vol. 41, no. 11, pp. 1035–1045, 2017. [Google Scholar]
Cite This Article
 Copyright © 2023 The Author(s). Published by Tech Science Press.
This work is licensed under a Creative Commons Attribution 4.0 International License , which permits unrestricted use, distribution, and reproduction in any medium, provided the original work is properly cited.
 Downloads
 Citation Tools