
 Submit a Paper
 Propose a Special lssue
 Open Access
ARTICLE

Electrical Tree Image Segmentation Using Hybrid Multi Scale Line Tracking Algorithm
1 Faculty of Electrical Engineering & Technology, Universiti Malaysia Perlis, Perlis, Malaysia
2 School of Electrical and Electronic Engineering, Universiti Sains Malaysia, Penang, Malaysia
3 Faculty of Electronic Engineering & Technology, Universiti Malaysia Perlis, Perlis, Malaysia
4 Department of Electrical and Electronics Engineering, Jubail Industrial College, Saudi Arabia
* Corresponding Author: Mohamad Nur Khairul Hafizi Rohani. Email:
Computers, Materials & Continua 2023, 75(1), 741-760. https://doi.org/10.32604/cmc.2023.036077
Received 16 September 2022; Accepted 12 November 2022; Issue published 06 February 2023
 View Full Text
 Download PDF
Abstract
Electrical trees are an aging mechanism most associated with partial discharge (PD) activities in crosslinked polyethylene (XLPE) insulation of high-voltage (HV) cables. Characterization of electrical tree structures gained considerable attention from researchers since a deep understanding of the tree morphology is required to develop new insulation material. Two-dimensional (2D) optical microscopy is primarily used to examine tree structures and propagation shapes with image segmentation methods. However, since electrical trees can emerge in different shapes such as bush-type or branch-type, treeing images are complicated to segment due to manifestation of convoluted tree branches, leading to a high misclassification rate during segmentation. Therefore, this study proposed a new method for segmenting 2D electrical tree images based on the multi-scale line tracking algorithm (MSLTA) by integrating batch processing method. The proposed method, h-MSLTA aims to provide accurate segmentation of electrical tree images obtained over a period of tree propagation observation under optical microscopy. The initial phase involves XLPE sample preparation and treeing image acquisition under real-time microscopy observation. The treeing images are then sampled and binarized in pre-processing. In the next phase, segmentation of tree structures is performed using the h-MSLTA by utilizing batch processing in multiple instances of treeing duration. Finally, the comparative investigation has been conducted using standard performance assessment metrics, including accuracy, sensitivity, specificity, Dice coefficient and Matthew’s correlation coefficient (MCC). Based on segmentation performance evaluation against several established segmentation methods, h-MSLTA achieved better results of 95.43% accuracy, 97.28% specificity, 69.43% sensitivity rate with 23.38% and 24.16% average improvement in Dice coefficient and MCC score respectively over the original algorithm. In addition, h-MSLTA produced accurate measurement results of global tree parameters of length and width in comparison with the ground truth image. These results indicated that the proposed method had a solid performance in terms of segmenting electrical tree branches in 2D treeing images compared to other established techniques.Keywords
Crosslinked polyethylene (XLPE) material links possess a flexible, lightweight structure, great electrical and thermal properties, high transmission limit, and greater heat obstruction, with plenty more advantages [1–3]. XLPE has been widely used in power cable insulation due to its high thermal stability property. However, the presence of certain impurities in XLPE puts high pressure on the performance of the solid insulation, which contributes to its degradation. Even though the XLPE cable holds superior thermal strength that can endure extreme conditions, it is still exposed to partial discharge (PD) activities that predate an imminent power failure generally instigated by the non-standard cable manufacturing procedure, long exposure to harsh climate or faulty components in cables accessories such as cable terminations or joints. The propagation of electrical trees, classified as internal PD, is the most common defect occurred inside XLPE insulation.
Electrical tree growth in polymeric material has always been the focus of the dielectric community due to the need to understand how electrical trees initiate, propagate and ultimately induce failure in the dielectric material. Needle-to-plane geometries are used in a laboratory setting for attaining high fields at very low voltages to induce electrical tree. Hence observation of tree propagation in XLPE materials can be performed in real-time. It has become standard practice to directly observe transparent polymers under high-voltage (HV) stress using an optical microscopy system to understand electrical tree development inside insulation over time [4–6]. These microscopy images can be further investigated by employing image processing techniques like segmentation to precisely quantify tree growth. However, when analyzing features of interest in treeing images, subjects of complex overlapping tree branches in various manifestations of tree shapes and illumination variance in two-dimensional (2D) images remain a difficult challenge that researchers need to overcome [7,8]. When electrical tree propagates over time, more tree branches grew perpendicular to the applied electric field. As a result, the overlapping branches emerged as a darker region in the middle section of the tree, degrading the potential boundary profiles that can be classified by segmentation methods. This will lead to high misclassification error causing critical information pertaining to the tree structures to be lost.
Therefore, the proposed method utilized a batch processing method with a carefully tuned line tracking algorithm to improve classification performance in segmenting dense area of treeing images obtained from 2D optical microscopy observation of electrical tree propagation in XLPE insulation sample. This method provides accurate representation of electrical tree structures which will be beneficial in characterization analysis and in the development of new insulation material for HV applications.
Electrical tree manifestation is an established internal PD, which contributes to HV insulation breakdown if not properly monitored. Electrical trees are bifurcated hollow tubules resembling botanical trees, which gradually grow over time until insulation breaks down. Treeing in XLPE insulation can be attributed to the presence of contaminants, voids, crack or defects inside the insulation under prolonged exposure to HV stress and harsh environment. Research pertaining to electrical trees, such as characterization measurement and growth analysis, mostly requires treeing to be replicated under HV environment and observed through a digital image acquisition system.
Electrical trees are characterized as either of three distinctive forms, apparent by their similarity to botanical trees, which are branch, bush or a mix of both types [9]. Branch-type trees have limited branched structures with fine filamentary channels steming out only from those branches while bush-type trees possess many overlapped branches that are densely packed together appearing as a solid bush-shaped mass. Treeing growth model has been established by Dissado as a three-stage phenomenon: Stage 1: Inception, Stage 2: Propagation and Stage 3: Runaway and breakdown [10], as depicted in Fig. 1. The initiation of the electrical tree is the event where electric trees first emerge from regions with contaminants or voids, generating an electric field higher than the dielectric strength of XLPE insulation. This shift in the dielectric constant inside the material contributes to the increase of the electrical field as well as the ionization of the gas within the void, resulting in the formation of PD. Afterwards, the electrical tree will continue to grow and propagate towards the opposite electrode in the form of a branch, bush or bush-branch structure. As the tree propagates, the field at its tip will increase. At a certain moment the growth speed will begin to increase, creating a runaway of treeing just before the irreversible breakdown is triggered in the insulation material.
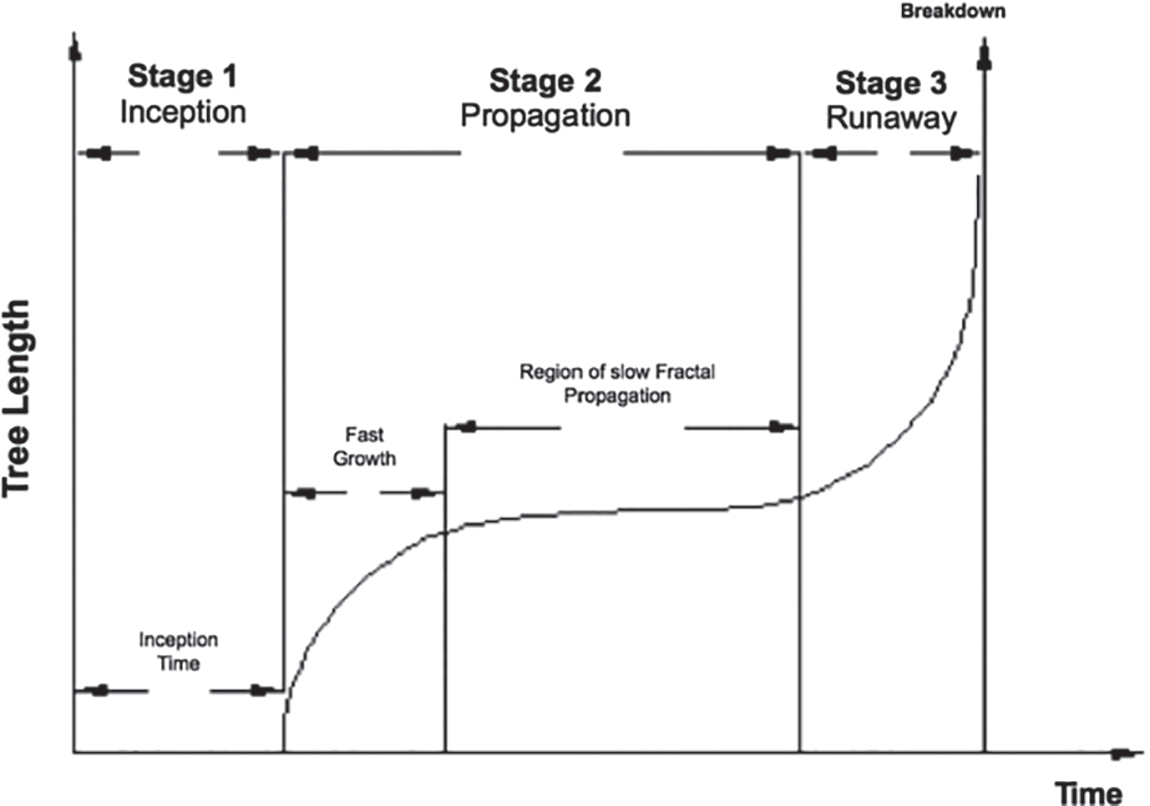
Figure 1: Electrical tree growth model [10]
2.2 Treeing Measurement and Analysis
Over the years, electrical trees have been measured using several quantitative measurement parameters such as tree length, L, defined as the Euclidean distance from the tree initiation to the furthest tree tip in the 2D projected treeing image in the direction of the electric field and tree width, D, which represent the extent of spread of the tree channels as they grow in the 2D projected image perpendicular to the electric field [11–13] as shown in Fig. 2. Other known parameters include growth rate, dL/dt, and fractal dimension, Df, which measures the average length change rate over time and quantifies the relative space occupied by the tree, respectively. However, an electrical tree needs to be observed in a controlled HV environment and captured digitally using a standard image acquisition system to perform analysis using these parameters.
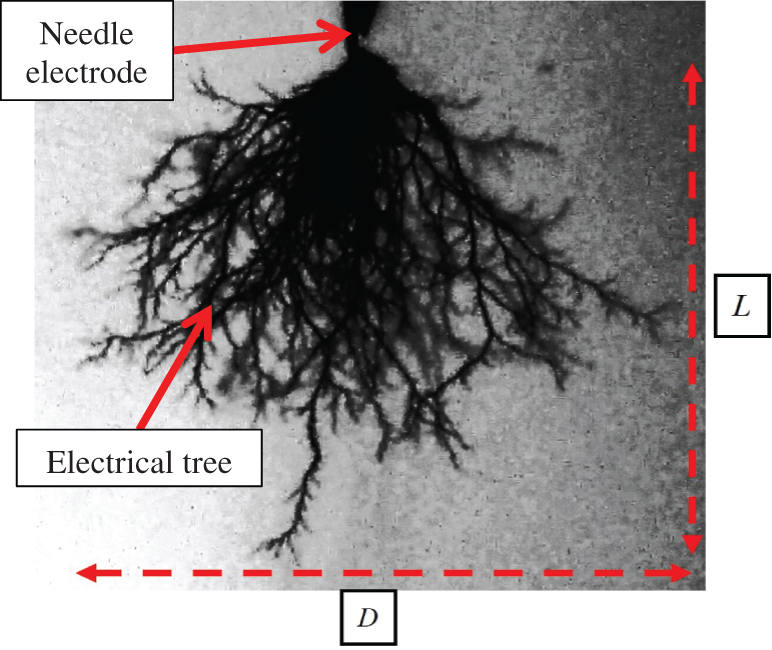
Figure 2: Global parameter measurement of electrical tree propagation: length, L and width, D
Due to the inaccessible nature of tree occurrences inside HV cable during the load operation, the electrical tree is developed artificially under a controlled HV laboratory environment for analysis. A typical treeing image acquisition setup consists of a high-voltage circuit, a charge-coupled device (CCD) camera, and a microscope system with digital recording, allowing real-time observation of the tree, which is necessary for growth analysis [14,15]. Insulation samples were designed in needle-to-plane geometry to allow electrical tree propagation from the HV source towards the other end of the electrode within the boundary of the specimen. Note that treeing activity will be monitored in real-time. The recording will later be parsed and segmented for measurement and analysis using image processing. Image analysis has been a progressive research area for years, albeit only a few publications are available regarding their application to electrical tree images. Therefore, this research presents a concise overview of the segmentation methods available, which is one of the vital stages in image processing.
2.4 Review of Segmentation Methods
The main aim of segmentation is to search for local features or regions of interest (ROI) in an image that allows them to be distinguished from other objects or backgrounds compared to the ground truth images, representing the best approximation of the ROI. For instance, in a 2D treeing image mostly comprised of two subjects, the propagation tree region and the insulation region, segmentation is performed to identify the tree region apart from its insulation background. The outcome of segmentation is a pixel-based classification performance in which performance is evaluated by various detection performance metrics such as accuracy, sensitivity, specificity, Matthew’s correlation coefficient (MCC) and more. Table 1 shows the mathematical expression for the extensively used metrics in measuring segmentation performance. Note that True Positive (TP) signifies the number of pixels or instances correctly identified as foreground, while True Negative (TN) represents positively identified background pixels. False Positive (FP) indicates the number of background pixels misclassified as foreground, while False Negative (FN) denotes the number of foreground pixels misclassified as background pixels.

Accuracy measures the proportion of correct classification, while precision metric computes the proportion of correct classification over all foreground classification. Sensitivity or recall represents the correct classified foreground pixels to the total number of foreground pixels. Specificity rate indicates the ratio of the correctly classified background pixels to the overall number of backgrounds pixels. In addition, Dice coefficient which represents the harmonic mean of precision and sensitivity, is also considered to be the most conventional standard for measuring segmentation performance. Meanwhile, MCC is said to provide much more accurate segmentation performance results unaffected by imbalanced data [16]. MCC returns the value in the range of −1 to +1, where coefficient +1 represents a perfect classification while −1 implies total misclassification.
As classified in Fig. 3, image segmentation methods can be sorted into two main groups, which are region-based and boundary-based. The thresholding method, which is mostly employed in region-based groups, separates the image pixels with respect to their intensity level. The frequently quoted Otsu’s method is one of the techniques that belong to the threshold-based family. Otsu uses global thresholding techniques that use the information of the image’s threshold histogram to form an algorithm, which returns the value of a single threshold that classifies pixels into two regions; foreground and background [17]. While in the year 2000, Sauvola and Pietika introduced a new method of threshold adjustment specifically for different types of text document analysis with various component and degradation types, including illumination and noise [18]. Instead of relying on local or global thresholds like Otsu’s, their technique used rapid image surface analysis for algorithm selection and adaptation according to document contents. It utilized the algorithm selection to compute and propose the threshold value for each pixel. Sauvola claimed to have good adaptation to various degradation types such as illumination, noise and various resolution compared to several other thresholding techniques. The Sauvola method has been employed in several recent studies to perform segmentation on complex imaging conditions [19,20]. In 2015, Tyler Coye developed an advanced variant of the threshold-based segmentation algorithm for segmenting the blood vessel of the fundus image, later known as the Coye Filter [21]. The principal component analysis (PCA) of the weighted LAB color model is used for converting the image into a grayscale. The contrast enhancement is done by adaptive histogram equalization, which excludes the background by subtracting the average filtered image. It has been proved that a variant of the Coye filter achieved the best accuracy compared to the other integrated approaches [22].
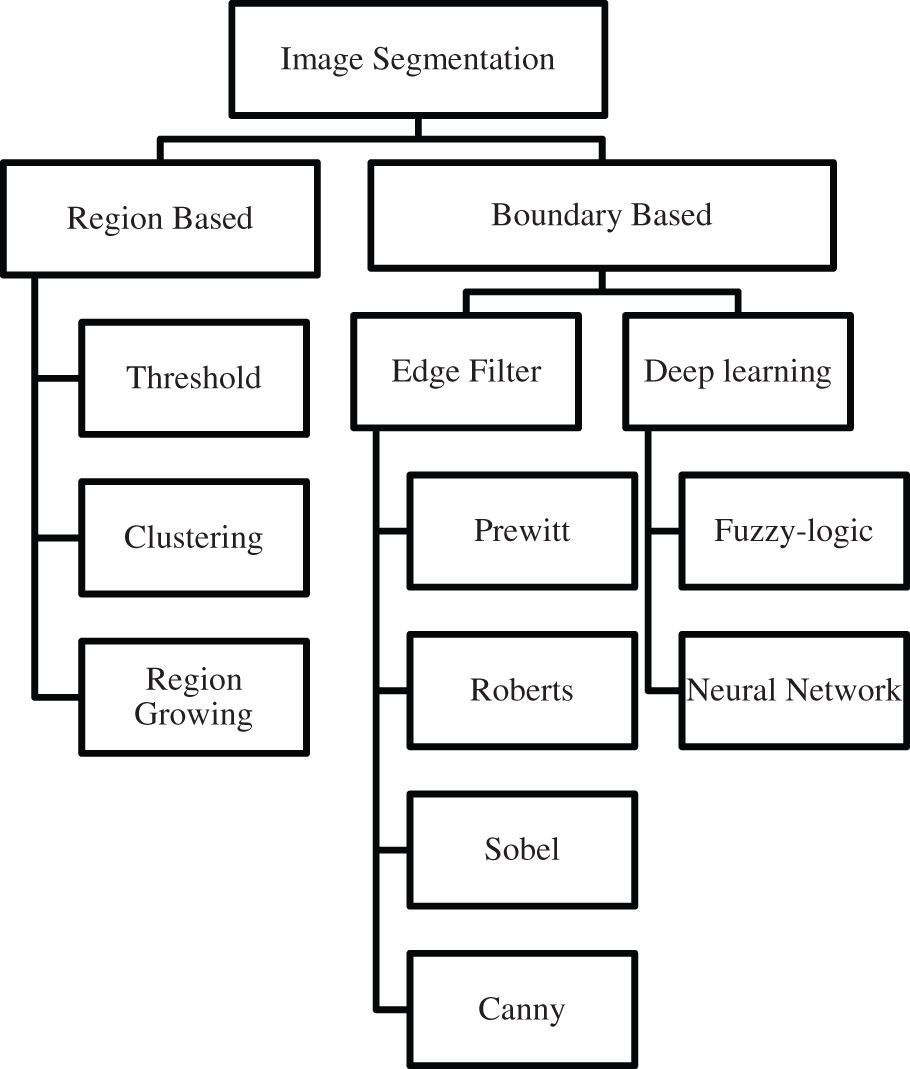
Figure 3: Methods of 2D image segmentation
Meanwhile, boundary-based segmentation transforms images into boundary profiles by altering the image’s gray value. This can be accomplished either using an edge operator or using machine-learning techniques. Note that Prewitt, Roberts, Canny and Sobel are the most common edge operators [23,24]. In 2019, Yang proposed a method based on double vision sensors by incorporating the Roberts edge filter for measuring dam surface displacement resulting smoother edge marker of the image [25]. The method is claimed to achieve millimeter-level measurement accuracy while having the advantage of a reduced measurement period and being cost-effective. Meanwhile, Venmathi et al. [26] introduced a new detection algorithm for microcalcification clusters in mammograms image using the edge detection method by applying Kirsch’s template, which attains a good balance between suppressing the noise component and keeping edge details in mammograms images. Kirsch’s edge operator consists of 8 convolution kernels, where all 8 masks are applied to each point of the image in rotation to get the best estimation of neighboring edge pixels. In the comparison of over-detected points, closed boundaries and noise reduction, their algorithm outperformed the Canny edge filter. Another complex variation of boundary-based segmentation is the multi-scale line tracking segmentation algorithm (MSLTA), developed by Vlachos & Dermatas, intended for blood vessel segmentation in retinal images [27]. The algorithm is based on a novel seeded multi-scale line-tracking procedure to accurately determine whether the group of pixels belongs to a vessel network map derived from a brightness selection rule. The vessel network is estimated using map quantization, and median filtering is used post-processing to eliminate noise. Other than that, MSLTA boasted a performance accuracy of 92.9%, sensitivity of 74.7% and specificity of 95.5% after being tested with an image from a public database. It is also claimed that MSLTA shows good performance in the presence of noise.
Specifically, in electrical tree applications, Watson and Barber carried out electrical tree image segmentation using the thresholding method on treeing images acquired to Pascal-based VAX image processing system (VIPS) developed by their research team to study treeing in polymethylmethacrylate (PMMA) material [28]. The resulting threshold image is then converted into a single-pixel-width skeleton tree through the thinning process using the VIPS to measure tree branch lengths and fork angles. However, since manual thresholding and the thinning process were used, some tree regions were compromised, especially fainter tree branches. Furthermore, this method was unsuitable for trees with overlapped branches like bush-shaped or mixed-shaped trees. In 2009, an electrical tree fractal dimension study on XLPE was performed using the same thresholding method based on an intensity histogram by Chen and Tham, albeit with a different image processing system, a software-based imaging system, KS400 [15]. Nevertheless, since the study depended on processed tree images from the KS400 system, the image segmentation details have not been discussed further. Hence, there is inconclusive data to assess the performance. Meanwhile, Bahadoorsingh et al. [29] proposed using contrast stretching and Gaussian filtering to segment electrical images for structural characterization. The image subtraction method separated the tree region from the rest of the background. Note that the comparison with the precalculated measurement shows a percentage error of less than 3.5%. Other electrical studies that utilized image processing technique was either software-dependent or simulation-based [30,31].
It can be summarized that in recent years, classification study of electrical tree using image processing method is very limited and inadequate. In fact, most of the treeing classification studies were simulation-based where original treeing data have been heavily manipulated by the simulation algorithm to generate electrical tree structures. Therefore, utilizing image processing techniques is a step in the right direction to evaluate the segmentation algorithm's accuracy in classifying the electrical tree region from its insulation background. Since electrical tree can manifest in different growth pattern, existing literature focusing on implementing image segmentation of 2D treeing image to classify the pattern is scarce. For this reason, our proposed h-MSLTA adopted a multi-scale line tracking algorithm with the integration of batch processing method, to classify electrical tree structures in 2D images to provide a low-cost alternative in characterization of electrical trees.
3.1 2D Treeing Image Acquisition
The study was initiated by preparing the insulation sample for the HV treeing experiment. The XLPE material necessary for the treeing acquisition was produced in the chemical laboratory (FTKM7) in Universiti Malaysia Perlis (UniMAP), Malaysia. Samples of XLPE were prepared under heat treatment using XLPE granules of 0.922 g/cm3 density to produce thin translucent sheets of

Figure 4: Treeing sample preparation using needle-to-plane geometry (a) XLPE sample illustration and (b) XLPE sample under microscopic observation


Figure 5: Treeing data acquisition setup (a) Schematic diagram for treeing acquisition and (b) Experiment setup in HV laboratory
A step-by-step alternating current (AC) voltage of 1 kV with a step duration of 60 s was applied until electrical tree inception voltage (TIV) was observed. The voltage was kept fixed for the whole duration of the experiment, and the tree growth was observed until it reached ±1 mm in length as a precaution to prevent the insulation breakdown. Apart from that, the treeing activity was recorded in real-time in full high-definition (HD) resolution, which was later sampled into batches of treeing images for classification. Fig. 6 shows the XLPE sample subjected to 30 min of the treeing experiment. The electrical tree propagated in the form of bush-type tree where a dense overlapped tree branches emerged from the needle tip towards the other end of electrode can be observed.

Figure 6: Bush-type electrical tree growth observation subjected to 30 min of experiment duration
3.2 Treeing Segmentation Using h-MSLTA
The original 2D treeing raw video was sampled into treeing images for segmentation. The h-MSLTA algorithm is based on a multi-scale line-tracking process [27] due to the robustness in detecting boundary profiles similar to the nature of electrical tree branches. The original MSLTA belongs to the boundary-based segmentation algorithm, that initiates tracking from a small group of pixels, derived from a brightness selection rule to develop network of classified pixels belong to a path or line. However, the original line tracking algorithm was intended for single image processing at one time for a blood vessel segmentation in retinal images. To study the full nature of electrical tree growth, the propagation is observed over a certain period of time. Hence, the segmentation must also be performed by selecting images with varied time instances of experiment duration. In order to process large image data sets, we proposed the integration of batch image processing to perform pre-processing on the treeing images, as illustrated in Fig. 7. Firstly, the raw video was parsed into several treeing images based on their timestamp duration while retaining the original high-resolution quality. Then, it was stored according to their batch identification based on the acquired treeing samples. Correspondingly, images were batch processed to extract the individual green channel of the original RGB color channel for segmentation. The purpose of using only the green channel for segmentation provides a better image contrast between the tree region and the insulation background for easier classification.

Figure 7: Treeing image batch processing flow
The image histogram is generated from the green channel for pixel brightness estimation.
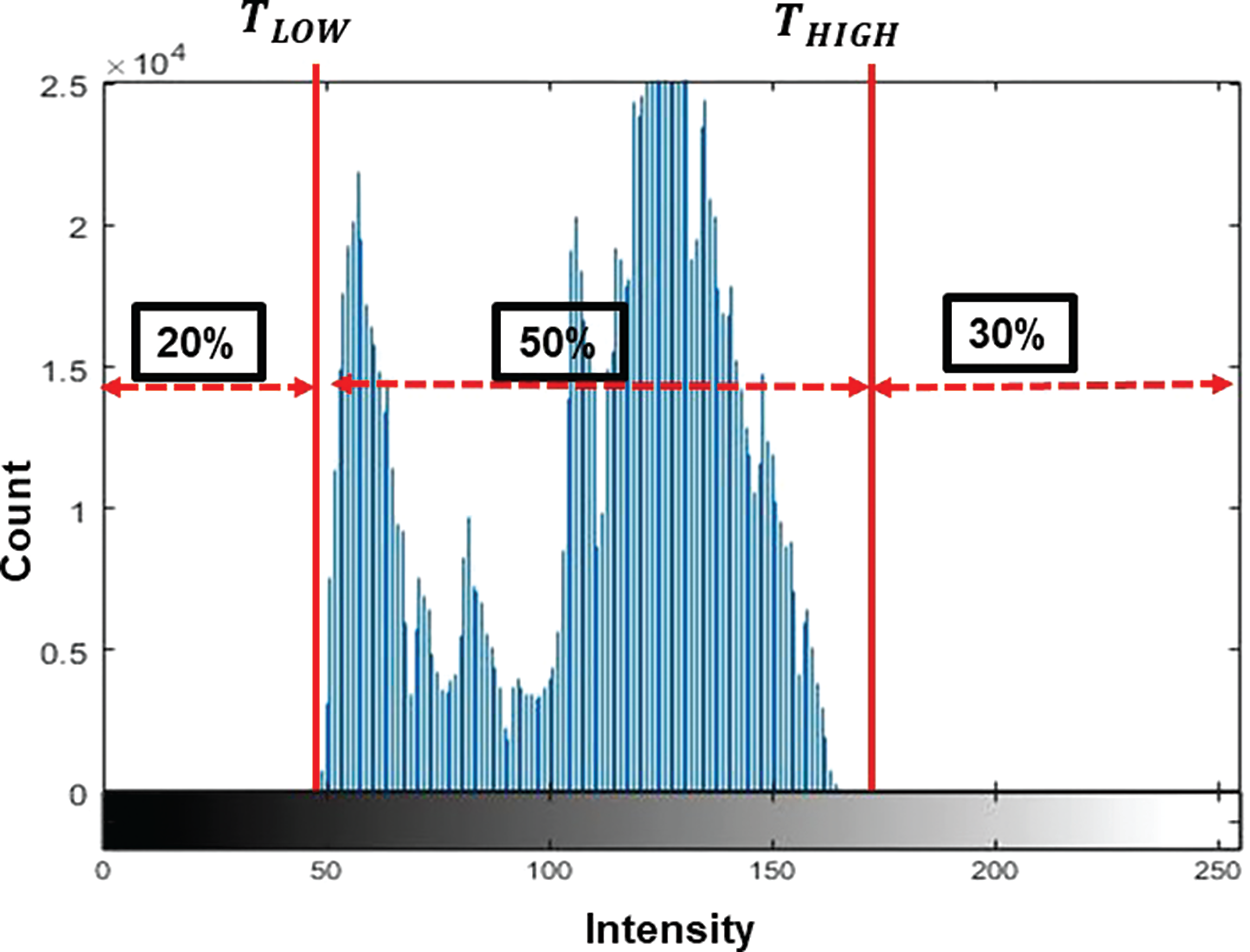
Figure 8: Brightness selection rule based on image green channel histogram
Consequently, the line tracking process begins where the confidence of each pixel belonging to a tree line at an odd scale W is assessed and stored in the confidence array,
where
Afterwards, the cross-sectional profile parameter,
where
θ0 = argmax {VI ((x,y), (r θi)) : = VI((x,y) (r,θi)) > T},
Lastly, the current tracking pixel is added to
The tracking procedure for the next candidate pixel is repeated from Eq. (3). The process is executed

Figure 9: Process flow of h-MSLTA for electrical tree segmentation

Segmentation from 2D treeing images has been carried out under MATLAB R2020a environment using Windows platform with the following machine specification: Intel® Core™ i5, CPU 2.5 GHz with 8 GB RAM. Both treeing images acquired through sampling of the original visual recording and ground truth (GT) images retain the same HD resolution as the recording quality from the CCD camera. These images were then resized in pre-processing to achieve better computational time during the segmentation stage. Note that the GT image is used as a reference to evaluate all segmentation performance using metrics of accuracy, sensitivity, specificity, Dice coefficient and MCC. GT images were traced from the original treeing images using a hand-labelled technique accomplished by one human observer with the aid of open-source tool, GIMP [32] to obtain the most precise visual interpretation of the original tree. As can be visually observed from Fig. 10, segmentation by h-MSLTA managed to provide better performance in detecting the tree network in the denser middle area of the bush-shaped electrical tree. This is quite an improvement compared to the original MSLTA and other techniques, which have difficulties detecting areas with lots of overlapping tree branches where regions are darker with less boundary profile to identify. However, this result can be further enhanced by selecting more treeing instances in a single batch processing to improve the robustness of h-MSLTA in identifying regions with minimal boundary profile, as in the presence of heavier branch areas of electrical trees.
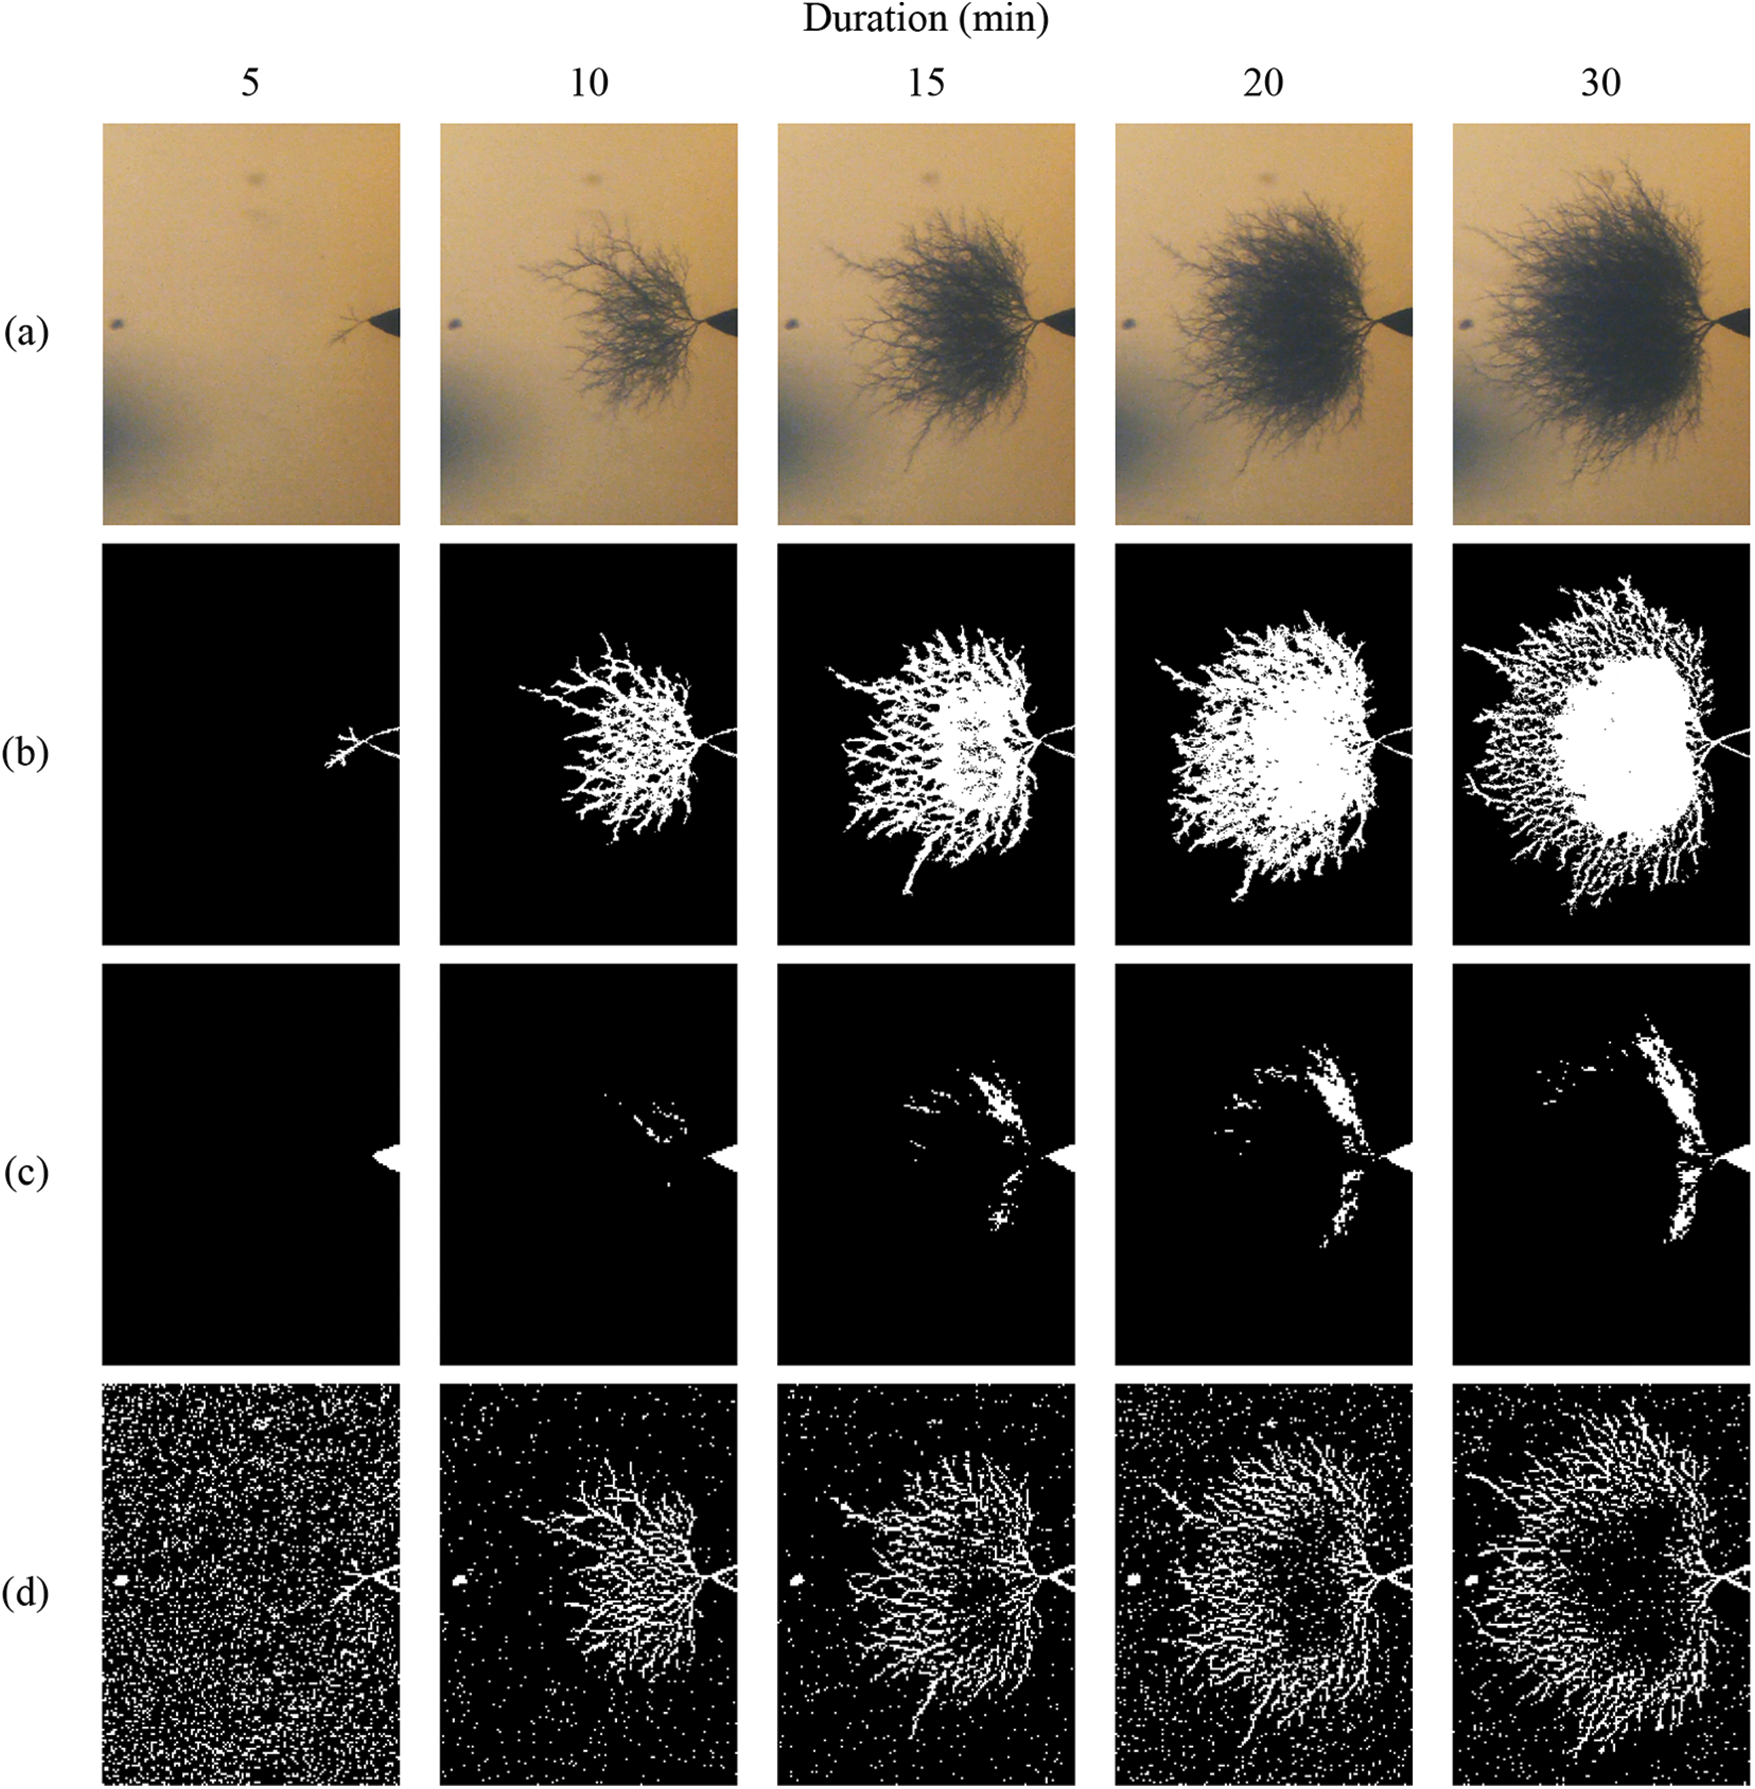
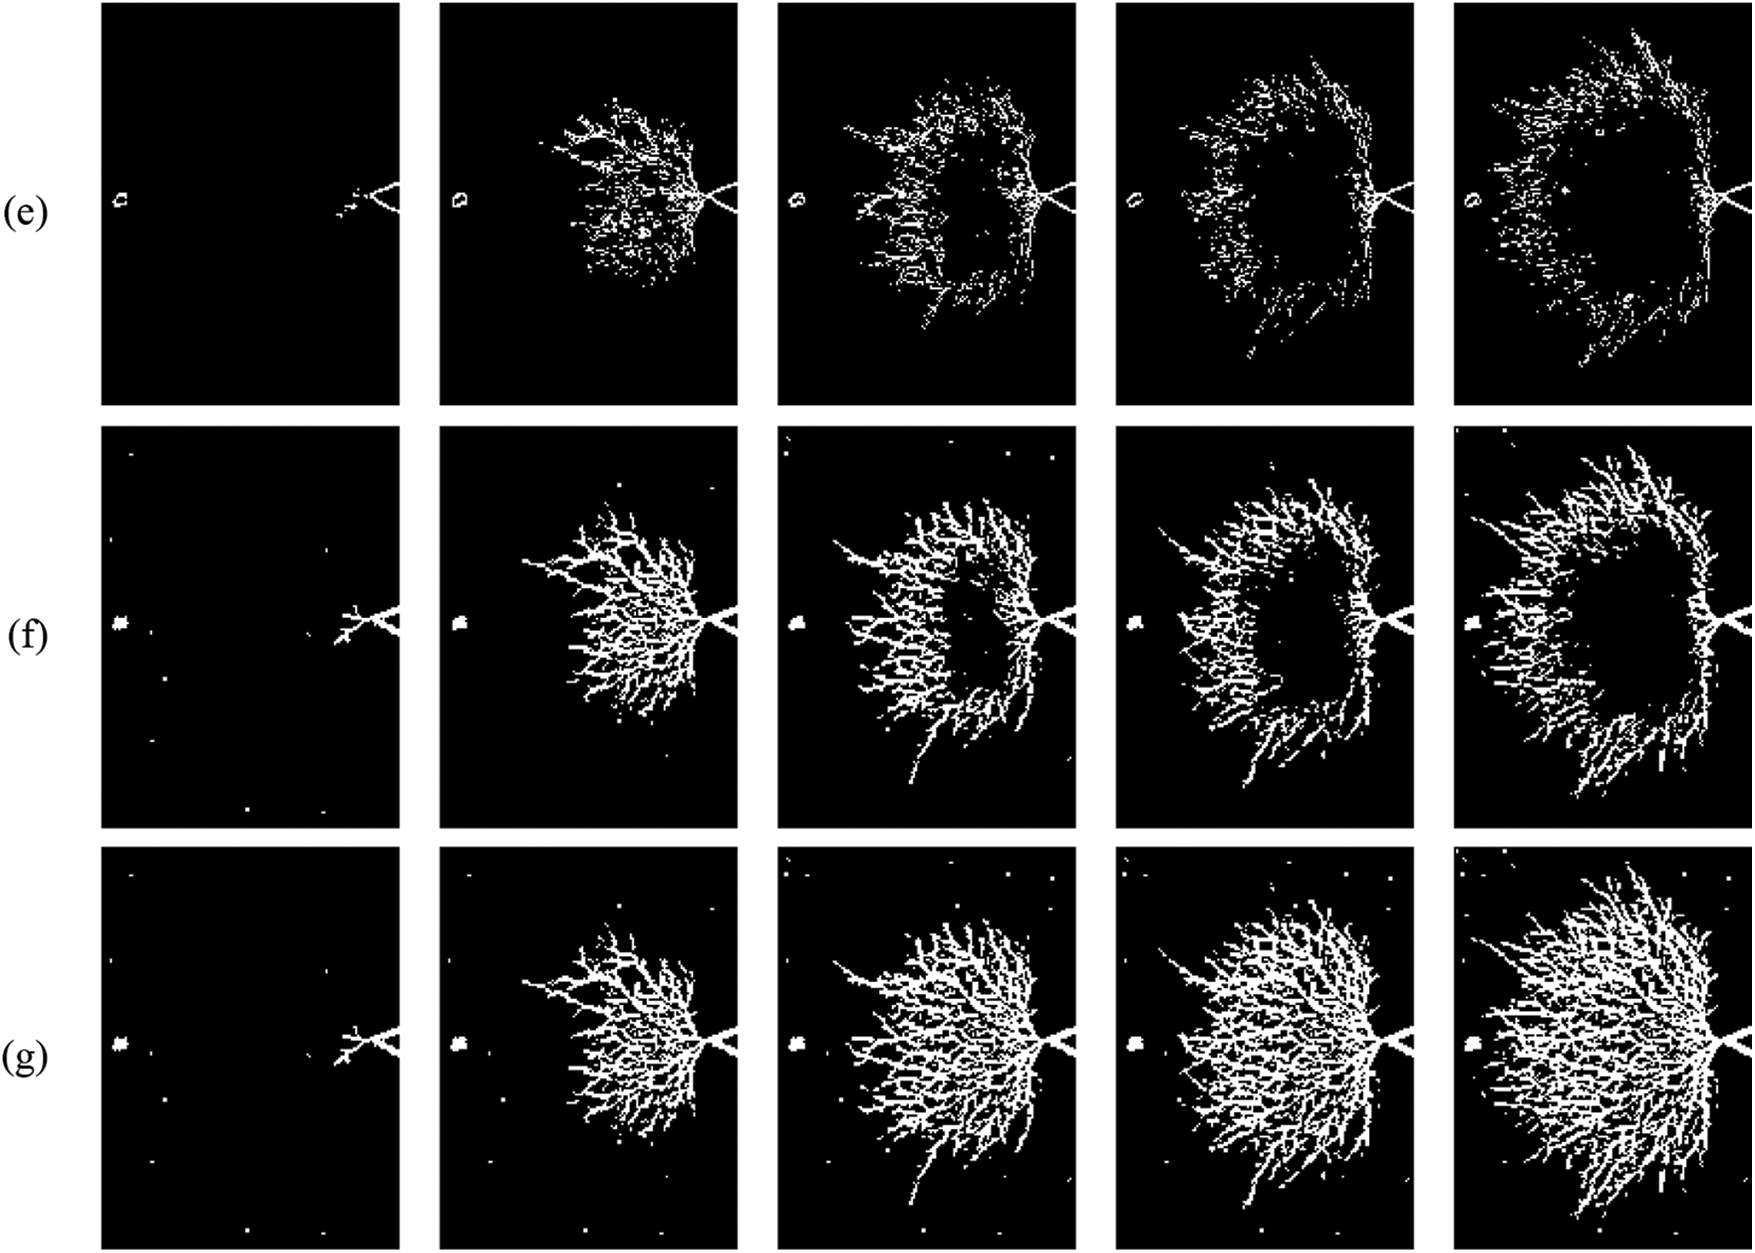
Figure 10: Segmentation results: (a) Original image, (b) GT, (c) Sauvola, (d) Coye, (e) Kirsch (f) MSLTA and (g) h-MSLTA
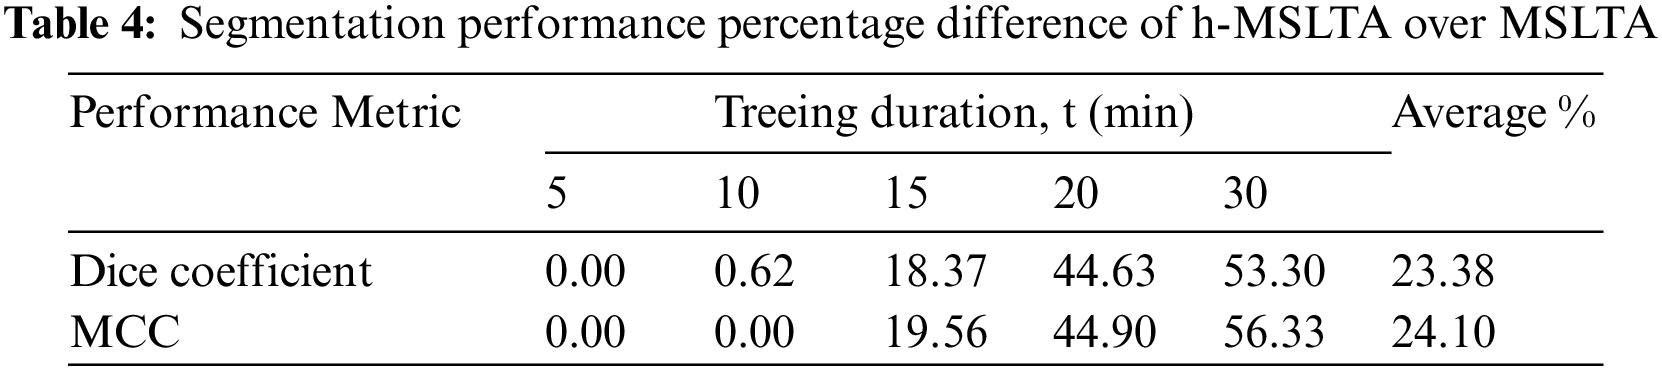
Based on performance comparison with the segmentation quality metrics in Table 3, the algorithm obtained 95.43% and 69.43% in accuracy and sensitivity, respectively, the highest among the tested technique, while achieving a relatively high specificity percentage. However, when the bush-shaped tree entered its slow fractal propagation phase from t = 10 to t = 30 min, more tree branches grew perpendicular to the applied electric field. As a result, the overlapping branches emerged as a darker region in the middle section of the tree, degrading the potential boundary profiles detected by segmentation algorithms and leading to high misclassification. From all the techniques employed, h-MSLTA and Coye filter were less affected by this issue, where the latter produced a lot of misclassified pixels. This further justifies the proposed algorithm's ability to accurately distinguish the tree region from its insulation background pixels in the dense area of bush-type tree propagation. Apart from that, the average Dice coefficient and MCC performance of 0.59 and 0.58 respectively is good, considering that the original treeing images datasets were mostly imbalanced where background pixels overwhelmed the foreground pixels. The improvement of h-MSLTA over the original algorithm by incorporating the batch processing method is reflected by the percentage difference in Table 4 between the proposed method over the original line tracking algorithm. h-MSLTA has managed to improve in average of 23.38% in Dice coefficient score and 24.10% percentage improvement in MCC. This significant improvement is largely contributed by the steadily increase performance in both evaluation metrics especially when the bush-type tree entering the late propagation phase.

Based on the sensitivity rate comparison in Fig. 11, the improvement made by h-MSLTA over the original is further justified in classifying the tree region apart from the background particularly during the slow fractal propagation phase of treeing, where tree branches are much denser. Sensitivity rate has been improved by h-MSLTA up to 65.36% compared to just 34.42% sensitivity of the original algorithm at treeing duration of t = 30 min. This signifies that h-MSLTA managed to overcome the limitation of the original algorithm in detecting dense overlapping branches area of the tree where boundary profiles are much harder to detect. In addition to segmentation performance, tree growth has been observed by the relationship of the tree length and tree width as a function of time, as represented by Fig. 12. As can be perceived by the tree length propagation, the tree started to gain an abrupt growth after initial inception in between time instances of t = 5 until t = 10 min before entering a slow fractal propagation phase with a slight increase in the tree length for the remaining duration of the experiment. This trend is in accordance with the growth model suggested by Dissado in Subsection 2.1. Among all the employed techniques, MSLTA yielded very accurate results for both length and width measurement, well within the preset error range of ±0.03 mm when compared to the GT image.

Figure 11: Sensitivity rate performance comparison
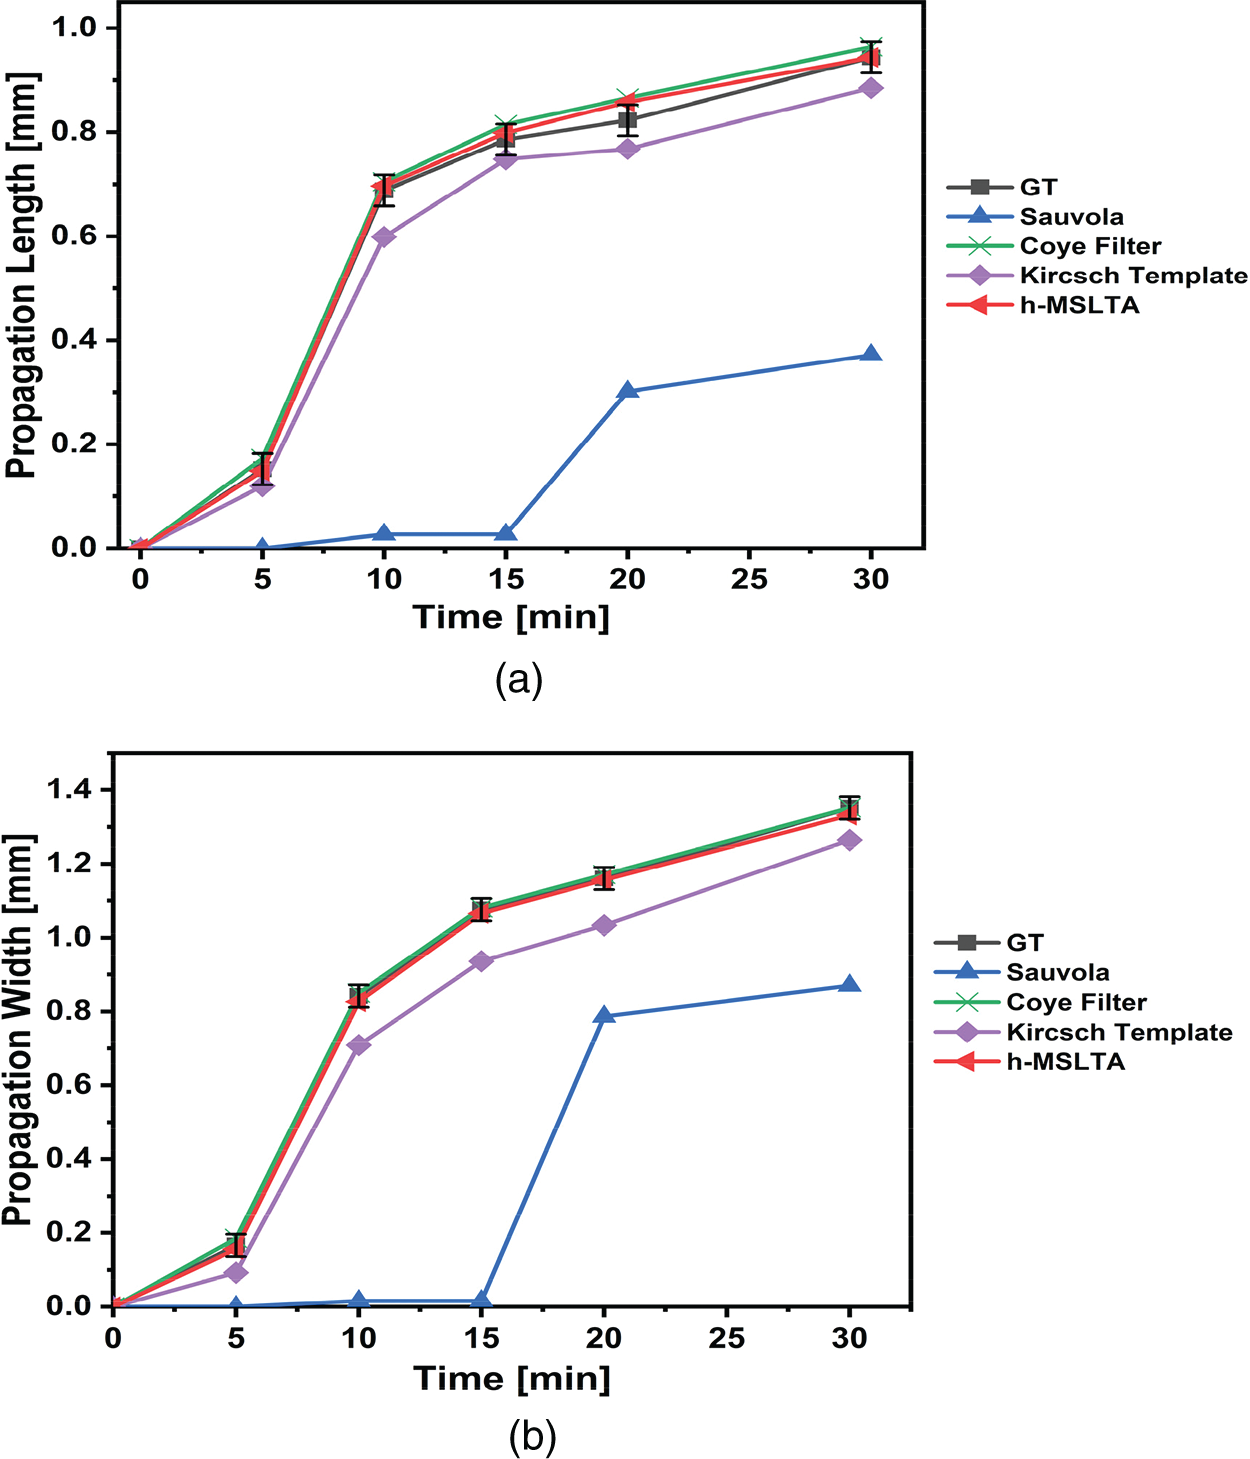
Figure 12: Global parameter measurement comparison: (a) Length, L (b) Width, D
The result from this study shows a significant improvement compared to the state-of-the-art methods as well as over the original MSLTA algorithm, where h-MLSTA attained the highest average score in accuracy, sensitivity, Dice coefficient and MCC in the segmentation performance evaluation. Furthermore, in measuring the tree global parameter of length and width, the proposed method provided the nearest representation of tree growth in comparison with the ground truth. This study emphasized on the robustness of the proposed method in segmenting electrical tree structure with dense overlapping tree branches which proved to be useful towards characterization of electrical tree structures. The segmentation result can be improved by taking into consideration the denoising aspect in the pre-processing stage to eliminate usual noise cause by the optical image acquisition system such as Gaussian noise or salt-and-pepper noise. Since the proposed approach is only suitable for 2D treeing images, a comprehensive insight of the electrical tree is restricted by loses of information pertaining the tree growth in three-dimensional (3D) due to the simplicity of the optical image acquisition system. 3D images of the tree are required to resolve complex structure of various electrical tree manifestation.
The robustness of the proposed method in segmenting dense overlapping branches area of electrical tree structure proved to be useful towards characterization of electrical tree in XLPE insulation. In addition to the carefully tuned brightness selection rule during the pixel tracking and with the integration of batch image processing method, significant improvement has been made over the original line tracking algorithm especially in the late stage of electrical tree propagation where branches are becoming more convoluted in certain area of electrical tree image. Furthermore, h-MSLTA provide the best approximation of the actual electrical tree structure in term of global parameter measurement based on the ground truth, which signifies the compatibility of the method with 2D electrical treeing data obtained from a real-time observation. This will certainly provide much assurance in terms of accuracy in measuring electrical tree structures over the virtual representation by other simulation tools. Although there are other methods providing extensive study of electrical tree structure in 3D, such as X-ray computed tomography (XCT) and Laser Scanning Confocal Microscopy (LSCM), the proposed method is cost-efficient, and the implementation is less complicated. Treeing data can be analyzed overnight under minimal supervision through the implementation of batch processing. For future consideration, denoising capabilities of the proposed method can be improved by employing much powerful denoising algorithm during the pre-processing stage to eliminate noise associated with the image acquisition system such as Gaussian and salt-and-pepper noise. Finally, the insight provided by the proposed method has a high potential to be applied in the development process of a new insulation material for HV applications.
Acknowledgement: The authors wish to express special thanks to Dr. Noor Syazwani Mansor and technical personnel from School of Electrical and Electronic Engineering, Universiti Sains Malaysia (USM), Penang for their extensive support during this work.
Funding Statement: The authors would like to thank the Ministry of Higher Education Malaysia for financially supported under the Fundamental Research Grant Scheme (FRGS/1/2020/TK0/UNIMAP/ 02/17).
Conflicts of Interest: The authors declare that they have no conflicts of interest to report regarding the present study.
References
1. M. A. Fard, M. E. Farrag, A. Reid and F. Al-Naemi, “Electrical treeing in power cable insulation under harmonics superimposed on unfiltered HVDC voltages,” Energies, vol. 12, p. 3113, no. 16, 2019. [Google Scholar]
2. X. Chen, Y. Xu, X. Cao and S. M. Gubanski, “On the conducting and non-conducting electrical trees in XLPE cable insulation specimens,” IEEE Trans. Dielectr. Electr. Insul., vol. 23, no. 1, pp. 95–103, 2016. [Google Scholar]
3. C. Q. Su and C. R. Li, “Using very-low-frequency and oscillating-wave tests to improve the reliability of distribution cables,” IEEE Electr. Insul. Mag., vol. 29, no. 1, pp. 38–45, 2013. [Google Scholar]
4. H. Zheng, F. Liu, S. Rowland, S. Chen and Z. Lv, “The impact of air gaps between needle and polymer on electrical treeing in needle-plane samples,” IEEE Trans. Dielectr. Electr. Insul., vol. 27, no. 3, pp. 739–747, 2020. [Google Scholar]
5. T. Nakamura, K. Ozawa, A. Kumada, K. Hidaka, T. Kato et al., “Observation of electrical treeing in epoxy resin by X-ray phase contrast imaging,” in Proc. 2016 IEEE Int. Conf. Dielectr. ICD 2016, Montpellier, France, vol. 2, no. 1, pp. 756–759, 2016. [Google Scholar]
6. X. Chen, C. Dai, L. Yu, C. Jiang, H. Zhou et al., “Effect of thermal ageing on charge dynamics and material properties of 320 kV HVDC XLPE,” IEEE Trans. Dielectr. Electr. Insul., vol. 26, no. 6, pp. 1797–1804, 2019. [Google Scholar]
7. R. Schurch, Three-Dimensional Imaging and Analysis of Electrical Trees. UK: University of Manchester, 2014. [Google Scholar]
8. Z. Lv, S. Chen, S. M. Rowland, J. Carr and T. Burnett, “3D XCT imaging of electrical tree growth in epoxy resin,” IEEE Trans. Dielectr. Electr. Insul., vol. 27, no. 2, pp. 631–639, 2020. [Google Scholar]
9. I. Iddrissu, Study of Electrical Strength and Lifetimes of Polymeric Insulation for DC Applications. UK: The University of Manchester, 2016. [Google Scholar]
10. L. A. Dissado and C. Fothergill, “Electrical tree degradation,” in Electrical Degradation and Breakdown in Polymers Electrical Degradation and Breakdown in Polymers, 1st ed., vol. 9 of IEE materials & devices series. UK: The Institution of Engineering and Technology, pp. 117–135, 1962. [Google Scholar]
11. T. Ohta and K. Iida, “Dehydration reaction effect of metal hydroxide on AC voltage lifetime of epoxy composites,” IEEE Trans. Dielectr. Electr. Insul., vol. 23, no. 4, pp. 2294–2302, 2016. [Google Scholar]
12. T. Han, B. Du, T. Ma, F. Wang, Y. Gao et al., “Electrical tree in HTV silicone rubber with temperature gradient under repetitive pulse voltage,” IEEE Access, vol. 7, no. May, pp. 41250–41260, 2019. [Google Scholar]
13. M. Pattouras, Analysis of Electrical Tree Growth through Dielectric Interfaces. The University of Manchester, UK, 2015. [Google Scholar]
14. S. Zhang, Y. Yang, Q. Li, J. Hu, B. Zhang et al., “Different microscopic features of AC and DC electrical trees in insulating polymer,” IEEE Trans. Dielectr. Electr. Insul., vol. 25, no. 6, pp. 2259–2265, 2018. [Google Scholar]
15. G. Chen and C. H. Tham, “Electrical treeing characteristics in XLPE power cable insulation in frequency range between 20 and 500 Hz,” IEEE Trans. Dielectr. Electr. Insul., vol. 16, no. 1, pp. 179–188, 2009. [Google Scholar]
16. M. M. Rahaman, C. Li, X. Wu, Y. Yao, Z. Hu et al., “A survey for cervical cytopathology image analysis using deep learning,” IEEE Access, vol. 8, pp. 61687–61710, 2020. [Google Scholar]
17. N. Otsu, “A threshold selection method from gray-level histograms,” IEEE Trans. Syst. Man. Cybern., vol. 9, no. 1, pp. 62–66, 1979. [Google Scholar]
18. J. Sauvola, T. Seppanen, S. Haapakoski and M. Pietikainen, “Adaptive document binarization,” in Proc. of the Fourth Int. Conf. on Document Analysis and Recognition, Ulm, Germany, vol. 1, pp. 147–152, 2000. [Google Scholar]
19. A. Marques, G. Racolte, D. C. Zanotta, E. Menezes, C. L. Cazarin et al., “Adaptive segmentation for discontinuity detection on karstified carbonate outcrop images from UAV-SfM acquisition and detection bias analysis,” IEEE Access, vol. 10, pp. 20514–20526, 2022. [Google Scholar]
20. X. Cheng, K. Cheng and H. Bi, “Dynamic downscaling segmentation for noisy, low-contrast in situ underwater plankton images,” IEEE Access, vol. 8, pp. 111012–111026, 2020. [Google Scholar]
21. T. Coye, “A novel retinal blood vessel segmentation algorithm for fundus images,” in MATLAB Central File Exchange. Retrieved September 24, 2020. [Online]. Available: http://www.mathworks.com/matlabcentral/fileexchange/50839. [Google Scholar]
22. A. M. R. R. Bandara and P. W. G. R. M. P. B. Giragama, “A retinal image enhancement technique for blood vessel segmentation algorithm,” in 2017 IEEE Int. Conf. on Industrial and Information Systems (ICIIS), Peradeniya, Sri Lanka, pp. 1–5, 2017. [Google Scholar]
23. D. Kaur and Y. Kaur, “Various image segmentation techniques: A review,” Int. J. Comput. Sci. Mob. Comput., vol. 3, no. 5, pp. 809–814, 2014. [Google Scholar]
24. A. Imran, J. Li, Y. Pei, J. -J. Yang and Q. Wang, “Comparative analysis of vessel segmentation techniques in retinal images,” IEEE Access, vol. 7, pp. 114862–114887, 2019. [Google Scholar]
25. Y. Yang, X. Sang, S. Yang, X. Hou and Y. Huang, “High-precision vision sensor method for dam surface displacement measurement,” IEEE Sensors Journal, vol. 19, no. 24, pp. 12475–12481, 2019. [Google Scholar]
26. A. R. Venmathi, E. N. Ganesh and N. Kumaratharan, “Kirsch compass kernel edge detection algorithm for micro calcification clusters in mammograms,” Middle-East J. Sci. Res., vol. 24, no. 4, pp. 1530–1535, 2016. [Google Scholar]
27. M. Vlachos and E. Dermatas, “Multi-scale retinal vessel segmentation using line tracking,” Comput. Med. Imaging Graph., vol. 34, no. 3, pp. 213–227, 2010. [Google Scholar]
28. D. B. Watson and M. I. Barber, “Image-processing technique for investigating dielectric breakdown trees,” IEE Proceedings, Part A Sci. Meas. Technol., vol. 139, no. 2, pp. 79–83, 1992. [Google Scholar]
29. S. Bahadoorsingh, R. Balliram, C. Sharma and S. M. Rowland, “Development of a software tool to evaluate electrical tree growth images,” in Annu Rep.-Conf. Electr. Insul. Dielectr. Phenomena, CEIDP, Cancun, Mexico, pp. 768–771, 2011. [Google Scholar]
30. S. M. Rowland, R. Schurch, M. Pattouras and Q. Li, “Application of FEA to image-based models of electrical trees with uniform conductivity,” IEEE Trans. Dielectr. Electr. Insul., vol. 22, no. 3, pp. 1537–1546, 2015. [Google Scholar]
31. D. Kavitha, T. K. Sindhu and T. N. P. Nambiar, “Investigation of treeing process in nanofilled epoxy material by finite element method,” J. Electr. Eng., vol. 14, no. 1, pp. 344–349, 2014. [Google Scholar]
32. The GIMP Development Team, “GIMP,” Retrieved January 24, 2019. [Online]. Available: https://www.gimp.org. [Google Scholar]
Cite This Article
 Copyright © 2023 The Author(s). Published by Tech Science Press.
This work is licensed under a Creative Commons Attribution 4.0 International License , which permits unrestricted use, distribution, and reproduction in any medium, provided the original work is properly cited.
 Downloads
 Citation Tools