
 Submit a Paper
 Propose a Special lssue
 Open Access
ARTICLE

Type 2 Diabetes Risk Prediction Using Deep Convolutional Neural Network Based-Bayesian Optimization
1 Computer & Information Sciences, Universiti Teknologi PETRONAS, Seri Iskandar, 32610, Perak, Malaysia
2 Centre for Research in Data Science (CERDAS), Universiti Teknologi PETRONAS, Seri Iskandar, 32610, Perak, Malaysia
3 Department of Imaging Physics, University of Texas MD Anderson Cancer, Houston, TX, USA
* Corresponding Author: Alawi Alqushaibi. Email:
Computers, Materials & Continua 2023, 75(2), 3223-3238. https://doi.org/10.32604/cmc.2023.035655
Received 29 August 2022; Accepted 08 December 2022; Issue published 31 March 2023
 View Full Text
 Download PDF
Abstract
Diabetes mellitus is a long-term condition characterized by hyperglycemia. It could lead to plenty of difficulties. According to rising morbidity in recent years, the world’s diabetic patients will exceed 642 million by 2040, implying that one out of every ten persons will be diabetic. There is no doubt that this startling figure requires immediate attention from industry and academia to promote innovation and growth in diabetes risk prediction to save individuals’ lives. Due to its rapid development, deep learning (DL) was used to predict numerous diseases. However, DL methods still suffer from their limited prediction performance due to the hyperparameters selection and parameters optimization. Therefore, the selection of hyper-parameters is critical in improving classification performance. This study presents Convolutional Neural Network (CNN) that has achieved remarkable results in many medical domains where the Bayesian optimization algorithm (BOA) has been employed for hyperparameters selection and parameters optimization. Two issues have been investigated and solved during the experiment to enhance the results. The first is the dataset class imbalance, which is solved using Synthetic Minority Oversampling Technique (SMOTE) technique. The second issue is the model's poor performance, which has been solved using the Bayesian optimization algorithm. The findings indicate that the Bayesian based-CNN model superbases all the state-of-the-art models in the literature with an accuracy of 89.36%, F1-score of 0.88.6, and Matthews Correlation Coefficient (MCC) of 0.88.6.Keywords
Diabetes is a widespread chronic condition that considerably threatens human health. Blood sugar levels that are abnormally high indicate diabetes. Malfunctioning insulin production and how insulin works in the body may lead to this condition [1]. The eyes, kidneys, heart, blood vessels, and nerves are simply some of the organs diabetes can harm or even cause to fail over time [2]. Two distinct forms of diabetes are recognized: Type 1 Diabetes (T1D) and Type 2 Diabetes (T2D). People under the age of 30 make up the vast majority of T1D patients. Dry mouth, increased urine, and high blood sugar are the most prominent symptoms [3]. Patients with this kind of diabetes need insulin treatment since oral medications are ineffective. Adults in the middle and later stages of life are at a higher risk of developing T2D because of the prevalence of related conditions such as obesity, hypertension, dyslipidemia, atherosclerosis, and others [4].
Additionally, Glucose levels in the human body are considered normal when they fall between 70 and 99 mg/dL. A person is diagnosed with diabetes if their fasting glucose level is more significant than 126 mg/dL [3]. An individual with a glucose concentration between 100 and 125 Milligrams per deciliter (mg/dL) is considered pre-diabetic in medical practice [5]. This individual is prone to developing type 2 diabetes. Predictive analysis (PA) is significant in the healthcare field. PA uses current and historical data to identify insights and anticipate future occurrences using a variety of machine learning algorithms, data mining approaches, and statistical methodology [6]. Applying predictive analytics to healthcare data makes it possible to make significant decisions and predictions with the help of machine learning. Predictive analytics aims to accurately diagnose disease, improve patient care, optimize resources, and enhance clinical outcomes [7]. Machine learning is one of the essential characteristics of artificial intelligence since it enables the construction of computer systems that can acquire information from prior experiences without the need for explicit programming [8]. Existing diabetes screening methods utilize laboratory tests such as fasting blood glucose and oral glucose tolerance. However, both ways are still not efficient and effective in predicting diabetes. The laboratory tests are time-consuming and costly, while ML still has limited performance.
Deep learning (DL) is a practical research approach in the field of ML that involves training computers to carry out activities that are typically carried out by humans [9]. It is distinguished by a hierarchical architecture that spans multiple layers and features a progression of steps for data processing [10]. Recurrent Neural Networks (RNN) and Convolutional Neural Networks are the two categories that fall under the domain of deep learning [11]. Deep convolutional neural networks (DCNN) have lately shown remarkable success in several disciplines, including computer vision [12,13], medical imaging [14], signal processing [15], sequence prediction [13], and time-series prediction [16,17]. CNNs consist of multiple layers, such as convolution, pooling, and fully-connected layers. Once these layers are saved, they can automatically show discriminating characteristics without manually hand-crafting [18].
Even though numerous academics have implemented deep learning techniques in various applications due to their robust findings, it still has several drawbacks. One of the most challenging aspects of deep learning is the selection and optimization of hyper-parameters. Model parameters are aspects of training data that are frequently used to evaluate the performance of a model. It plays a substantial role in every dataset, influencing training performance, particularly for large-dimensional datasets. Therefore, the selection of hyper-parameters is crucial to improving the classification performance of type 2 diabetes risk. Hence, this study proposed an optimized deep convolutional neural network based-Bayesian optimization algorithm (BOA) for hyperparameter selection and CNN parameter optimization to enhance the diabetes risk prediction. Unlike previous studies in the literature, which introduce their deep learning methods on classical optimization methods like grid or random search. In this study, we have built and investigated the performance of fourteen standard machine learning classifiers which are commonly used in the literature on diabetes risk prediction. The optimized DCNN model and fourteen ML classifiers are tested on the same public dataset, and the findings confirm that the proposed optimized DCNN has surpassed the fourteen classifiers used in the literature, while logistic regression (LR) outperforms the other 13 ML classifier used in this study. Therefore, the contributions of this study are summarized in threefold:
• We extensively reviewed quality papers on diabetes risk prediction using classical ML and deep learning methods.
• We investigated fourteen machine learning classifiers commonly used in the literature on diabetes risk prediction and tested their usability and performance on a sizable generic dataset for type 2 diabetes risk prediction. We have also conducted a comparative analysis based on well-known evaluation measures.
• Hybridization of SMOTE data sampling and DCNN to overcome inherent class imbalance problem.
• We have proposed a deep convolutional neural network model based-BOA on hyperparameters selection and parameters optimization.
The rest of the paper is structured as follows. Section 1 introduced the background of diabetes prediction. Section 2 provides an extensive literature review and discussion on the state-of-the-art diabetes prediction methods; Section 3 provides the proposed methodology and overview of the proposed diabetes prediction model. Section 4 presents the results and analysis of this work. Finally, section 5 concludes the study and provides insights for future work.
Deep learning is a subfield of machine learning that involves training computers to carry out activities that are typically conducted by humans [19–21]. CNN’s network architecture was primarily developed for two dimensions (2D) data processing. Compared to other deep learning architectures, CNNs can perform better image processing and classification problems [22]. CNN has become more popular as a modelling strategy for multivariate time series data [23], with multiple convolution pooling layers [24] doing sparse processing and extraction on a layer-by-layer basis. CNNs have several uses in which they are helpful and, as a result, are preferred to other deep learning models in dealing with image processing and classification problems. In order to train CNN networks, the procedure known as regular error back-propagation can be utilized [19]. They are simpler to train than other types of regular deep and unidirectional neural networks because they have fewer optimal parameters [25]. Instead of employing individually created features, deep learning techniques, and convolutional neural networks, have a structure where feature extraction and prediction are performed concurrently in a single body block. Deep learning may extract meaningful features from raw data [23].
The investigation of related work yields results on various healthcare datasets, each subjected to diverse approaches and procedures for analysis and prediction. Researchers from various fields have combined different iterations of data mining and machine learning algorithms, as well as other methods, to design and execute various prediction models.
In order to predict diabetes, Shetty et al. [26] employed KNN, and the Naive Bayes approach has also been applied. Their method was applied in the form of an expert software program. Singh et al. [27] used various methods to analyze data from several distinct kinds of datasets. They employed the KNN technique and the random forest, and Naive Bayesian. To conduct the assessment, the K-fold cross-validation method was utilized. To categorize diabetes, Banaee et al. [28] incorporated patient information and a plan of treatment dimensions. The Naive Bayes method, the logistic algorithm, and the J48 algorithm were the ones that were used in his study. Data from medical records were exploited by Gnana et al. [29] in order to predict diabetes. After the data had been pre-processed, the Naive Bayes, function-based multilayer perceptron (MLP), and decision tree-based random forests (RF) algorithms were employed. A technique called correlation-based feature selection was used to eliminate unnecessary characteristics. After that, a learning model predicted whether the patient had diabetes or not. Compared with other machine learning algorithms, the Naive Bayes results showed significant improvement after undergoing a pre-processing procedure. Azrar et al. [30] utilized the PID dataset in order to evaluate and contrast a variety of data mining techniques for the early prediction of diabetes. Bhardwaj et al. [31] created a method for predicting cardiac disease using the Naive Bayes, ANN, and decision tree algorithms. Delen et al. [32] predicted breast cancer using a large dataset using logistic regression, artificial neural networks (ANN), and decision trees. Pattekari et al. [33] created a web-based tool that uses Naive Bayes to predict myocardial infarction. Küçük et al. [34] used the SVM model in a high-dimensional medical dataset in order to correctly detect cases of diabetes. Saravana Kumar et al. [35] developed a system to analyze diabetic patient information using Hadoop and the Map Reduce approaches. Their system can specify the diabetes type and the possible dangers that might occur. Iyer et al., in [36] research, used a classification method to investigate previously unidentified patterns in the diabetes dataset. Both the Naive Bayes and the Decision Tree techniques are used in this model. Comparisons of both algorithms’ performance were made, and as a result, the value of both approaches was shown.
This section introduces the methodology used to achieve the main aim of this study. The overview of the proposed method to predict type 2 diabetes risk using deep learning is presented in Fig. 1. The prediction pipelines are shown in four essential steps: Benchmark data collection, pre-processing, modelling prediction and result analysis. The following subsections briefly describe each step and technique used in this work.
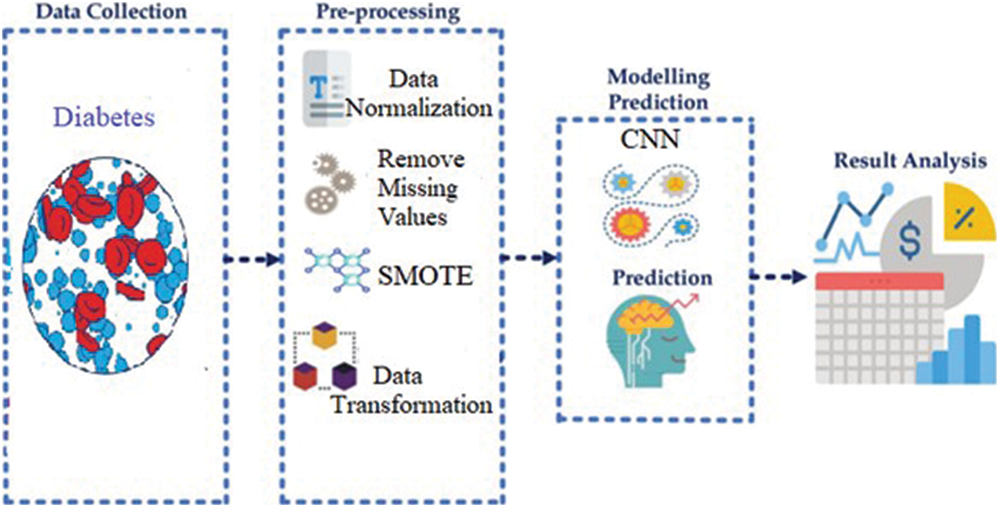
Figure 1: Overview of proposed diabetes prediction model
The dataset used in this study is a benchmark dataset used widely in the literature for diabetes prediction and is called Diabetes Health Indicators Dataset. This dataset was released by Centers for disease control and prevention [37] and has been collected from Kaggle [37], and it has two classes for prediction purposes, namely Diabetic and Non-Diabetic. The benchmark dataset has 22 columns. Out of 22 columns, eight were dropped (income, education, healthcare, nodocbccost, genhlth, menthlth, physhlth, diffwalk) and fourteen were selected for the prediction purposes as most of the literature did. The fourteen significant features used for diabetes prediction are shown with their correlations in the heatmaps illustrated in Fig. 2.

Figure 2: Diabetes features correlation using the heatmap
The first step of pre-processing is data normalization. The data has been normalized between the range of 0 and 1 using the Min-Max normalization technique. Therefore, we have used the functions isnull() and notnull() to check missing values. Both functions help in checking whether a value is NaN or not. After that, the data had class imbalance issues, so we applied SMOTE to overcome the class imbalance. One of the most typical methods for dealing with an imbalanced dataset is to resample it. The two most common strategies are undersampling and oversampling [38].
In most cases, oversampling approaches are better than undersampling strategies [39]. A well-known oversampling approach is SMOTE. SMOTE is an oversampling technique that generates synthetic samples for the minority class. This approach assists in overcoming the overfitting problem induced by random oversampling. It concentrates on the feature space to generate new examples by interpolating between nearby positive instances [40]. Finally, after the class imbalance problem was solved, we performed feature ranking, as shown in Fig. 3. The data was transformed into a suitable shape for the training of the CNN model. The CNN model implementation is described in the next section.

Figure 3: Diabetes type 2 features importance
3.3 Modeling Prediction Using CNN
CNNs are meant to address learning issues that need high-dimensional input data with complex spatial structures, and they have yielded excellent results in fields such as computer vision [12,13], medical imaging [14], amino acid sequencing [10,11], and illness prediction. CNNs attempt to construct hierarchical filters to turn massive quantities of input data into accurate class labels with a small number of trainable parameters. This is achieved by letting sparse interactions between input data and trainable parameters through parameter sharing to construct equivariant representations (known as feature maps) of the detailed and spatially organized input data [18]. Table 1 presents the 1D-CNN model of the diabetes prediction model, while Fig. 4 illustrates the General model architecture.
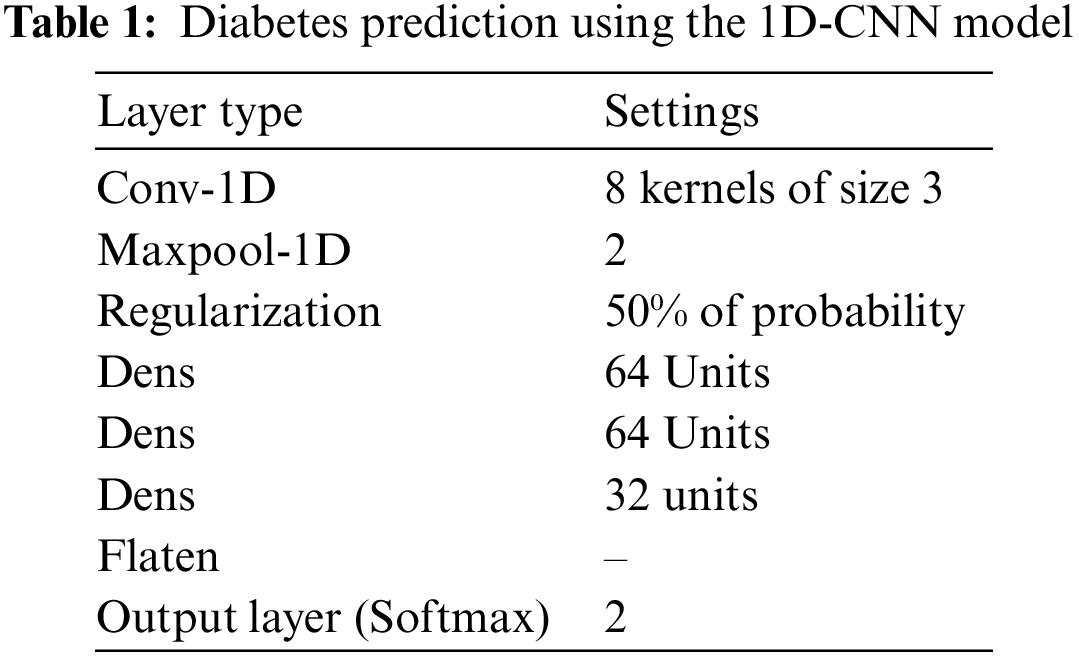

Figure 4: General model architecture
3.4 Bayesian Optimization (BO)
Bayesian optimization is a more desirable method for fine-tuning hyperparameters through automated model tweaking. It is a sequential design technique for the global optimization of black-box functions that takes no functional forms into account [41,42]. This indicates that the algorithm improves with each iteration by considering the information gained from the previous iteration, and the results of one iteration contribute to the development of the subsequent iteration. To some extent, Bayesian Optimization and Random Search are similar in that they both employ a sampling strategy to determine the ideal values for the hyperparameters. However, when selecting the subset of optimal values, the two methods take very different approaches. The model’s final score on a held-out test set, often known as its accuracy, is the function that will be optimized in this process. The minimal value for this function can then be found using any available global optimization framework. One of the many surrogate models that are utilized in Bayesian Optimization is known as the Gaussian Process (GP).
In recent years, Bayesian optimization has been confirmed as a go-to technique for handling non-convex black-box functions in global optimization issues. Bayesian optimization, mainly through a Gaussian process (GP), is a hot topic in the field of machine learning [43–46]. A recent theoretical proposal by De Freitas et al. [47] suggests a method that, despite requiring access to the cover sampling mechanism, maintains an exponential convergence rate (it samples the function evenly such that the density of samples doubles in the viable regions at each iteration). However, as Wang et al. [48] point out, developing a GP-based optimization method with an exponential convergence rate without the cover sampling procedure, which is computationally prohibitively expensive in many cases, is a long-term problem.
3.5 Evaluation of Model Performance
In this work, the proposed type 2 diabetes predictor model effectiveness is evaluated using several measures to examine the model’s efficiency in accurately predicting diabetic and non-diabetic individuals. It is essential to review standard evaluation measures in the scientific research community to understand the performance of the diabetes-presented model. The most comprehensive evaluation measures used in the literature are as follows:
• Accuracy measure is calculated as the ratio of actual identified cases to total cases and has been commonly used to evaluate diabetes prediction models. As a result, it can be calculated as follows:
where TP denotes true positive, TN is a true negative, FP means false positive, and FN is a false negative.
• Precision measure computes the fraction of relevant diabetes among true positive TP and false positive FP diabetes belonging to a specific class.
• Recall measure computes the ratio of total relevant diabetes cases retrieved relative to the total number of relevant diabetes cases.
• F-Measure combines accuracy and recalls into a single metric to capture both properties.
Studies of diabetes prediction models have used the evaluation measures for performance assessment:
The above performance evaluation measures have been used to evaluate the optimized DL model performance with the related literature contributions.
This section clarifies the results of different classical ML classifiers and optimized CNN-based Bayesian optimization model used in this study and implemented to predict the risk of type 2 diabetes. The critical evaluation matrices utilized in this study are the receiver operating characteristics curve (ROC) and precision-recall curves. ROC curve is a beneficial two-dimensional depiction of the trade-off between the true positive and false-positive rates. During the training process, both models were tested on a different collection of test data that was not utilized during the predictor phase. The data was built this way to ensure outcomes are equal and test the predictors’ generalization capabilities. Fig. 5 shows confusion matrices of different model evaluation metrics extracted from a matrix that includes four terms:
• True-positive (TP): If the sample includes type 2 diabetes, the prediction is true positive, and the model prediction conforms with type 2 diabetes presence.
• False-positive (FP): If the sample does not contain type 2 diabetes, the outcome is considered false positive, but the model under consideration predicts the existence of type 2 diabetes.
• False-negative (FN): If the sample has type 2 diabetes, but the model negates the presence of type 2 diabetes, the effect is a false negative.
• True-negative (TN): If the sample does not contain the site of type 2 diabetes and the tested model also predicts that there is no such site of type 2 diabetes, then true negative is the consequence.

Figure 5: Confusion matrix of optimized CNN-based Bayesian optimization method and LR as the best predictor among classical ML predictors
The following subsection describes the model evaluation parameters used in this analysis, which is sufficient to convey the evaluation results. All assessment results come from independent test samples that have not been used in the training process of optimized CNN-based models to ensure fairness.
4.1 Receiver Operating Characteristics Curve (ROC)
The Area Under the Curve (AUC) indicates how a classifier can differentiate between classes and is utilized as a ROC curve summary. The greater the AUC, the better the model’s efficiency in differentiating the positive and negative samples [10]. In other words, the ROC curve is also known as a recall of the false positive and true positive rates. The ROC curve [11] helps shed light on evaluating the classifier’s costs and benefits. The false positive rate is calculated by dividing the number of false positives by the total number of negative samples. This is regarded as the cost because any further action taken on the false positive outcome is wasted, considering it a positive prediction. True positive rate, defined as the proportion of positive cases accurately predicted, might be regarded as an advantage since the classifier’s true positive predictions outperform the analyzed issue. Figs. 6a shows AUC curve for the classical LR classifier, while Figs. 6b and 6c show the AUC curve-based-CNN predictor performance before and after employing the Bayesian optimization method, where the Optimized CNN model shows the best performance compared to the classical CNN and RL model with a score of 0.8800, while the classical CNN and RL model achieved only a score of 0.8406 and 0.8035, respectively.
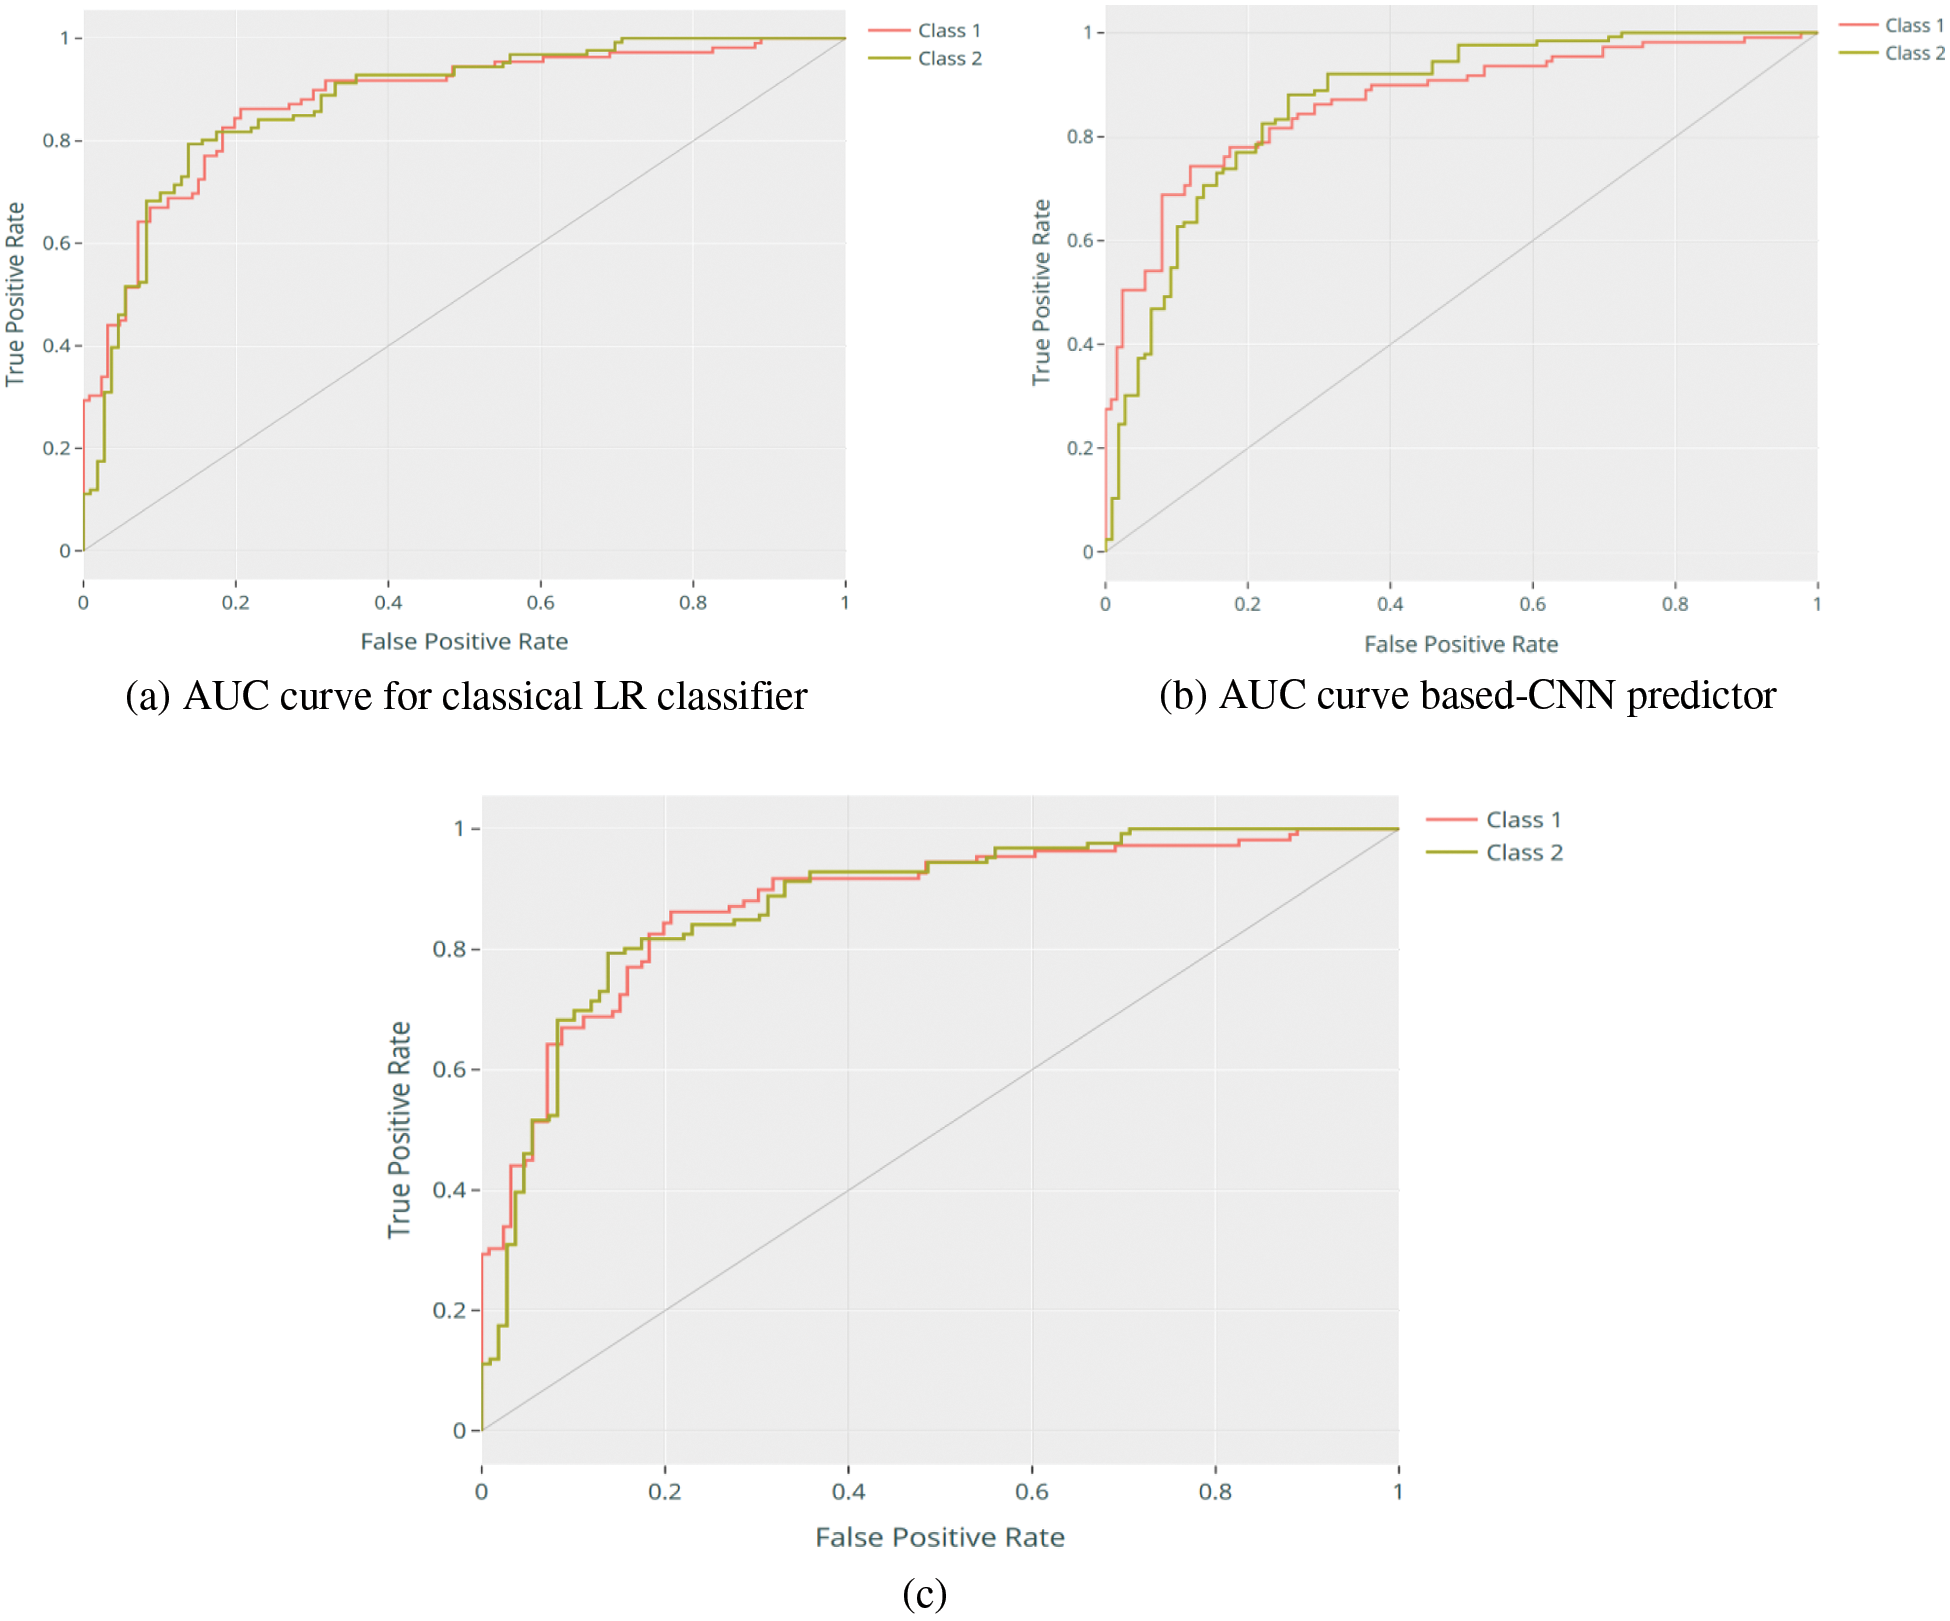
Figure 6: AUC curve of CNN-based Bayesian optimization predictor
4.2 Accuracy, F1-Measure, and Matthew Correlation Coefficient
Accuracy is a standard statical evaluation metric used to evaluate models that are trained using balanced datasets. This shows how many samples were correctly estimated out of the total number of samples being used to test the model. Fig. 7 shows the accuracy and loss scores for the Type 2 Diabetes Risk Prediction models, determined from an independent test sample. As depicted in Fig. 7b, the accuracy and validation curve of the CNN-based model has been optimized compared to Fig. 7a where the curve is smoothed, and the number of epochs is reduced during the model training. Similarly goes for the model loss presented in Fig. 7c compared to Fig. 7d.
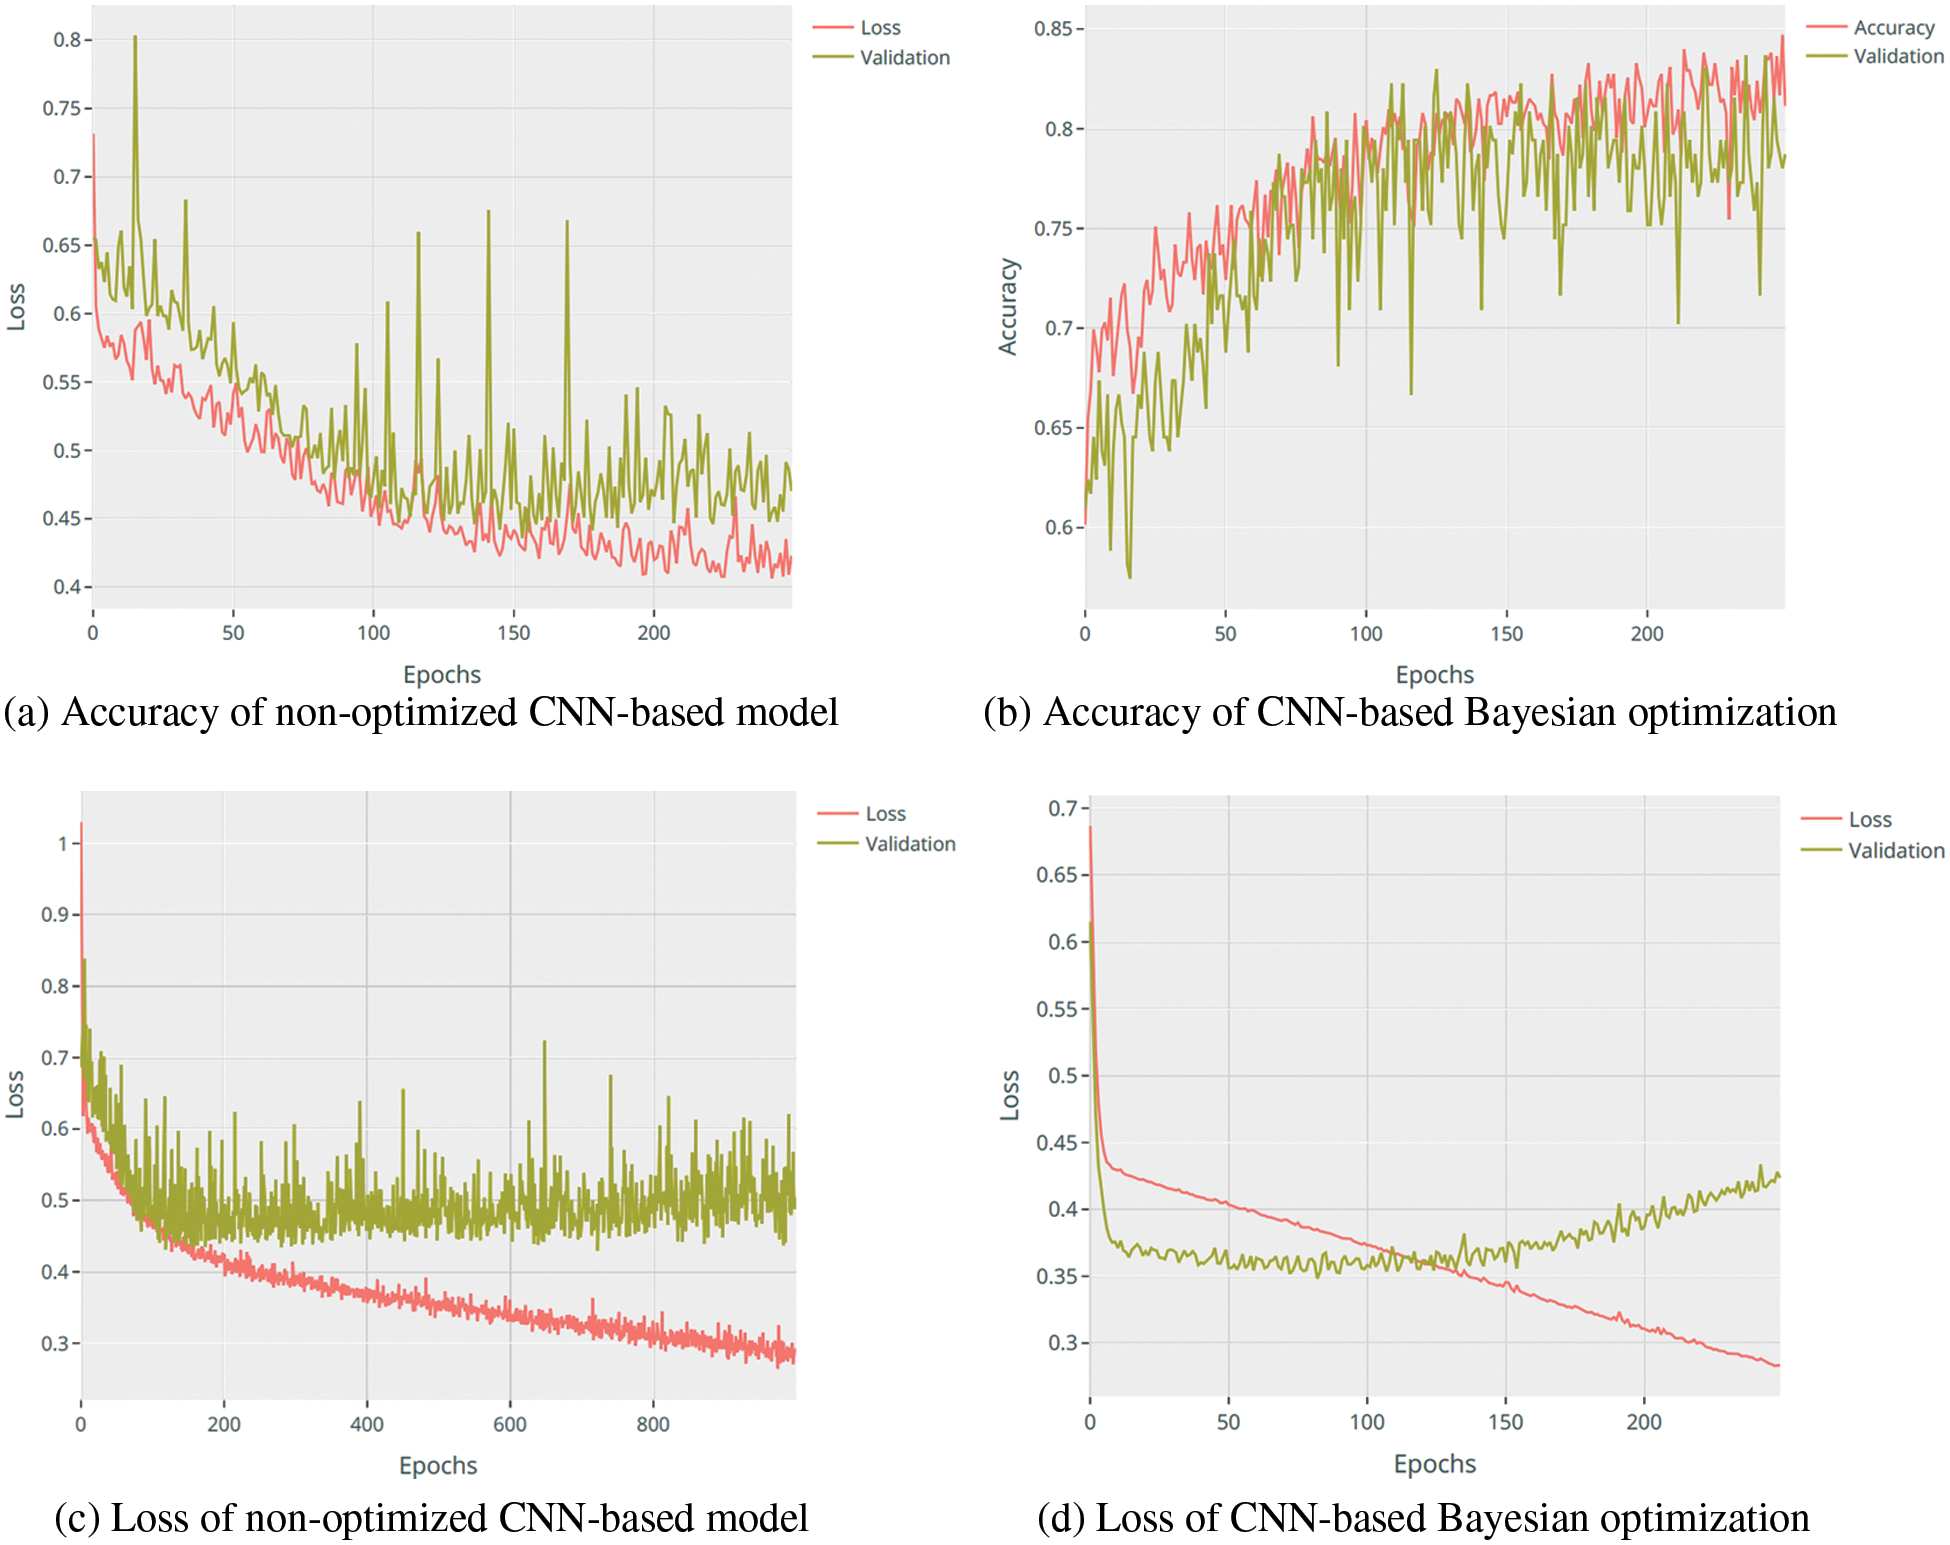
Figure 7: AUC curve of CNN-based Bayesian optimization predictor
When evaluating prediction models, accuracy and recall are crucial measures. Precision tests the relevance of the expected positive outcomes. At the same time, recall measures the model’s ability to predict positive samples, and have a high ratio of true positives (high precision) when predicting the most positive type samples in the data set (high recall).
Nevertheless, in situations where an optimum combination of precision and recall is required, F1 measure is frequently employed. The F1 score is a model’s harmonic mean of precision and recall scores. Thus, Table 2 shows the comparative analysis of fourteen classical ML classifiers that have been tested and evaluated in their performance compared to the optimized CNN-model for type 2 diabetes predication in terms of Accuracy, AUC, Recall, Prec, F1, and MCC.
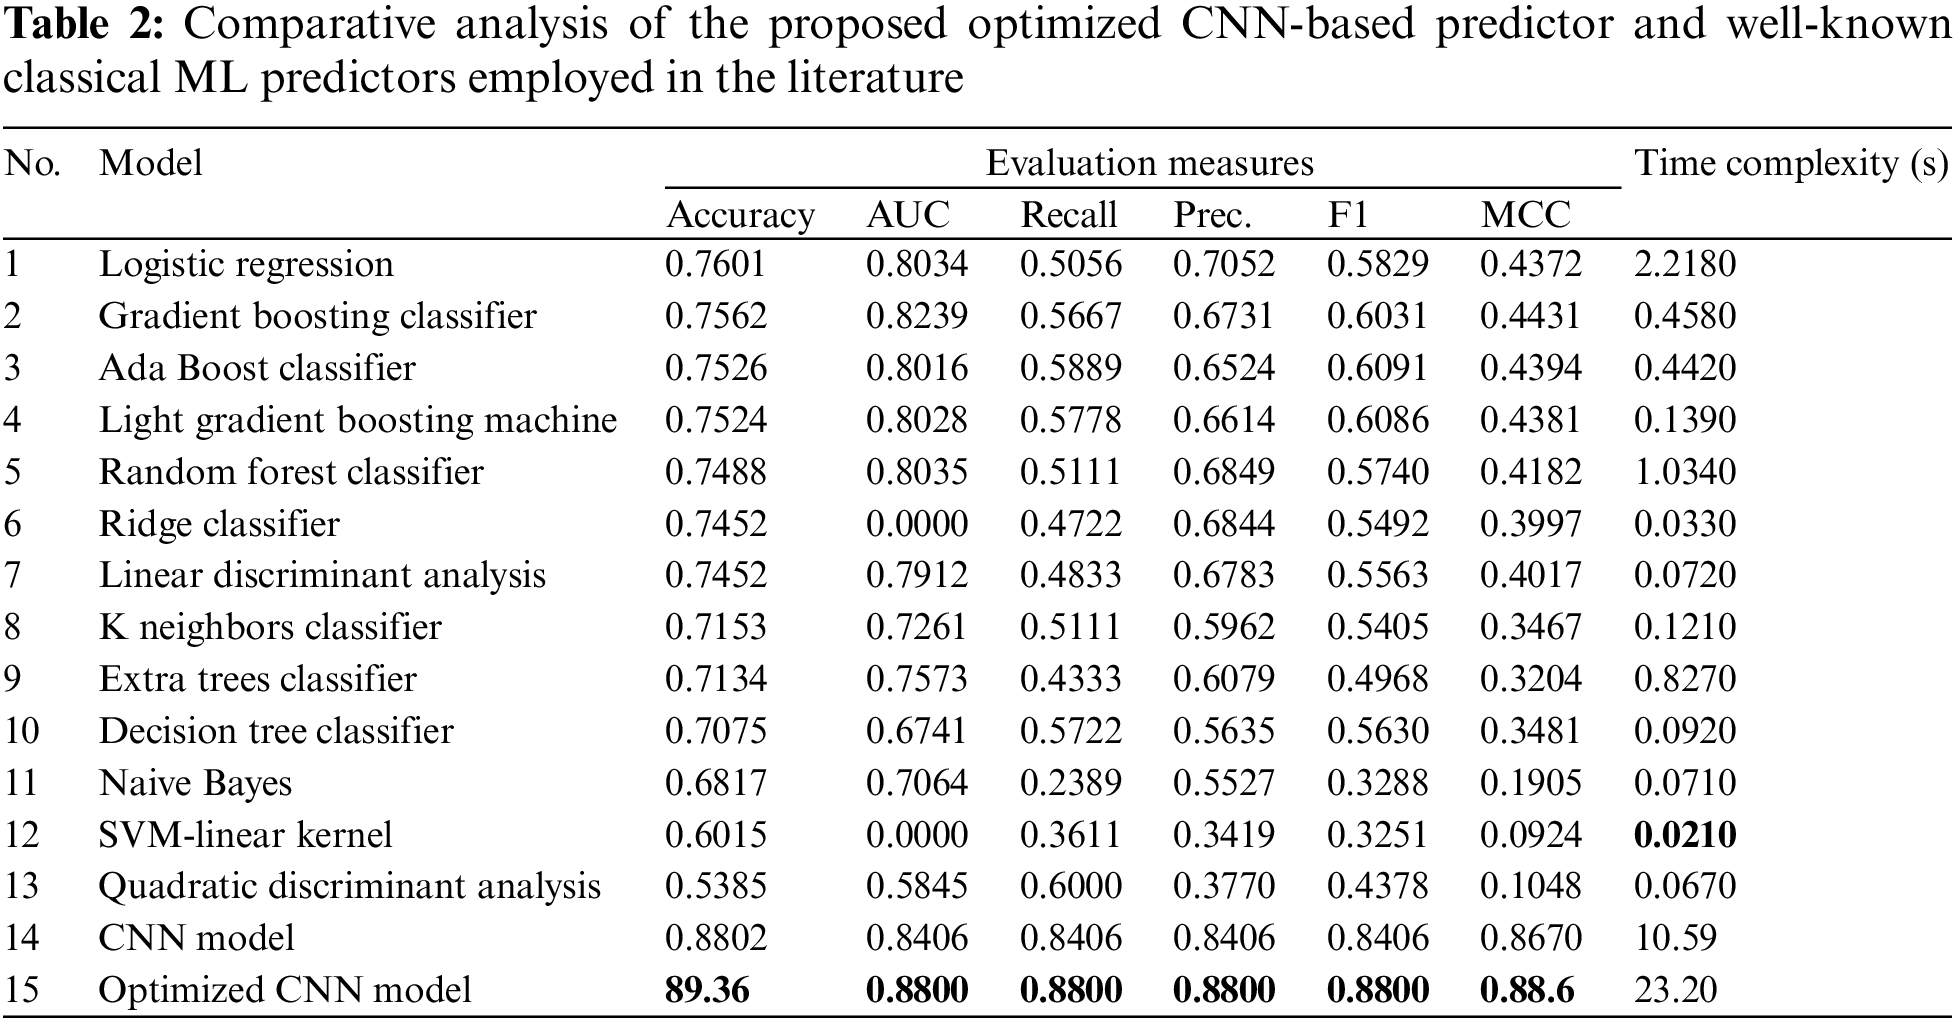
Table 2 shows the F1 prediction values for type 2 diabetes risk prediction based on the 15 used predictors employed in this study, which validates the earlier performance demonstrated using the AUC and accuracy scores. The CNN model achieved an optimal F1 score of 0.8406, while the LR predictor obtained second place with an F1 score of 0.7052. They were followed by a random forest classifier and Ridge Classifier, where they achieved an F1 score of 0.6849 and 0.6844, respectively. Similarly, the Gradient Boosting Classifier obtained the fifth-place F1 score with a rating of 0.6731. However, the SVM-linear kernel classifier obtained the worse performance with an F1 score of 0.3251. In terms of recall evaluation measure, the Naive Bayes obtained the worse score 0.2389, while the optimized CNN-based BOA model achieved the best score of 0.8800.
Matthews Correlation Coefficient is proved to be an efficient solution to overcome class imbalance issues in the dataset that are prevalent in accuracy and other binary classification model evaluators. Matthews first developed MCC in 1975 to compare chemical structures, and in 2000 Baldi and colleagues publicized MCC as a standard performance metric for binary classification models with a natural extension to the multiclass case. The MCC is a more robust statistical rate that yields a high score only if all four confusion matrix classes (true positives, false negatives, true negatives, and false positives) receive strong identification results as a percentage of positive and negative classes in the dataset [49,50].
The outcomes of MCC for all classical ML classifiers and optimized CNN predictor models proposed in this study are shown in Table 2. Based on MCC, the optimized CNN-based BOA model has achieved a performance rate of 0.88.6 and the classical CNN model achieved a performance rate of 0.8670, followed by the Gradient Boosting and Ada Boost, achieving a performance rate of 0.4314 and 0.4310. For the light gradient boosting machine, it obtained a performance rate of 0.4299. To conclude, the logistic regression obtained the worse performance rate of around 0.4221 in terms of MCC evaluation matric.
The summary of the comparative analysis accuracy of the fifteen predictors developed in this study to type 2 diabetes risk is presented in Fig. 8, where the Bayesian-based optimized-CNN model has outperformed all the ML classical classifiers that are widely employed in the related literature contributions of type 2 diabetes risk prediction. Meanwhile, the LR classifier has second place in terms of performance.

Figure 8: Accuracy comparison of all models employed in this study for diabetes risk prediction
Table 2 compares the training and prediction times of the top and poorest traditional ML predictors of type 2 diabetes. Table 2 shows that SVM-Linear Kernel achieved the best training time and LR achieved the worst training time, 0.014 and 2.2180 s, respectively. Conversely, LR surpasses all the classifiers used in this study. Additionally, the classical CNN model’s time complexity is 10.59 s, and the CNN-based Bayesian optimization model is 23.20 s; this is due to the CNN model’s complex structure compared to the classical ML models with a simpler structure. However, as shown in Table 2, there were minor differences between Naive Bayes, dummy classifiers, and SVM-Linear Kernel.
5 Challenges and Future Studies
Selection of the optimal hyperparameter remains a big challenge in the optimization domain. That is because of the different variations between neural networks’ structures as well as the type and size of the dataset. Although Bayesian optimization is an efficient hyperparameter optimization algorithm, its approach is conceptually complex and difficult to parallelize. A trial in BO must be learned from previous trials, resulting in a parallelism problem. Thus, one of the future works is to incorporate and test metaheuristic optimization methods instead of Bayesian optimization to improve the CNN classification performance further. Another limitation we are working on is investigating several deep learning models for type 2 diabetes risk prediction that will be useful in accurately detecting and preventing diabetes risk.
This study proposed an optimized CNN to predict diabetes by incorporating the Bayesian optimization algorithm. The optimized CNN model is employed on the diabetes health indicators dataset, and the prediction results demonstrate that the proposed method has achieved the highest accuracy of 89.36%. The diabetes prediction model has been evaluated with precision, recall and F-measure, and the results were 0.8800 for each, whereas the MCC result obtained was 0.88.6, respectively. Therefore, a comparative analysis was conducted, and the presented model in this work has shown a good performance and a satisfactory result. During the experiment, it was observed that the Bayesian optimization algorithm has further enhanced the model performance and prediction outcomes. In future work, various DNN methods will be investigated and evaluated to determine which DNN method is more accurate for diabetes prediction to be developed and used in healthcare instead of manual laboratory tests.
Funding Statement: This research/paper was fully supported by Universiti Teknologi PETRONAS, under the Yayasan Universiti Teknologi PETRONAS (YUTP) Fundamental Research Grant Scheme (015LC0-311).
Conflicts of Interest: The authors declare that they have no conflicts of interest to report regarding the present study.
References
1. Q. Zou, K. Qu, Y. Luo, D. Yin, Y. Ju et al., “Predicting diabetes mellitus with machine learning techniques,” Frontiers in Genetics, vol. 9, pp. 515, 2018. [Google Scholar] [PubMed]
2. H. Lai, H. Huang, K. Keshavjee, A. Guergachi and X. Gao, “Predictive models for diabetes mellitus using machine learning techniques,” BMC Endocrine Disorders, vol. 19, no. 1, pp. 1–9, 2019. [Google Scholar]
3. N. P. Tigga and S. Garg, “Prediction of type 2 diabetes using machine learning classification methods,” in Int. Conf. on Computational Intelligence and Data Science (ICCIDS 2019Procedia Computer Science, Gurugram, India, vol. 167, pp. 706–716, 2020. [Google Scholar]
4. G. Robertson, E. D. Lehmann, W. Sandham and D. Hamilton, “Blood glucose prediction using artificial neural networks trained with the AIDA diabetes simulator: A proof-of-concept pilot study,” Journal of Electrical and Computer Engineering, vol. 2011, no. 2, pp. 2, 2011. [Google Scholar]
5. Diabetes. Digital Media Ltd, “Diabetes.co.uk—The global diabetes community Digital Media Ltd.,” (accessed Jul. 7, 20222019. [Online]. Available: https://www.diabetes.co.uk/diabetes-charities.html [Google Scholar]
6. M. A. Sarwar, N. Kamal, W. Hamid and M. A. Shah, “Prediction of diabetes using machine learning algorithms in healthcare,” in 24th Int. Conf. on Automation and Computing (ICAC), Newcastle upon Tyne, United Kingdom, pp. 1–6, 2018. [Google Scholar]
7. A. Mujumdar and V. Vaidehi, “Diabetes prediction using machine learning algorithms,” in Int. Conf. on Recent Trends in Advanced Computing 2019, ICRTAC, Procedia Computer Science, Chennai, India, vol. 165, pp. 292–299, 2019. [Google Scholar]
8. R. Krishnamoorthi, S. Joshi, H. Z. Almarzouki, P. K. Shukla, A. Rizwan et al., “A novel diabetes healthcare disease prediction framework using machine learning techniques,” Journal of Healthcare Engineering, vol. 2022, no. 3, pp. 1–10, 2022. [Google Scholar]
9. S. Bhattacharyya, V. Snasel, A. E. Hassanien, S. Saha and B. K. Tripathy, Deep Learning: Research and Applications, 1st ed., United States: Walter de Gruyter GmbH & Co KG, 2020. [Google Scholar]
10. S. Naseer, S. M. Fati, A. Muneer and R. F. Ali, “iAceS-Deep: Sequence-based identification of acetyl serine sites in proteins using PseAAC and deep neural representations,” IEEE Access, vol. 10, pp. 12953–12965, 2022. [Google Scholar]
11. S. Naseer, R. F. Ali, S. M. Fati and A. Muneer, “Computational identification of 4-carboxyglutamate sites to supplement physiological studies using deep learning,” Scientific Reports, vol. 12, no. 1, pp. 1–15, 2022. [Google Scholar]
12. A. Muneer and S. M. Fati, “Efficient and automated herbs classification approach based on shape and texture features using deep learning,” IEEE Access, vol. 8, pp. 196747–196764, 2020. [Google Scholar]
13. M. G. Ragab, S. J. Abdulkadir and N. Aziz, “Random search one dimensional CNN for human activity recognition,” in 2020 Int. Conf. on Computational Intelligence (ICCI2020), Seri Iskandar, Malaysia, pp. 86–91, 2020. [Google Scholar]
14. M. Hammad, M. Bakrey, A. Bakhiet, R. Tadeusiewicz, A. A. A. El-Latif et al., “A novel end-to-end deep learning approach for cancer detection based on microscopic medical images,” Biocybernetics and Biomedical Engineering, vol. 42, no. 3, pp. 737–748, 2022. [Google Scholar]
15. A. Muneer, S. M. Taib, S. Naseer, R. F. Ali and I. A. Aziz, “Data-driven deep learning-based attention mechanism for remaining useful life prediction: Case study application to turbofan engine analysis,” Electronics, vol. 10, no. 20, pp. 2453, 2021. [Google Scholar]
16. A. Muneer, S. M. Taib, S. M. Fati and H. Alhussian, “Deep-learning based prognosis approach for remaining useful life prediction of turbofan engine,” Symmetry, vol. 13, no. 10, pp. 1–21, 2021. [Google Scholar]
17. A. Alqushaibi, S. J. Abdulkadir, H. M. Rais, Q. Al-Tashi, M. G. Ragab et al., “Enhanced weight-optimized recurrent neural networks based on sine cosine algorithm for wave height prediction,” Journal of Marine Science and Engineering, vol. 9, no. 5, pp. 524, 2021. [Google Scholar]
18. S. Naseer, R. F. Ali, S. M. Fati and A. Muneer, “INitroY-Deep: Computational identification of nitrotyrosine sites to supplement carcinogenesis studies using deep learning,” IEEE Access, vol. 9, pp. 73624–73640, 2021. [Google Scholar]
19. Y. LeCun, Y. Bengio and G. Hinton, “Deep learning,” Nature, vol. 521, no. 7553, pp. 436–444, 2015. [Google Scholar] [PubMed]
20. M. Cocskun, Ö. Yildirim, U. Aycsegül and Y. Demir, “An overview of popular deep learning methods,” European Journal of Technique, vol. 7, no. 2, pp. 165–176, 2017. [Google Scholar]
21. Y. Bengio, I. Goodfellow and A. Courville, Deep Learning. Vol. 1. Cambridge, Massachusetts: The MIT Press, 2017. [Online]. Available at: https://lccn.loc.gov/2016022992 [Google Scholar]
22. J. Schmidhuber, “Deep learning in neural networks: An overview,” Neural Networks, vol. 61, no. 3, pp. 85–117, 2015. [Google Scholar] [PubMed]
23. S. Huang, J. Tang, J. Dai and Y. Wang, “Signal status recognition based on 1DCNN and its feature extraction mechanism analysis,” Sensors, vol. 19, no. 9, pp. 2018, 2019. [Google Scholar] [PubMed]
24. W. Zhang, G. Peng, C. Li, Y. Chen and Z. Zhang, “A new deep learning model for fault diagnosis with good anti-noise and domain adaptation ability on raw vibration signals,” Sensors, vol. 17, no. 2, pp. 425, 2017. [Google Scholar] [PubMed]
25. F. C. Soon, H. Y. Khaw, J. H. Chuah and J. Kanesan, “Hyper-parameters optimization of deep CNN architecture for vehicle logo recognition,” IET Intelligent Transport Systems, vol. 12, no. 8, pp. 939–946, 2018. [Google Scholar]
26. D. Shetty, K. Rit, S. Shaikh and N. Patil, “Diabetes disease prediction using data mining,” in Proc. of 2017 Int. Conf. on Innovations in Information, Embedded and Communication Systems, ICIIECS 2017, Coimbatore, India, pp. 1–5, 2018. [Google Scholar]
27. A. Singh, M. N. Halgamuge and R. Lakshmiganthan, “Impact of different data types on classifier performance of random forest, naïve bayes, and k-nearest neighbors algorithms,” International Journal of Advanced Computer Science and Applications, vol. 8, no. 12, pp. 1–10, 2017. [Google Scholar]
28. H. Banaee, M. U. Ahmed and A. Loutfi, “Data mining for wearable sensors in health monitoring systems: A review of recent trends and challenges,” Sensors, vol. 13, no. 12, pp. 17472–17500, 2013. [Google Scholar] [PubMed]
29. A. Gnana, E. Leavline and B. Baig, “Diabetes prediction using medical data,” Journal of Computational Intelligence in Bioinformatics, vol. 10, no. 1, pp. 1–8, 2017. [Google Scholar]
30. A. Azrar, M. Awais, Y. Ali and K. Zaheer, “Data mining models comparison for diabetes prediction,” International Journal of Advanced Computer Science and Applications, vol. 9, no. 8, pp. 320–323, 2018. [Google Scholar]
31. S. Bhardwaj, S. Jain, N. K. Trivedi, A. Kumar and R. G. Tiwari, “Intelligent heart disease prediction system using data mining modelling techniques,” International Journal of Advanced Research in Computer and Communication Engineering, vol. 425, pp. 881–891, 2022. [Google Scholar]
32. D. Delen, G. Walker and A. Kadam, “Predicting breast cancer survivability: A comparison of three data mining methods,” Artificial Intelligence in Medicine, vol. 34, no. 2, pp. 113–127, 2005. [Google Scholar] [PubMed]
33. S. A. Pattekari and A. Parveen, “Prediction system for heart disease using naïve bayes,” International Journal of Advanced Computer and Mathematical Sciences, vol. 3, no. 3, pp. 290–294, 2012. [Google Scholar]
34. H. Küçük and I. Eminoʇlu, “Classification of ALS disease using support vector machines,” in 23rd Signal Processing and Communications Applications Conf., Malatya, Turkey, pp. 1664–1667, 2015. [Google Scholar]
35. N. M. Saravana Kumar, T. Eswari, P. Sampath and S. Lavanya, “Predictive methodology for diabetic data analysis in big data,” in 2nd Int. Symp. on Big Data and Cloud Computing (ISBCC’15Procedia Computer Science, Chennai, India, pp. 203–208, 2015. [Google Scholar]
36. A. Iyer, S. Jeyalatha and R. Sumbaly, “Diagnosis of diabetes using classification mining techniques,” International Journal of Data Mining & Knowledge Management Process, vol. 5, no. 1, pp. 1–14, 2015. [Google Scholar]
37. Centers for Disease Control and Prevention, “Behavioral risk factor surveillance system,” (accessed Jul. 17, 20222017. [Online]. Available: https://www.kaggle.com/datasets/cdc/behavioral-risk-factor-surveillance-system [Google Scholar]
38. A. Al-Ragehi, S. Jadid Abdulkadir, A. Muneer, S. Sadeq and Q. Al-Tashi, “Hyper-parameter optimization of semi-supervised GANs based-sine cosine algorithm for multimedia datasets,” Computers, Materials & Continua, vol. 73, no. 1, pp. 2169–2186, 2022. [Google Scholar]
39. P. Skryjomski and B. Krawczyk, “Influence of minority class instance types on SMOTE imbalanced data oversampling,” Proceedings of Machine Learning Research, vol. 74, no. April, pp. 7–21, 2017. [Google Scholar]
40. A. Muneer, S. M. Taib, S. M. Fati, A. O. Balogun and I. A. Aziz, “A hybrid deep learning-based unsupervised anomaly detection in high dimensional data,” Computers, Materials & Continua, vol. 70, no. 3, pp. 6073–6088, 2022. [Google Scholar]
41. E. Gel, L. Ntaimo, D. Shier and H. J. Greenberg, “Recent advances in optimization and modeling of contemporary problems.” Catonsville, Maryland, USA, Institute for Operations Research and the Management Sciences (INFORMS2018. [Online]. Available at: https://doi.org/10.1287/educ.2018.0192.contrib [Google Scholar] [CrossRef]
42. A. Aggarwal, M. Mittal and G. Battineni, “Generative adversarial network: An overview of theory and applications,” International Journal of Information Management Data Insights, vol. 1, no. 1, pp. 100004, 2021. [Google Scholar]
43. R. R. Lam and K. E. Willcox, “Lookahead Bayesian optimization with inequality constraints,” in 31st Conf. on Neural Information Processing Systems (NIPS 2017), Long Beach, CA, USA, pp. 1891–1901, 2017. [Google Scholar]
44. Z. Wang, M. Zoghiy, F. Hutterz, D. Matheson and N. De Freitas, “Bayesian optimization in high dimensions via random embeddings,” in IJCAI Int. Joint Conf. on Artificial Intelligence, Beijing, China, pp. 1778–1784, 2013. [Google Scholar]
45. N. Srinivas, A. Krause, S. Kakade and M. Seeger, “Gaussian process optimization in the bandit setting: No regret and experimental design,” in ICML-10-Proc., 27th Int. Conf. on Machine Learning, Madison, WI, USA, pp. 1015–1022, 2010. [Google Scholar]
46. E. -S. M. El-kenawy, A. Ibrahim, N. Bailek, B. Kada, M. Hassan et al., “Sunshine duration measurements and predictions in Saharan Algeria region: An improved ensemble learning approach,” Theoretical and Applied Climatology, vol. 147, no. 3–4, pp. 1015–1031, 2022. [Google Scholar]
47. N. De Freitas, A. J. Smola and M. Zoghi, “Exponential regret bounds for Gaussian process bandits with deterministic observations,” in Proc. of the 29th Int. Conf. on Machine Learning, ICML, Edinburgh, Scotland, pp. 955–962, 2012. [Google Scholar]
48. Z. Wang, B. Shakibi, L. Jin and N. De Freitas, “Bayesian multi-scale optimistic optimization,” Journal of Machine Learning Research, vol. 33, pp. 1005–1014, 2014. [Google Scholar]
49. D. Chicco and G. Jurman, “The advantages of the Matthews correlation coefficient (MCC) over F1 score and accuracy in binary classification evaluation,” BMC Genomics, vol. 21, no. 1, pp. 1–13, 2020. [Google Scholar]
50. A. Ibrahim, S. Mirjalili, M. El-Said, S. Ghoneim, M. Al-Harthi et al., “Wind speed ensemble forecasting based on deep learning using adaptive dynamic optimization algorithm,” IEEE Access, vol. 9, no. 1, pp. 125787–125804, 2021. [Google Scholar]
Cite This Article
 Copyright © 2023 The Author(s). Published by Tech Science Press.
This work is licensed under a Creative Commons Attribution 4.0 International License , which permits unrestricted use, distribution, and reproduction in any medium, provided the original work is properly cited.
 Downloads
 Citation Tools