
 Submit a Paper
 Propose a Special lssue
 Open Access
ARTICLE

A Robust Tuned Random Forest Classifier Using Randomized Grid Search to Predict Coronary Artery Diseases
1 Department of Information Systems, College of Computer and Information Sciences, Jouf University, KSA
2 Department of Information Systems, Faculty of Computers and Information, Mansoura University, Egypt
3 Department of Information Systems and Technology, Faculty of Graduate Studies for Statistical Research, Cairo University, Egypt
* Corresponding Author: A. A. Abd El-Aziz. Email:
Computers, Materials & Continua 2023, 75(2), 4633-4648. https://doi.org/10.32604/cmc.2023.035779
Received 03 September 2022; Accepted 08 December 2022; Issue published 31 March 2023
 View Full Text
 Download PDF
Abstract
Coronary artery disease (CAD) is one of the most authentic cardiovascular afflictions because it is an uncommonly overwhelming heart issue. The breakdown of coronary cardiovascular disease is one of the principal sources of death all over the world. Cardiovascular deterioration is a challenge, especially in youthful and rural countries where there is an absence of human-trained professionals. Since heart diseases happen without apparent signs, high-level detection is desirable. This paper proposed a robust and tuned random forest model using the randomized grid search technique to predict CAD. The proposed framework increases the ability of CAD predictions by tracking down risk pointers and learning the confusing joint efforts between them. Nowadays, the healthcare industry has a lot of data but needs to gain more knowledge. Our proposed framework is used for extracting knowledge from data stores and using that knowledge to help doctors accurately and effectively diagnose heart disease (HD). We evaluated the proposed framework over two public databases, Cleveland and Framingham datasets. The datasets were pre-processed by using a cleaning technique, a normalization technique, and an outlier detection technique. Secondly, the principal component analysis (PCA) algorithm was utilized to lessen the feature dimensionality of the two datasets. Finally, we used a hyperparameter tuning technique, randomized grid search, to tune a random forest (RF) machine learning (ML) model. The randomized grid search selected the best parameters and got the ideal CAD analysis. The proposed framework was evaluated and compared with traditional classifiers. Our proposed framework’s accuracy, sensitivity, precision, specificity, and f1-score were 100%. The evaluation of the proposed framework showed that it is an unrivaled perceptive outcome with tuning as opposed to other ongoing existing frameworks.Keywords
Heart disease due to hypertension, CAD, or stroke is the fundamental reason for death in the USA. In 2019, new statistics from the American heart association (AHA) showed that: 46% of adults in the USA had hypertension. These results are related to the guidelines of hypertension clinical practice in 2017. On average, somebody dies of cardiovascular disease (CVD) every 38 seconds. Based on 2016 data, CVD caused approximately 2,303 deaths daily, and stroke caused 389.4 deaths daily [1].
There are distinct types of heart illness. The widely recognized types are CAD and Heart Failure (HF). HF is the inability of the heart to intake an adequate measure of blood to address the issues of the body. Blockage or narrowing of the coronary arteries is the primary driver of HF. Coronary arteries are conduits responsible for conveying blood to the heart [2,3]. CAD is a typical class of coronary illness and a notable wellspring of cardiovascular failures on the planet [4].
Diverse risk factors that lead to HF and CAD have been accounted for. These risk factors are isolated into two groups. The primary group incorporates the patient’s family ancestry, gender, and age; these risk factors can’t be changed. In any case, the subsequent group includes risk factors identified with the patient’s way of life. Henceforth, these variables can be changed, e.g., elevated cholesterol level, smoking, actual idleness, and hypertension [2]. Subsequently, the risk factors, which are below average, can be eliminated or constrained by changing the way of life and medicine.
CAD analysis requires an exhaustive investigation of various elements, which makes the doctor’s responsibilities extreme. These issues rouse the advancement of non-nosy parts for the recognition of CAD. Moreover, regular CAD finding methodologies zeroed in on assessing a patient's clinical history, assessment of different manifestations by a cardiologist, and actual interrogation reports. In this manner, the ordinary strategies utilized for CAD determination are tedious and may yield mistaken analytic outcomes because of human blunders [5,6]. To avoid these issues, we must build up a computerized learning framework for the proficient and quick conclusion of CAD. Subsequently, a machine learning-based expert framework can decrease the related well-being risk of the clinical test. Simultaneously, it can help with improving the determination cycle.
This paper proposes a robust, tuned random forest model using the randomized grid search algorithm to predict CAD. First, we utilized Cleveland and Framingham datasets, cleaned them, and normalized them. Second, the PCA technique is used to lessen the feature dimensionality of the two datasets. Finally, the randomized grid search selects the best parameters for the trained random forest classifier to get the ideal CAD analysis. The main contributions of this paper are
• For CAD prediction, a novel, robust tuned random forest model using the randomized grid search algorithm is proposed to predict coronary heart diseases.
• We utilized Cleveland and Framingham datasets, and we applied data mining techniques to clean and normalize Cleveland and Framingham datasets.
• PCA feature selection algorithm is executed to eliminate irrelevant and duplicate features and to enhance the framework performance.
• A random forest ML classifier is trained.
• The randomized grid search selects the best parameters for the trained random forest classifier. In contrast to other recent systems, the proposed classifier has a higher accuracy of 100% in CAD prediction.
The remainder of this paper is formulated as follows. Section 2 presents a literature review of CAD diagnostic systems. Section 3 displays the methodology of the proposed framework, the pre-processing of the two datasets, and the training of ten classifiers. The experimental results of the proposed framework are shown in Section 4. Finally, the conclusion of our proposed framework is provided in Section 5.
To predict hospital mortality in spontaneous coronary artery dissection (SCAD) patients, the authors in [7] used data from electronic health records (EHR) and a deep neural network. They applied several ML and deep learning (DL) models to the patient data that they extracted from the EHR of an extensive urban health system.
The authors in [8] used deep learning to predict heart disease better. They developed an enhanced stacked sparse autoencoder network (SSAE). To fine-tune the stacked sparse autoencoder’s parameters, they proposed a particle swarm optimization (PSO)-based method.
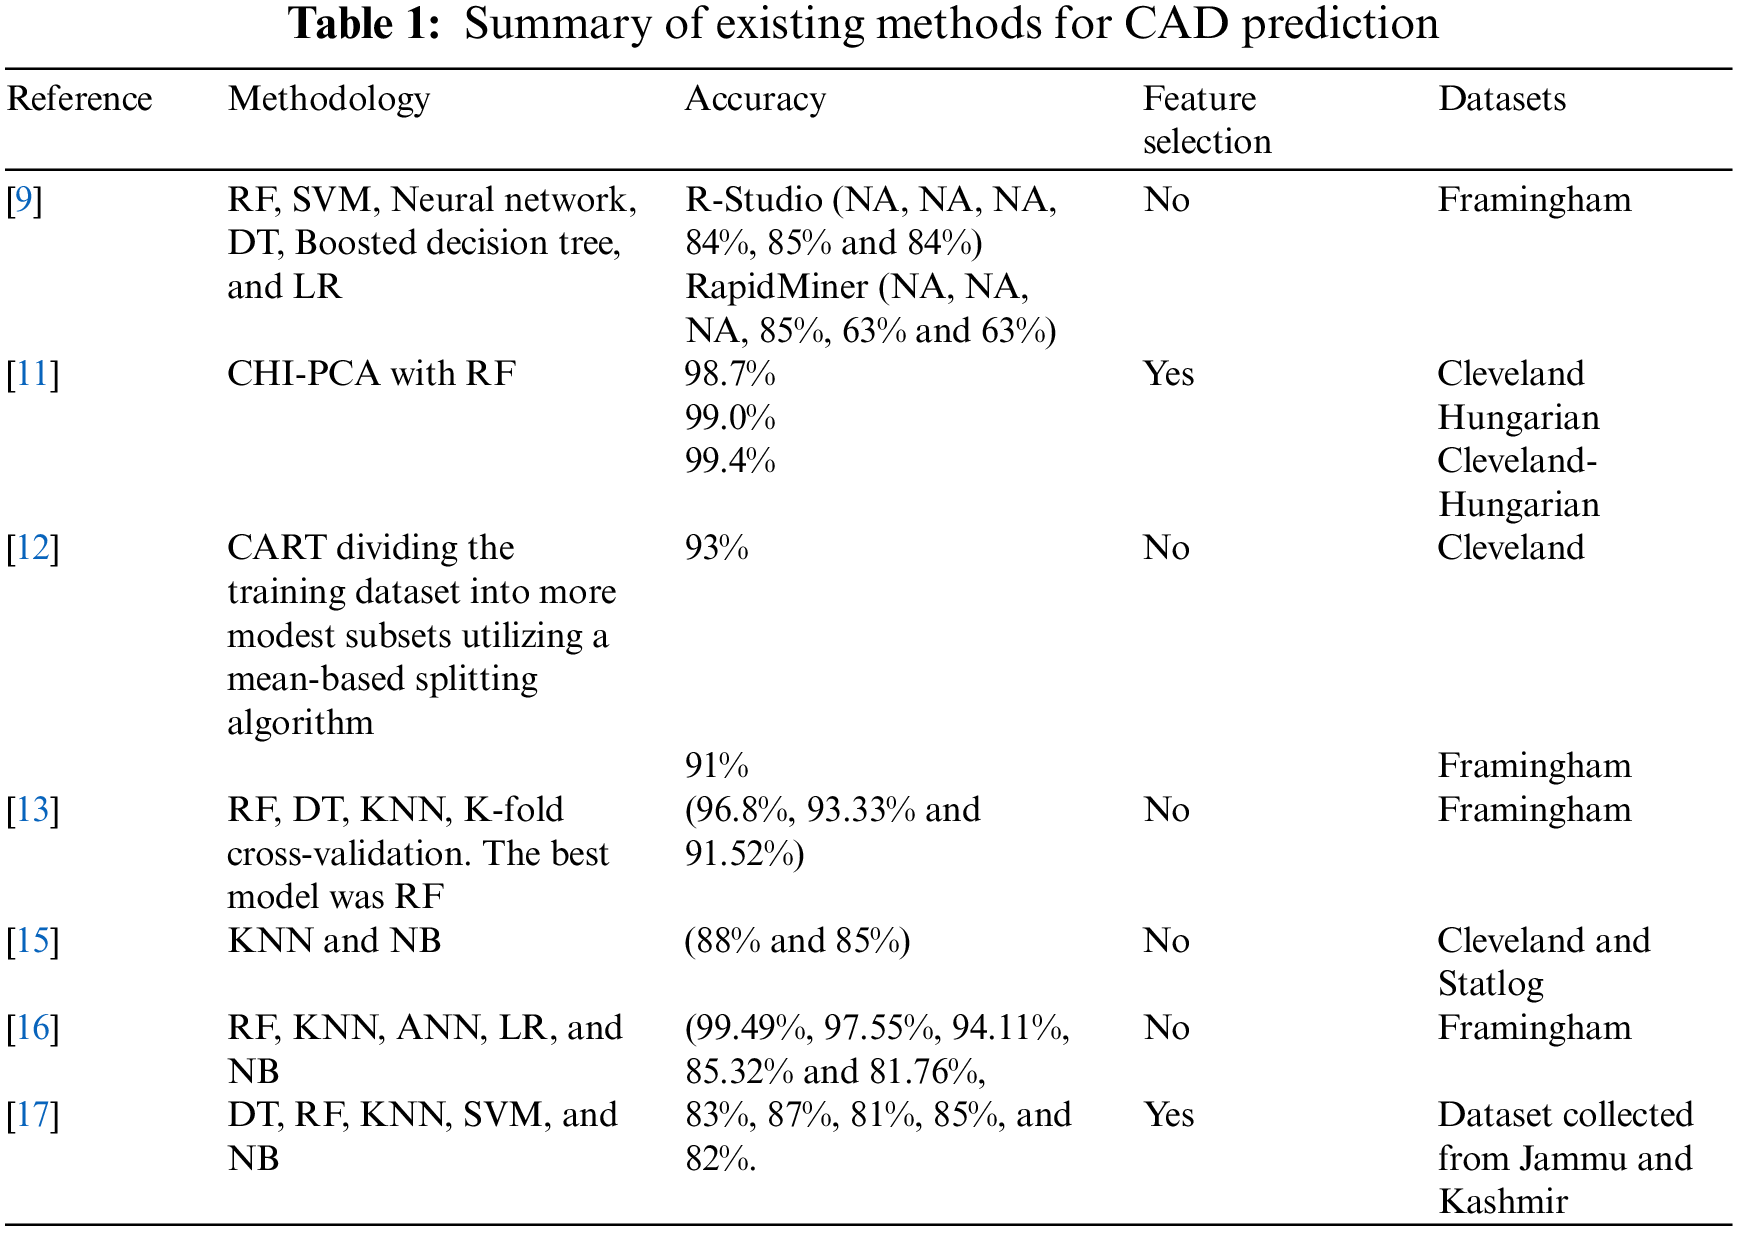
The authors in [9] looked at the utility of a few supervised machine learning algorithms (decision tree (DT), boosted decision tree, RF, support vector machine (SVM), neural network (NN), and logistic regression (LR)). They used them for anticipating clinical functions regarding their internal legitimacy and accuracy. Three data models were expounded, and a relative methodological investigation between the diverse ML techniques was done. The authors presumed that ML techniques could strengthen customary regression strategies’ symptomatic and prognostic limits. Contrasts between the appropriateness of those calculations and the outcomes acquired were a component of the product stages utilized in the information examination. The authors in [10] inspected robotized CAD classification utilizing deep learning techniques and introduced various approaches to classify and anticipate the CAD.
The authors in [11] proposed the utilization of a chi-square (CHI) with PCA-head part investigation to enhance the expectation of ML techniques. The objective of the model was to anticipate whether a patient has an HD or not. The authors applied feature dimensionality decrease strategies to enhance the crude results. For the seventy-four attributes given, they chose three gatherings of attributes and accomplished the high execution. It was discovered that among the models, the proposed model with RF had the most excellent performance, where the accuracy for Cleveland dataset was 98.7%, for the Hungarian dataset was 99.0% and for the Cleveland-Hungarian dataset was 99.4%.
An improved ML technique was proposed in [12] for the expectation of HD risk. The procedure included arbitrarily dividing the dataset into more modest subsets utilizing a mean-based splitting algorithm. The different allotments were then demonstrated using the classification and regression tree (CART). A homogeneous group was made from the distinctive CART models utilizing the accuracy of the aging model ensemble, which was an alteration of the weighted aging classifier ensemble (WAE). The methodology guarantees ideal execution is accomplished. The accuracy of using Framingham and Cleveland datasets was 91% and 93%, separately, which outflanked other ML techniques.
Reference [13] predicted the risk of CAD utilizing ML techniques, such as RF, DT, and K-nearest neighbors (KNN). Additionally, a near report among them based on forecast accuracy was performed. Likewise, k-fold Cross Validation was utilized to create irregularity in the dataset. These techniques were tested over a dataset named Framingham heart study. It has 4240 rows. The accuracy of DT, RF, and KNN was 92.7%, 96.8%, and 92.89% individually. Consequently, by applying the pre-processing steps, the RF classifier gave better exact outcomes than other ML techniques.
Reference [14] proposed and built up a half-and-half particle swarm optimization-based extraordinary learning machine (PSO-ELM) to determine CAD utilizing the freely accessible Z-Alizadeh sani dataset. A feature selection method, specifically Fisher, was utilized to discover more discriminative feature subsets. The proposed approach accomplished the highest accuracy by utilizing just the 10-highest level of features selected by the Fisher technique.
Reference [15] Using data extraction methods, KNN and Naïve Bayes (NB) by the orange device to anticipate heart illness. The authors utilized the Cleveland heart disease and stat log heart datasets from the UCI heart disease dataset. They inferred that the highest accuracy was KNN which gave 88% accuracy, while the NB classifier gave 85%.
Reference [16] Compared techniques of LR, Artificial Neural Network (ANN), KNN, NB, and RF classification, looking for better execution in heart illness analysis. The dataset Framingham comprises 23138 cases and sixteen attributes. RF gave a precise value contrasted with different techniques; the minimal one was LR.
Reference [17] proposed a novel method for using parameters to predict cardiovascular disease in India. The authors used Python-based machine learning techniques for this study: RF, DT, NB, KNN, and SVM. RF was the best method with hyperparameter tuning with 87.72% accuracy, while NB was better without parameter tuning with 82.63% accuracy. Table 1. Presents a summary of the state-of-art in this area.
From the previous review of the current studies conducted recently, we can conclude that no study achieved 100% accuracy. However, with the Cleveland dataset, our proposed framework achieved 100% accuracy, precision, sensitivity, specificity, and f1-score.
3.1 Principal Component Analysis
Principal Component Analysis (PCA) is a dimensionality-reduction technique that is extensively used to lessen the feature dimensionality of massive datasets by changing an enormous set of features into a more modest one that contains most of the data in the vast dataset. Decreasing the number of features of a massive dataset typically comes to the detriment of precision. However, the stunt in dimensionality reduces to exchange a little exactness for effortlessness. Since more modest datasets are simpler to investigate and imagine, examining data is a lot more straightforward and quicker for AI calculations without superfluous attributes to process. To summarize, the possibility of PCA is direct - diminish the number of attributes of large datasets while protecting as much information as possible.
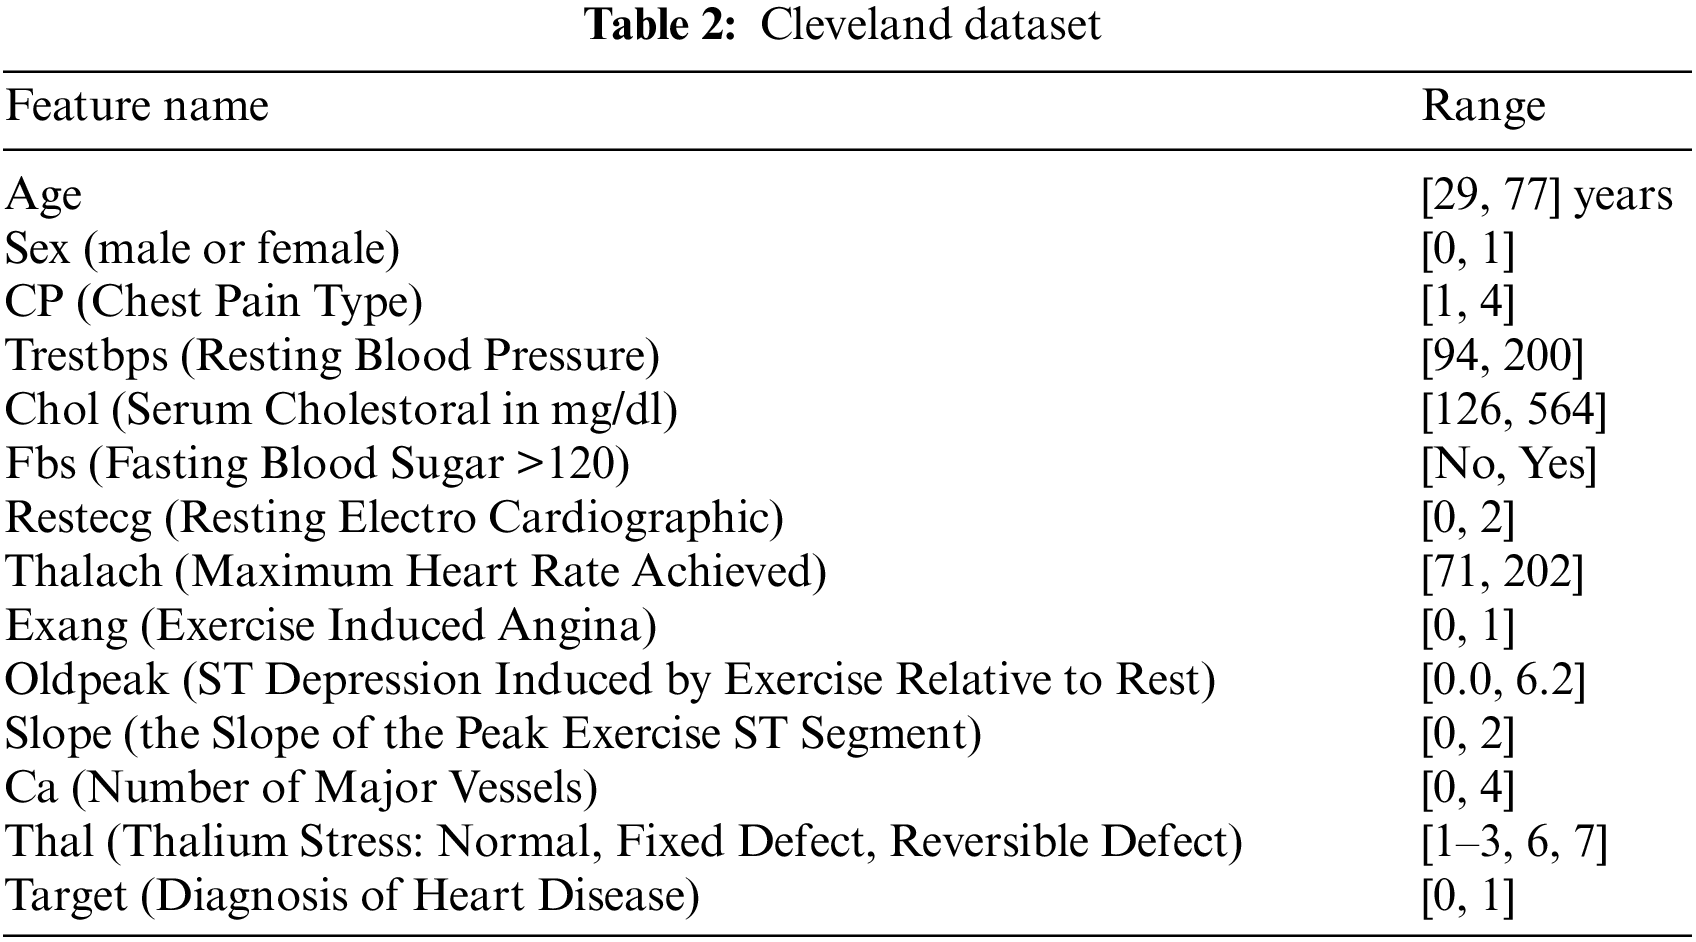
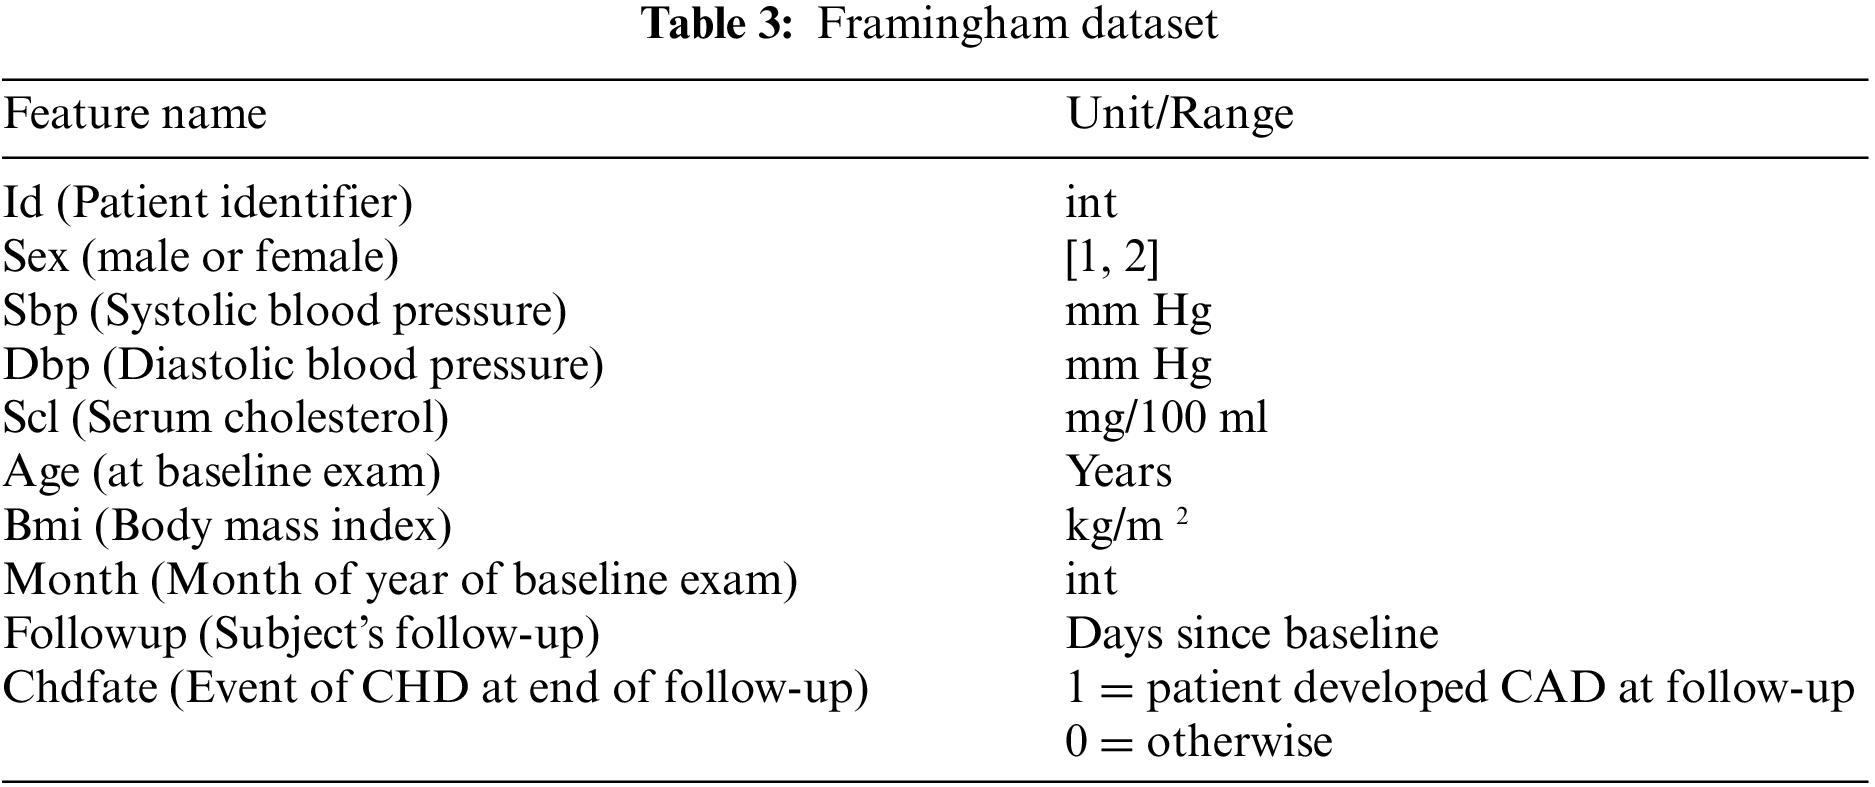
The proposed framework considers Cleveland and Framingham datasets for CAD prediction. Tables 2 and 3 display the attributes of Cleveland and Framingham datasets, and they include 2981 and 4700 records of patients, respectively.
The correlation among features could influence the execution of the ML model. Pearson’s Correlation Coefficient (PCC) could be used to estimate the connection among attributes. PCC differs from −1 to +1, with a negative value and a positive value showing an exceptionally negative and positive relationship among the features, respectively, and a value near zero demonstrating a low relationship among them. The heatmap correlation between attributes for the dataset is shown in Fig. 1:
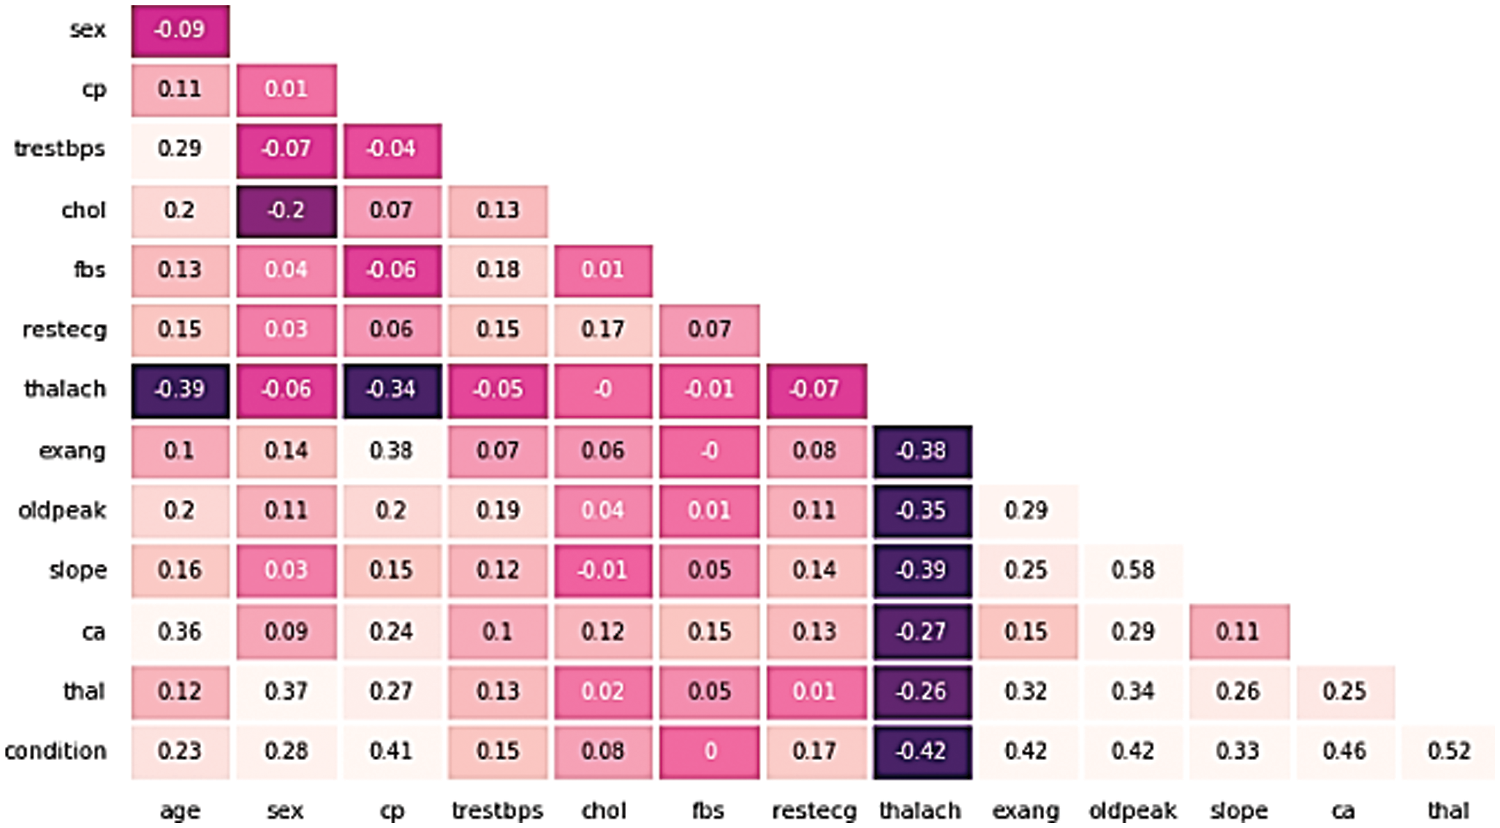
Figure 1: The heatmap correlation between attributes for the cleveland dataset
Fig. 1 depicts the relationship of the Cleveland UCI dataset features to the target and association of each unique with the other. As it is noticed from the figure; only one feature is negatively associated to the target variable; thalach (−0.42), while the most highly correlated features with the target are (thal, ca, oldpeak, exang, cp) and were among the higher positively correlated features with correlation values (0.52, 0.46, 0.42, 0.41), respectively.
4.2 Framework Architecture and Model Training
This research objective is to extend the capability of CAD expectations by discovering danger indicators and learning the confounding joint efforts between them. Moreover, we hope to understand all the significant highlights and conditions that cause the CAD similarly to consider the precision of a tuned random forest classifier using the randomized grid search method in CAD desire.
In the following subsections, the architecture of the proposed framework is described. The proposed framework is depicted in Fig. 2. The first step was data pre-processing. Data mining techniques were applied to the two datasets to clean, normalize and detect outliers. The second step split the dataset into a training dataset with 70% and a test dataset with 30%. In the third step, the PCA was executed on the two datasets to select the valuable features. In the fourth step, the randomized grid search algorithm selected the best parameters for the trained random forest classifier. In the fifth step, we utilized the two datasets for training a random forest classifier. The proposed framework was implemented by the algorithm depicted in Fig. 3.
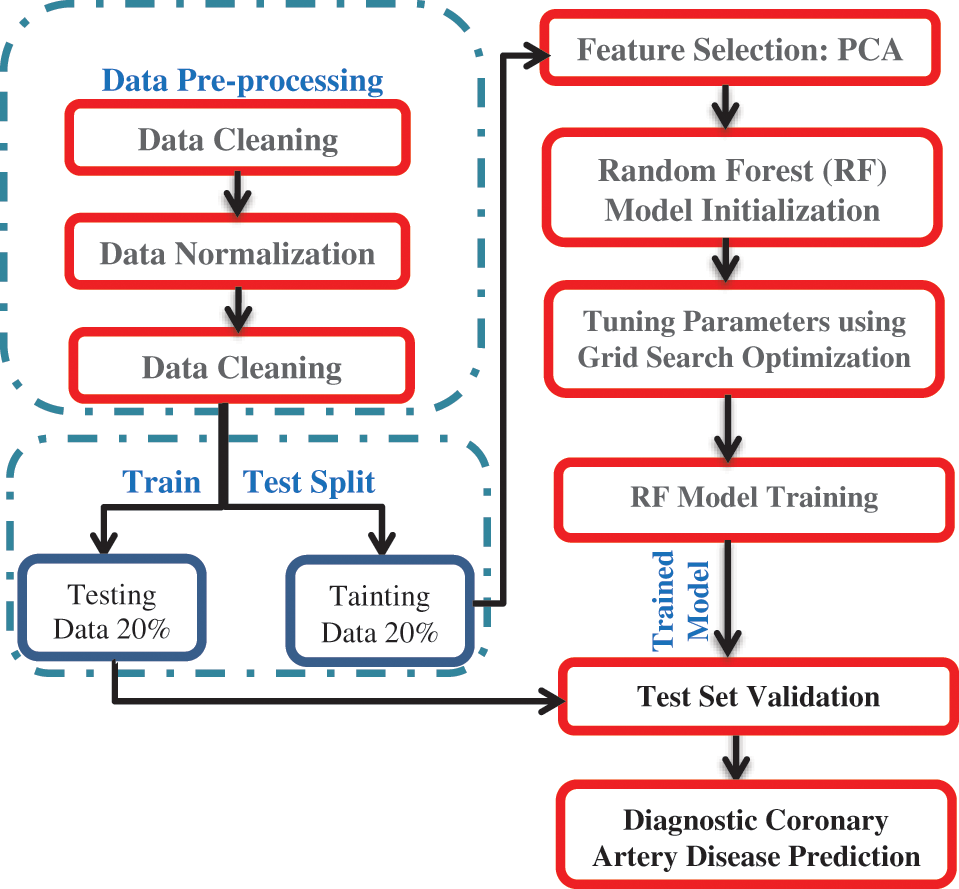
Figure 2: The architecture of the proposed framework
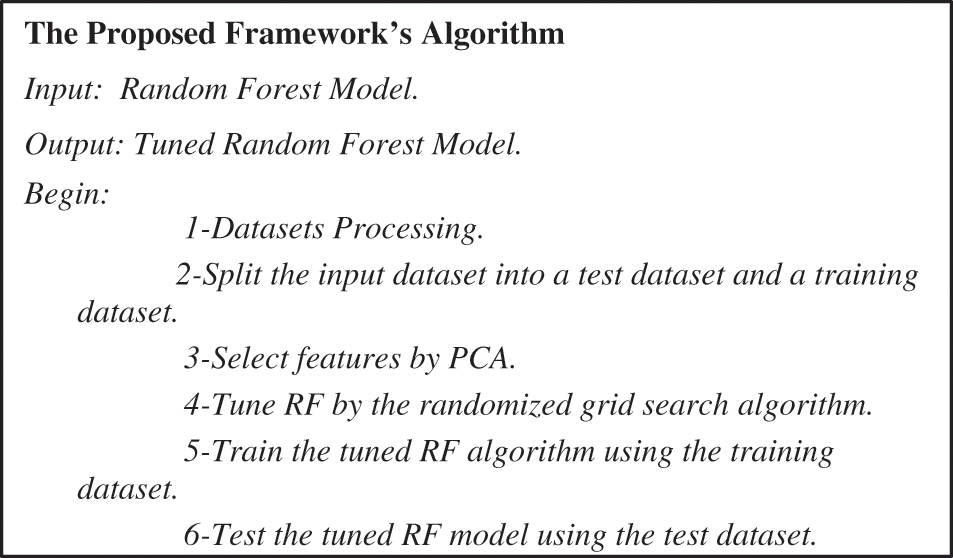
Figure 3: The proposed framework’s algorithm
Data cleaning, normalization, and outlier detection are performed in the data pre-processing step as critical steps. It is essential before applying ML algorithms because the real-world data may need to be more reliable, consistent, noisy, and complete. Hence, data mining techniques are applied to the real-world heart disease dataset to derive meaningful data and to represent the data effectively to extract the trends and the relationship of attributes in the dataset.
Data quality plays an essential role, and it is the most carefully depicted thing. In the proposed framework, data cleaning is performed to improve the quality of Cleveland and Framingham datasets. Data cleaning by eliminating irrelevant and redundant attributes will make the two datasets more precise. Moreover, the features with Null (NaN) values are removed from the two datasets to make them more valuable because NaN values decrease the productivity of the prediction algorithm.
Cleveland and Framingham datasets have several features, including various numerical values. These feature values impact the prediction process. Hence, the min-max normalization technique, a data mining technique, is utilized to normalize the single dataset between 0 and 1. It ensures that the feature values do not have any ambiguity after the normalization process and simplifies the computation process while applying the prediction algorithm of CAD. The min-max normalization method is defined in Eq. 1 [18]:
Outliers are values that represent abnormal distances from comprehensive data. Outliers mean is a fluctuation in measurement or errors in the experimental results. In other words, an outlier indicates an observation that veers from complete data. These deviations may be due to noise. Hence data mining algorithms should be careful whether the variations are actual or are due to noise. The detection of truly unusual behavior in each dataset is called outlier analysis. Outlier detection is an essential part of data pre-processing that should be implemented to ensure the quality of a dataset [18].
4.2.2 Feature Selection Using PCA
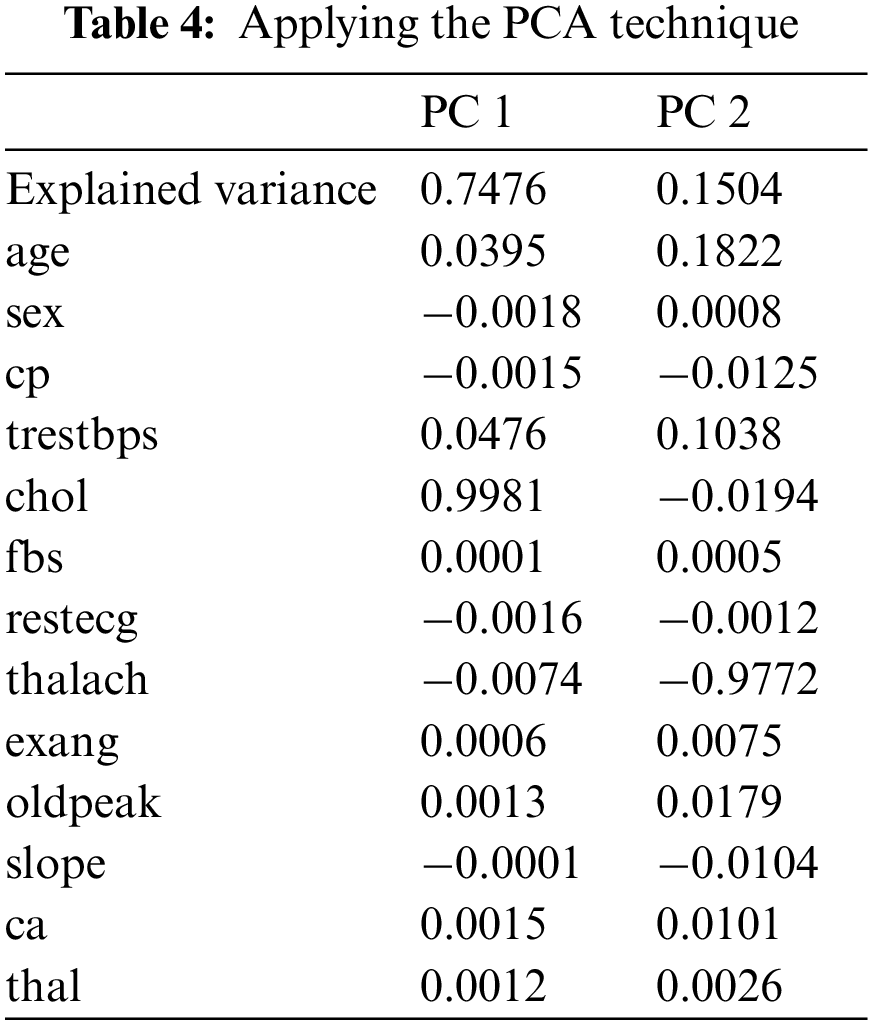
PCA is used to decompose a multivariate dataset in a set of successive orthogonal components that explain a maximum amount of variance. There are fourteen attributes in the UCI dataset, and the target attribute is one of the attributes in the dataset. In the practical experiments, we have turned thirteen attributes into two attributes, PC1 and PC2, using the help of PCA. PC1 is the linear combination of the original features that can explain the maximum variance, and PC2 is the orthogonal vector to PC1 that describes the following best amount of variance.
As shown in Fig. 4 and Table 4, PC1 is substantial and positive for chol, while being marginally positive for sex and cp, indicating that individuals who score well in this component will have an extraordinarily minor impact on heart disease. Still, people with higher chol have a higher risk of heart disease. However, PC2 is highly negative for thalach, cp and slope, indicating that individuals scoring high in this component have a minimal risk of heart disease. Age and trestbps are both moderately positive.
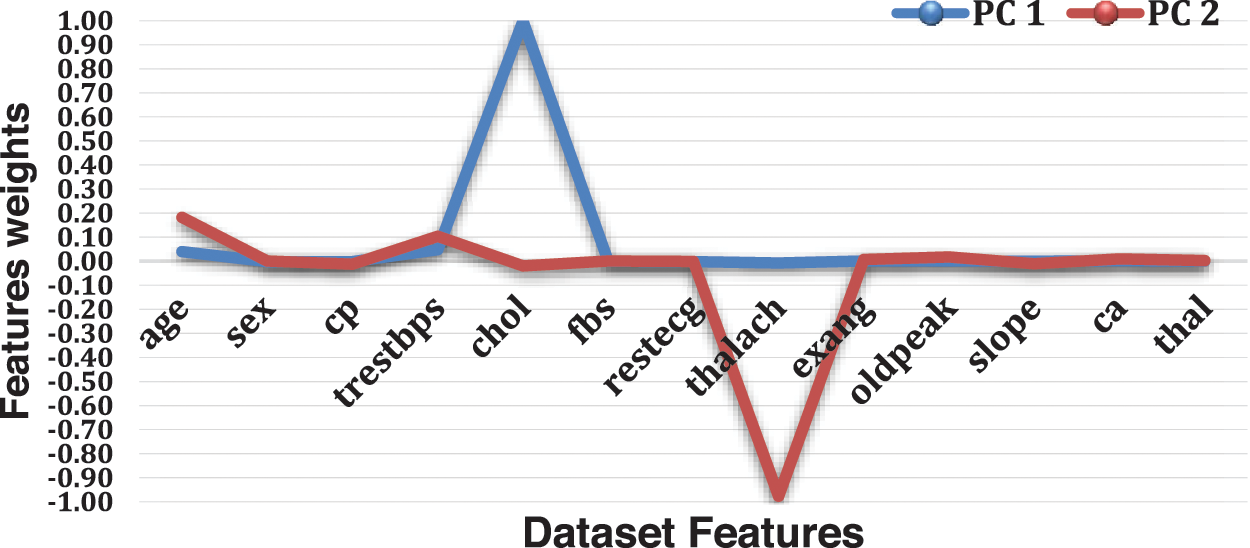
Figure 4: Features weights
4.2.3 Tuning Parameter Using Grid Search Optimization
In this step, we made hyperparameter tunning by the algorithm shown in Fig. 5. The cycle of determining the correct combination of hyperparameters is called hyperparameter tuning. It allows the model to maximize its execution. Using the right combination of hyperparameters is the only strategy to get the best performance out of models. In the random search technique, a grid of hyperparameter values is created. Every loop endeavors a random combination from this grid keeps the execution and, in conclusion, gets a variety of hyperparameters, which gives high performance. We used the randomized grid search algorithm to select the best parameters for the ten models.
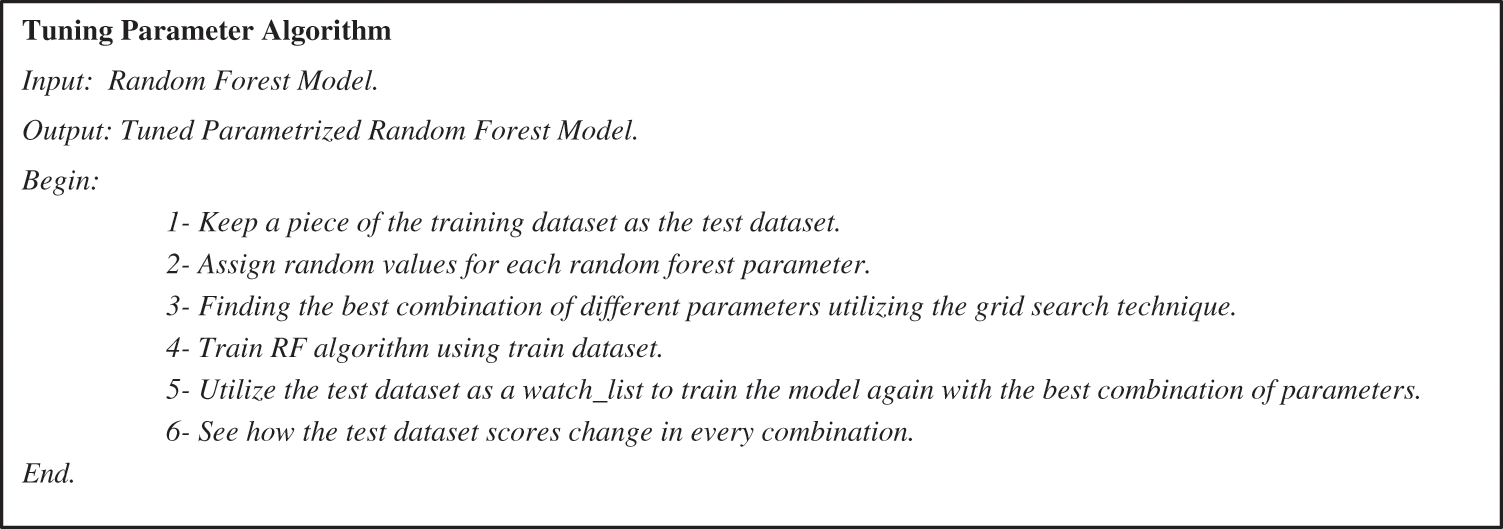
Figure 5: Tuning parameter algorithm
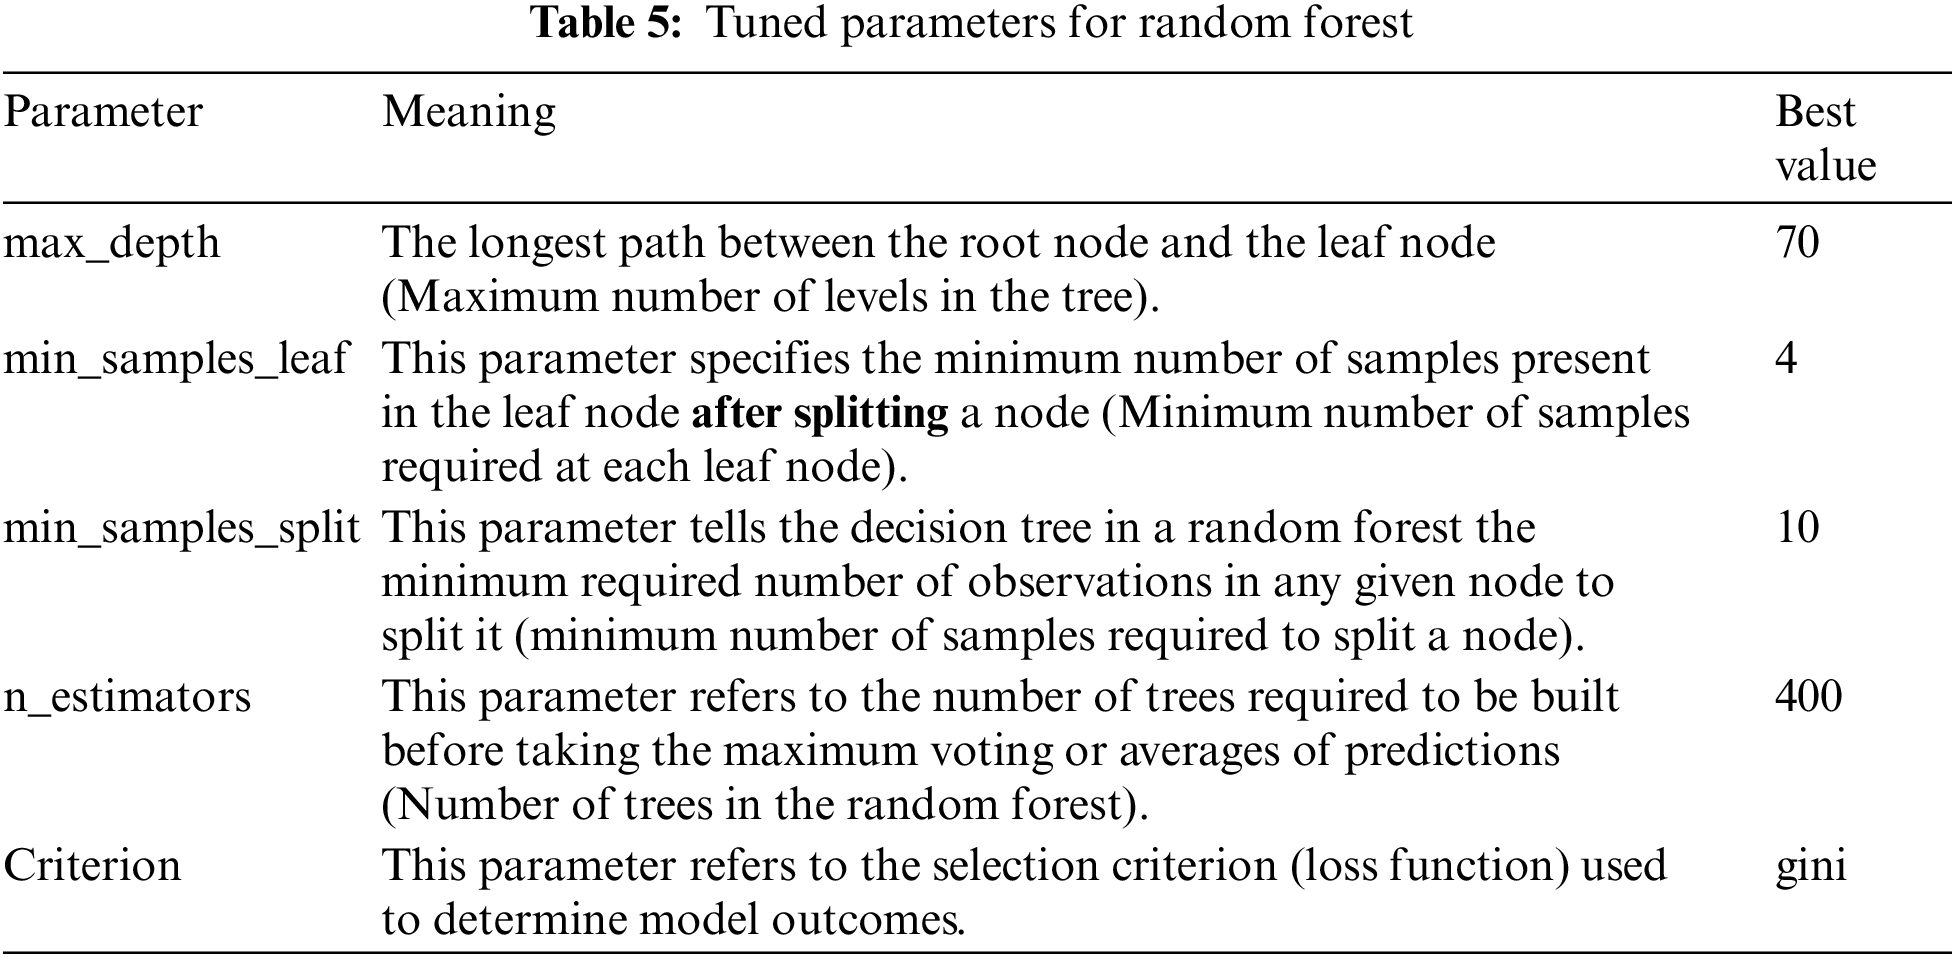
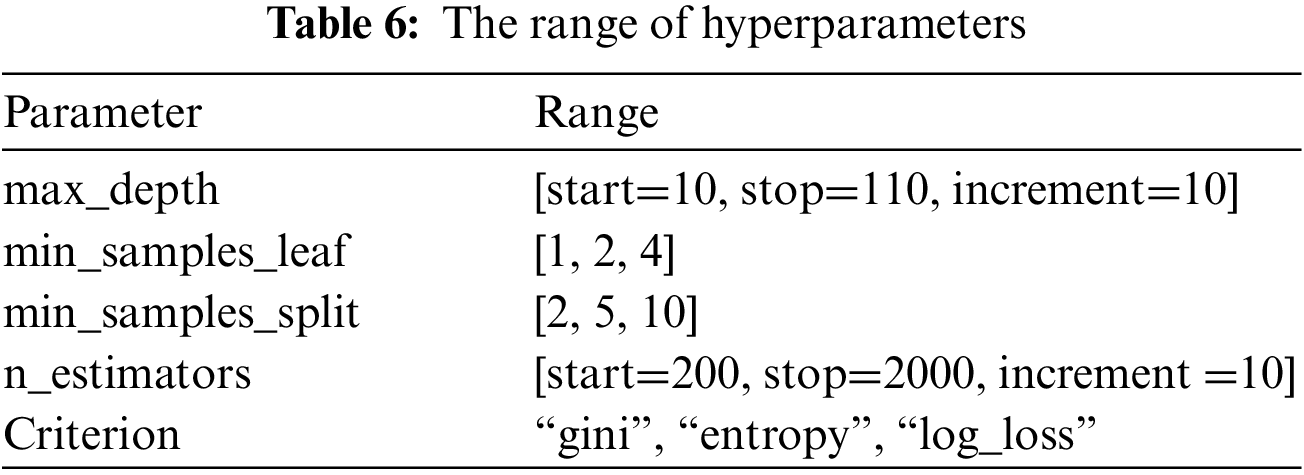
The best parameters for the random forest model are max_depth, min_samples_leaf, min_samples_split, n_estimators, and Criterion. Table 5 shows the meaning and best value for each parameter, and Table 6 shows the different ranges of the parameters.
The ML models were implemented and evaluated using the Kaggle environment. Kaggle allows data scientists and developers to host datasets, write and share code, and participate in machine learning competitions. The PC used for the experiments possesses the following characteristics: Intel(R) Core (TM) i7-10510U CPU @ 1.80 GHz 2.30 GHz, 16 GB Memory, 64-bit Operating System (Windows), x64-based processor.
In this paper, ten machine learning models were tested by evaluating the confusion matrix elements, which are the True Positives (TP), the True Negatives (TN), the False Positives (FP), and the False Negatives (FN). Furthermore, we used the f1- score, receiver operating characteristic curve, Logarithmic loss, and Mathew correlation coefficient. TP and TN are correctly classified as CAD and non-CAD, respectively; FN is CAD that is misclassified as non-CAD; non-CAD is incorrectly classified as CAD is defined as FP. Moreover, several standard performance metrics are applied to evaluate the prediction performance of the ten machine learning models, such as accuracy, precision rate, specificity, and sensitivity, which are defined in Eqs. (2)–(5) [19,20].
TP, FP, TN, and FN denote true positive, false positive, true negative, and false negative, respectively. The f1 score is the weighted average of Recall (Sensitivity) and Precision. It considers both FP and FN. The f1 score is typically more valuable than accuracy, assuming you have an uneven class distribution. Accuracy works well if FP and FN have comparable expenses. If the expenses of FP and FN are different, it's smarter to check out both Precision and Recall. f1- score is defined in Eq. (6) [18,19].
The receiver Operating Characteristic (ROC) curve is the general visualization method that presents the implementation of a binary model. ROC curve is a graphical plot that presents the ability of a binary model as its threshold is changed. The ROC curve on the X-axis shows a model’s FP measure from 0 to 1.0, and on the Y-axis, it shows a model’s TP measure from 0 to 1.0. In the Roc curve, the ideal point is one where the model accomplishes zero, an FP measure of zero, and a TP measure of one. It will be in the upper left corner. Therefore, in the ROC space, curves show various tradeoffs as the decision threshold is changed for the model. Due to the variation of the decision threshold, we'll have various values of TPs and FPs, which we could plot on a chart. The ROC curve is a tool for choosing the ideal model [18,19].
Logarithmic Loss (Log Loss) rates the execution of a prediction machine learning technique. The result of log loss is a likelihood value between 0 and 1. The log loss of a perfect model would be the value 0. When the prediction label differs from the actual label, the value of log loss increases. It is calculated in Eq. (7) [18].
where log is the natural logarithm, y is a binary indicator (0 or 1), and p is the model’s predicted probability.
The Mathew correlation coefficient (MCC) is a solid statistical measure. It gets a high score provided that the prediction got great outcomes in all four confusion matrix categories (TP, FN, TN, and FP), relative to the size of the dataset's positive and negative rows. MCC varies from −1 to +1. MCC is calculated as in Eq. (8) [18].
Table 7 shows the mentioned metrics for the ten machine learning models (Random Forest (RF), Multi-Layer Perceptron (MLP), K-Nearest Neighbors (KNN), Extra Tree, XGBoost, Support Vector Machine (SVM), Stochastic Gradient Descent (SGD), Ada Boost, Decision Tree (DT) and Gradient boosting (GB)) individually before the feature selection process. From Table 7, we found that using Cleveland UCI, SVM accuracy is the highest. SGD precision is the highest. Extra Tree and XGB are the highest in sensitivity, specificity, f1-score, and ROC, respectively. SGD Log_Loss is the lowest. SVM MCC is the highest. Moreover, using Framingham, we found that RF accuracy and precision are the highest. SGD sensitivity and specificity are the highest. RF, MPL, and SVM f1- scores are the highest. SGD ROC is the highest. RF Log_Loss is the lowest. SGD MCC is the highest.
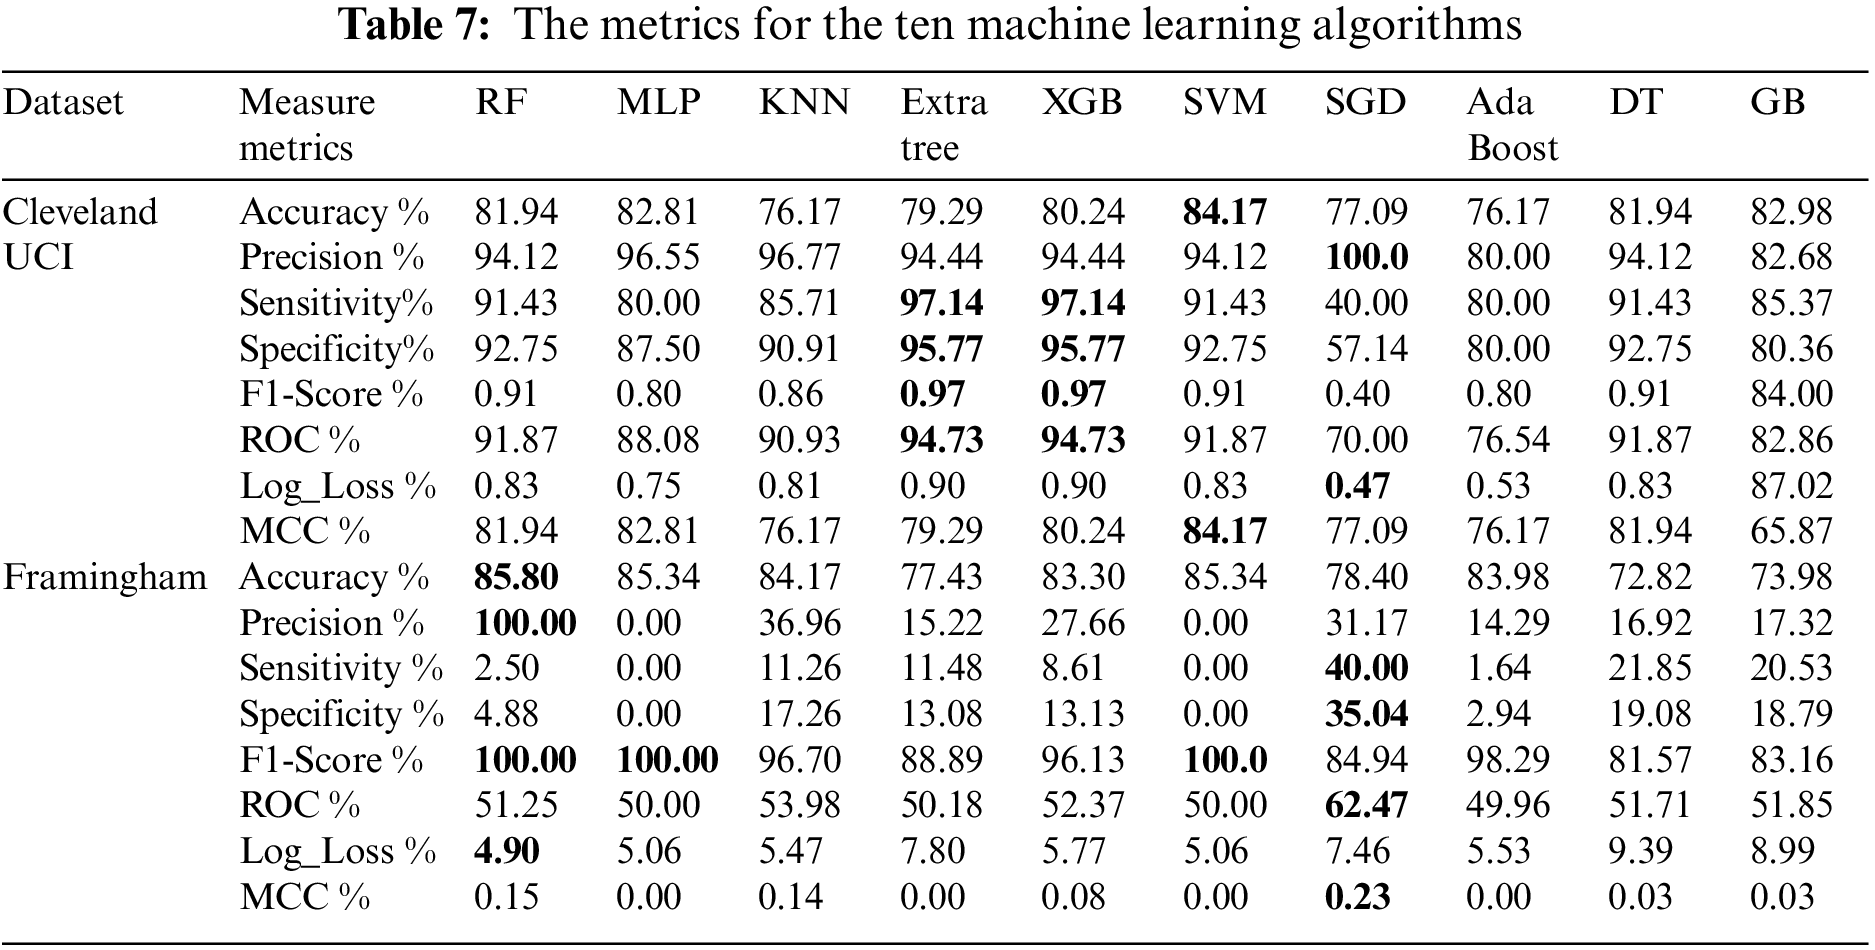
Table 8 shows the metrics for the ten machine learning algorithms after applying the PCA technique. From Table 8, we found that using Cleveland UCI, RF accuracy, sensitivity, f1-score, ROC, and MCC are the highest, DT precision is the highest, XGB specificity is the highest, and DT Log_Loss is the lowest. Moreover, using Framingham, we found that XGB accuracy is the highest. RF precision is the highest. DT sensitivity is the highest. XGB specificity is the highest. SVM f1-score is the highest. KNN ROC is the highest. XGB Log_Loss is the lowest. RF and XGB MCC are the highest.
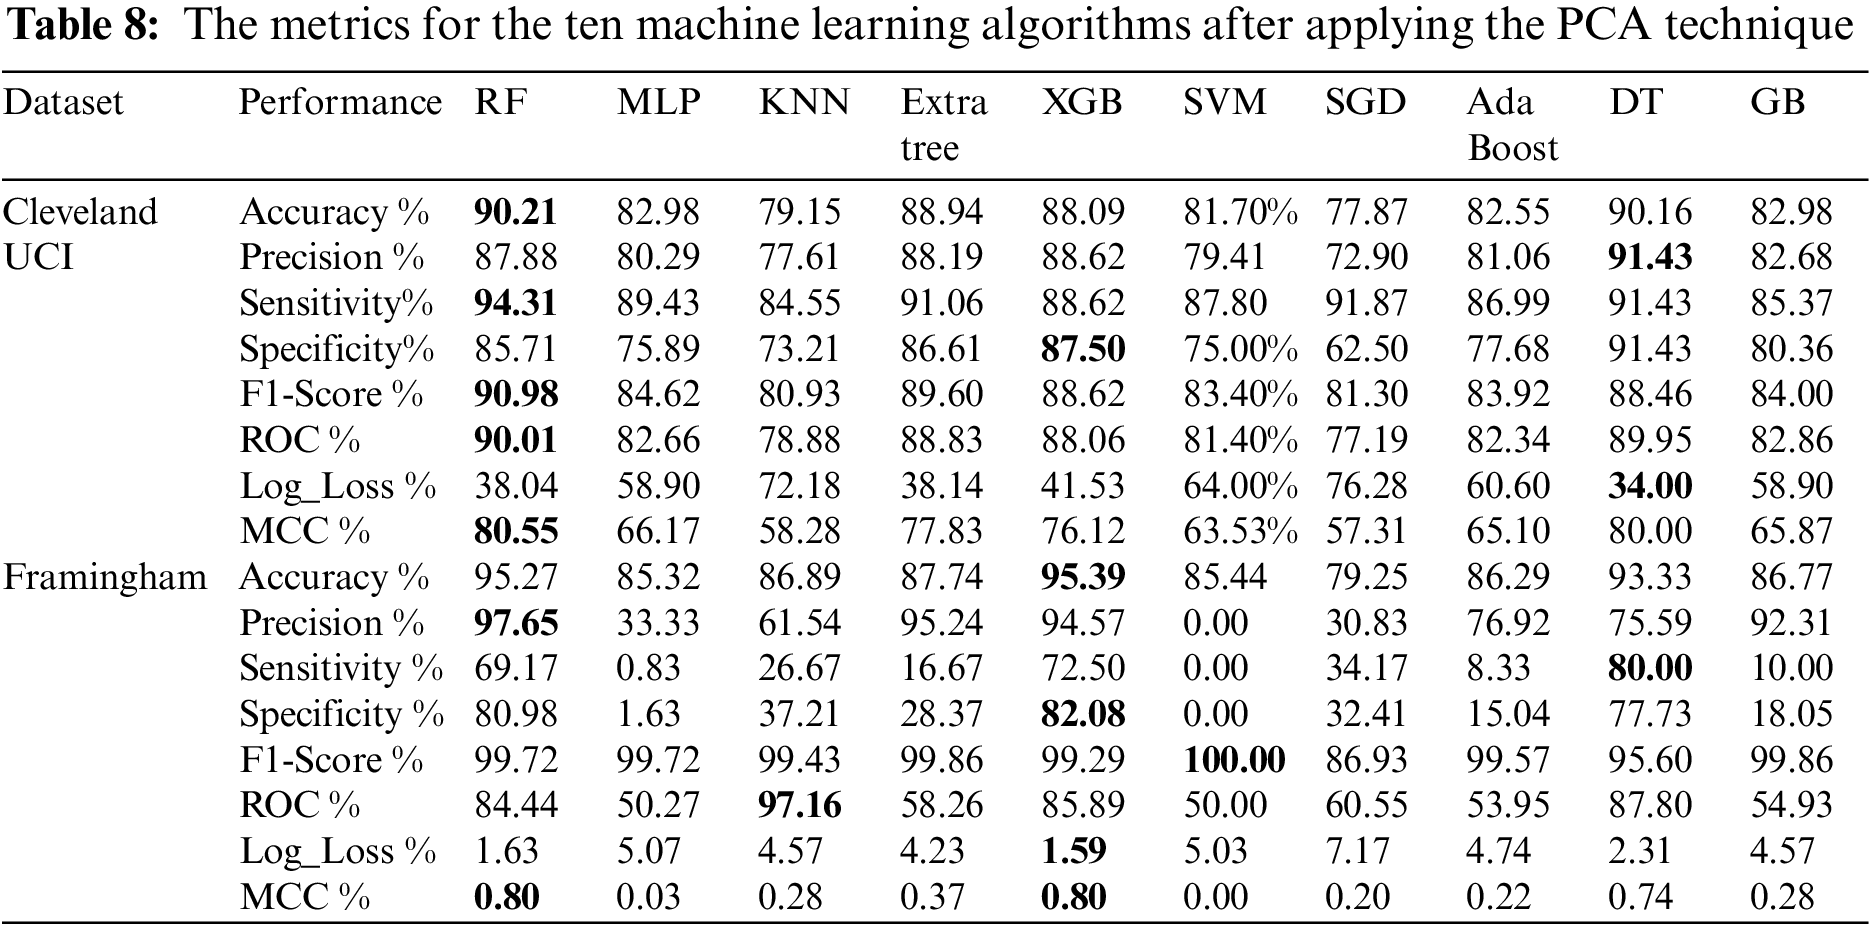
Table 9 shows the metrics for the ten machine learning algorithms after applying PCA and hyper-tuning parameterization. From Table 9, we found that using Cleveland UCI, RF achieves the highest accuracy, precision, sensitivity, specificity, f1-score, ROC, and MCC. In addition, RF Log_Loss is the lowest. Moreover, using Framingham, we found that RF and Extra Tree accuracies are the highest. RF and MLP precisions are the highest. DT sensitivity is the highest. RF specificity is the highest. RF, MLP, and SVM f1-scores are the highest. Extra Tree ROC is the highest. Log_Loss of RF and Log_Loss of Extra Tree are the lowest. RF MCC and MLP MCC are the highest.
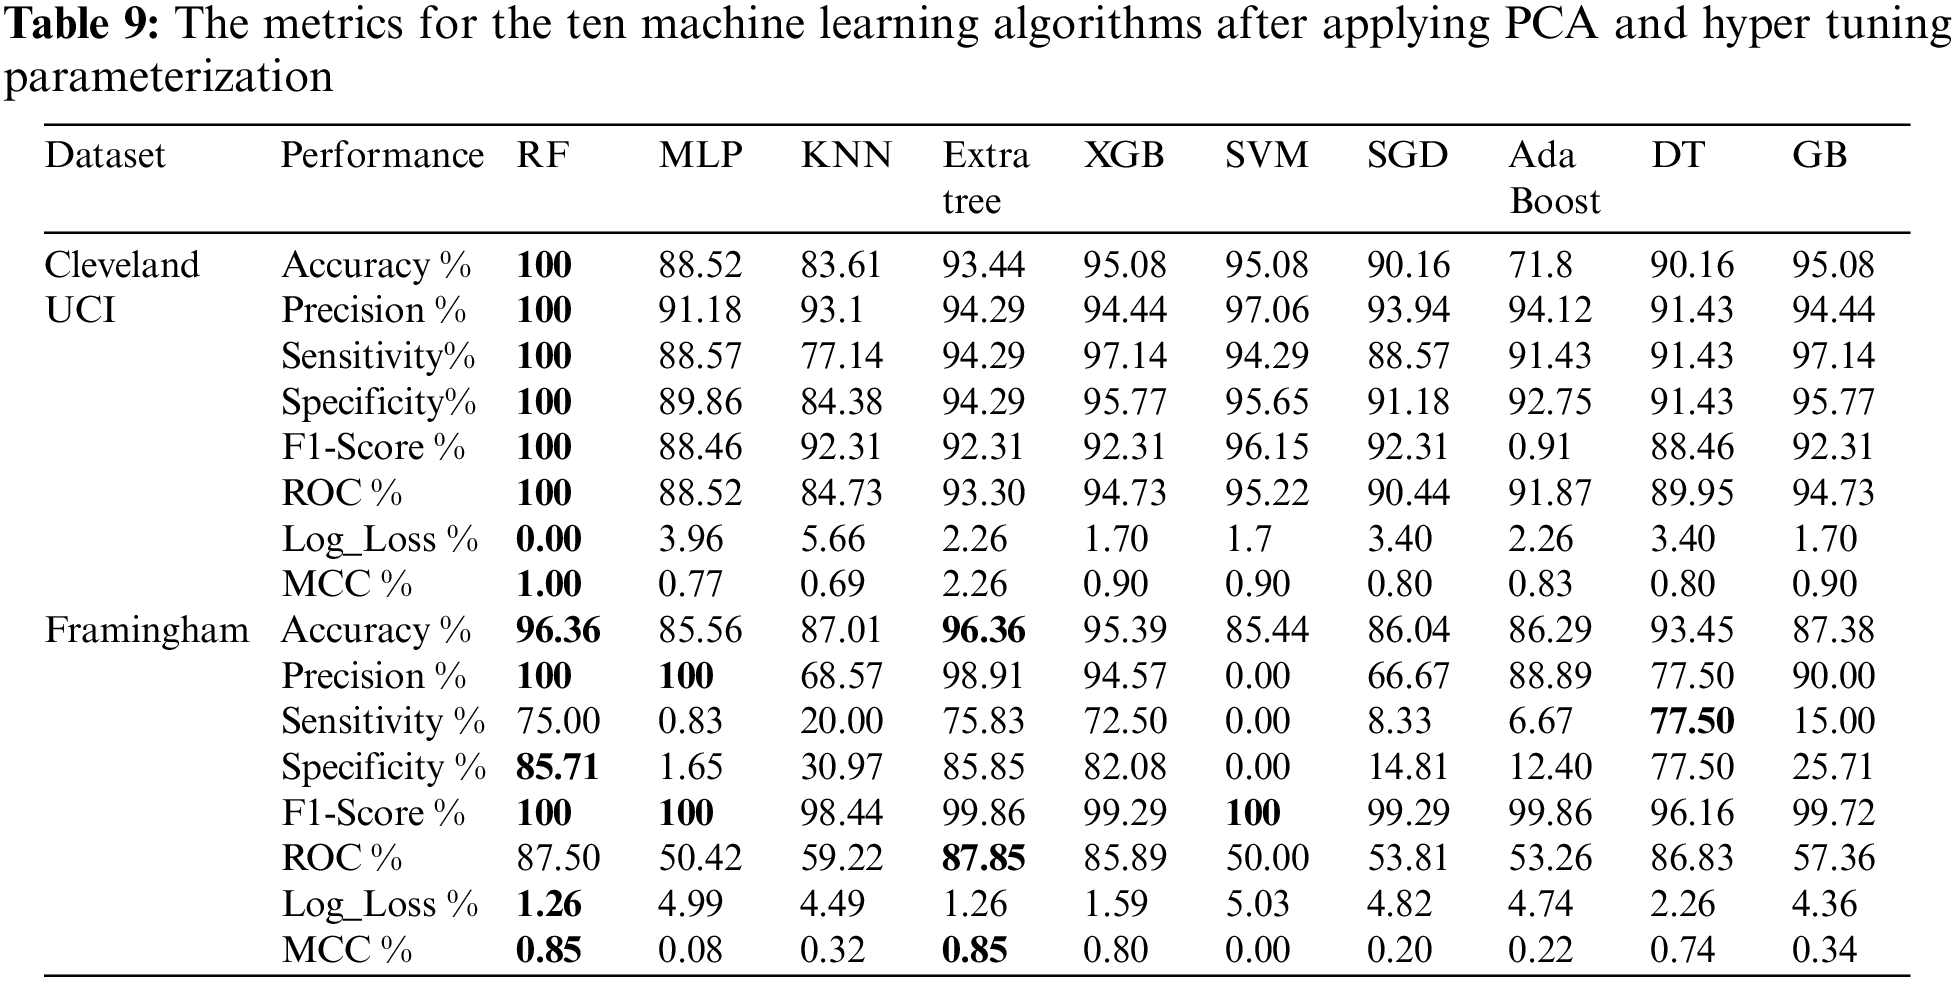
The experimental results showed that the tuned random forest model performed best with Cleveland and Framingham datasets after applying PCA. Using the Cleveland dataset, the tuned random forest model had an accuracy of 100%, a precision of 100%, a specificity of 100%, a sensitivity of 100%, a ROC value of 100%, a log loss of 0, f1-score of 100% and MCC of 1. Using the Framingham dataset, the tuned random forest model had an accuracy of 96.36%, a precision of 100%, a specificity of 85.71%, a sensitivity of 75%, a ROC value of 87.50 %, a log loss of 1.26, f1-score of 100% and MCC of 0.85.
5.5 Discussion of the Results with the Literature
In Table 10, we present a detailed comparison of existing state-of-art methods using Cleveland and Framingham heart disease datasets.
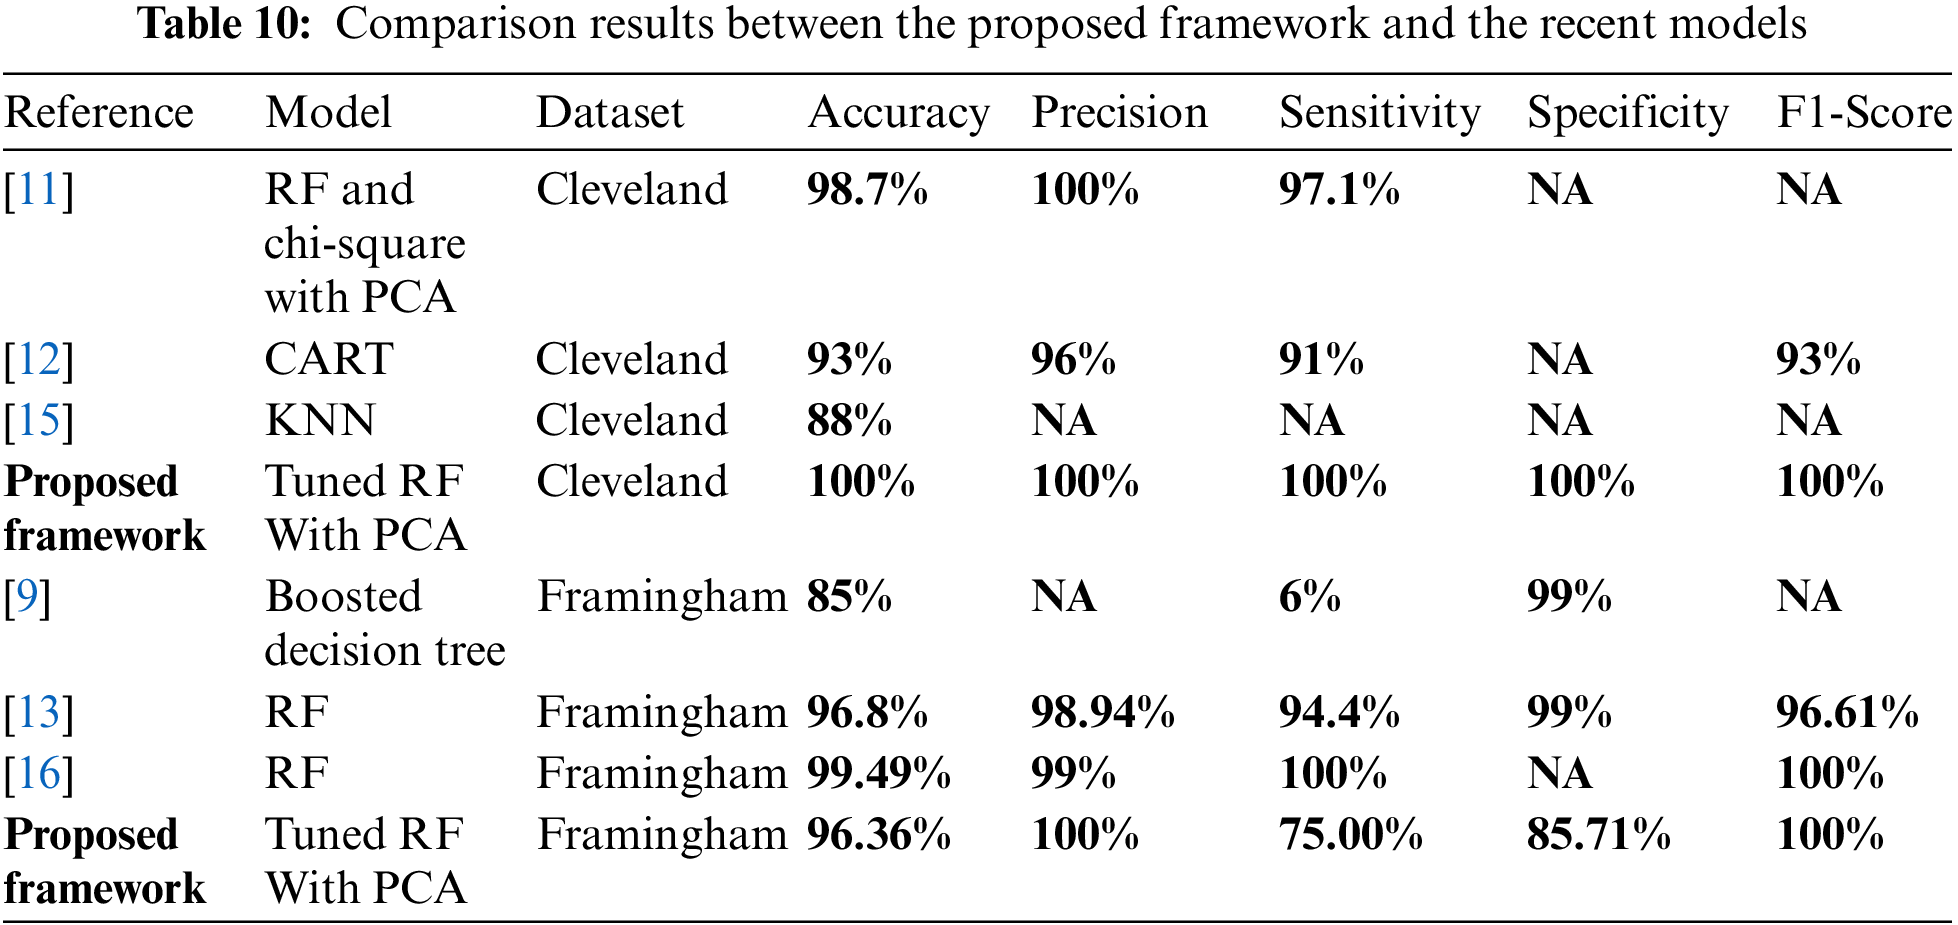
Table 10 shows that [11,12,15] and the proposed framework used the Cleveland dataset. In [11], the random forest technique had the best performance. It achieved 99.4% accuracy, 100% precision, 98.6% sensitivity and 99.3% f1-score [12] applied randomized decision tree ensemble, accuracy, precision, sensitivity, and f1-score were 93%, 96%, 91%, and 93%, respectively [15] applied KNN and Naïve Bayes on Cleveland and Stat log datasets, and KNN had the best performance with an accuracy of 88%. In the proposed framework, the tuned random forest achieved 100% accuracy, precision, sensitivity, specificity, f1-score, ROC, MCC, and 0 in Log_Loss. Moreover, Table 10 shows that [9,13,16] and the proposed framework used the Framingham dataset. In [9], the decision tree achieved an accuracy of 85% in RapidMiner. In [13], the random forest was the best model because it achieved 96.71%, 98.94%, 94.4%, 99%, 96.61%, and 100% for accuracy, precision, sensitivity, specificity, f1-score, and AUC, respectively. In [16], logistic regression, artificial neural organization, KNN, Naïve Bayes, and random forest are implemented; the random forest had the best performance with 99.49%, 99%, 100%, and 100% for accuracy, precision, sensitivity, and f1-score respectively. In the proposed framework, the tuned random forest achieved 96.36% in accuracy, 100% in precision, 75% in sensitivity, 85.71% in specificity, 100% in f1-score, and 87.50% in ROC, 85% in MCC, and it achieved 1.26 in Log_Loss. Therefore, in our proposed framework, the tuned random forest achieves the best performance in comparison with the state -of -art in this field.
This paper proposed a robust and tuned random forest classifier using the randomized grid search algorithm. The proposed framework increases the ability of CAD predictions by tracking down risk pointers and learning the confusing joint efforts between them. First, we used Cleveland and Framingham datasets and pre-processed them using data mining techniques, such as cleaning, normalization, and outlier detection techniques. Second, the PCA algorithm was utilized to lessen the feature dimensionality of the two datasets. Finally, a random forest machine learning model was tuned using a hyperparameter tuning technique, namely a randomized grid search, to select the best parameters for the ideal CAD analysis. The proposed framework was evaluated and compared with conventional classifiers. The accuracy, specificity, sensitivity, ROC value, and f1-score of the tuned random forest classifier are 100%, and the log loss is 0 using the Cleveland dataset.
Moreover, using Framingham, it achieved 96.36% in accuracy, 100% in precision, 75% in sensitivity, 85.7% in specificity, 100% in f1-score, and 87.50% in ROC, 85% in MCC, and it achieved 1.26 in Log_Loss. The measures of the tuned random forest classifier are higher than the recent existing classifiers. The prediction time is a limitation of our proposed framework. Therefore, our future work is to improve the prediction time of the proposed framework by utilizing more optimization and feature selection approaches. Moreover, we will use different datasets of images to identify heart disease.
Funding Statement: The authors received no specific funding for this study.
Conflicts of Interest: The authors declare that they have no conflicts of interest to report regarding the present study.
References
1. E. J. Benjamin, P. Muntner, A. Alonso, M. S. Bittencourt, W. C. Callaway et al., “Heart disease and stroke statistics—2019 update: A report from the american heart association,” Circulation, vol. 139, no. 10, pp. e56–e528, 2019. [Google Scholar] [PubMed]
2. K. Polat, S. Özşen and S. Güneş, “Automatic detection of heart disease using an artificial immune recognition system (AIRS) with fuzzy resource allocation mechanism and k-nn (nearest neighbour) based weighting pre-processing,” Expert Systems and Application, vol. 32, no. 2, pp. 625–631, 2007. [Google Scholar]
3. R. Das, I. Turkoglu and A. Sengur, “Effective diagnosis of heart disease through neural networks ensembles,” Expert Systems and Application, vol. 36, no. 4, pp. 7675–7680, 2009. [Google Scholar]
4. R. O. Bonow, D. L. Mann, D. P. Zipes and P. Libby, “Braunwald’s heart disease: A textbook of cardiovascular medicine,” in Heart Disease, 11th edition, vol. 2. Amsterdam, Netherlands: Elsevier, pp. 1–1930, 2011. [Google Scholar]
5. K. Vanisree and J. Singaraju, “Decision support system for congenital heart disease diagnosis based on signs and symptoms using neural networks,” International Journal of Computer Applications, vol. 19, no. 6, pp. pp: 1–8, 2011. [Google Scholar]
6. M. Adar, W. Książek, R. Acharya, R. S. Tan, V. Makarenkov et al., “A new machine learning technique for an accurate diagnosis of coronary artery disease,” Computer Methods and Programs in Biomedicine, vol. 179, no. 13, pp. 104992, 2019. [Google Scholar]
7. C. Krittanawong, H. U. H. Virk, A. Kumar, M. Aydar, Z. Wang et al., “Machine learning and deep learning to predict mortality in patients with spontaneous coronary artery dissection,” Scientific reports, vol. 11, no. 1, pp. 1–10, 2021. [Google Scholar]
8. I. D. Mienye and Y. Sun, “Improved heart disease prediction using particle swarm optimization based stacked sparse autoencoder,” Electronics, vol. 10, no. 19, pp. 2347, 2021. [Google Scholar]
9. J. J. Beunza, E. Puertas, E. G. Ovejero, G. Villalba, E. Condes et al., “Comparison of machine learning algorithms for clinical event prediction (risk of coronary heart disease),” Journal of Biomedical Informatics, vol. 97, pp. 103257, 2019. [Google Scholar] [PubMed]
10. M. JayaSree and L. K. Rao, “Survey on - identification of coronary artery disease using deep learning,” Materials Today: Proceedings, no. 2214–7853, pp. 1–5, 2020. [Google Scholar]
11. G. E. Anna, H. Amir and A. Emmanuel, “Classification models for heart disease prediction using feature selection and PCA,” Informatics in Medicine Unlocked, vol. 19, no. 3, pp. 100330, 2020. [Google Scholar]
12. M. Domor, S. Yanxia and W. Zenghui, “An improved ensemble learning approach for the prediction of heart disease risk,” Informatics in Medicine Unlocked, vol. 20, no. 8, pp. 100402, 2020. [Google Scholar]
13. D. Krishnani, A. Kumari, A. Dewangan, A. Singh and N. S. Naik, “Prediction of coronary heart disease using supervised machine learning algorithms,” in Proc. 2019 IEEE Region 10 Conf. (TENCON), Kochi, India, pp. 367–372, 2019. [Google Scholar]
14. A. H. Shahid, M. P. Singh, B. Roy and A. Aadarsh, “Coronary artery disease diagnosis using feature selection based hybrid extreme learning machine,” in Proc. the 3rd Int. Conf. on Information and Computer Technologies (ICICT), San Jose, CA, USA, pp. 341–346, 2020. [Google Scholar]
15. M. S. Maashi, “Analysis heart disease using machine learning,” Multi-Knowledge Electronic Comprehensive Journal for Education and Science Publications (MECSJ), vol. 29, pp. 1–15, 2020. [Google Scholar]
16. A. Baidya, “Comparative analysis of multiple classifiers for heart disease classification,” International Journal of Advanced Research in Computer Science, vol. 11, no. 3, pp. 1–6, 2020. [Google Scholar]
17. J. Ahamed, A. M. Koli, K. Ahmad, M. A. Jamal and B. B. Gupta, “CDPS-IoT: cardiovascular disease prediction system based on IoT using machine learning,” International Journal of Interactive Multimedia and Artificial Intelligence, vol. 7, no. 4, pp. 1–9, 2021. [Google Scholar]
18. P. N. Tan, M. Steinbach, A. Karpatne and V. Kumar, “Introduction to data mining,” in Computers, 2nd edition, London, UK: Pearson, pp. 1–864, 2018. [Google Scholar]
19. M. Z. Naser and A. H. Alavi, “Insights into performance fitness and error metrics for machine learning,” CoRR, vol. abs/2006.00887, pp. 1–18, 2020. [Google Scholar]
20. M. Hossin and M. N. Sulaiman, “A review on evaluation metrics for data classification evaluations,” International Journal of Data Mining Knowledge Management Process, vol. 5, no. 2, pp. 1–11, 2015. [Google Scholar]
Cite This Article
 Copyright © 2023 The Author(s). Published by Tech Science Press.
This work is licensed under a Creative Commons Attribution 4.0 International License , which permits unrestricted use, distribution, and reproduction in any medium, provided the original work is properly cited.
 Downloads
 Citation Tools